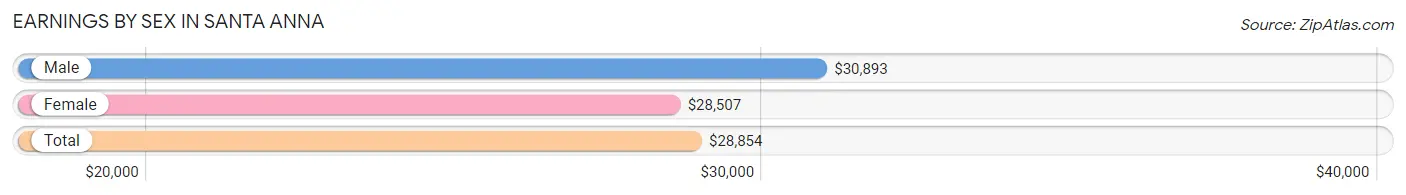
Average Earnings in Santa Anna are $28,854, $30,893 for men and $28,507 for women, a difference of 7.7%.
Sex
Number
Average Earnings
Male
0 (0.0%)
$30,893
Female
3 (100.0%)
$28,507
Total
3 (100.0%)
$28,854
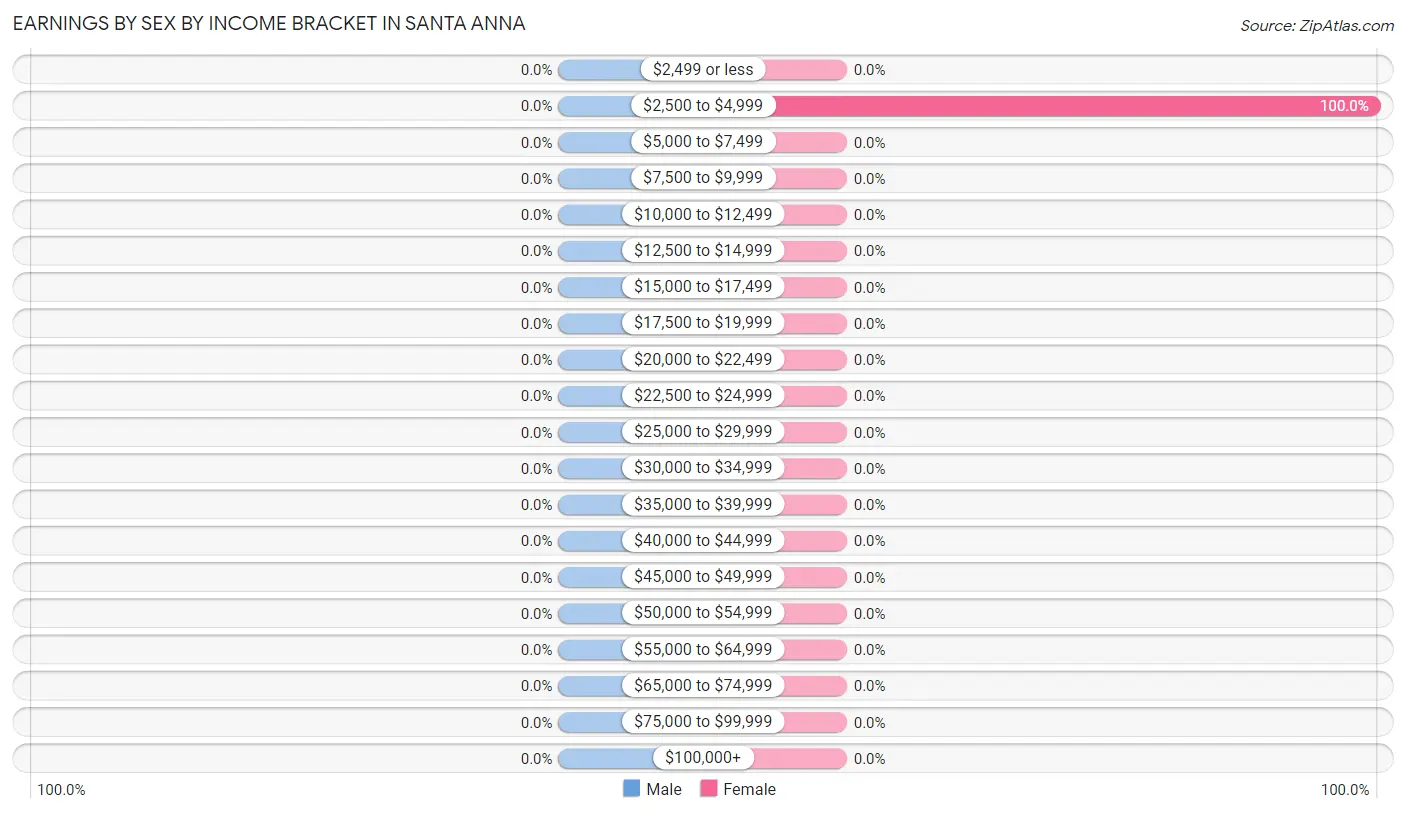
Earnings by Sex by Income Bracket in Santa Anna
Income
Male
Female
$2,499 or less
0 (0.0%)
0 (0.0%)
$2,500 to $4,999
0 (0.0%)
3 (100.0%)
$5,000 to $7,499
0 (0.0%)
0 (0.0%)
$7,500 to $9,999
0 (0.0%)
0 (0.0%)
$10,000 to $12,499
0 (0.0%)
0 (0.0%)
$12,500 to $14,999
0 (0.0%)
0 (0.0%)
$15,000 to $17,499
0 (0.0%)
0 (0.0%)
$17,500 to $19,999
0 (0.0%)
0 (0.0%)
$20,000 to $22,499
0 (0.0%)
0 (0.0%)
$22,500 to $24,999
0 (0.0%)
0 (0.0%)
$25,000 to $29,999
0 (0.0%)
0 (0.0%)
$30,000 to $34,999
0 (0.0%)
0 (0.0%)
$35,000 to $39,999
0 (0.0%)
0 (0.0%)
$40,000 to $44,999
0 (0.0%)
0 (0.0%)
$45,000 to $49,999
0 (0.0%)
0 (0.0%)
$50,000 to $54,999
0 (0.0%)
0 (0.0%)
$55,000 to $64,999
0 (0.0%)
0 (0.0%)
$65,000 to $74,999
0 (0.0%)
0 (0.0%)
$75,000 to $99,999
0 (0.0%)
0 (0.0%)
$100,000+
0 (0.0%)
0 (0.0%)
Total
0 (0.0%)
3 (100.0%)
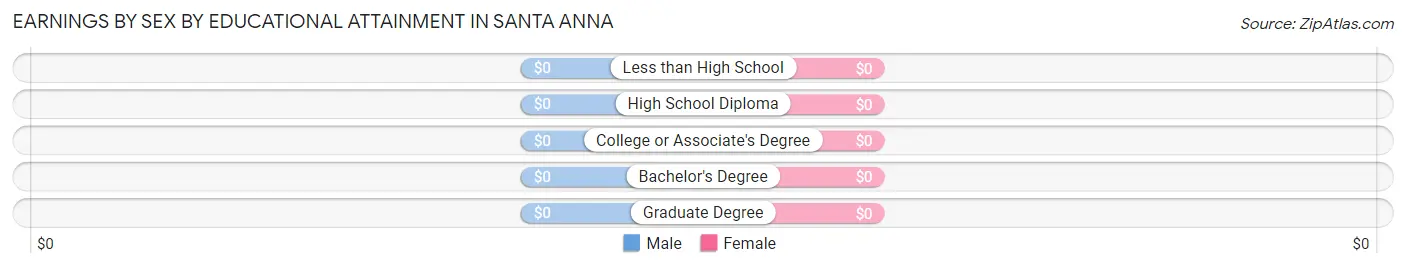
Earnings by Sex by Educational Attainment in Santa Anna
Educational Attainment
Male Income
Female Income
Less than High School
-
-
High School Diploma
-
-
College or Associate's Degree
-
-
Bachelor's Degree
-
-
Graduate Degree
-
-
Total
-
-
Family Income in Santa Anna
Family Income Brackets in Santa Anna
Income Bracket
# Families
% Families
Less than $10,000
0
0.0%
$10,000 to $14,999
0
0.0%
$15,000 to $24,999
0
0.0%
$25,000 to $34,999
0
0.0%
$35,000 to $49,999
0
0.0%
$50,000 to $74,999
0
0.0%
$75,000 to $99,999
0
0.0%
$100,000 to $149,999
0
0.0%
$150,000 to $199,999
0
0.0%
$200,000+
0
0.0%
Family Income by Famaliy Size in Santa Anna
Income Bracket
# Families
Median Income
2-Person Families
0 (0.0%)
$0
3-Person Families
0 (0.0%)
$0
4-Person Families
0 (0.0%)
$0
5-Person Families
0 (0.0%)
$0
6-Person Families
0 (0.0%)
$0
7+ Person Families
0 (0.0%)
$0
Total
0 (0.0%)
$0
Family Income by Number of Earners in Santa Anna
Number of Earners
# Families
Median Income
No Earners
0 (0.0%)
$0
1 Earner
0 (0.0%)
$0
2 Earners
0 (0.0%)
$0
3+ Earners
0 (0.0%)
$0
Total
0 (0.0%)
$0
Household Income in Santa Anna
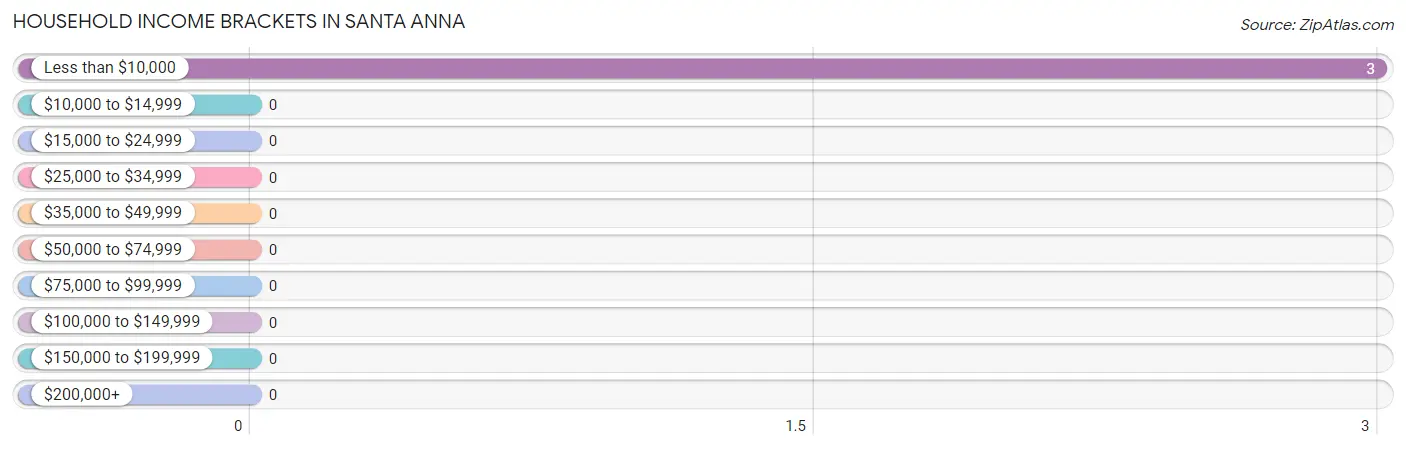
Household Income Brackets in Santa Anna
With 3 households falling in the category, the less than $10,000 income range is the most frequent in Santa Anna, accounting for 100.0% of all households.
Income Bracket
# Households
% Households
Less than $10,000
3
100.0%
$10,000 to $14,999
0
0.0%
$15,000 to $24,999
0
0.0%
$25,000 to $34,999
0
0.0%
$35,000 to $49,999
0
0.0%
$50,000 to $74,999
0
0.0%
$75,000 to $99,999
0
0.0%
$100,000 to $149,999
0
0.0%
$150,000 to $199,999
0
0.0%
$200,000+
0
0.0%
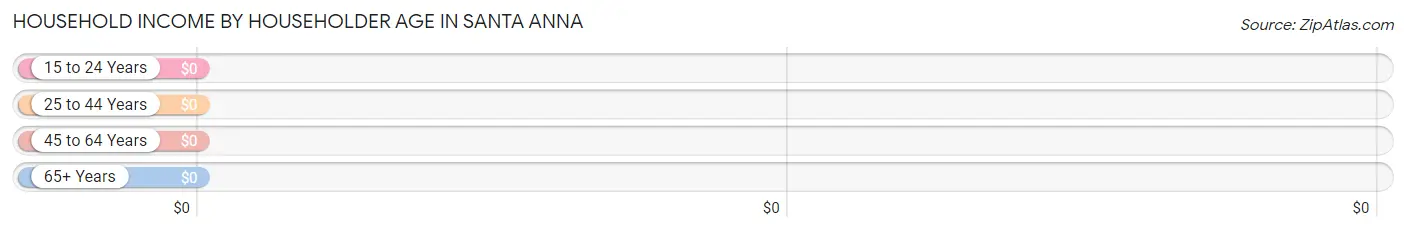
Household Income by Householder Age in Santa Anna
Income Bracket
# Households
Median Income
15 to 24 Years
0 (0.0%)
$0
25 to 44 Years
0 (0.0%)
$0
45 to 64 Years
3 (100.0%)
$0
65+ Years
0 (0.0%)
$0
Total
3 (100.0%)
$0
Poverty in Santa Anna
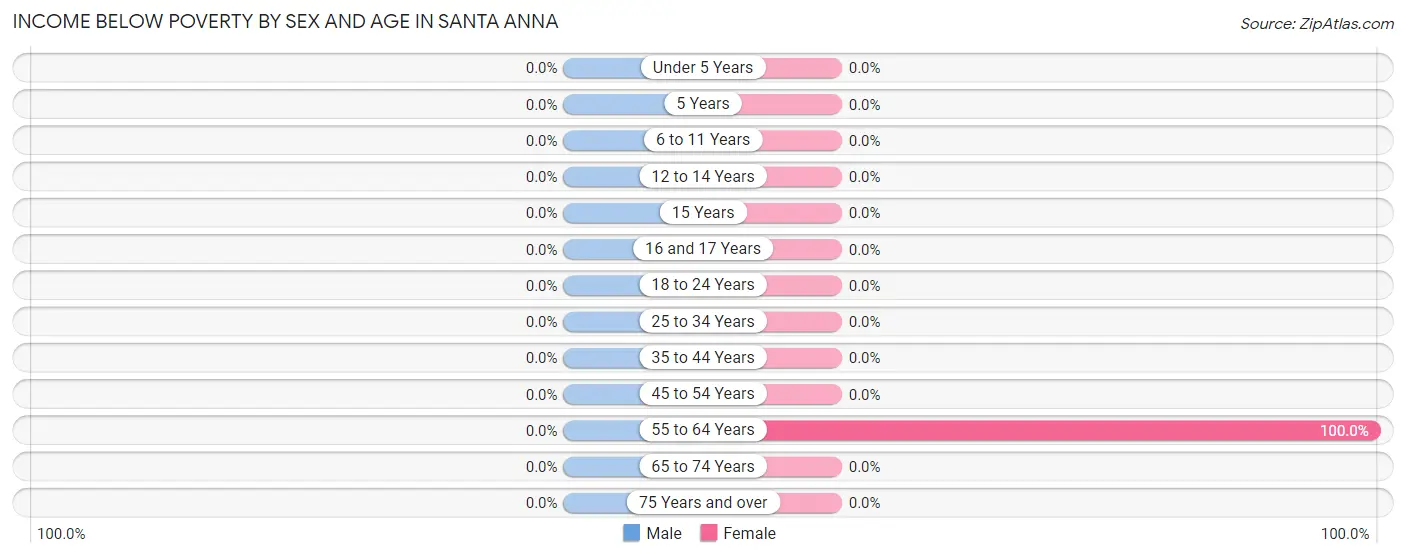
Income Below Poverty by Sex and Age in Santa Anna
Age Bracket
Male
Female
Under 5 Years
0 (0.0%)
0 (0.0%)
5 Years
0 (0.0%)
0 (0.0%)
6 to 11 Years
0 (0.0%)
0 (0.0%)
12 to 14 Years
0 (0.0%)
0 (0.0%)
15 Years
0 (0.0%)
0 (0.0%)
16 and 17 Years
0 (0.0%)
0 (0.0%)
18 to 24 Years
0 (0.0%)
0 (0.0%)
25 to 34 Years
0 (0.0%)
0 (0.0%)
35 to 44 Years
0 (0.0%)
0 (0.0%)
45 to 54 Years
0 (0.0%)
0 (0.0%)
55 to 64 Years
0 (0.0%)
3 (100.0%)
65 to 74 Years
0 (0.0%)
0 (0.0%)
75 Years and over
0 (0.0%)
0 (0.0%)
Total
0 (0.0%)
3 (100.0%)
Income Above Poverty by Sex and Age in Santa Anna
Age Bracket
Male
Female
Under 5 Years
0 (0.0%)
0 (0.0%)
5 Years
0 (0.0%)
0 (0.0%)
6 to 11 Years
0 (0.0%)
0 (0.0%)
12 to 14 Years
0 (0.0%)
0 (0.0%)
15 Years
0 (0.0%)
0 (0.0%)
16 and 17 Years
0 (0.0%)
0 (0.0%)
18 to 24 Years
0 (0.0%)
0 (0.0%)
25 to 34 Years
0 (0.0%)
0 (0.0%)
35 to 44 Years
0 (0.0%)
0 (0.0%)
45 to 54 Years
0 (0.0%)
0 (0.0%)
55 to 64 Years
0 (0.0%)
0 (0.0%)
65 to 74 Years
0 (0.0%)
0 (0.0%)
75 Years and over
0 (0.0%)
0 (0.0%)
Total
0 (0.0%)
0 (0.0%)
Income Below Poverty Among Married-Couple Families in Santa Anna
Children
Above Poverty
Below Poverty
No Children
0 (0.0%)
0 (0.0%)
1 or 2 Children
0 (0.0%)
0 (0.0%)
3 or 4 Children
0 (0.0%)
0 (0.0%)
5 or more Children
0 (0.0%)
0 (0.0%)
Total
0 (0.0%)
0 (0.0%)
Income Below Poverty Among Single-Parent Households in Santa Anna
Children
Single Father
Single Mother
No Children
0 (0.0%)
0 (0.0%)
1 or 2 Children
0 (0.0%)
0 (0.0%)
3 or 4 Children
0 (0.0%)
0 (0.0%)
5 or more Children
0 (0.0%)
0 (0.0%)
Total
0 (0.0%)
0 (0.0%)
Income Below Poverty Among Married-Couple vs Single-Parent Households in Santa Anna
Children
Married-Couple Families
Single-Parent Households
No Children
0 (0.0%)
0 (0.0%)
1 or 2 Children
0 (0.0%)
0 (0.0%)
3 or 4 Children
0 (0.0%)
0 (0.0%)
5 or more Children
0 (0.0%)
0 (0.0%)
Total
0 (0.0%)
0 (0.0%)
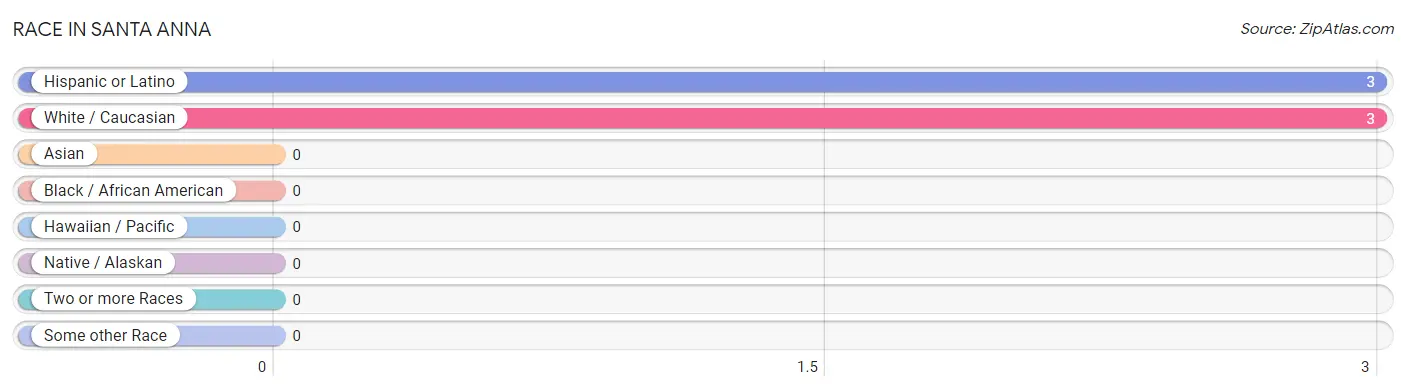
Race in Santa Anna
The most populous races in Santa Anna are Hispanic or Latino (3 | 100.0%), and White / Caucasian (3 | 100.0%).
Race
# Population
% Population
Asian
0
0.0%
Black / African American
0
0.0%
Hawaiian / Pacific
0
0.0%
Hispanic or Latino
3
100.0%
Native / Alaskan
0
0.0%
White / Caucasian
3
100.0%
Two or more Races
0
0.0%
Some other Race
0
0.0%
Total
3
100.0%
Ancestry in Santa Anna
The most populous ancestries reported in Santa Anna are , and Mexican (3 | 100.0%), together accounting for 100.0% of all Santa Anna residents.
Ancestry
# Population
% Population
Mexican
3
100.0%
View All 1 Rows
Immigrants in Santa Anna
Immigration Origin
# Population
% Population
View All 0 Rows
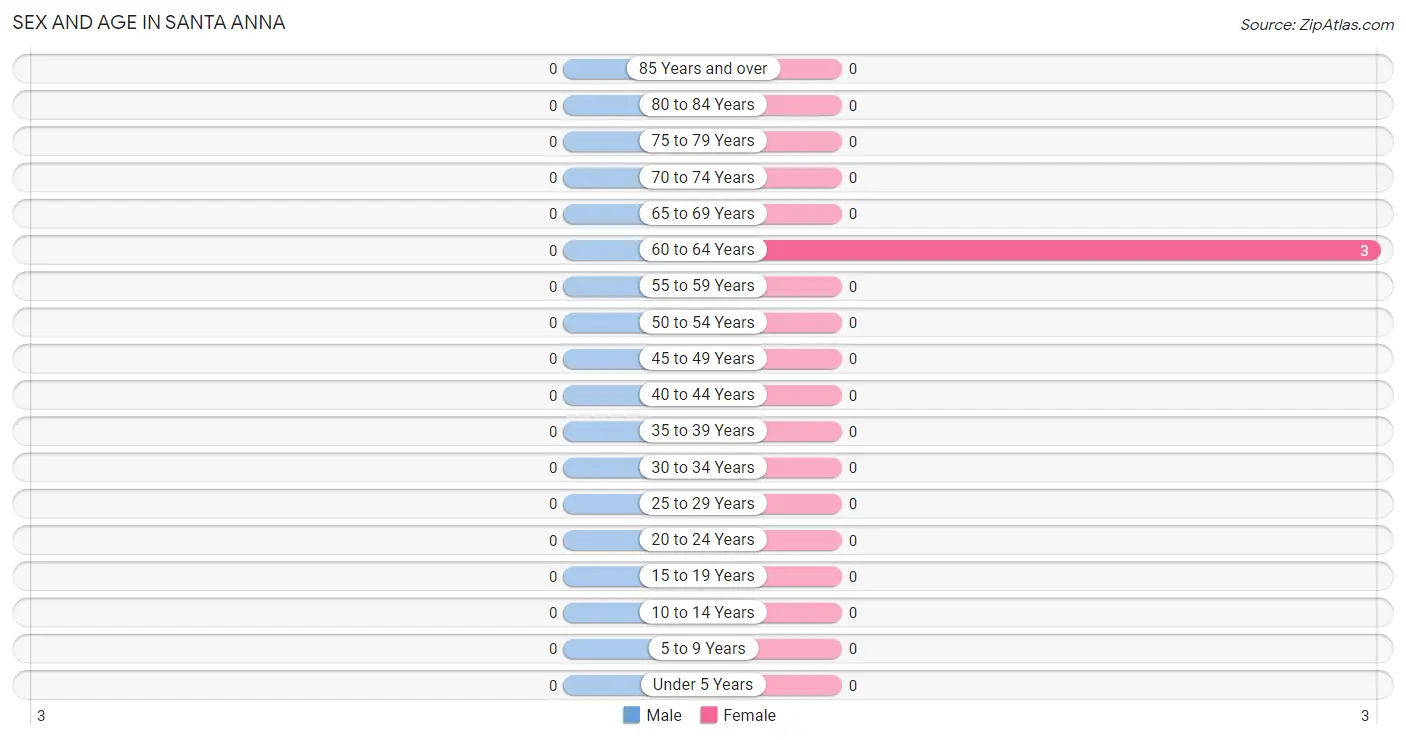
Sex and Age in Santa Anna
Sex and Age in Santa Anna
Age Bracket
Male
Female
Under 5 Years
0 (0.0%)
0 (0.0%)
5 to 9 Years
0 (0.0%)
0 (0.0%)
10 to 14 Years
0 (0.0%)
0 (0.0%)
15 to 19 Years
0 (0.0%)
0 (0.0%)
20 to 24 Years
0 (0.0%)
0 (0.0%)
25 to 29 Years
0 (0.0%)
0 (0.0%)
30 to 34 Years
0 (0.0%)
0 (0.0%)
35 to 39 Years
0 (0.0%)
0 (0.0%)
40 to 44 Years
0 (0.0%)
0 (0.0%)
45 to 49 Years
0 (0.0%)
0 (0.0%)
50 to 54 Years
0 (0.0%)
0 (0.0%)
55 to 59 Years
0 (0.0%)
0 (0.0%)
60 to 64 Years
0 (0.0%)
3 (100.0%)
65 to 69 Years
0 (0.0%)
0 (0.0%)
70 to 74 Years
0 (0.0%)
0 (0.0%)
75 to 79 Years
0 (0.0%)
0 (0.0%)
80 to 84 Years
0 (0.0%)
0 (0.0%)
85 Years and over
0 (0.0%)
0 (0.0%)
Total
0 (0.0%)
3 (100.0%)
Families and Households in Santa Anna
Median Family Size in Santa Anna
Family Type
# Families
Family Size
Married-Couple
0 (0.0%)
-
Single Male/Father
0 (0.0%)
-
Single Female/Mother
0 (0.0%)
-
Total Families
0 (0.0%)
-
Median Household Size in Santa Anna
Household Type
# Households
Household Size
Married-Couple
0 (0.0%)
-
Single Male/Father
0 (0.0%)
-
Single Female/Mother
0 (0.0%)
-
Non-family
3 (100.0%)
-
Total Households
3 (100.0%)
-
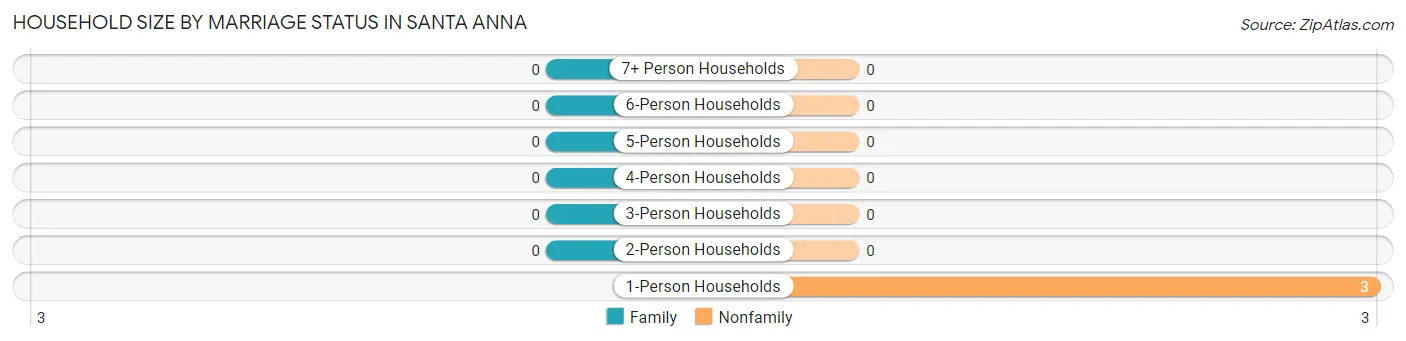
Household Size by Marriage Status in Santa Anna
Household Size
Family Households
Nonfamily Households
1-Person Households
-
3 (100.0%)
2-Person Households
0 (0.0%)
0 (0.0%)
3-Person Households
0 (0.0%)
0 (0.0%)
4-Person Households
0 (0.0%)
0 (0.0%)
5-Person Households
0 (0.0%)
0 (0.0%)
6-Person Households
0 (0.0%)
0 (0.0%)
7+ Person Households
0 (0.0%)
0 (0.0%)
Total
0 (0.0%)
3 (100.0%)
Female Fertility in Santa Anna
Fertility by Age in Santa Anna
Age Bracket
Women with Births
Births / 1,000 Women
15 to 19 years
0 (0.0%)
0.0
20 to 34 years
0 (0.0%)
0.0
35 to 50 years
0 (0.0%)
0.0
Total
0 (0.0%)
0.0
Fertility by Age by Marriage Status in Santa Anna
Age Bracket
Married
Unmarried
15 to 19 years
0 (0.0%)
0 (0.0%)
20 to 34 years
0 (0.0%)
0 (0.0%)
35 to 50 years
0 (0.0%)
0 (0.0%)
Total
0 (0.0%)
0 (0.0%)
Fertility by Education in Santa Anna
Educational Attainment
Women with Births
Births / 1,000 Women
Less than High School
0 (0.0%)
0.0
High School Diploma
0 (0.0%)
0.0
College or Associate's Degree
0 (0.0%)
0.0
Bachelor's Degree
0 (0.0%)
0.0
Graduate Degree
0 (0.0%)
0.0
Total
0 (0.0%)
0.0
Fertility by Education by Marriage Status in Santa Anna
Educational Attainment
Married
Unmarried
Less than High School
0 (0.0%)
0 (0.0%)
High School Diploma
0 (0.0%)
0 (0.0%)
College or Associate's Degree
0 (0.0%)
0 (0.0%)
Bachelor's Degree
0 (0.0%)
0 (0.0%)
Graduate Degree
0 (0.0%)
0 (0.0%)
Total
0 (0.0%)
0 (0.0%)
Employment Characteristics in Santa Anna
Employment by Class of Employer in Santa Anna
Employer Class
# Employees
% Employees
Private Company Employees
0
0.0%
Self-Employed (Incorporated)
0
0.0%
Self-Employed (Not Incorporated)
0
0.0%
Not-for-profit Organizations
0
0.0%
Local Government Employees
0
0.0%
State Government Employees
0
0.0%
Federal Government Employees
0
0.0%
Unpaid Family Workers
0
0.0%
Total
0
0.0%
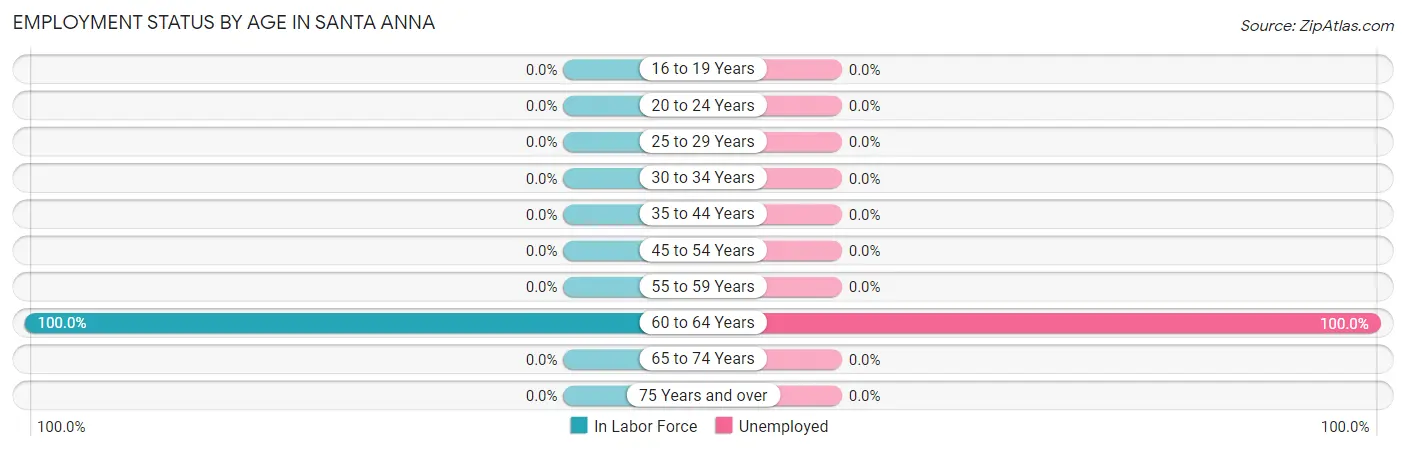
Employment Status by Age in Santa Anna
According to the labor force statistics for Santa Anna, out of the total population over 16 years of age (3), 100.0% or 3 individuals are in the labor force, with 100.0% or 3 of them unemployed. The age group with the highest labor force participation rate is 60 to 64 years, with 100.0% or 3 individuals in the labor force. Within the labor force, the 60 to 64 years age range has the highest percentage of unemployed individuals, with 100.0% or 3 of them being unemployed.
Age Bracket
In Labor Force
Unemployed
16 to 19 Years
0 (0.0%)
0 (0.0%)
20 to 24 Years
0 (0.0%)
0 (0.0%)
25 to 29 Years
0 (0.0%)
0 (0.0%)
30 to 34 Years
0 (0.0%)
0 (0.0%)
35 to 44 Years
0 (0.0%)
0 (0.0%)
45 to 54 Years
0 (0.0%)
0 (0.0%)
55 to 59 Years
0 (0.0%)
0 (0.0%)
60 to 64 Years
3 (100.0%)
3 (100.0%)
65 to 74 Years
0 (0.0%)
0 (0.0%)
75 Years and over
0 (0.0%)
0 (0.0%)
Total
3 (100.0%)
3 (100.0%)
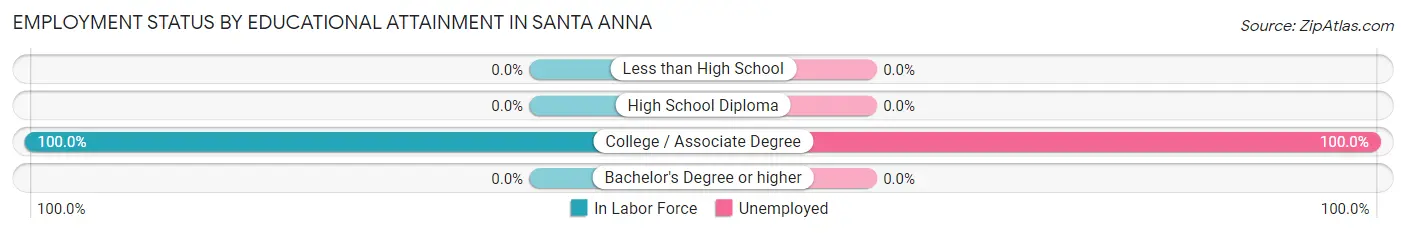
Employment Status by Educational Attainment in Santa Anna
According to labor force statistics for Santa Anna, 100.0% of individuals (3) out of the total population between 25 and 64 years of age (3) are in the labor force, with 100.0% or 3 of them being unemployed. The group with the highest labor force participation rate are those with the educational attainment of college / associate degree, with 100.0% or 3 individuals in the labor force. Within the labor force, individuals with college / associate degree education have the highest percentage of unemployment, with 100.0% or 3 of them being unemployed.
Educational Attainment
In Labor Force
Unemployed
Less than High School
0 (0.0%)
0 (0.0%)
High School Diploma
0 (0.0%)
0 (0.0%)
College / Associate Degree
3 (100.0%)
3 (100.0%)
Bachelor's Degree or higher
0 (0.0%)
0 (0.0%)
Total
3 (100.0%)
3 (100.0%)
Employment Occupations by Sex in Santa Anna
Management, Business, Science and Arts Occupations
Management, Business, Science and Arts Occupations by Sex
Occupation
Male
Female
Management
0 (0.0%)
0 (0.0%)
Business & Financial
0 (0.0%)
0 (0.0%)
Computers, Engineering & Science
0 (0.0%)
0 (0.0%)
Computers & Mathematics
0 (0.0%)
0 (0.0%)
Architecture & Engineering
0 (0.0%)
0 (0.0%)
Life, Physical & Social Science
0 (0.0%)
0 (0.0%)
Community & Social Service
0 (0.0%)
0 (0.0%)
Education, Arts & Media
0 (0.0%)
0 (0.0%)
Legal Services & Support
0 (0.0%)
0 (0.0%)
Education Instruction & Library
0 (0.0%)
0 (0.0%)
Arts, Media & Entertainment
0 (0.0%)
0 (0.0%)
Health Diagnosing & Treating
0 (0.0%)
0 (0.0%)
Health Technologists
0 (0.0%)
0 (0.0%)
Total (Category)
0 (0.0%)
0 (0.0%)
Total (Overall)
0 (0.0%)
0 (0.0%)
Services Occupations
Services Occupations by Sex
Occupation
Male
Female
Healthcare Support
0 (0.0%)
0 (0.0%)
Security & Protection
0 (0.0%)
0 (0.0%)
Firefighting & Prevention
0 (0.0%)
0 (0.0%)
Law Enforcement
0 (0.0%)
0 (0.0%)
Food Preparation & Serving
0 (0.0%)
0 (0.0%)
Cleaning & Maintenance
0 (0.0%)
0 (0.0%)
Personal Care & Service
0 (0.0%)
0 (0.0%)
Total (Category)
0 (0.0%)
0 (0.0%)
Total (Overall)
0 (0.0%)
0 (0.0%)
Sales and Office Occupations
Sales and Office Occupations by Sex
Occupation
Male
Female
Sales & Related
0 (0.0%)
0 (0.0%)
Office & Administration
0 (0.0%)
0 (0.0%)
Total (Category)
0 (0.0%)
0 (0.0%)
Total (Overall)
0 (0.0%)
0 (0.0%)
Natural Resources, Construction and Maintenance Occupations
Natural Resources, Construction and Maintenance Occupations by Sex
Occupation
Male
Female
Farming, Fishing & Forestry
0 (0.0%)
0 (0.0%)
Construction & Extraction
0 (0.0%)
0 (0.0%)
Installation, Maintenance & Repair
0 (0.0%)
0 (0.0%)
Total (Category)
0 (0.0%)
0 (0.0%)
Total (Overall)
0 (0.0%)
0 (0.0%)
Production, Transportation and Moving Occupations
Production, Transportation and Moving Occupations by Sex
Occupation
Male
Female
Production
0 (0.0%)
0 (0.0%)
Transportation
0 (0.0%)
0 (0.0%)
Material Moving
0 (0.0%)
0 (0.0%)
Total (Category)
0 (0.0%)
0 (0.0%)
Total (Overall)
0 (0.0%)
0 (0.0%)
Employment Industries by Sex in Santa Anna
Employment Industries in Santa Anna
Employment Industries by Sex in Santa Anna
Industry
Male
Female
Agriculture, Fishing & Hunting
0 (0.0%)
0 (0.0%)
Mining, Quarrying, & Extraction
0 (0.0%)
0 (0.0%)
Construction
0 (0.0%)
0 (0.0%)
Manufacturing
0 (0.0%)
0 (0.0%)
Wholesale Trade
0 (0.0%)
0 (0.0%)
Retail Trade
0 (0.0%)
0 (0.0%)
Transportation & Warehousing
0 (0.0%)
0 (0.0%)
Utilities
0 (0.0%)
0 (0.0%)
Information
0 (0.0%)
0 (0.0%)
Finance & Insurance
0 (0.0%)
0 (0.0%)
Real Estate, Rental & Leasing
0 (0.0%)
0 (0.0%)
Professional & Scientific
0 (0.0%)
0 (0.0%)
Enterprise Management
0 (0.0%)
0 (0.0%)
Administrative & Support
0 (0.0%)
0 (0.0%)
Educational Services
0 (0.0%)
0 (0.0%)
Health Care & Social Assistance
0 (0.0%)
0 (0.0%)
Arts, Entertainment & Recreation
0 (0.0%)
0 (0.0%)
Accommodation & Food Services
0 (0.0%)
0 (0.0%)
Public Administration
0 (0.0%)
0 (0.0%)
Total
0 (0.0%)
0 (0.0%)
Education in Santa Anna
School Enrollment in Santa Anna
School Level
# Students
% Students
Nursery / Preschool
0
0.0%
Kindergarten
0
0.0%
Elementary School
0
0.0%
Middle School
0
0.0%
High School
0
0.0%
College / Undergraduate
0
0.0%
Graduate / Professional
0
0.0%
Total
0
0.0%
School Enrollment by Age by Funding Source in Santa Anna
Age Bracket
Public School
Private School
3 to 4 Year Olds
0 (0.0%)
0 (0.0%)
5 to 9 Year Old
0 (0.0%)
0 (0.0%)
10 to 14 Year Olds
0 (0.0%)
0 (0.0%)
15 to 17 Year Olds
0 (0.0%)
0 (0.0%)
18 to 19 Year Olds
0 (0.0%)
0 (0.0%)
20 to 24 Year Olds
0 (0.0%)
0 (0.0%)
25 to 34 Year Olds
0 (0.0%)
0 (0.0%)
35 Years and over
0 (0.0%)
0 (0.0%)
Total
0 (0.0%)
0 (0.0%)
Educational Attainment by Field of Study in Santa Anna
Field of Study
# Graduates
% Graduates
Computers & Mathematics
0
0.0%
Bio, Nature & Agricultural
0
0.0%
Physical & Health Sciences
0
0.0%
Psychology
0
0.0%
Social Sciences
0
0.0%
Engineering
0
0.0%
Multidisciplinary Studies
0
0.0%
Science & Technology
0
0.0%
Business
0
0.0%
Education
0
0.0%
Literature & Languages
0
0.0%
Liberal Arts & History
0
0.0%
Visual & Performing Arts
0
0.0%
Communications
0
0.0%
Arts & Humanities
0
0.0%
Total
0
0.0%
Transportation & Commute in Santa Anna
Vehicle Availability by Sex in Santa Anna
Vehicles Available
Male
Female
No Vehicle
0 (0.0%)
0 (0.0%)
1 Vehicle
0 (0.0%)
0 (0.0%)
2 Vehicles
0 (0.0%)
0 (0.0%)
3 Vehicles
0 (0.0%)
0 (0.0%)
4 Vehicles
0 (0.0%)
0 (0.0%)
5 or more Vehicles
0 (0.0%)
0 (0.0%)
Total
0 (0.0%)
0 (0.0%)
Commute Time in Santa Anna
Commute Time
# Commuters
% Commuters
Less than 5 Minutes
0
0.0%
5 to 9 Minutes
0
0.0%
10 to 14 Minutes
0
0.0%
15 to 19 Minutes
0
0.0%
20 to 24 Minutes
0
0.0%
25 to 29 Minutes
0
0.0%
30 to 34 Minutes
0
0.0%
35 to 39 Minutes
0
0.0%
40 to 44 Minutes
0
0.0%
45 to 59 Minutes
0
0.0%
60 to 89 Minutes
0
0.0%
90 or more Minutes
0
0.0%
Commute Time by Sex in Santa Anna
Commute Time
Male
Female
Less than 5 Minutes
0 (0.0%)
0 (0.0%)
5 to 9 Minutes
0 (0.0%)
0 (0.0%)
10 to 14 Minutes
0 (0.0%)
0 (0.0%)
15 to 19 Minutes
0 (0.0%)
0 (0.0%)
20 to 24 Minutes
0 (0.0%)
0 (0.0%)
25 to 29 Minutes
0 (0.0%)
0 (0.0%)
30 to 34 Minutes
0 (0.0%)
0 (0.0%)
35 to 39 Minutes
0 (0.0%)
0 (0.0%)
40 to 44 Minutes
0 (0.0%)
0 (0.0%)
45 to 59 Minutes
0 (0.0%)
0 (0.0%)
60 to 89 Minutes
0 (0.0%)
0 (0.0%)
90 or more Minutes
0 (0.0%)
0 (0.0%)
Time of Departure to Work by Sex in Santa Anna
Time of Departure
Male
Female
12:00 AM to 4:59 AM
0 (0.0%)
0 (0.0%)
5:00 AM to 5:29 AM
0 (0.0%)
0 (0.0%)
5:30 AM to 5:59 AM
0 (0.0%)
0 (0.0%)
6:00 AM to 6:29 AM
0 (0.0%)
0 (0.0%)
6:30 AM to 6:59 AM
0 (0.0%)
0 (0.0%)
7:00 AM to 7:29 AM
0 (0.0%)
0 (0.0%)
7:30 AM to 7:59 AM
0 (0.0%)
0 (0.0%)
8:00 AM to 8:29 AM
0 (0.0%)
0 (0.0%)
8:30 AM to 8:59 AM
0 (0.0%)
0 (0.0%)
9:00 AM to 9:59 AM
0 (0.0%)
0 (0.0%)
10:00 AM to 10:59 AM
0 (0.0%)
0 (0.0%)
11:00 AM to 11:59 AM
0 (0.0%)
0 (0.0%)
12:00 PM to 3:59 PM
0 (0.0%)
0 (0.0%)
4:00 PM to 11:59 PM
0 (0.0%)
0 (0.0%)
Total
0 (0.0%)
0 (0.0%)
Housing Occupancy in Santa Anna
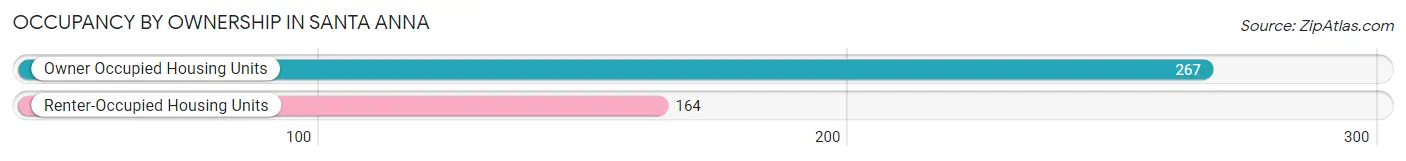
Occupancy by Ownership in Santa Anna
Of the total 431 dwellings in Santa Anna, owner-occupied units account for 267 (62.0%), while renter-occupied units make up 164 (38.1%).
Occupancy
# Housing Units
% Housing Units
Owner Occupied Housing Units
267
62.0%
Renter-Occupied Housing Units
164
38.1%
Total Occupied Housing Units
431
100.0%
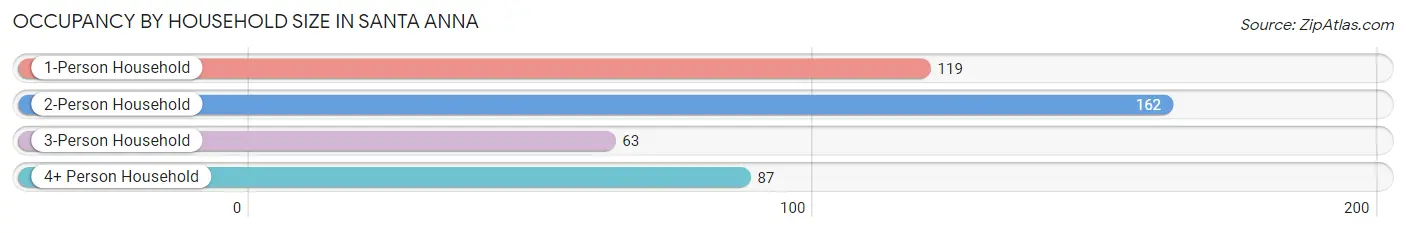
Occupancy by Household Size in Santa Anna
Household Size
# Housing Units
% Housing Units
1-Person Household
119
27.6%
2-Person Household
162
37.6%
3-Person Household
63
14.6%
4+ Person Household
87
20.2%
Total Housing Units
431
100.0%
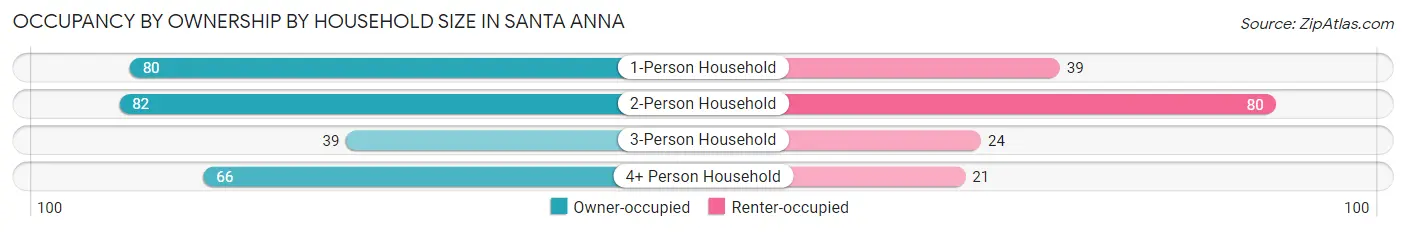
Occupancy by Ownership by Household Size in Santa Anna
Household Size
Owner-occupied
Renter-occupied
1-Person Household
80 (67.2%)
39 (32.8%)
2-Person Household
82 (50.6%)
80 (49.4%)
3-Person Household
39 (61.9%)
24 (38.1%)
4+ Person Household
66 (75.9%)
21 (24.1%)
Total Housing Units
267 (62.0%)
164 (38.1%)
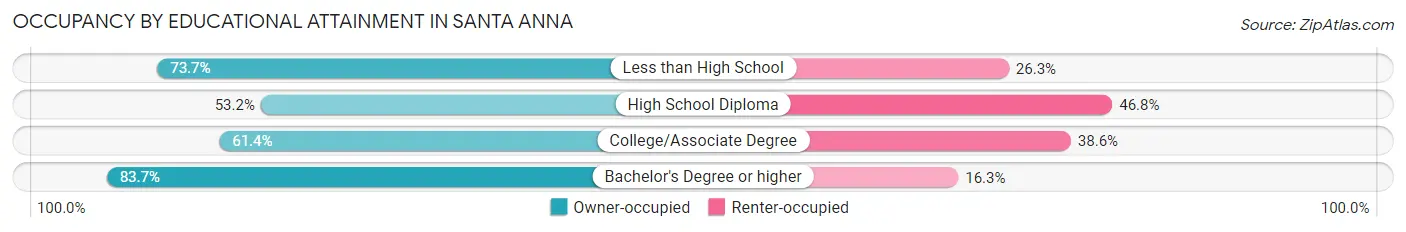
Occupancy by Educational Attainment in Santa Anna
Household Size
Owner-occupied
Renter-occupied
Less than High School
42 (73.7%)
15 (26.3%)
High School Diploma
92 (53.2%)
81 (46.8%)
College/Associate Degree
97 (61.4%)
61 (38.6%)
Bachelor's Degree or higher
36 (83.7%)
7 (16.3%)
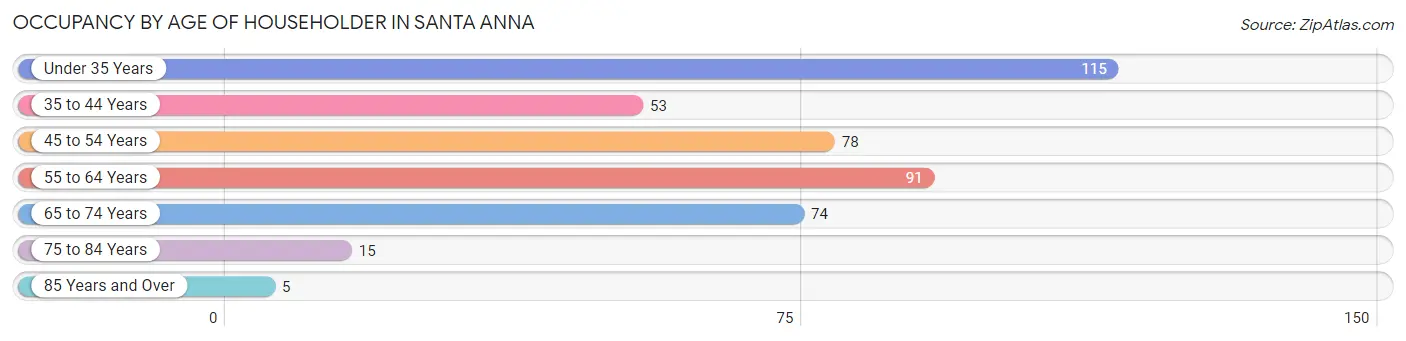
Occupancy by Age of Householder in Santa Anna
Age Bracket
# Households
% Households
Under 35 Years
115
26.7%
35 to 44 Years
53
12.3%
45 to 54 Years
78
18.1%
55 to 64 Years
91
21.1%
65 to 74 Years
74
17.2%
75 to 84 Years
15
3.5%
85 Years and Over
5
1.2%
Total
431
100.0%
Housing Finances in Santa Anna
Median Income by Occupancy in Santa Anna
Occupancy Type
# Households
Median Income
Owner-Occupied
3 (100.0%)
$0
Renter-Occupied
0 (0.0%)
$0
Average
3 (100.0%)
$0
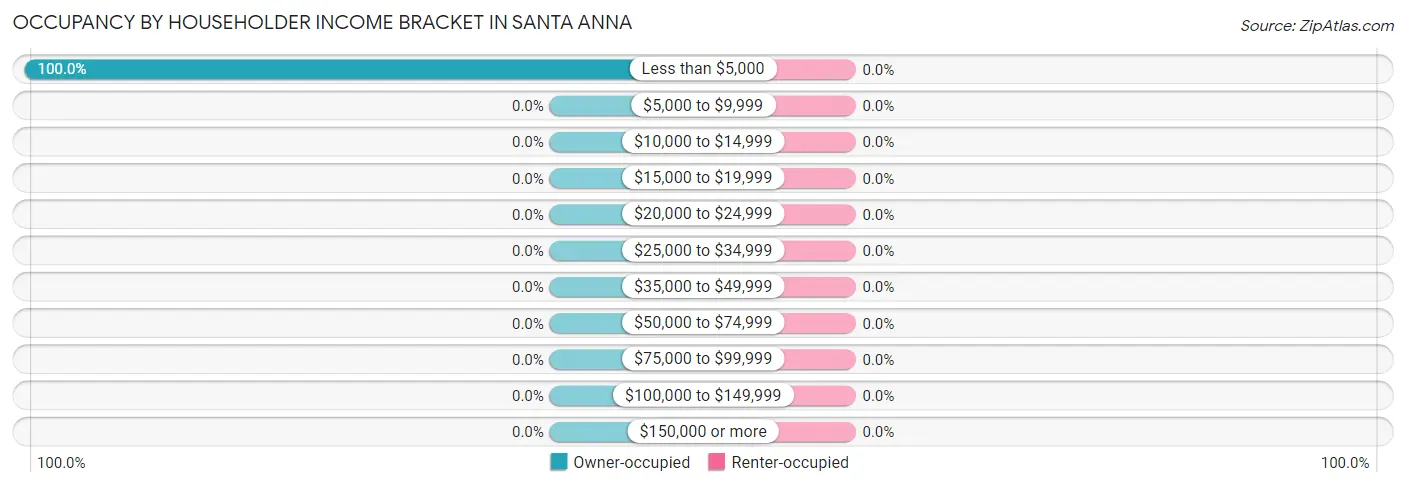
Occupancy by Householder Income Bracket in Santa Anna
Income Bracket
Owner-occupied
Renter-occupied
Less than $5,000
3 (100.0%)
0 (0.0%)
$5,000 to $9,999
0 (0.0%)
0 (0.0%)
$10,000 to $14,999
0 (0.0%)
0 (0.0%)
$15,000 to $19,999
0 (0.0%)
0 (0.0%)
$20,000 to $24,999
0 (0.0%)
0 (0.0%)
$25,000 to $34,999
0 (0.0%)
0 (0.0%)
$35,000 to $49,999
0 (0.0%)
0 (0.0%)
$50,000 to $74,999
0 (0.0%)
0 (0.0%)
$75,000 to $99,999
0 (0.0%)
0 (0.0%)
$100,000 to $149,999
0 (0.0%)
0 (0.0%)
$150,000 or more
0 (0.0%)
0 (0.0%)
Total
3 (100.0%)
0 (0.0%)
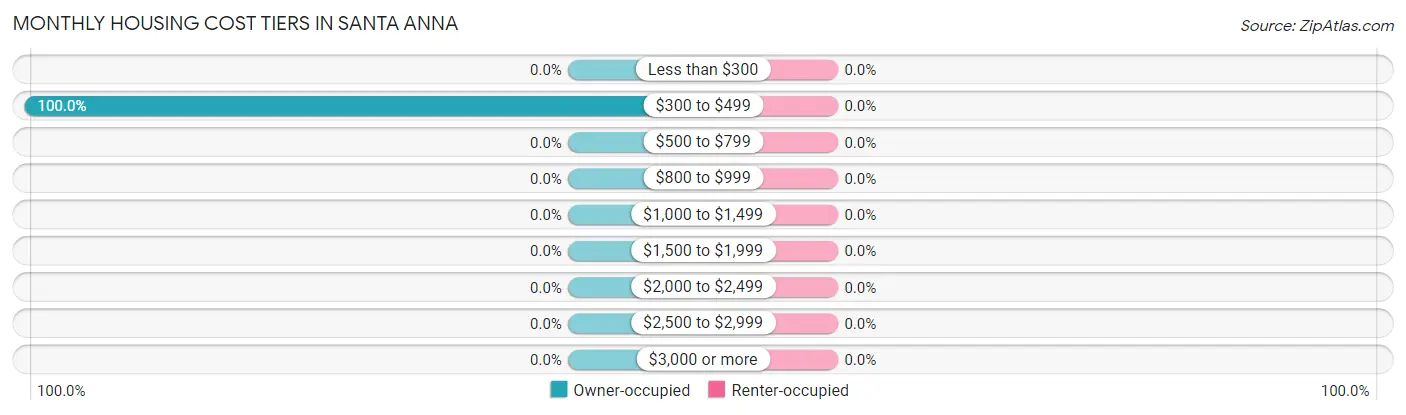
Monthly Housing Cost Tiers in Santa Anna
Monthly Cost
Owner-occupied
Renter-occupied
Less than $300
0 (0.0%)
0 (0.0%)
$300 to $499
3 (100.0%)
0 (0.0%)
$500 to $799
0 (0.0%)
0 (0.0%)
$800 to $999
0 (0.0%)
0 (0.0%)
$1,000 to $1,499
0 (0.0%)
0 (0.0%)
$1,500 to $1,999
0 (0.0%)
0 (0.0%)
$2,000 to $2,499
0 (0.0%)
0 (0.0%)
$2,500 to $2,999
0 (0.0%)
0 (0.0%)
$3,000 or more
0 (0.0%)
0 (0.0%)
Total
3 (100.0%)
0 (0.0%)
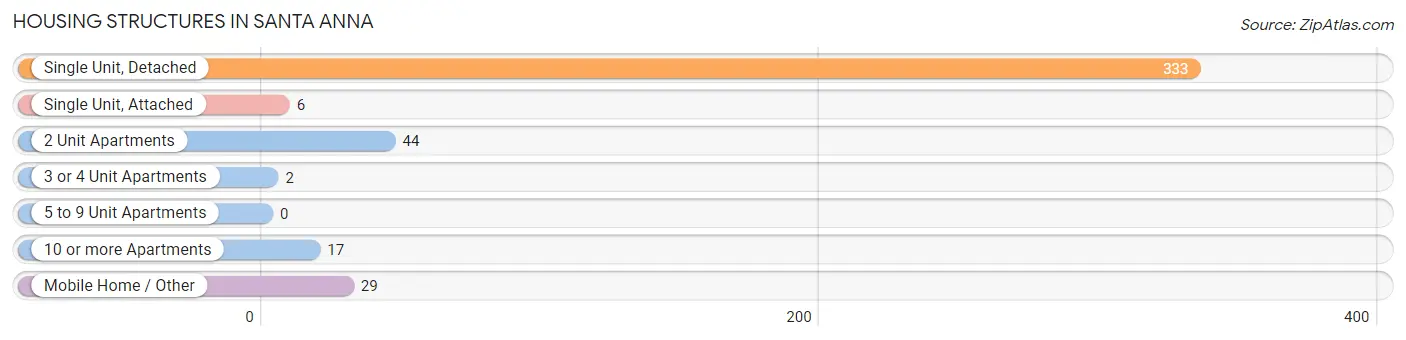
Physical Housing Characteristics in Santa Anna
Housing Structures in Santa Anna
Structure Type
# Housing Units
% Housing Units
Single Unit, Detached
333
77.3%
Single Unit, Attached
6
1.4%
2 Unit Apartments
44
10.2%
3 or 4 Unit Apartments
2
0.5%
5 to 9 Unit Apartments
0
0.0%
10 or more Apartments
17
3.9%
Mobile Home / Other
29
6.7%
Total
431
100.0%
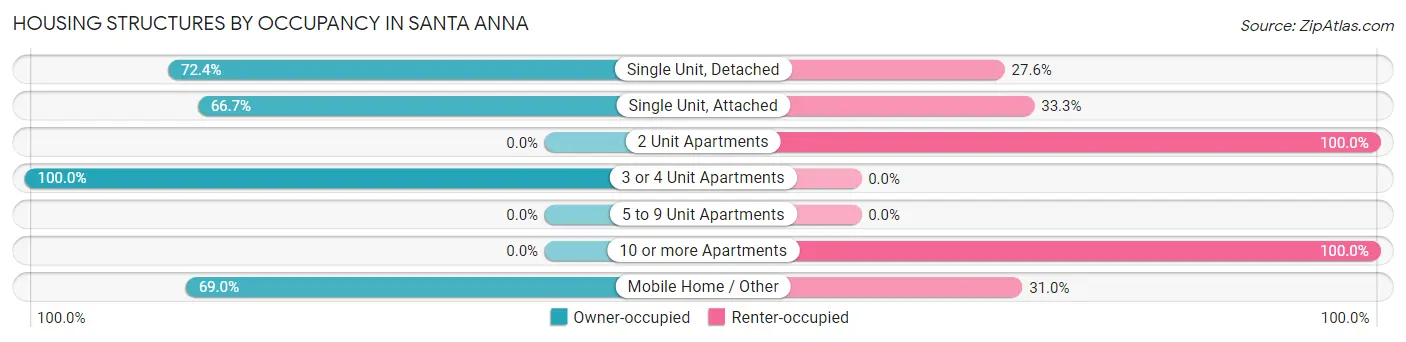
Housing Structures by Occupancy in Santa Anna
Structure Type
Owner-occupied
Renter-occupied
Single Unit, Detached
241 (72.4%)
92 (27.6%)
Single Unit, Attached
4 (66.7%)
2 (33.3%)
2 Unit Apartments
0 (0.0%)
44 (100.0%)
3 or 4 Unit Apartments
2 (100.0%)
0 (0.0%)
5 to 9 Unit Apartments
0 (0.0%)
0 (0.0%)
10 or more Apartments
0 (0.0%)
17 (100.0%)
Mobile Home / Other
20 (69.0%)
9 (31.0%)
Total
267 (62.0%)
164 (38.1%)
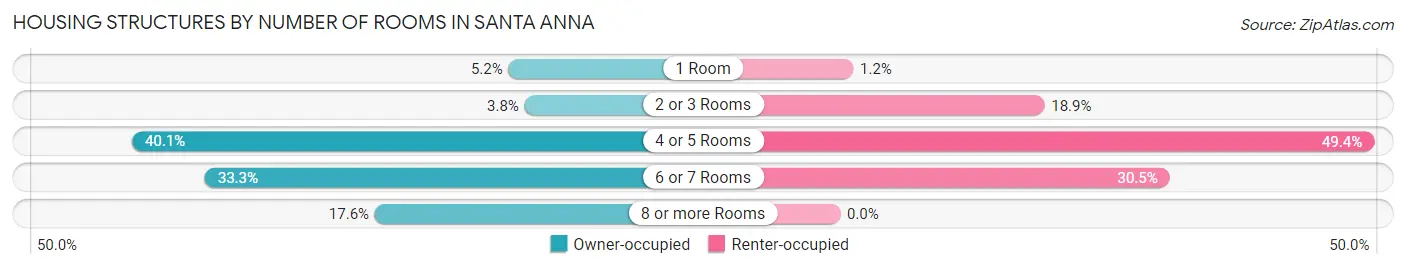
Housing Structures by Number of Rooms in Santa Anna
Number of Rooms
Owner-occupied
Renter-occupied
1 Room
14 (5.2%)
2 (1.2%)
2 or 3 Rooms
10 (3.7%)
31 (18.9%)
4 or 5 Rooms
107 (40.1%)
81 (49.4%)
6 or 7 Rooms
89 (33.3%)
50 (30.5%)
8 or more Rooms
47 (17.6%)
0 (0.0%)
Total
267 (100.0%)
164 (100.0%)
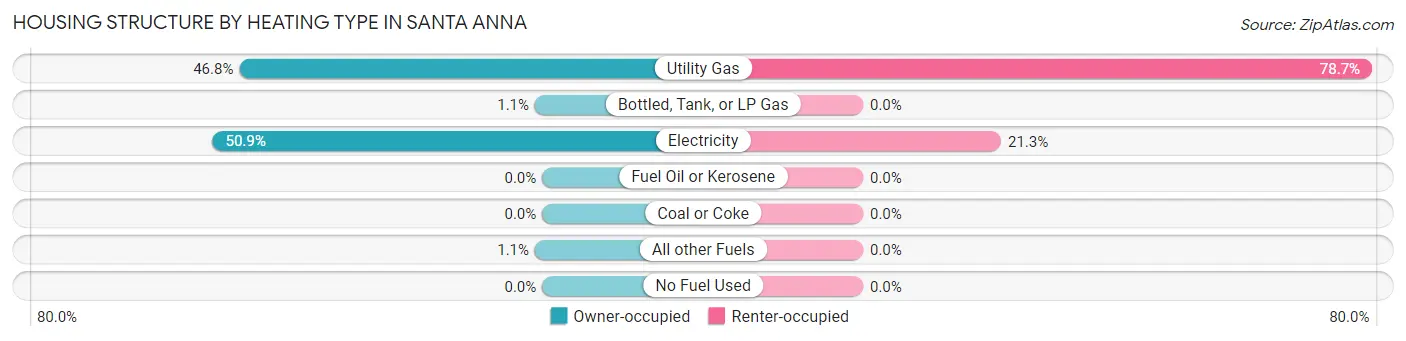
Housing Structure by Heating Type in Santa Anna
Heating Type
Owner-occupied
Renter-occupied
Utility Gas
125 (46.8%)
129 (78.7%)
Bottled, Tank, or LP Gas
3 (1.1%)
0 (0.0%)
Electricity
136 (50.9%)
35 (21.3%)
Fuel Oil or Kerosene
0 (0.0%)
0 (0.0%)
Coal or Coke
0 (0.0%)
0 (0.0%)
All other Fuels
3 (1.1%)
0 (0.0%)
No Fuel Used
0 (0.0%)
0 (0.0%)
Total
267 (100.0%)
164 (100.0%)
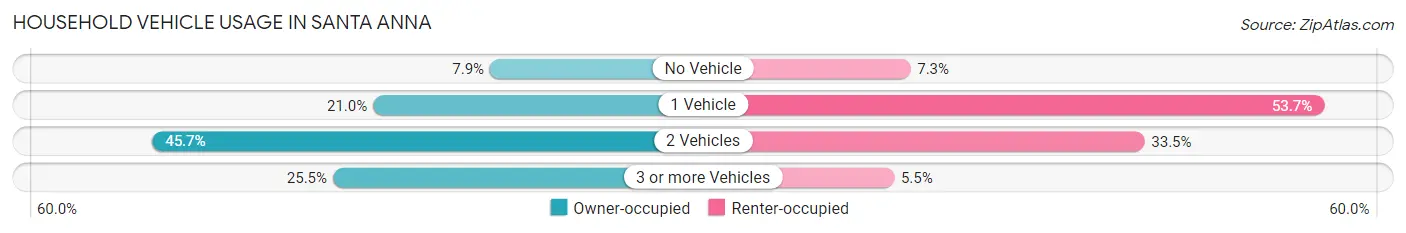
Household Vehicle Usage in Santa Anna
Vehicles per Household
Owner-occupied
Renter-occupied
No Vehicle
21 (7.9%)
12 (7.3%)
1 Vehicle
56 (21.0%)
88 (53.7%)
2 Vehicles
122 (45.7%)
55 (33.5%)
3 or more Vehicles
68 (25.5%)
9 (5.5%)
Total
267 (100.0%)
164 (100.0%)
Real Estate & Mortgages in Santa Anna
Real Estate and Mortgage Overview in Santa Anna
Characteristic
Without Mortgage
With Mortgage
Housing Units
203
0
Median Property Value
$48,300
$0
Median Household Income
$51,375
$0
Monthly Housing Costs
$424
$0
Real Estate Taxes
$885
$0
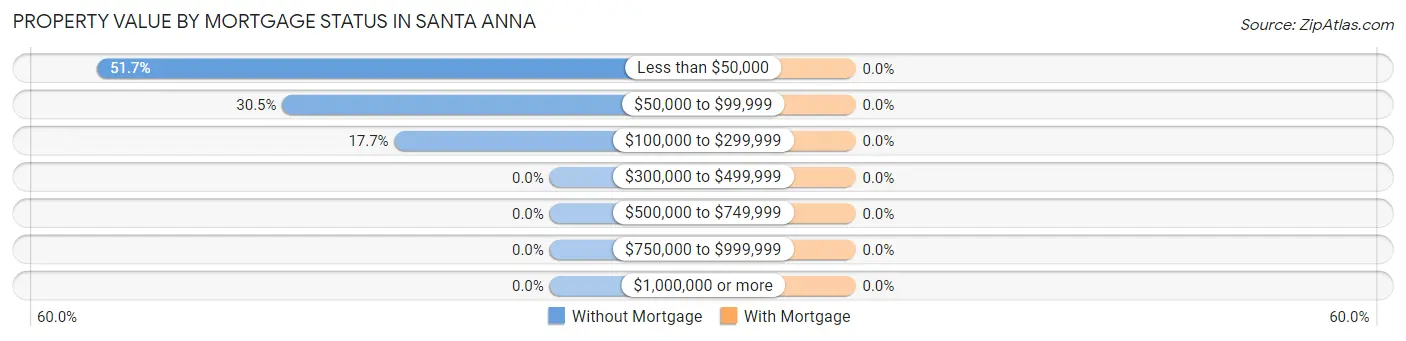
Property Value by Mortgage Status in Santa Anna
Property Value
Without Mortgage
With Mortgage
Less than $50,000
105 (51.7%)
0 (0.0%)
$50,000 to $99,999
62 (30.5%)
0 (0.0%)
$100,000 to $299,999
36 (17.7%)
0 (0.0%)
$300,000 to $499,999
0 (0.0%)
0 (0.0%)
$500,000 to $749,999
0 (0.0%)
0 (0.0%)
$750,000 to $999,999
0 (0.0%)
0 (0.0%)
$1,000,000 or more
0 (0.0%)
0 (0.0%)
Total
203 (100.0%)
0 (0.0%)
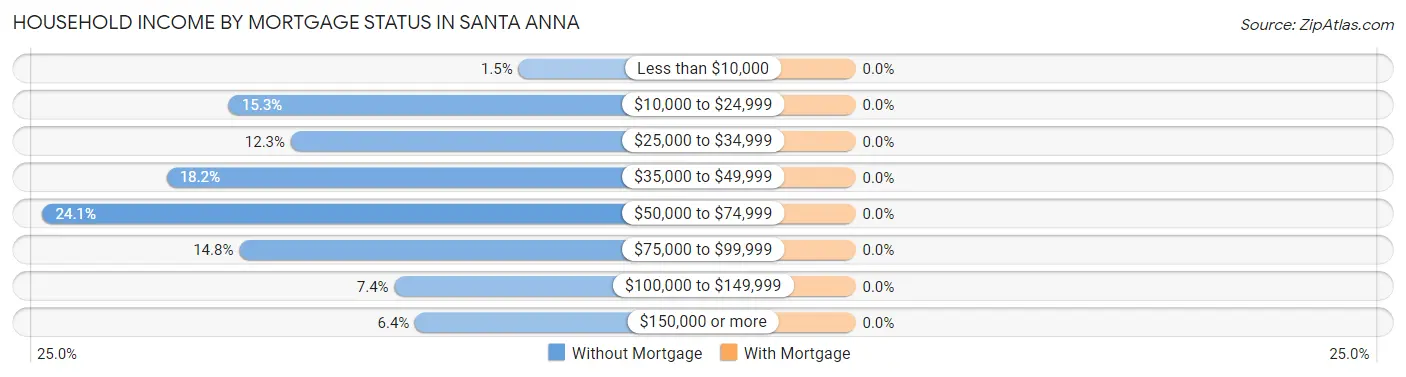
Household Income by Mortgage Status in Santa Anna
Household Income
Without Mortgage
With Mortgage
Less than $10,000
3 (1.5%)
0 (0.0%)
$10,000 to $24,999
31 (15.3%)
0 (0.0%)
$25,000 to $34,999
25 (12.3%)
0 (0.0%)
$35,000 to $49,999
37 (18.2%)
0 (0.0%)
$50,000 to $74,999
49 (24.1%)
0 (0.0%)
$75,000 to $99,999
30 (14.8%)
0 (0.0%)
$100,000 to $149,999
15 (7.4%)
0 (0.0%)
$150,000 or more
13 (6.4%)
0 (0.0%)
Total
203 (100.0%)
0 (0.0%)
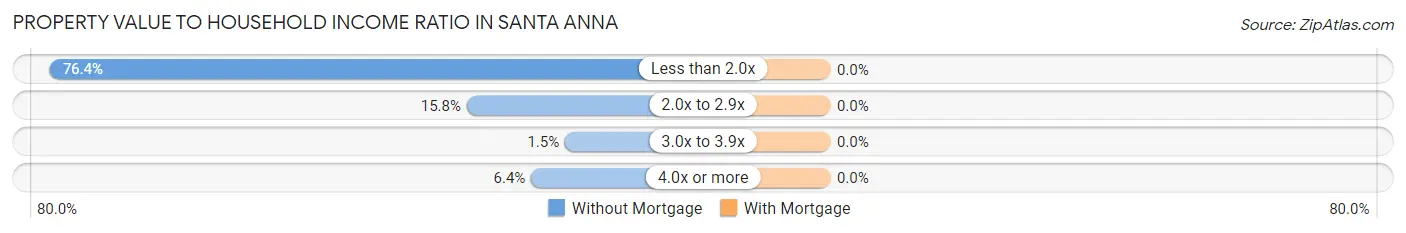
Property Value to Household Income Ratio in Santa Anna
Value-to-Income Ratio
Without Mortgage
With Mortgage
Less than 2.0x
155 (76.3%)
0 (0.0%)
2.0x to 2.9x
32 (15.8%)
0 (0.0%)
3.0x to 3.9x
3 (1.5%)
0 (0.0%)
4.0x or more
13 (6.4%)
0 (0.0%)
Total
203 (100.0%)
0 (0.0%)
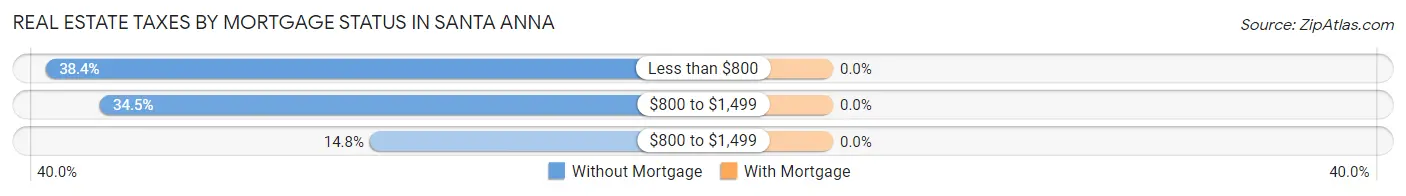
Real Estate Taxes by Mortgage Status in Santa Anna
Property Taxes
Without Mortgage
With Mortgage
Less than $800
78 (38.4%)
0 (0.0%)
$800 to $1,499
70 (34.5%)
0 (0.0%)
$800 to $1,499
30 (14.8%)
0 (0.0%)
Total
203 (100.0%)
0 (0.0%)
Health & Disability in Santa Anna
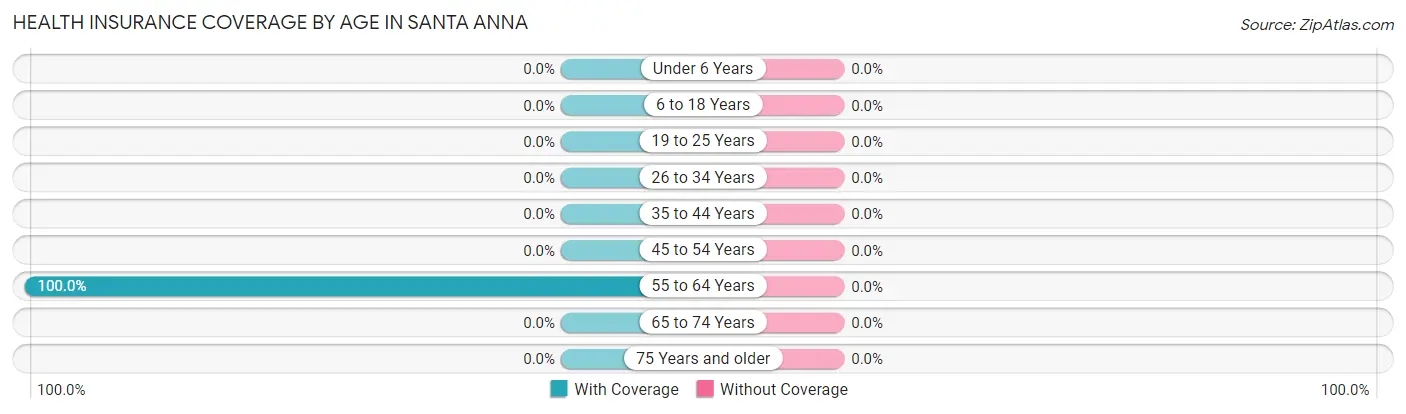
Health Insurance Coverage by Age in Santa Anna
Age Bracket
With Coverage
Without Coverage
Under 6 Years
0 (0.0%)
0 (0.0%)
6 to 18 Years
0 (0.0%)
0 (0.0%)
19 to 25 Years
0 (0.0%)
0 (0.0%)
26 to 34 Years
0 (0.0%)
0 (0.0%)
35 to 44 Years
0 (0.0%)
0 (0.0%)
45 to 54 Years
0 (0.0%)
0 (0.0%)
55 to 64 Years
3 (100.0%)
0 (0.0%)
65 to 74 Years
0 (0.0%)
0 (0.0%)
75 Years and older
0 (0.0%)
0 (0.0%)
Total
3 (100.0%)
0 (0.0%)
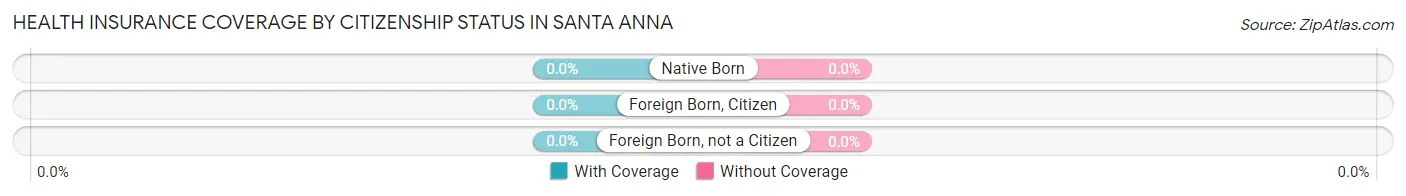
Health Insurance Coverage by Citizenship Status in Santa Anna
Citizenship Status
With Coverage
Without Coverage
Native Born
0 (0.0%)
0 (0.0%)
Foreign Born, Citizen
0 (0.0%)
0 (0.0%)
Foreign Born, not a Citizen
0 (0.0%)
0 (0.0%)
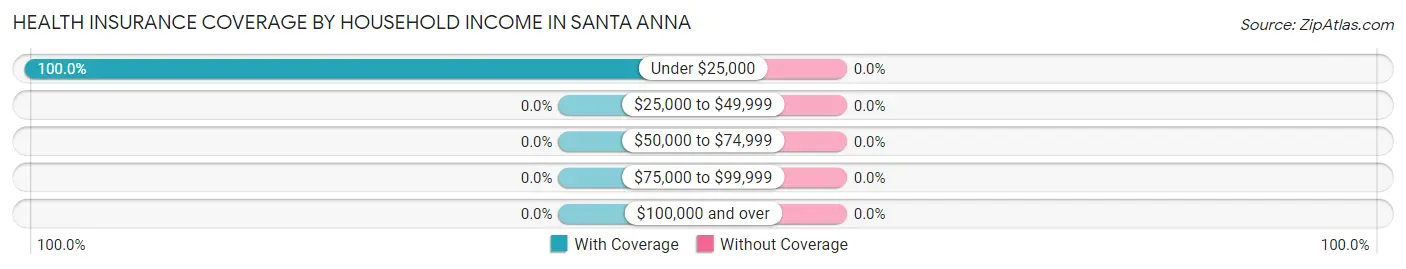
Health Insurance Coverage by Household Income in Santa Anna
Household Income
With Coverage
Without Coverage
Under $25,000
3 (100.0%)
0 (0.0%)
$25,000 to $49,999
0 (0.0%)
0 (0.0%)
$50,000 to $74,999
0 (0.0%)
0 (0.0%)
$75,000 to $99,999
0 (0.0%)
0 (0.0%)
$100,000 and over
0 (0.0%)
0 (0.0%)
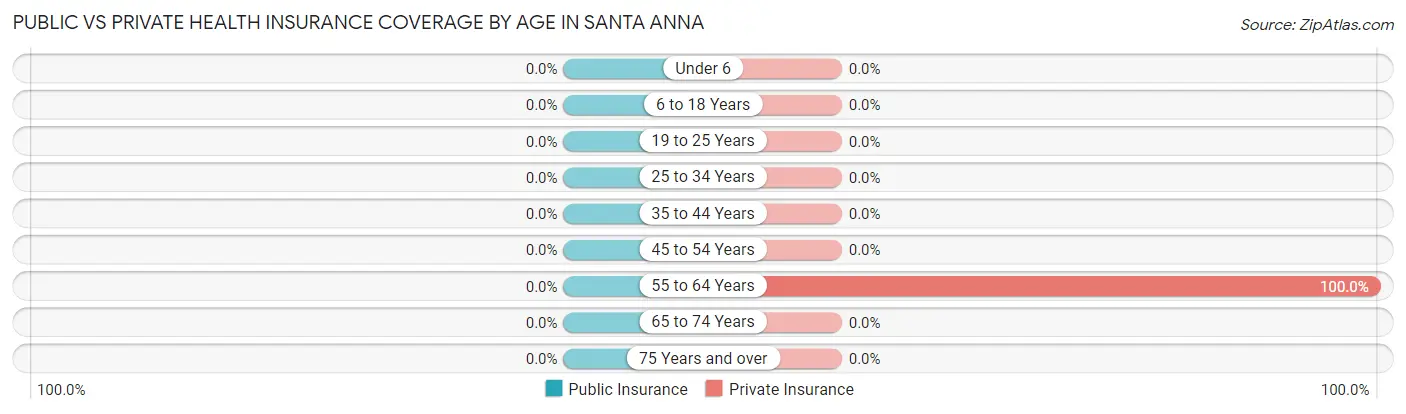
Public vs Private Health Insurance Coverage by Age in Santa Anna
Age Bracket
Public Insurance
Private Insurance
Under 6
0 (0.0%)
0 (0.0%)
6 to 18 Years
0 (0.0%)
0 (0.0%)
19 to 25 Years
0 (0.0%)
0 (0.0%)
25 to 34 Years
0 (0.0%)
0 (0.0%)
35 to 44 Years
0 (0.0%)
0 (0.0%)
45 to 54 Years
0 (0.0%)
0 (0.0%)
55 to 64 Years
0 (0.0%)
3 (100.0%)
65 to 74 Years
0 (0.0%)
0 (0.0%)
75 Years and over
0 (0.0%)
0 (0.0%)
Total
0 (0.0%)
3 (100.0%)
Disability Status by Sex by Age in Santa Anna
Age Bracket
Male
Female
Under 5 Years
0 (0.0%)
0 (0.0%)
5 to 17 Years
0 (0.0%)
0 (0.0%)
18 to 34 Years
0 (0.0%)
0 (0.0%)
35 to 64 Years
0 (0.0%)
0 (0.0%)
65 to 74 Years
0 (0.0%)
0 (0.0%)
75 Years and over
0 (0.0%)
0 (0.0%)
Disability Class by Sex by Age in Santa Anna
Disability Class: Hearing Difficulty
Age Bracket
Male
Female
Under 5 Years
0 (0.0%)
0 (0.0%)
5 to 17 Years
0 (0.0%)
0 (0.0%)
18 to 34 Years
0 (0.0%)
0 (0.0%)
35 to 64 Years
0 (0.0%)
0 (0.0%)
65 to 74 Years
0 (0.0%)
0 (0.0%)
75 Years and over
0 (0.0%)
0 (0.0%)
Disability Class: Vision Difficulty
Age Bracket
Male
Female
Under 5 Years
0 (0.0%)
0 (0.0%)
5 to 17 Years
0 (0.0%)
0 (0.0%)
18 to 34 Years
0 (0.0%)
0 (0.0%)
35 to 64 Years
0 (0.0%)
0 (0.0%)
65 to 74 Years
0 (0.0%)
0 (0.0%)
75 Years and over
0 (0.0%)
0 (0.0%)
Disability Class: Cognitive Difficulty
Age Bracket
Male
Female
5 to 17 Years
0 (0.0%)
0 (0.0%)
18 to 34 Years
0 (0.0%)
0 (0.0%)
35 to 64 Years
0 (0.0%)
0 (0.0%)
65 to 74 Years
0 (0.0%)
0 (0.0%)
75 Years and over
0 (0.0%)
0 (0.0%)
Disability Class: Ambulatory Difficulty
Age Bracket
Male
Female
5 to 17 Years
0 (0.0%)
0 (0.0%)
18 to 34 Years
0 (0.0%)
0 (0.0%)
35 to 64 Years
0 (0.0%)
0 (0.0%)
65 to 74 Years
0 (0.0%)
0 (0.0%)
75 Years and over
0 (0.0%)
0 (0.0%)
Disability Class: Self-Care Difficulty
Age Bracket
Male
Female
5 to 17 Years
0 (0.0%)
0 (0.0%)
18 to 34 Years
0 (0.0%)
0 (0.0%)
35 to 64 Years
0 (0.0%)
0 (0.0%)
65 to 74 Years
0 (0.0%)
0 (0.0%)
75 Years and over
0 (0.0%)
0 (0.0%)
Technology Access in Santa Anna
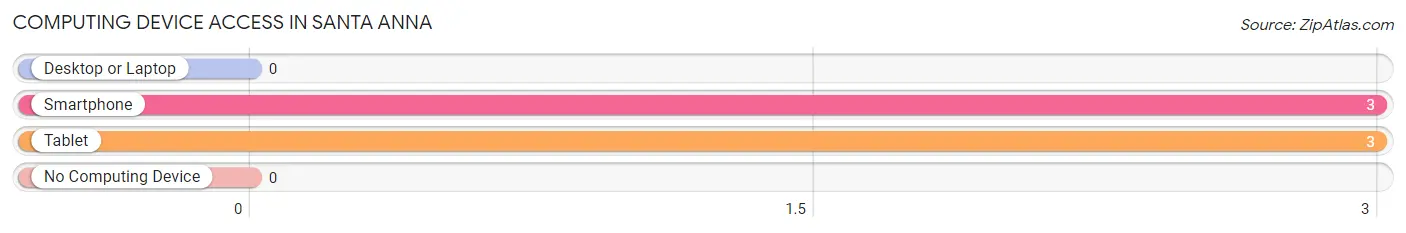
Computing Device Access in Santa Anna
Device Type
# Households
% Households
Desktop or Laptop
0
0.0%
Smartphone
3
100.0%
Tablet
3
100.0%
No Computing Device
0
0.0%
Total
3
100.0%
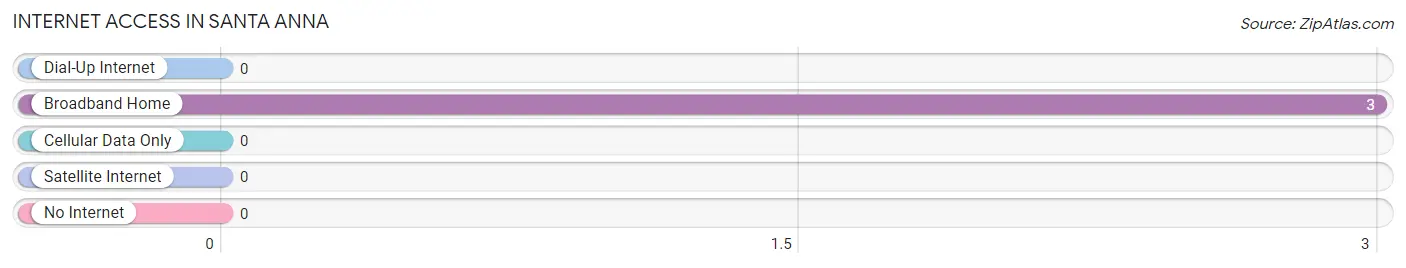
Internet Access in Santa Anna
Internet Type
# Households
% Households
Dial-Up Internet
0
0.0%
Broadband Home
3
100.0%
Cellular Data Only
0
0.0%
Satellite Internet
0
0.0%
No Internet
0
0.0%
Total
3
100.0%
Santa Anna Summary
Santa Anna is a small town located in Coleman County, Texas, United States. It is situated on the banks of the Colorado River, approximately 90 miles west of Abilene. The population was 1,093 at the 2010 census.
History
Santa Anna was founded in 1881 by a group of settlers from the nearby town of Coleman. The town was named after the nearby Santa Anna Mountains, which were named after the Mexican General Antonio Lopez de Santa Anna. The town was originally a farming community, but it soon became a center for the local ranching industry.
In the early 1900s, the town began to grow and prosper. The Santa Anna and Colorado River Railroad was built in 1906, connecting the town to nearby Abilene. This allowed for the transportation of goods and services to and from the town.
In the 1920s, the town experienced a period of growth and prosperity. The Santa Anna Oil Field was discovered in 1923, and the town became a center for the oil industry. The town also became a center for the local ranching industry, and the Santa Anna Livestock Auction was established in 1925.
In the 1950s, the town experienced a period of decline. The oil industry began to decline, and the Santa Anna Livestock Auction closed in 1957. The town also experienced a population decline, as many of the town's residents moved away in search of better economic opportunities.
Geography
Santa Anna is located at 31°45'25" North, 99°25'45" West (31.756944, -99.429167). The town is situated on the banks of the Colorado River, approximately 90 miles west of Abilene. The town has a total area of 1.2 square miles, all of which is land.
Economy
The economy of Santa Anna is largely based on agriculture and ranching. The town is home to several large ranches, and the local economy is supported by the sale of cattle, sheep, and other livestock. The town is also home to several small businesses, including a grocery store, a hardware store, and a few restaurants.
Demographics
As of the 2010 census, there were 1,093 people, 431 households, and 287 families residing in the town. The population density was 908.3 people per square mile. The racial makeup of the town was 94.2% White, 0.2% African American, 0.2% Native American, 0.2% Asian, 0.2% Pacific Islander, 3.3% from other races, and 1.9% from two or more races. Hispanic or Latino of any race were 8.2% of the population.
The median income for a household in the town was $30,000, and the median income for a family was $35,000. The per capita income for the town was $14,000. About 17.2% of families and 20.2% of the population were below the poverty line, including 28.2% of those under age 18 and 10.2% of those age 65 or over.
Common Questions
What is Income or Wage Gap in Santa Anna?
Income or Wage Gap in Santa Anna is 7.7%.
Women in Santa Anna earn 92.3 cents for every dollar earned by a man.
What is the Total Population of Santa Anna?
Total Population of Santa Anna is 3.
What is the Total Female Population of Santa Anna?
Total Female Population of Santa Anna is 3.
How Large is the Labor Force in Santa Anna?
There are 3 People in the Labor Forcein in Santa Anna.
What is the Percentage of People in the Labor Force in Santa Anna?
100.0% of People are in the Labor Force in Santa Anna.
What is the Unemployment Rate in Santa Anna?
Unemployment Rate in Santa Anna is 100.0%.
Report Title
Report Link
HTML Copy & Paste Link
Social Media
Copy and paste the folowing code into any webpage where you would like this interactive chart to display