Brentford, SD Map & Demographics
Brentford Map
Brentford Overview
$47,392
PER CAPITA INCOME
$116,750
AVG FAMILY INCOME
$61,250
AVG HOUSEHOLD INCOME
67.0%
WAGE / INCOME GAP [ % ]
33.0¢/ $1
WAGE / INCOME GAP [ $ ]
0.39
INEQUALITY / GINI INDEX
66
TOTAL POPULATION
28
MALE POPULATION
38
FEMALE POPULATION
73.68
MALES / 100 FEMALES
135.71
FEMALES / 100 MALES
57.9
MEDIAN AGE
2.2
AVG FAMILY SIZE
1.5
AVG HOUSEHOLD SIZE
41
LABOR FORCE [ PEOPLE ]
66.1%
PERCENT IN LABOR FORCE
Brentford Zip Codes
Brentford Area Codes
Income in Brentford
Income Overview in Brentford
Per Capita Income in Brentford is $47,392, while median incomes of families and households are $116,750 and $61,250 respectively.
| Characteristic | Number | Measure |
| Per Capita Income | 66 | $47,392 |
| Median Family Income | 17 | $116,750 |
| Mean Family Income | 17 | $115,841 |
| Median Household Income | 45 | $61,250 |
| Mean Household Income | 45 | $73,633 |
| Income Deficit | 17 | $0 |
| Wage / Income Gap (%) | 66 | 66.97% |
| Wage / Income Gap ($) | 66 | 33.03¢ per $1 |
| Gini / Inequality Index | 66 | 0.39 |
Earnings by Sex in Brentford
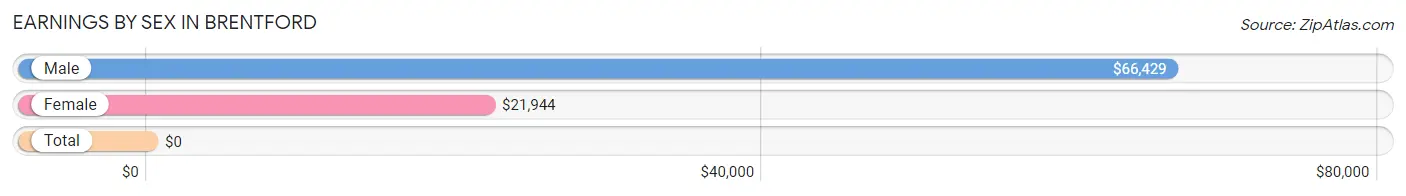
| Sex | Number | Average Earnings |
| Male | 22 (50.0%) | $66,429 |
| Female | 22 (50.0%) | $21,944 |
| Total | 44 (100.0%) | $0 |
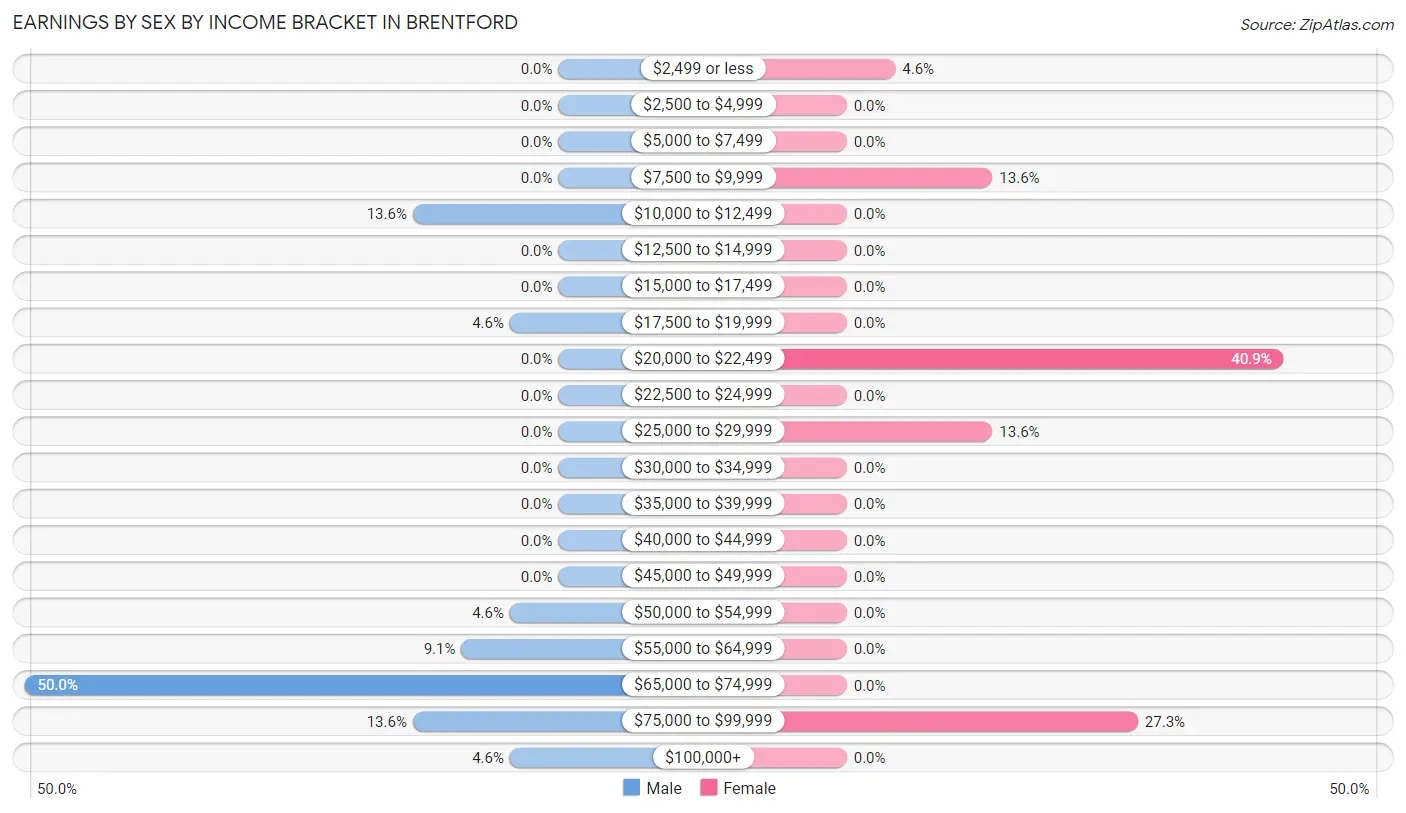
Earnings by Sex by Income Bracket in Brentford
The most common earnings brackets in Brentford are $65,000 to $74,999 for men (11 | 50.0%) and $20,000 to $22,499 for women (9 | 40.9%).
| Income | Male | Female |
| $2,499 or less | 0 (0.0%) | 1 (4.5%) |
| $2,500 to $4,999 | 0 (0.0%) | 0 (0.0%) |
| $5,000 to $7,499 | 0 (0.0%) | 0 (0.0%) |
| $7,500 to $9,999 | 0 (0.0%) | 3 (13.6%) |
| $10,000 to $12,499 | 3 (13.6%) | 0 (0.0%) |
| $12,500 to $14,999 | 0 (0.0%) | 0 (0.0%) |
| $15,000 to $17,499 | 0 (0.0%) | 0 (0.0%) |
| $17,500 to $19,999 | 1 (4.5%) | 0 (0.0%) |
| $20,000 to $22,499 | 0 (0.0%) | 9 (40.9%) |
| $22,500 to $24,999 | 0 (0.0%) | 0 (0.0%) |
| $25,000 to $29,999 | 0 (0.0%) | 3 (13.6%) |
| $30,000 to $34,999 | 0 (0.0%) | 0 (0.0%) |
| $35,000 to $39,999 | 0 (0.0%) | 0 (0.0%) |
| $40,000 to $44,999 | 0 (0.0%) | 0 (0.0%) |
| $45,000 to $49,999 | 0 (0.0%) | 0 (0.0%) |
| $50,000 to $54,999 | 1 (4.5%) | 0 (0.0%) |
| $55,000 to $64,999 | 2 (9.1%) | 0 (0.0%) |
| $65,000 to $74,999 | 11 (50.0%) | 0 (0.0%) |
| $75,000 to $99,999 | 3 (13.6%) | 6 (27.3%) |
| $100,000+ | 1 (4.5%) | 0 (0.0%) |
| Total | 22 (100.0%) | 22 (100.0%) |
Earnings by Sex by Educational Attainment in Brentford
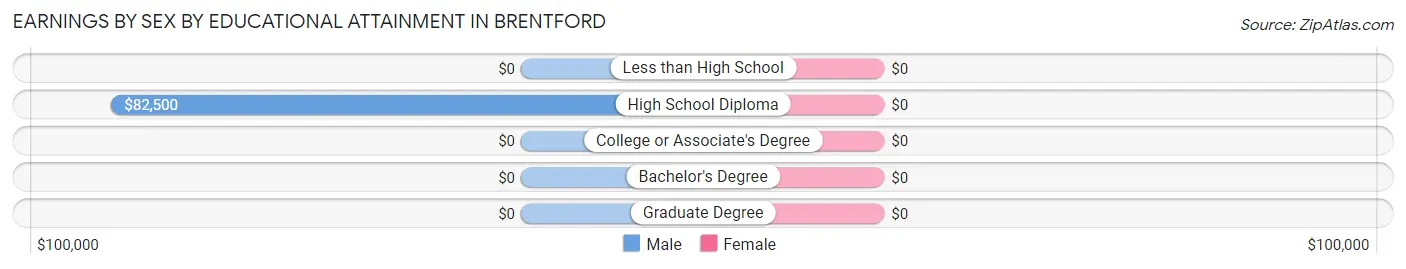
| Educational Attainment | Male Income | Female Income |
| Less than High School | - | - |
| High School Diploma | $82,500 | $0 |
| College or Associate's Degree | - | - |
| Bachelor's Degree | - | - |
| Graduate Degree | - | - |
| Total | $66,429 | $21,944 |
Family Income in Brentford
Family Income Brackets in Brentford
According to the Brentford family income data, there are 7 families falling into the $150,000 to $199,999 income range, which is the most common income bracket and makes up 41.2% of all families.
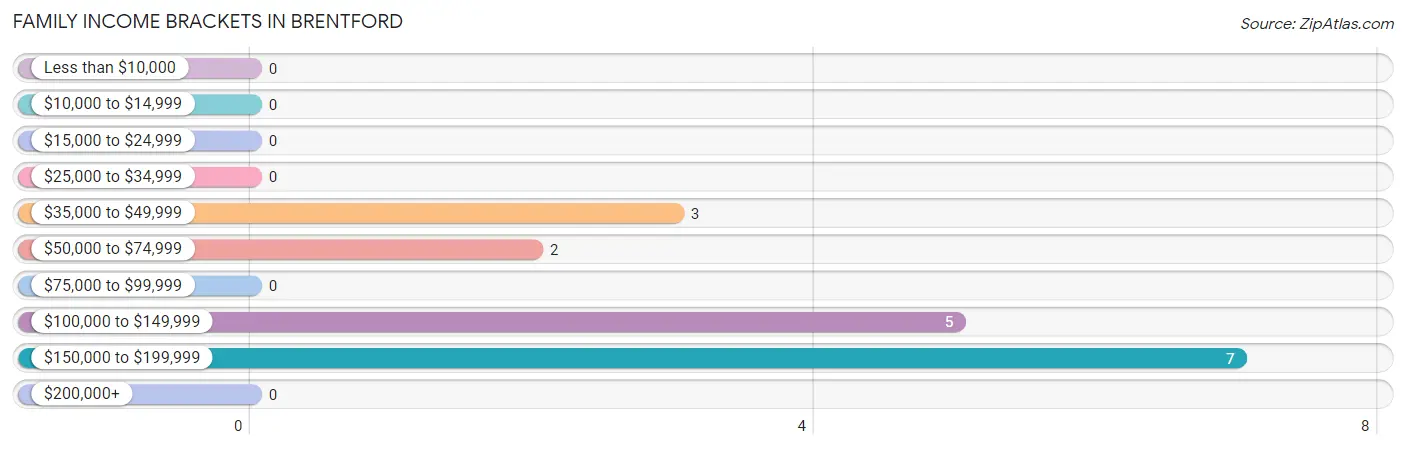
| Income Bracket | # Families | % Families |
| Less than $10,000 | 0 | 0.0% |
| $10,000 to $14,999 | 0 | 0.0% |
| $15,000 to $24,999 | 0 | 0.0% |
| $25,000 to $34,999 | 0 | 0.0% |
| $35,000 to $49,999 | 3 | 17.6% |
| $50,000 to $74,999 | 2 | 11.8% |
| $75,000 to $99,999 | 0 | 0.0% |
| $100,000 to $149,999 | 5 | 29.4% |
| $150,000 to $199,999 | 7 | 41.2% |
| $200,000+ | 0 | 0.0% |
Family Income by Famaliy Size in Brentford
2-person families (13 | 76.5%) account for the highest median family income in Brentford with $162,679 per family, while 2-person families (13 | 76.5%) have the highest median income of $81,340 per family member.
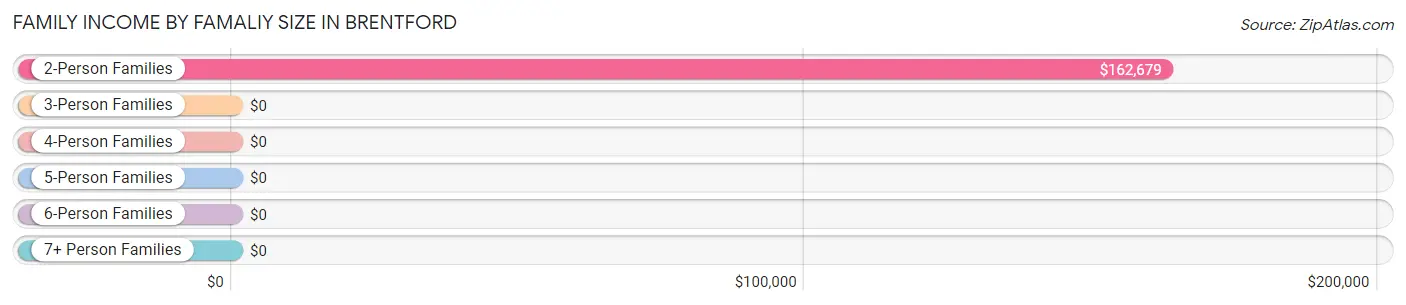
| Income Bracket | # Families | Median Income |
| 2-Person Families | 13 (76.5%) | $162,679 |
| 3-Person Families | 4 (23.5%) | $0 |
| 4-Person Families | 0 (0.0%) | $0 |
| 5-Person Families | 0 (0.0%) | $0 |
| 6-Person Families | 0 (0.0%) | $0 |
| 7+ Person Families | 0 (0.0%) | $0 |
| Total | 17 (100.0%) | $116,750 |
Family Income by Number of Earners in Brentford
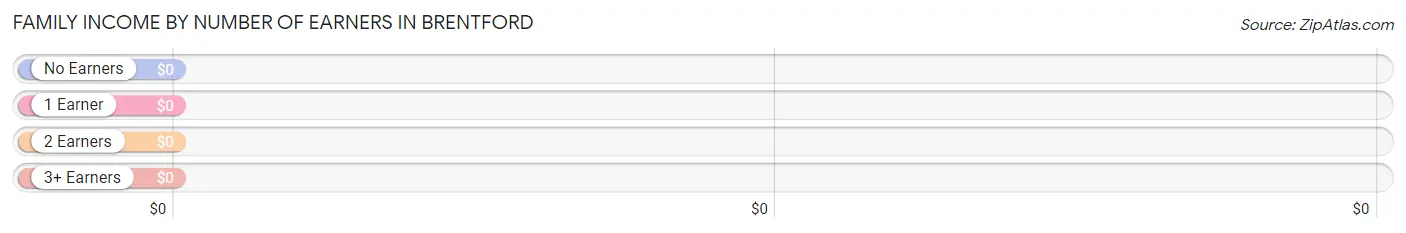
| Number of Earners | # Families | Median Income |
| No Earners | 5 (29.4%) | $0 |
| 1 Earner | 1 (5.9%) | $0 |
| 2 Earners | 11 (64.7%) | $0 |
| 3+ Earners | 0 (0.0%) | $0 |
| Total | 17 (100.0%) | $116,750 |
Household Income in Brentford
Household Income Brackets in Brentford
With 9 households falling in the category, the $15,000 to $24,999 income range is the most frequent in Brentford, accounting for 20.0% of all households.
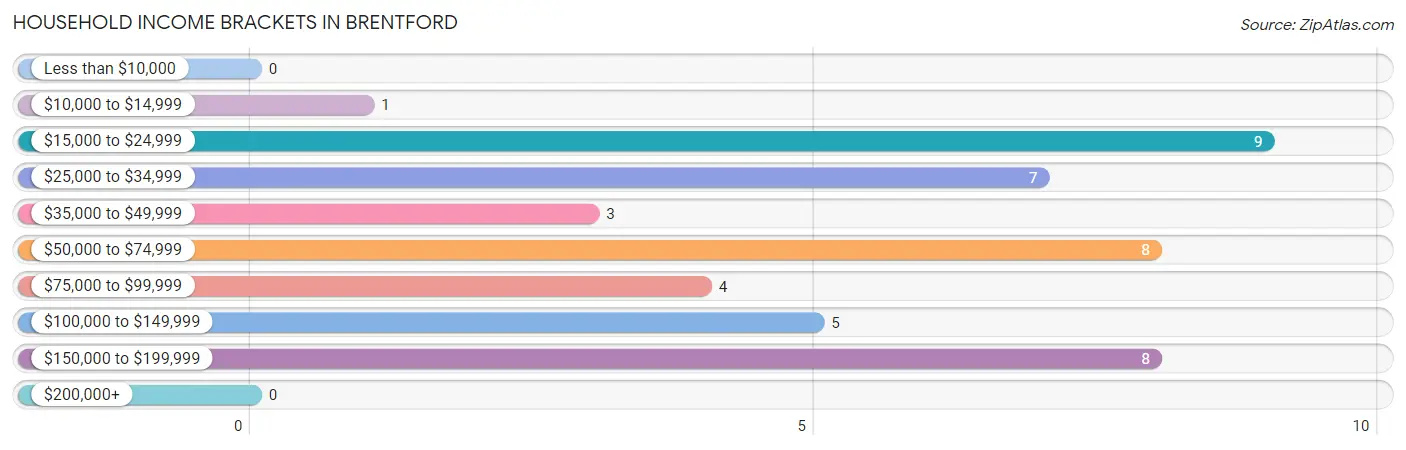
| Income Bracket | # Households | % Households |
| Less than $10,000 | 0 | 0.0% |
| $10,000 to $14,999 | 1 | 2.2% |
| $15,000 to $24,999 | 9 | 20.0% |
| $25,000 to $34,999 | 7 | 15.6% |
| $35,000 to $49,999 | 3 | 6.7% |
| $50,000 to $74,999 | 8 | 17.8% |
| $75,000 to $99,999 | 4 | 8.9% |
| $100,000 to $149,999 | 5 | 11.1% |
| $150,000 to $199,999 | 8 | 17.8% |
| $200,000+ | 0 | 0.0% |
Household Income by Householder Age in Brentford
| Income Bracket | # Households | Median Income |
| 15 to 24 Years | 0 (0.0%) | $0 |
| 25 to 44 Years | 4 (8.9%) | $0 |
| 45 to 64 Years | 25 (55.6%) | $0 |
| 65+ Years | 16 (35.6%) | $0 |
| Total | 45 (100.0%) | $61,250 |
Poverty in Brentford
Income Below Poverty by Sex and Age in Brentford
| Age Bracket | Male | Female |
| Under 5 Years | 0 (0.0%) | 0 (0.0%) |
| 5 Years | 0 (0.0%) | 0 (0.0%) |
| 6 to 11 Years | 0 (0.0%) | 0 (0.0%) |
| 12 to 14 Years | 0 (0.0%) | 0 (0.0%) |
| 15 Years | 0 (0.0%) | 0 (0.0%) |
| 16 and 17 Years | 0 (0.0%) | 0 (0.0%) |
| 18 to 24 Years | 0 (0.0%) | 0 (0.0%) |
| 25 to 34 Years | 0 (0.0%) | 0 (0.0%) |
| 35 to 44 Years | 0 (0.0%) | 0 (0.0%) |
| 45 to 54 Years | 0 (0.0%) | 0 (0.0%) |
| 55 to 64 Years | 0 (0.0%) | 0 (0.0%) |
| 65 to 74 Years | 0 (0.0%) | 0 (0.0%) |
| 75 Years and over | 0 (0.0%) | 0 (0.0%) |
| Total | 0 (0.0%) | 0 (0.0%) |
Income Above Poverty by Sex and Age in Brentford
According to the poverty statistics in Brentford, males aged under 5 years and females aged under 5 years are the age groups that are most secure financially, with 100.0% of males and 100.0% of females in these age groups living above the poverty line.
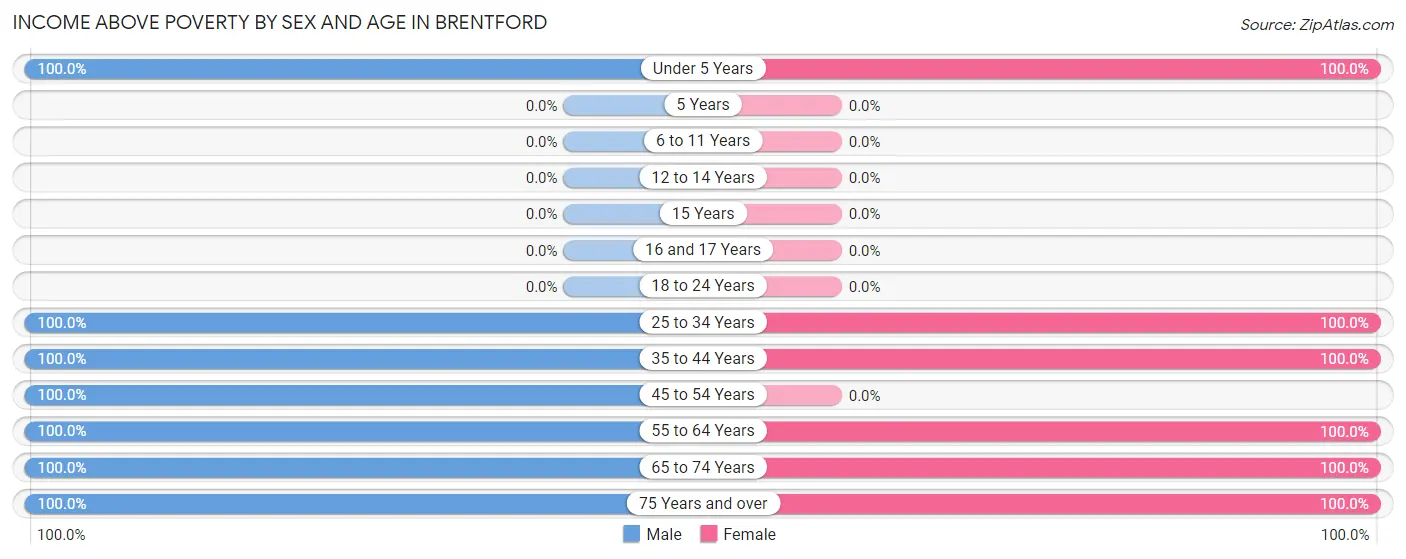
| Age Bracket | Male | Female |
| Under 5 Years | 1 (100.0%) | 3 (100.0%) |
| 5 Years | 0 (0.0%) | 0 (0.0%) |
| 6 to 11 Years | 0 (0.0%) | 0 (0.0%) |
| 12 to 14 Years | 0 (0.0%) | 0 (0.0%) |
| 15 Years | 0 (0.0%) | 0 (0.0%) |
| 16 and 17 Years | 0 (0.0%) | 0 (0.0%) |
| 18 to 24 Years | 0 (0.0%) | 0 (0.0%) |
| 25 to 34 Years | 1 (100.0%) | 1 (100.0%) |
| 35 to 44 Years | 3 (100.0%) | 3 (100.0%) |
| 45 to 54 Years | 6 (100.0%) | 0 (0.0%) |
| 55 to 64 Years | 10 (100.0%) | 15 (100.0%) |
| 65 to 74 Years | 3 (100.0%) | 6 (100.0%) |
| 75 Years and over | 4 (100.0%) | 10 (100.0%) |
| Total | 28 (100.0%) | 38 (100.0%) |
Income Below Poverty Among Married-Couple Families in Brentford
| Children | Above Poverty | Below Poverty |
| No Children | 13 (100.0%) | 0 (0.0%) |
| 1 or 2 Children | 4 (100.0%) | 0 (0.0%) |
| 3 or 4 Children | 0 (0.0%) | 0 (0.0%) |
| 5 or more Children | 0 (0.0%) | 0 (0.0%) |
| Total | 17 (100.0%) | 0 (0.0%) |
Income Below Poverty Among Single-Parent Households in Brentford
| Children | Single Father | Single Mother |
| No Children | 0 (0.0%) | 0 (0.0%) |
| 1 or 2 Children | 0 (0.0%) | 0 (0.0%) |
| 3 or 4 Children | 0 (0.0%) | 0 (0.0%) |
| 5 or more Children | 0 (0.0%) | 0 (0.0%) |
| Total | 0 (0.0%) | 0 (0.0%) |
Income Below Poverty Among Married-Couple vs Single-Parent Households in Brentford
| Children | Married-Couple Families | Single-Parent Households |
| No Children | 0 (0.0%) | 0 (0.0%) |
| 1 or 2 Children | 0 (0.0%) | 0 (0.0%) |
| 3 or 4 Children | 0 (0.0%) | 0 (0.0%) |
| 5 or more Children | 0 (0.0%) | 0 (0.0%) |
| Total | 0 (0.0%) | 0 (0.0%) |
Race in Brentford
The most populous races in Brentford are , and White / Caucasian (66 | 100.0%).
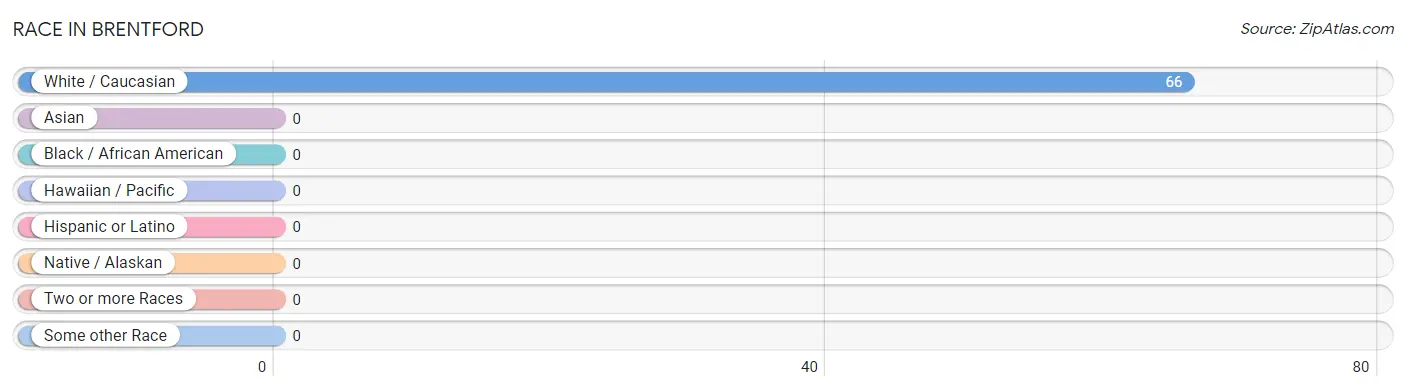
| Race | # Population | % Population |
| Asian | 0 | 0.0% |
| Black / African American | 0 | 0.0% |
| Hawaiian / Pacific | 0 | 0.0% |
| Hispanic or Latino | 0 | 0.0% |
| Native / Alaskan | 0 | 0.0% |
| White / Caucasian | 66 | 100.0% |
| Two or more Races | 0 | 0.0% |
| Some other Race | 0 | 0.0% |
| Total | 66 | 100.0% |
Ancestry in Brentford
The most populous ancestries reported in Brentford are German (29 | 43.9%), Norwegian (11 | 16.7%), Swedish (11 | 16.7%), Irish (9 | 13.6%), and Dutch (4 | 6.1%), together accounting for 97.0% of all Brentford residents.

| Ancestry | # Population | % Population |
| Dutch | 4 | 6.1% |
| English | 1 | 1.5% |
| French | 3 | 4.5% |
| German | 29 | 43.9% |
| Irish | 9 | 13.6% |
| Norwegian | 11 | 16.7% |
| Polish | 2 | 3.0% |
| Russian | 2 | 3.0% |
| Scottish | 1 | 1.5% |
| Swedish | 11 | 16.7% | View All 10 Rows |
Immigrants in Brentford

| Immigration Origin | # Population | % Population | View All 0 Rows |
Sex and Age in Brentford
Sex and Age in Brentford
The most populous age groups in Brentford are 55 to 59 Years (10 | 35.7%) for men and 55 to 59 Years (15 | 39.5%) for women.
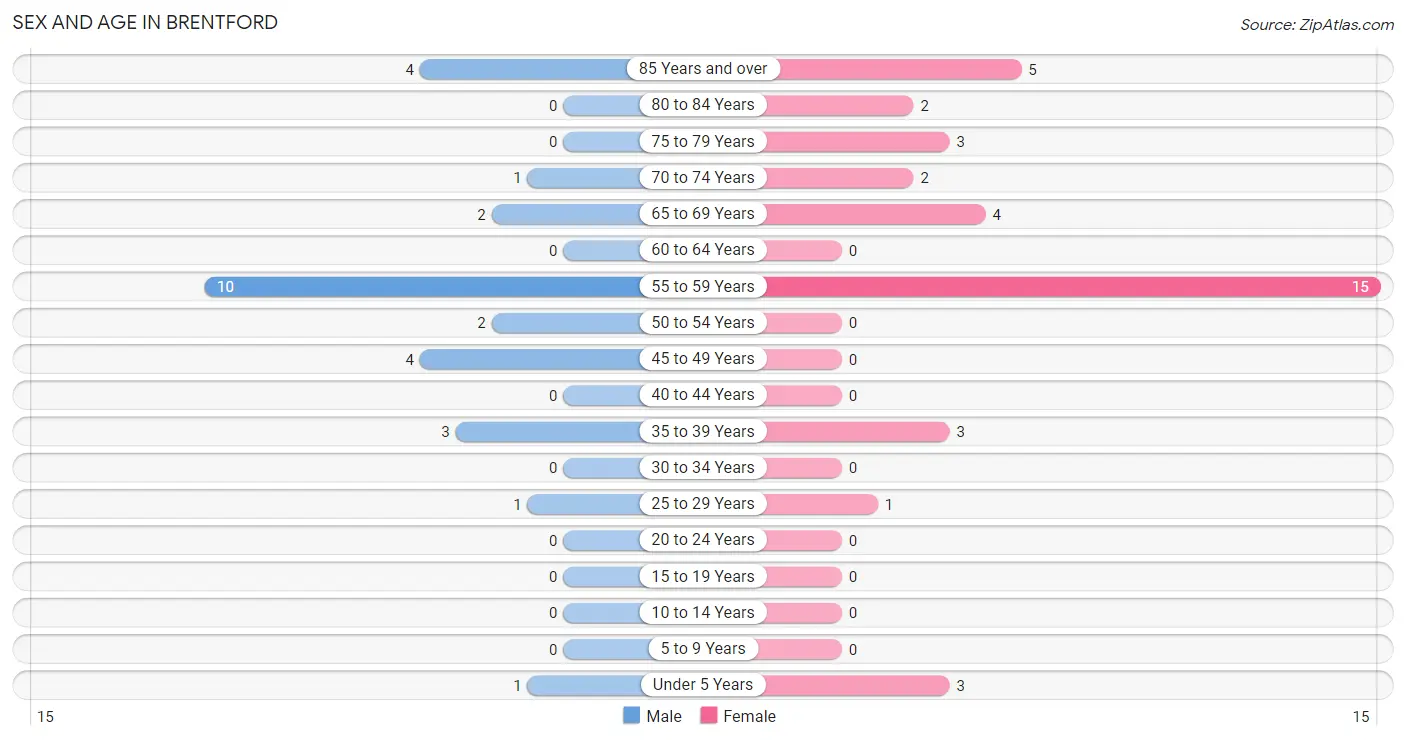
| Age Bracket | Male | Female |
| Under 5 Years | 1 (3.6%) | 3 (7.9%) |
| 5 to 9 Years | 0 (0.0%) | 0 (0.0%) |
| 10 to 14 Years | 0 (0.0%) | 0 (0.0%) |
| 15 to 19 Years | 0 (0.0%) | 0 (0.0%) |
| 20 to 24 Years | 0 (0.0%) | 0 (0.0%) |
| 25 to 29 Years | 1 (3.6%) | 1 (2.6%) |
| 30 to 34 Years | 0 (0.0%) | 0 (0.0%) |
| 35 to 39 Years | 3 (10.7%) | 3 (7.9%) |
| 40 to 44 Years | 0 (0.0%) | 0 (0.0%) |
| 45 to 49 Years | 4 (14.3%) | 0 (0.0%) |
| 50 to 54 Years | 2 (7.1%) | 0 (0.0%) |
| 55 to 59 Years | 10 (35.7%) | 15 (39.5%) |
| 60 to 64 Years | 0 (0.0%) | 0 (0.0%) |
| 65 to 69 Years | 2 (7.1%) | 4 (10.5%) |
| 70 to 74 Years | 1 (3.6%) | 2 (5.3%) |
| 75 to 79 Years | 0 (0.0%) | 3 (7.9%) |
| 80 to 84 Years | 0 (0.0%) | 2 (5.3%) |
| 85 Years and over | 4 (14.3%) | 5 (13.2%) |
| Total | 28 (100.0%) | 38 (100.0%) |
Families and Households in Brentford
Median Family Size in Brentford
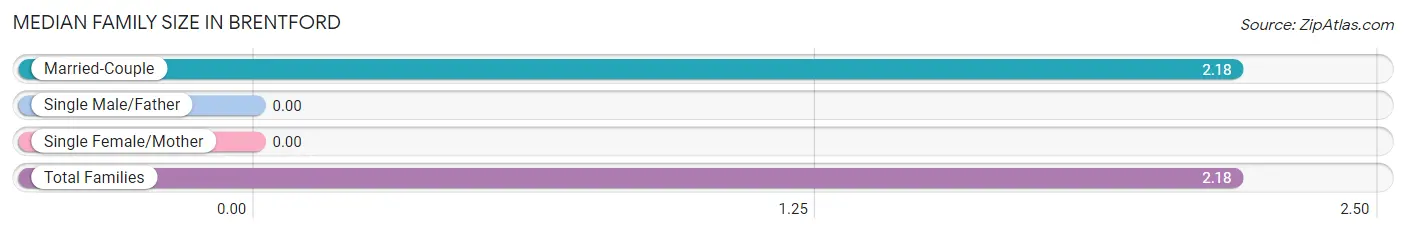
| Family Type | # Families | Family Size |
| Married-Couple | 17 (100.0%) | 2.18 |
| Single Male/Father | 0 (0.0%) | - |
| Single Female/Mother | 0 (0.0%) | - |
| Total Families | 17 (100.0%) | 2.18 |
Median Household Size in Brentford
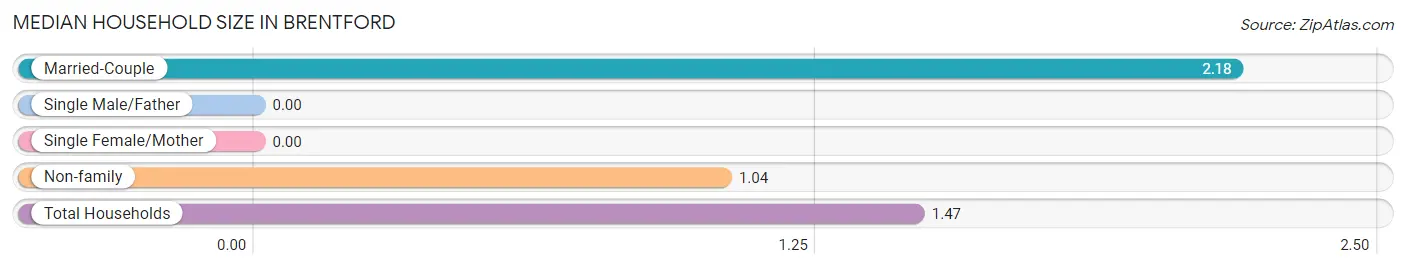
| Household Type | # Households | Household Size |
| Married-Couple | 17 (37.8%) | 2.18 |
| Single Male/Father | 0 (0.0%) | - |
| Single Female/Mother | 0 (0.0%) | - |
| Non-family | 28 (62.2%) | 1.04 |
| Total Households | 45 (100.0%) | 1.47 |
Household Size by Marriage Status in Brentford
Out of a total of 45 households in Brentford, 17 (37.8%) are family households, while 28 (62.2%) are nonfamily households. The most numerous type of family households are 2-person households, comprising 13, and the most common type of nonfamily households are 1-person households, comprising 27.
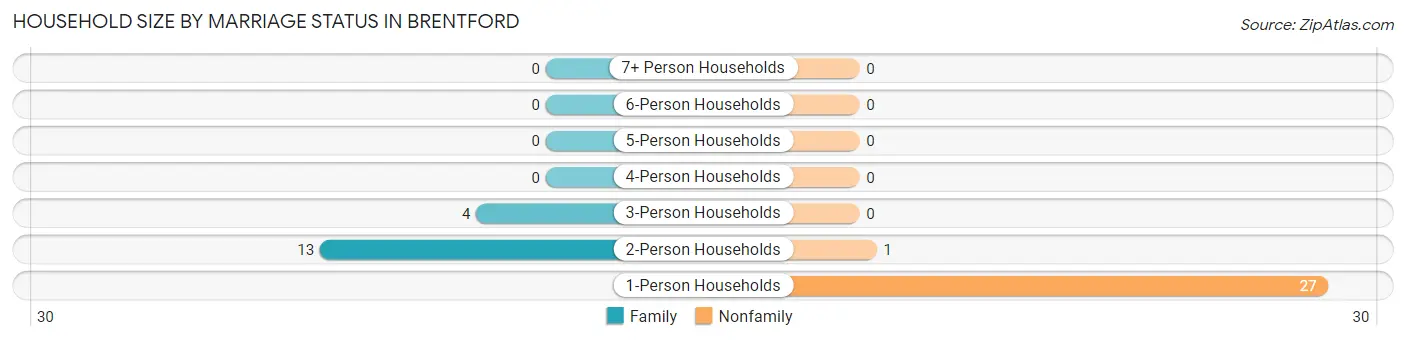
| Household Size | Family Households | Nonfamily Households |
| 1-Person Households | - | 27 (60.0%) |
| 2-Person Households | 13 (28.9%) | 1 (2.2%) |
| 3-Person Households | 4 (8.9%) | 0 (0.0%) |
| 4-Person Households | 0 (0.0%) | 0 (0.0%) |
| 5-Person Households | 0 (0.0%) | 0 (0.0%) |
| 6-Person Households | 0 (0.0%) | 0 (0.0%) |
| 7+ Person Households | 0 (0.0%) | 0 (0.0%) |
| Total | 17 (37.8%) | 28 (62.2%) |
Female Fertility in Brentford
Fertility by Age in Brentford
Average fertility rate in Brentford is 250.0 births per 1,000 women. Women in the age bracket of 20 to 34 years have the highest fertility rate with 1,000.0 births per 1,000 women. Women in the age bracket of 20 to 34 years acount for 100.0% of all women with births.
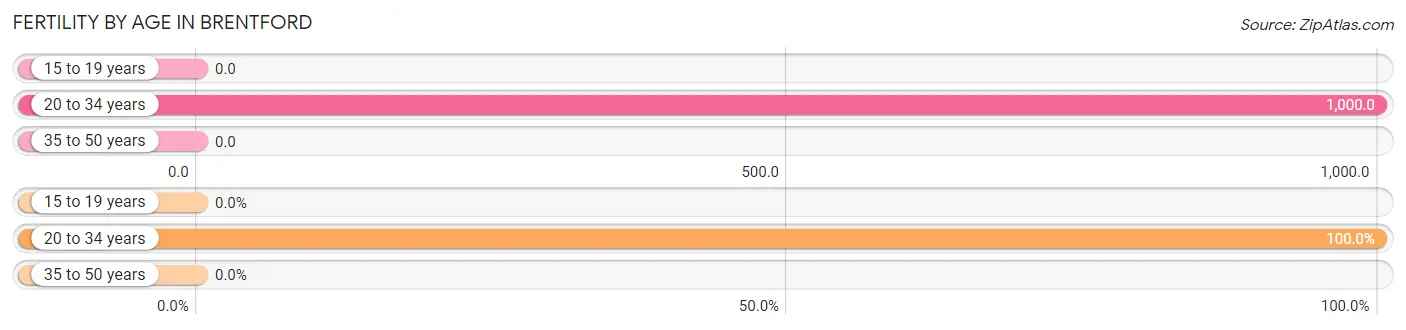
| Age Bracket | Women with Births | Births / 1,000 Women |
| 15 to 19 years | 0 (0.0%) | 0.0 |
| 20 to 34 years | 1 (100.0%) | 1,000.0 |
| 35 to 50 years | 0 (0.0%) | 0.0 |
| Total | 1 (100.0%) | 250.0 |
Fertility by Age by Marriage Status in Brentford
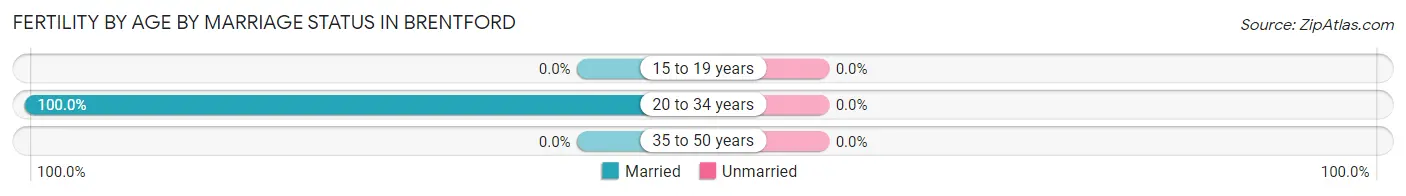
| Age Bracket | Married | Unmarried |
| 15 to 19 years | 0 (0.0%) | 0 (0.0%) |
| 20 to 34 years | 1 (100.0%) | 0 (0.0%) |
| 35 to 50 years | 0 (0.0%) | 0 (0.0%) |
| Total | 1 (100.0%) | 0 (0.0%) |
Fertility by Education in Brentford
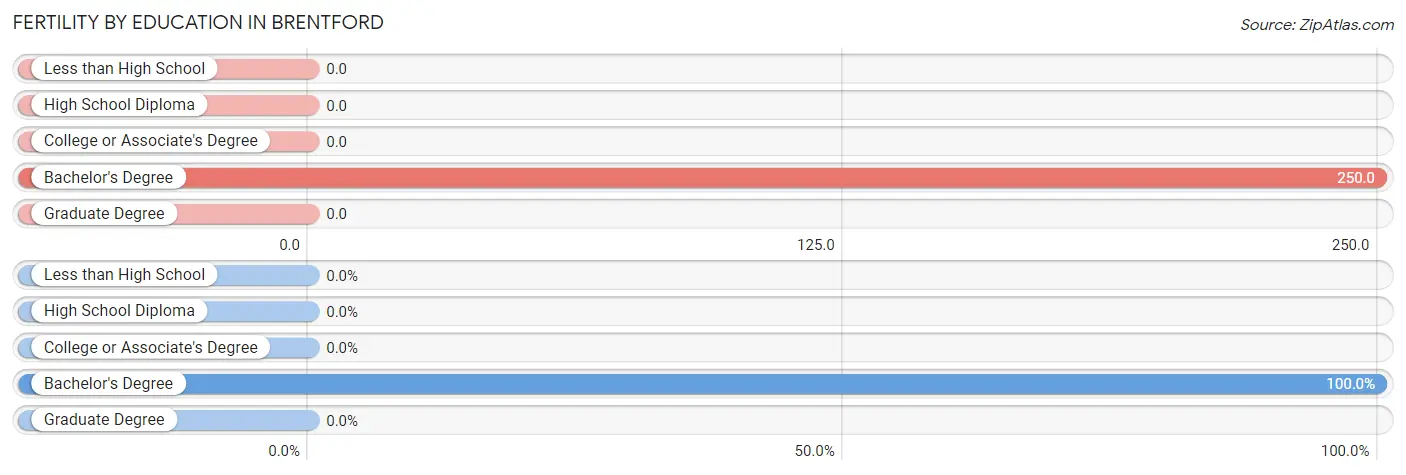
| Educational Attainment | Women with Births | Births / 1,000 Women |
| Less than High School | 0 (0.0%) | 0.0 |
| High School Diploma | 0 (0.0%) | 0.0 |
| College or Associate's Degree | 0 (0.0%) | 0.0 |
| Bachelor's Degree | 1 (100.0%) | 250.0 |
| Graduate Degree | 0 (0.0%) | 0.0 |
| Total | 1 (100.0%) | 250.0 |
Fertility by Education by Marriage Status in Brentford
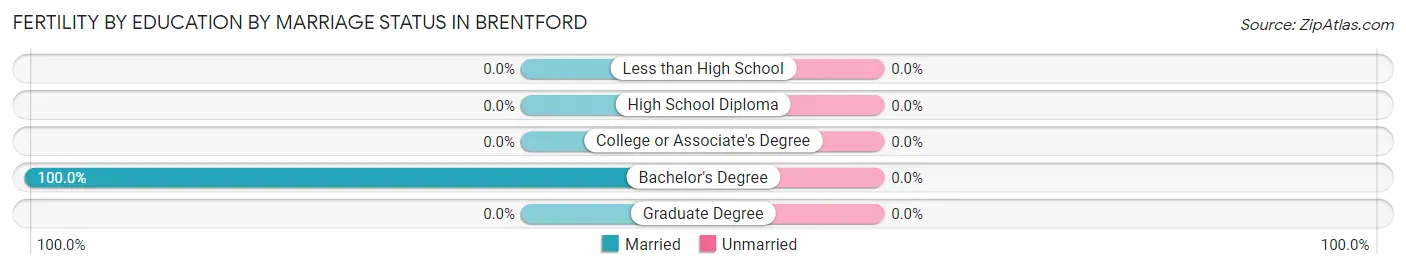
| Educational Attainment | Married | Unmarried |
| Less than High School | 0 (0.0%) | 0 (0.0%) |
| High School Diploma | 0 (0.0%) | 0 (0.0%) |
| College or Associate's Degree | 0 (0.0%) | 0 (0.0%) |
| Bachelor's Degree | 1 (100.0%) | 0 (0.0%) |
| Graduate Degree | 0 (0.0%) | 0 (0.0%) |
| Total | 1 (100.0%) | 0 (0.0%) |
Employment Characteristics in Brentford
Employment by Class of Employer in Brentford
Among the 41 employed individuals in Brentford, private company employees (29 | 70.7%), not-for-profit organizations (7 | 17.1%), and self-employed (not incorporated) (5 | 12.2%) make up the most common classes of employment.
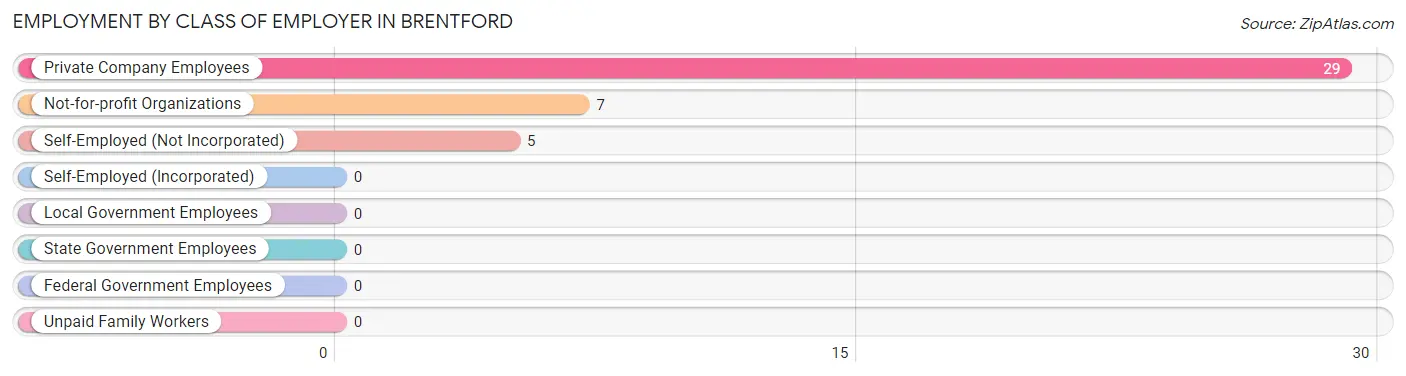
| Employer Class | # Employees | % Employees |
| Private Company Employees | 29 | 70.7% |
| Self-Employed (Incorporated) | 0 | 0.0% |
| Self-Employed (Not Incorporated) | 5 | 12.2% |
| Not-for-profit Organizations | 7 | 17.1% |
| Local Government Employees | 0 | 0.0% |
| State Government Employees | 0 | 0.0% |
| Federal Government Employees | 0 | 0.0% |
| Unpaid Family Workers | 0 | 0.0% |
| Total | 41 | 100.0% |
Employment Status by Age in Brentford
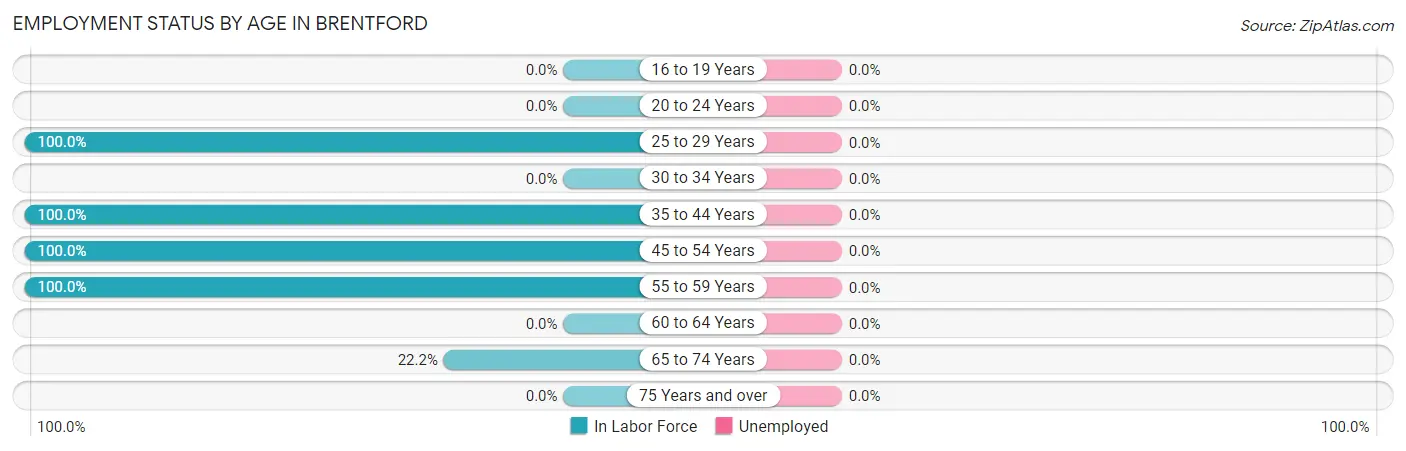
| Age Bracket | In Labor Force | Unemployed |
| 16 to 19 Years | 0 (0.0%) | 0 (0.0%) |
| 20 to 24 Years | 0 (0.0%) | 0 (0.0%) |
| 25 to 29 Years | 2 (100.0%) | 0 (0.0%) |
| 30 to 34 Years | 0 (0.0%) | 0 (0.0%) |
| 35 to 44 Years | 6 (100.0%) | 0 (0.0%) |
| 45 to 54 Years | 6 (100.0%) | 0 (0.0%) |
| 55 to 59 Years | 25 (100.0%) | 0 (0.0%) |
| 60 to 64 Years | 0 (0.0%) | 0 (0.0%) |
| 65 to 74 Years | 2 (22.2%) | 0 (0.0%) |
| 75 Years and over | 0 (0.0%) | 0 (0.0%) |
| Total | 41 (66.1%) | 0 (0.0%) |
Employment Status by Educational Attainment in Brentford
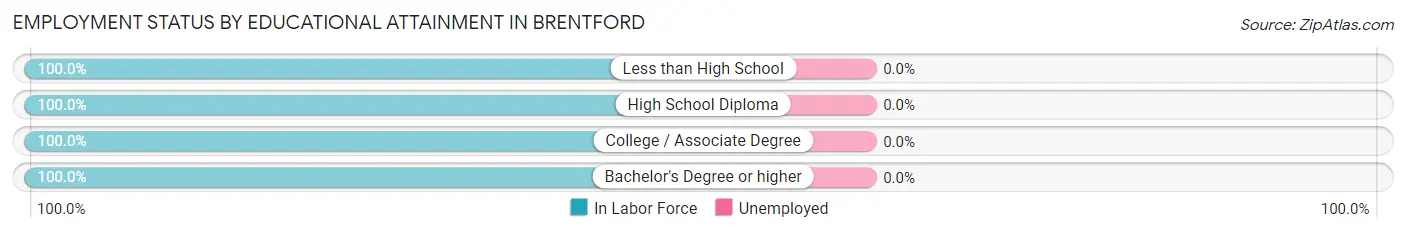
| Educational Attainment | In Labor Force | Unemployed |
| Less than High School | 7 (100.0%) | 0 (0.0%) |
| High School Diploma | 7 (100.0%) | 0 (0.0%) |
| College / Associate Degree | 18 (100.0%) | 0 (0.0%) |
| Bachelor's Degree or higher | 7 (100.0%) | 0 (0.0%) |
| Total | 39 (100.0%) | 0 (0.0%) |
Employment Occupations by Sex in Brentford
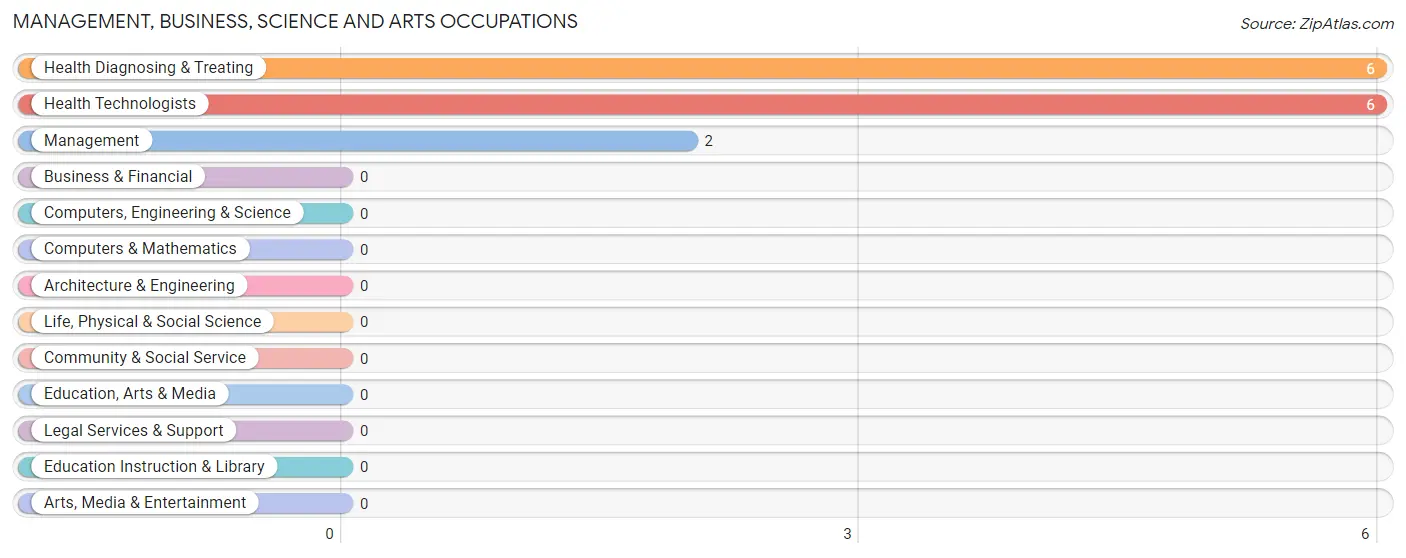
Management, Business, Science and Arts Occupations
The most common Management, Business, Science and Arts occupations in Brentford are Health Diagnosing & Treating (6 | 14.6%), Health Technologists (6 | 14.6%), and Management (2 | 4.9%).
Management, Business, Science and Arts Occupations by Sex
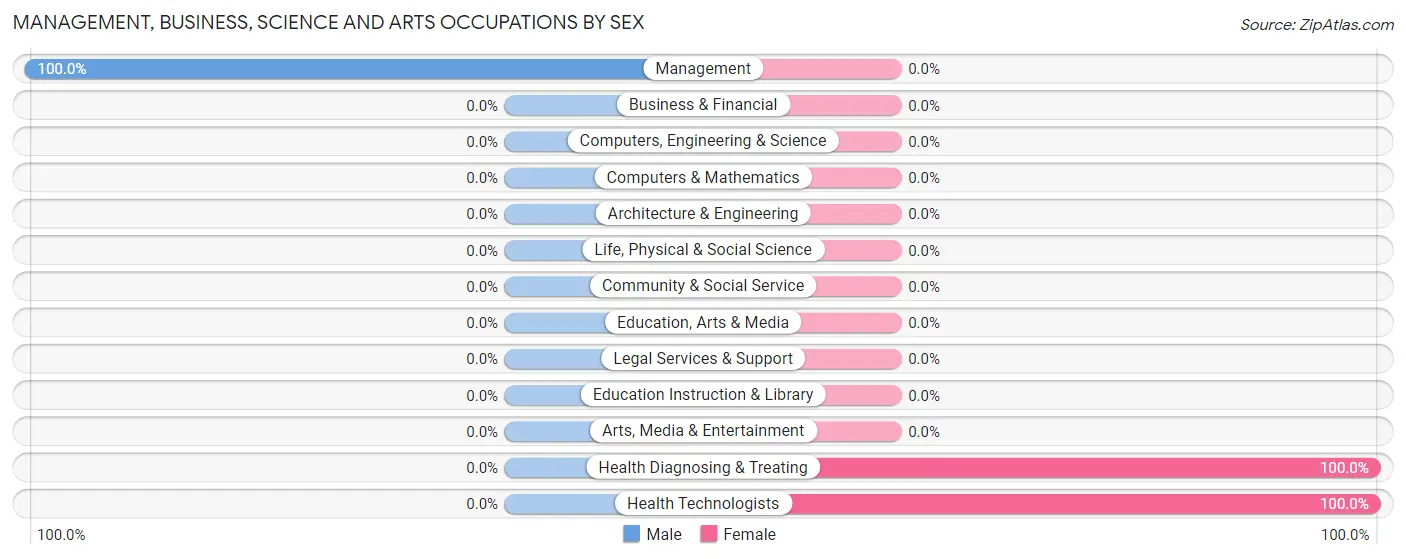
| Occupation | Male | Female |
| Management | 2 (100.0%) | 0 (0.0%) |
| Business & Financial | 0 (0.0%) | 0 (0.0%) |
| Computers, Engineering & Science | 0 (0.0%) | 0 (0.0%) |
| Computers & Mathematics | 0 (0.0%) | 0 (0.0%) |
| Architecture & Engineering | 0 (0.0%) | 0 (0.0%) |
| Life, Physical & Social Science | 0 (0.0%) | 0 (0.0%) |
| Community & Social Service | 0 (0.0%) | 0 (0.0%) |
| Education, Arts & Media | 0 (0.0%) | 0 (0.0%) |
| Legal Services & Support | 0 (0.0%) | 0 (0.0%) |
| Education Instruction & Library | 0 (0.0%) | 0 (0.0%) |
| Arts, Media & Entertainment | 0 (0.0%) | 0 (0.0%) |
| Health Diagnosing & Treating | 0 (0.0%) | 6 (100.0%) |
| Health Technologists | 0 (0.0%) | 6 (100.0%) |
| Total (Category) | 2 (25.0%) | 6 (75.0%) |
| Total (Overall) | 22 (53.7%) | 19 (46.3%) |
Services Occupations
The most common Services occupations in Brentford are , and Personal Care & Service (1 | 2.4%).
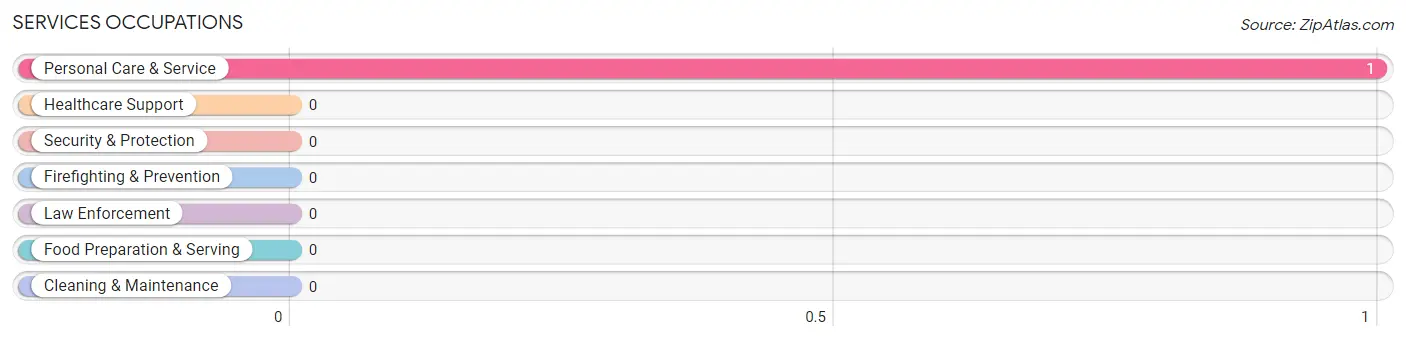
Services Occupations by Sex
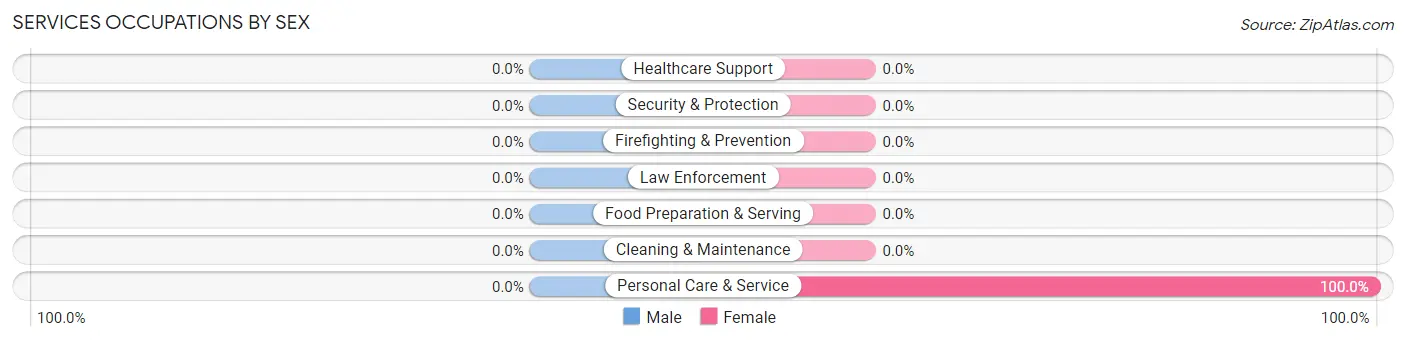
| Occupation | Male | Female |
| Healthcare Support | 0 (0.0%) | 0 (0.0%) |
| Security & Protection | 0 (0.0%) | 0 (0.0%) |
| Firefighting & Prevention | 0 (0.0%) | 0 (0.0%) |
| Law Enforcement | 0 (0.0%) | 0 (0.0%) |
| Food Preparation & Serving | 0 (0.0%) | 0 (0.0%) |
| Cleaning & Maintenance | 0 (0.0%) | 0 (0.0%) |
| Personal Care & Service | 0 (0.0%) | 1 (100.0%) |
| Total (Category) | 0 (0.0%) | 1 (100.0%) |
| Total (Overall) | 22 (53.7%) | 19 (46.3%) |
Sales and Office Occupations
The most common Sales and Office occupations in Brentford are Sales & Related (9 | 22.0%), and Office & Administration (3 | 7.3%).
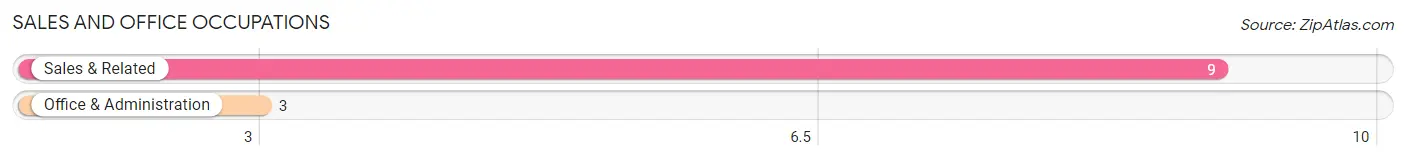
Sales and Office Occupations by Sex
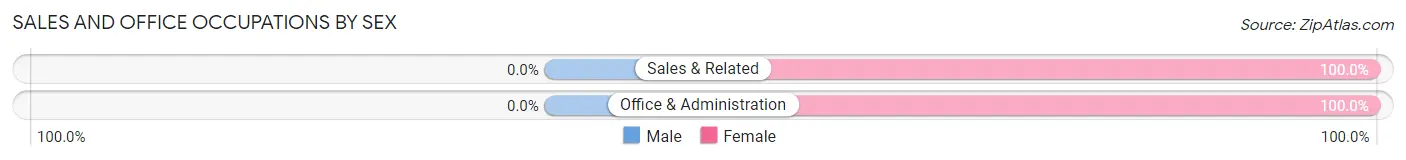
| Occupation | Male | Female |
| Sales & Related | 0 (0.0%) | 9 (100.0%) |
| Office & Administration | 0 (0.0%) | 3 (100.0%) |
| Total (Category) | 0 (0.0%) | 12 (100.0%) |
| Total (Overall) | 22 (53.7%) | 19 (46.3%) |
Natural Resources, Construction and Maintenance Occupations
The most common Natural Resources, Construction and Maintenance occupations in Brentford are , and Construction & Extraction (8 | 19.5%).
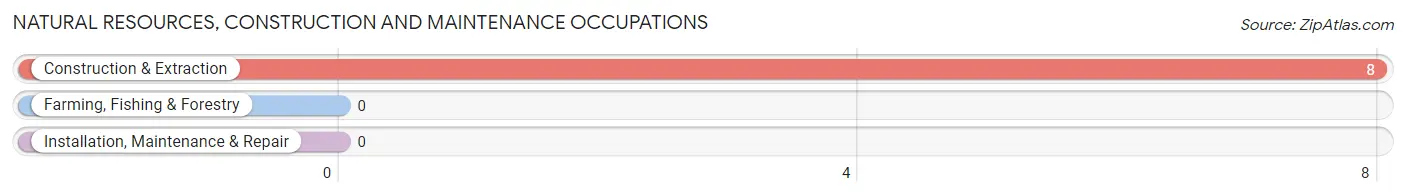
Natural Resources, Construction and Maintenance Occupations by Sex
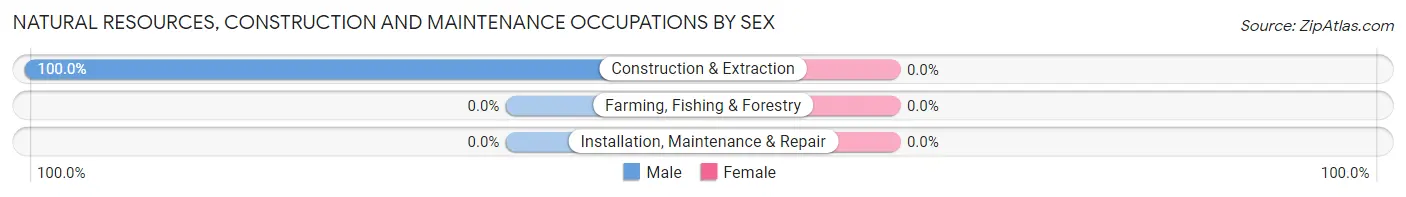
| Occupation | Male | Female |
| Farming, Fishing & Forestry | 0 (0.0%) | 0 (0.0%) |
| Construction & Extraction | 8 (100.0%) | 0 (0.0%) |
| Installation, Maintenance & Repair | 0 (0.0%) | 0 (0.0%) |
| Total (Category) | 8 (100.0%) | 0 (0.0%) |
| Total (Overall) | 22 (53.7%) | 19 (46.3%) |
Production, Transportation and Moving Occupations
The most common Production, Transportation and Moving occupations in Brentford are Production (11 | 26.8%), and Transportation (1 | 2.4%).
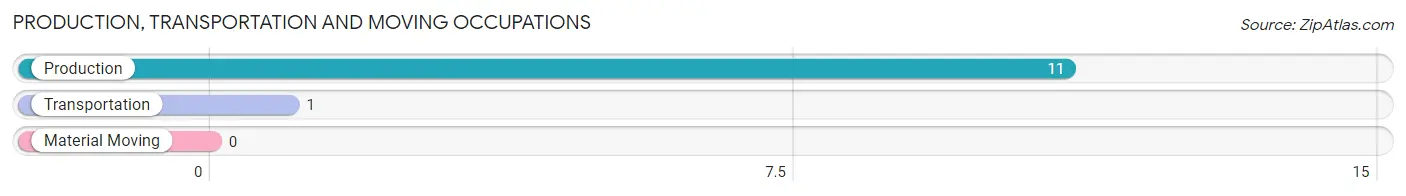
Production, Transportation and Moving Occupations by Sex
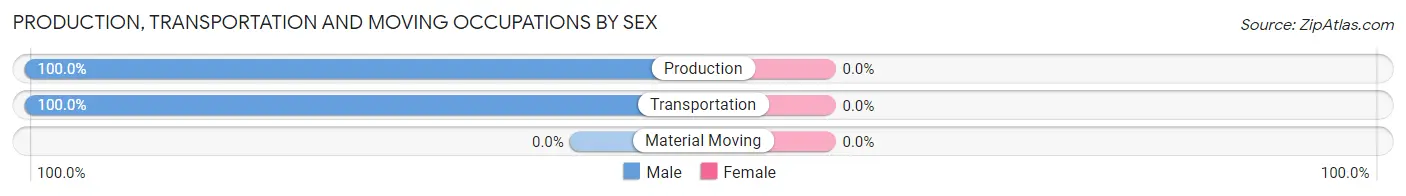
| Occupation | Male | Female |
| Production | 11 (100.0%) | 0 (0.0%) |
| Transportation | 1 (100.0%) | 0 (0.0%) |
| Material Moving | 0 (0.0%) | 0 (0.0%) |
| Total (Category) | 12 (100.0%) | 0 (0.0%) |
| Total (Overall) | 22 (53.7%) | 19 (46.3%) |
Employment Industries by Sex in Brentford
Employment Industries in Brentford
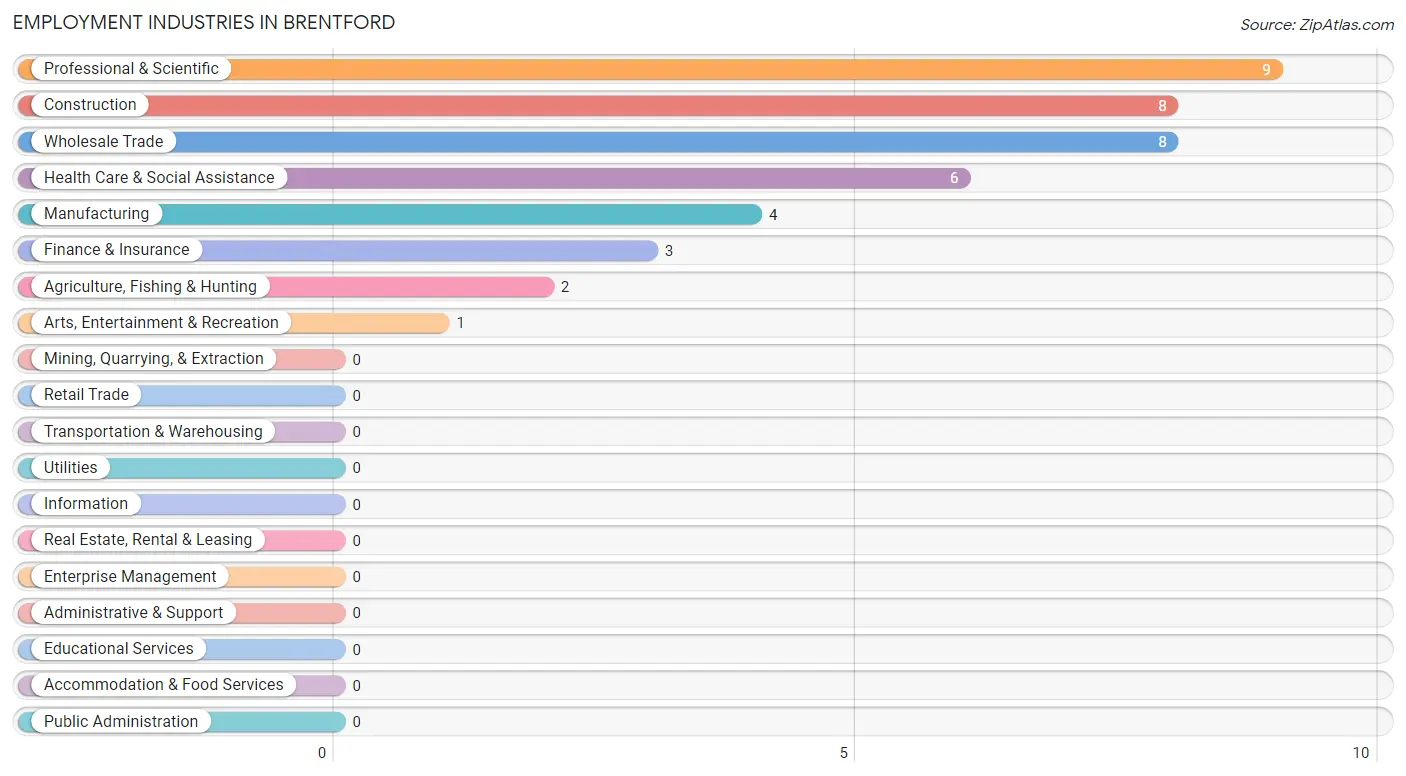
The major employment industries in Brentford include Professional & Scientific (9 | 22.0%), Construction (8 | 19.5%), Wholesale Trade (8 | 19.5%), Health Care & Social Assistance (6 | 14.6%), and Manufacturing (4 | 9.8%).
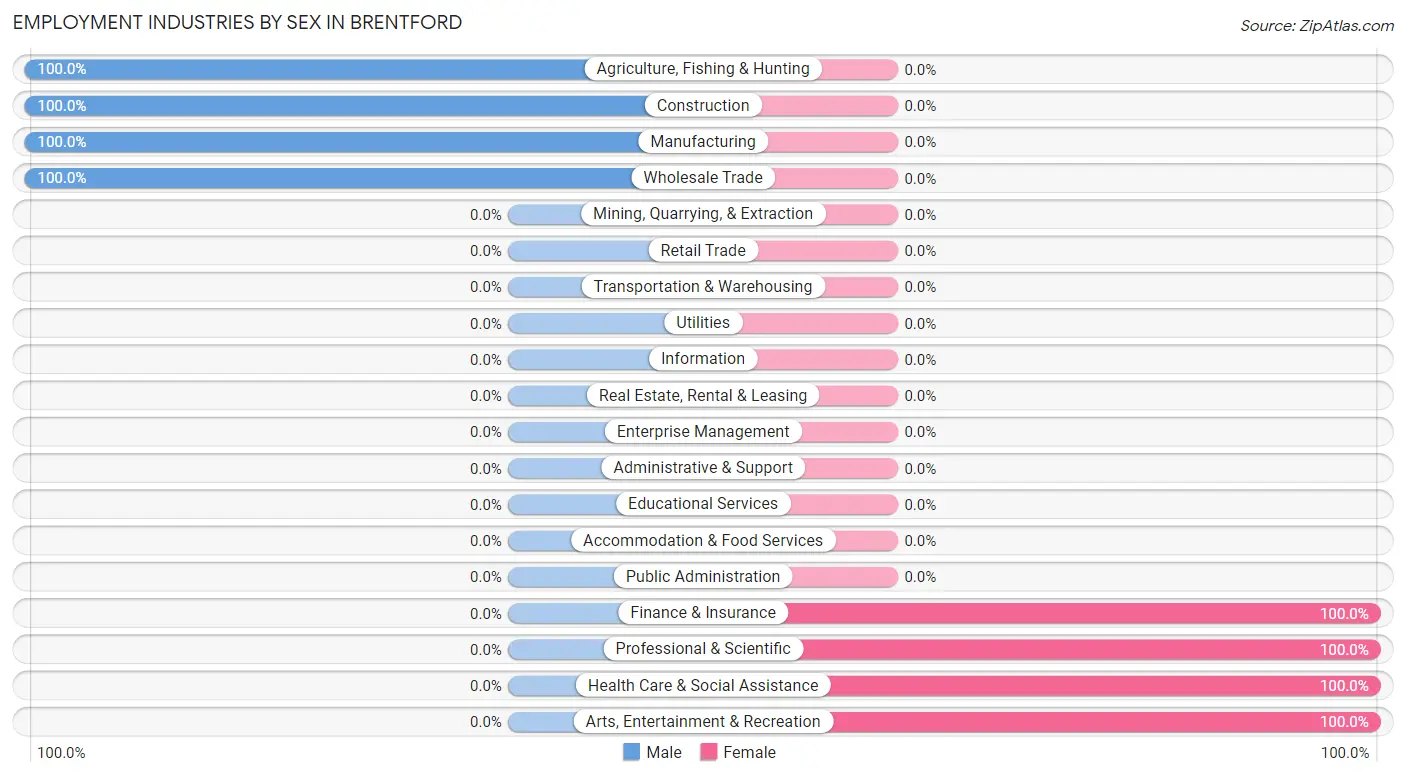
Employment Industries by Sex in Brentford
The Brentford industries that see more men than women are Agriculture, Fishing & Hunting (100.0%), Construction (100.0%), and Manufacturing (100.0%), whereas the industries that tend to have a higher number of women are Finance & Insurance (100.0%), Professional & Scientific (100.0%), and Health Care & Social Assistance (100.0%).
| Industry | Male | Female |
| Agriculture, Fishing & Hunting | 2 (100.0%) | 0 (0.0%) |
| Mining, Quarrying, & Extraction | 0 (0.0%) | 0 (0.0%) |
| Construction | 8 (100.0%) | 0 (0.0%) |
| Manufacturing | 4 (100.0%) | 0 (0.0%) |
| Wholesale Trade | 8 (100.0%) | 0 (0.0%) |
| Retail Trade | 0 (0.0%) | 0 (0.0%) |
| Transportation & Warehousing | 0 (0.0%) | 0 (0.0%) |
| Utilities | 0 (0.0%) | 0 (0.0%) |
| Information | 0 (0.0%) | 0 (0.0%) |
| Finance & Insurance | 0 (0.0%) | 3 (100.0%) |
| Real Estate, Rental & Leasing | 0 (0.0%) | 0 (0.0%) |
| Professional & Scientific | 0 (0.0%) | 9 (100.0%) |
| Enterprise Management | 0 (0.0%) | 0 (0.0%) |
| Administrative & Support | 0 (0.0%) | 0 (0.0%) |
| Educational Services | 0 (0.0%) | 0 (0.0%) |
| Health Care & Social Assistance | 0 (0.0%) | 6 (100.0%) |
| Arts, Entertainment & Recreation | 0 (0.0%) | 1 (100.0%) |
| Accommodation & Food Services | 0 (0.0%) | 0 (0.0%) |
| Public Administration | 0 (0.0%) | 0 (0.0%) |
| Total | 22 (53.7%) | 19 (46.3%) |
Education in Brentford
School Enrollment in Brentford
| School Level | # Students | % Students |
| Nursery / Preschool | 0 | 0.0% |
| Kindergarten | 0 | 0.0% |
| Elementary School | 0 | 0.0% |
| Middle School | 0 | 0.0% |
| High School | 0 | 0.0% |
| College / Undergraduate | 0 | 0.0% |
| Graduate / Professional | 0 | 0.0% |
| Total | 0 | 0.0% |
School Enrollment by Age by Funding Source in Brentford
| Age Bracket | Public School | Private School |
| 3 to 4 Year Olds | 0 (0.0%) | 0 (0.0%) |
| 5 to 9 Year Old | 0 (0.0%) | 0 (0.0%) |
| 10 to 14 Year Olds | 0 (0.0%) | 0 (0.0%) |
| 15 to 17 Year Olds | 0 (0.0%) | 0 (0.0%) |
| 18 to 19 Year Olds | 0 (0.0%) | 0 (0.0%) |
| 20 to 24 Year Olds | 0 (0.0%) | 0 (0.0%) |
| 25 to 34 Year Olds | 0 (0.0%) | 0 (0.0%) |
| 35 Years and over | 0 (0.0%) | 0 (0.0%) |
| Total | 0 (0.0%) | 0 (0.0%) |
Educational Attainment by Field of Study in Brentford
Education (9 | 69.2%), multidisciplinary studies (3 | 23.1%), and arts & humanities (1 | 7.7%) are the most common fields of study among 13 individuals in Brentford who have obtained a bachelor's degree or higher.
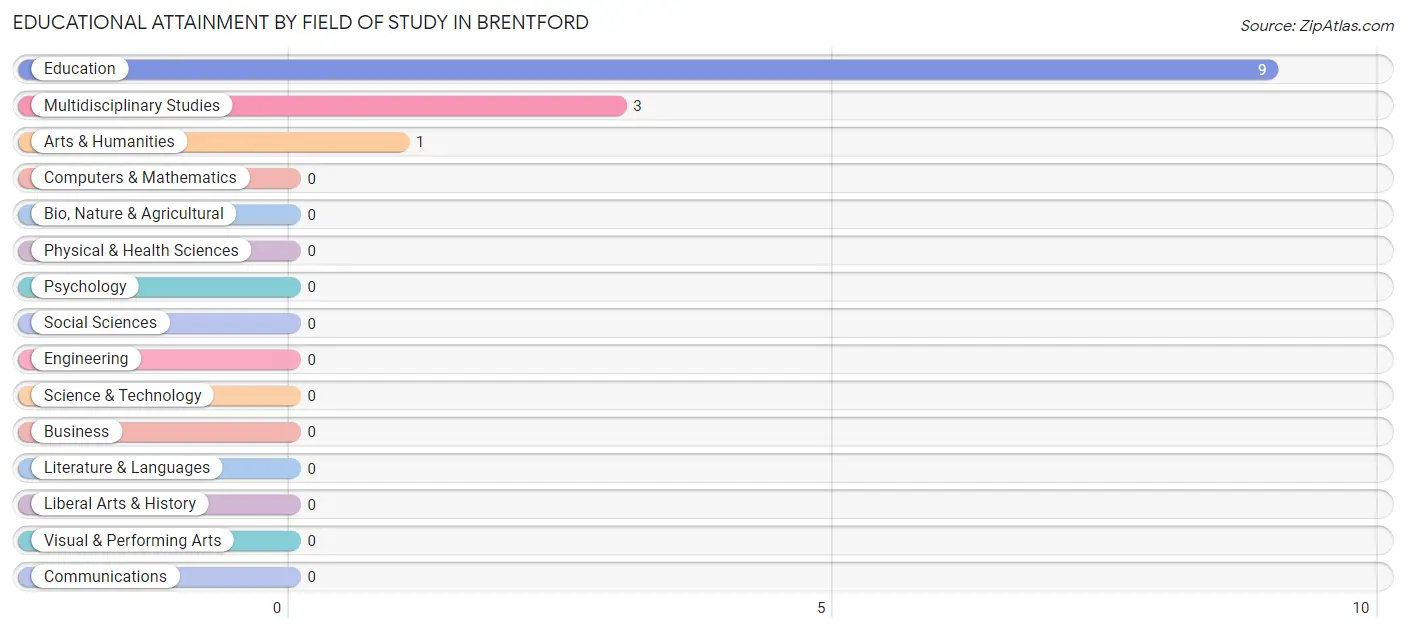
| Field of Study | # Graduates | % Graduates |
| Computers & Mathematics | 0 | 0.0% |
| Bio, Nature & Agricultural | 0 | 0.0% |
| Physical & Health Sciences | 0 | 0.0% |
| Psychology | 0 | 0.0% |
| Social Sciences | 0 | 0.0% |
| Engineering | 0 | 0.0% |
| Multidisciplinary Studies | 3 | 23.1% |
| Science & Technology | 0 | 0.0% |
| Business | 0 | 0.0% |
| Education | 9 | 69.2% |
| Literature & Languages | 0 | 0.0% |
| Liberal Arts & History | 0 | 0.0% |
| Visual & Performing Arts | 0 | 0.0% |
| Communications | 0 | 0.0% |
| Arts & Humanities | 1 | 7.7% |
| Total | 13 | 100.0% |
Transportation & Commute in Brentford
Vehicle Availability by Sex in Brentford
The most prevalent vehicle ownership categories in Brentford are males with 3 vehicles (9, accounting for 40.9%) and females with 3 vehicles (16, making up 47.4%).
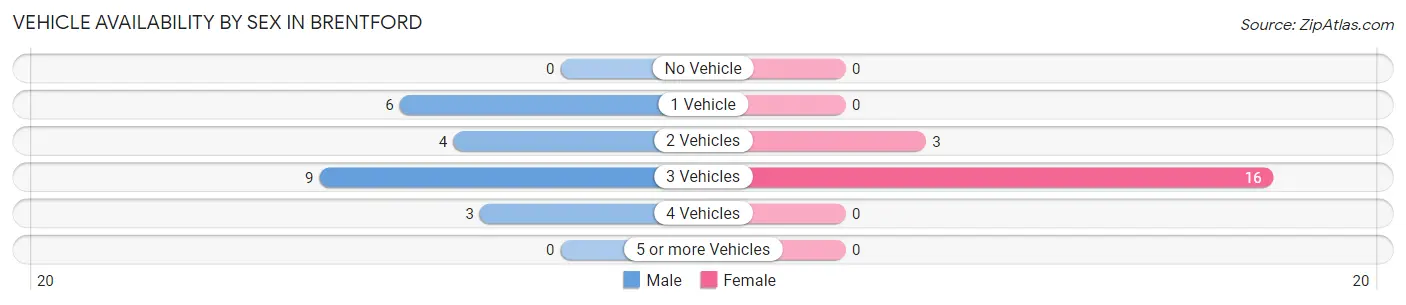
| Vehicles Available | Male | Female |
| No Vehicle | 0 (0.0%) | 0 (0.0%) |
| 1 Vehicle | 6 (27.3%) | 0 (0.0%) |
| 2 Vehicles | 4 (18.2%) | 3 (15.8%) |
| 3 Vehicles | 9 (40.9%) | 16 (84.2%) |
| 4 Vehicles | 3 (13.6%) | 0 (0.0%) |
| 5 or more Vehicles | 0 (0.0%) | 0 (0.0%) |
| Total | 22 (100.0%) | 19 (100.0%) |
Commute Time in Brentford
The most frequently occuring commute durations in Brentford are 10 to 14 minutes (7 commuters, 21.9%), 30 to 34 minutes (7 commuters, 21.9%), and 60 to 89 minutes (6 commuters, 18.8%).
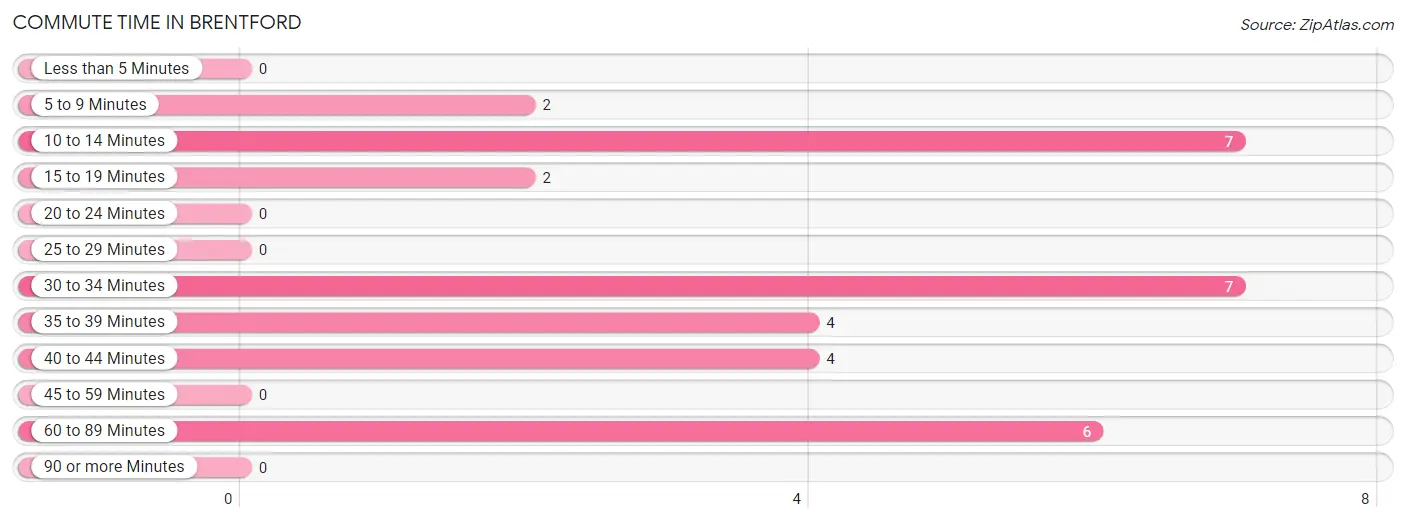
| Commute Time | # Commuters | % Commuters |
| Less than 5 Minutes | 0 | 0.0% |
| 5 to 9 Minutes | 2 | 6.2% |
| 10 to 14 Minutes | 7 | 21.9% |
| 15 to 19 Minutes | 2 | 6.2% |
| 20 to 24 Minutes | 0 | 0.0% |
| 25 to 29 Minutes | 0 | 0.0% |
| 30 to 34 Minutes | 7 | 21.9% |
| 35 to 39 Minutes | 4 | 12.5% |
| 40 to 44 Minutes | 4 | 12.5% |
| 45 to 59 Minutes | 0 | 0.0% |
| 60 to 89 Minutes | 6 | 18.8% |
| 90 or more Minutes | 0 | 0.0% |
Commute Time by Sex in Brentford
The most common commute times in Brentford are 10 to 14 minutes (7 commuters, 31.8%) for males and 60 to 89 minutes (6 commuters, 60.0%) for females.
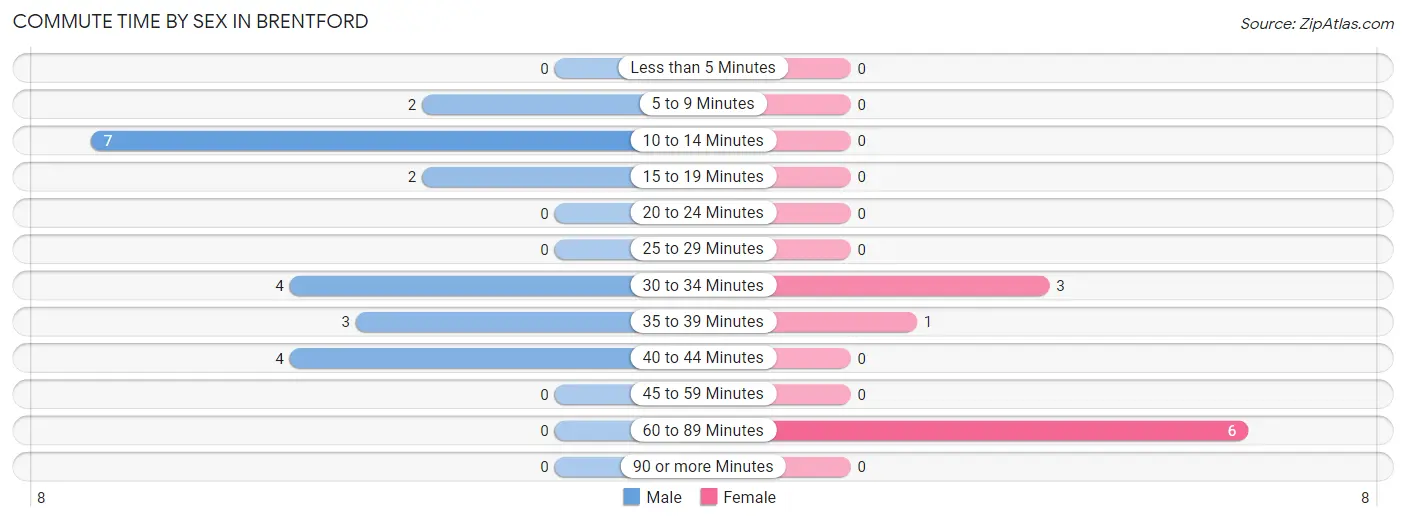
| Commute Time | Male | Female |
| Less than 5 Minutes | 0 (0.0%) | 0 (0.0%) |
| 5 to 9 Minutes | 2 (9.1%) | 0 (0.0%) |
| 10 to 14 Minutes | 7 (31.8%) | 0 (0.0%) |
| 15 to 19 Minutes | 2 (9.1%) | 0 (0.0%) |
| 20 to 24 Minutes | 0 (0.0%) | 0 (0.0%) |
| 25 to 29 Minutes | 0 (0.0%) | 0 (0.0%) |
| 30 to 34 Minutes | 4 (18.2%) | 3 (30.0%) |
| 35 to 39 Minutes | 3 (13.6%) | 1 (10.0%) |
| 40 to 44 Minutes | 4 (18.2%) | 0 (0.0%) |
| 45 to 59 Minutes | 0 (0.0%) | 0 (0.0%) |
| 60 to 89 Minutes | 0 (0.0%) | 6 (60.0%) |
| 90 or more Minutes | 0 (0.0%) | 0 (0.0%) |
Time of Departure to Work by Sex in Brentford
The most frequent times of departure to work in Brentford are 6:30 AM to 6:59 AM (10, 45.5%) for males and 7:00 AM to 7:29 AM (7, 70.0%) for females.
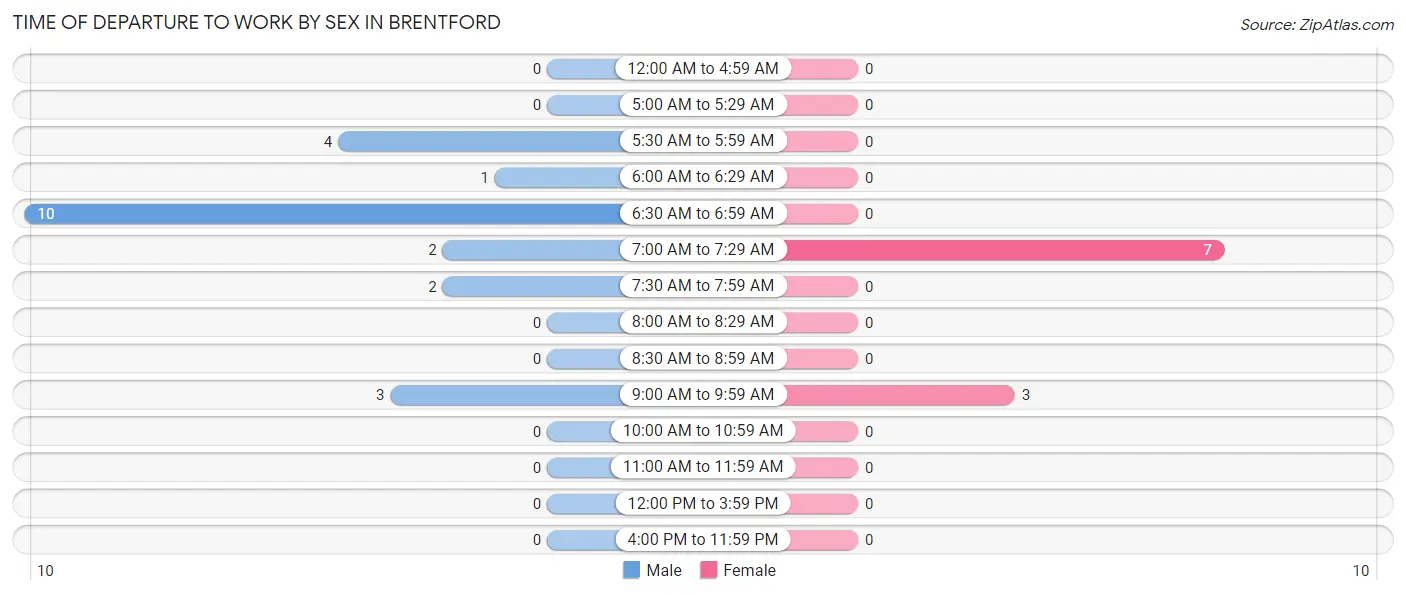
| Time of Departure | Male | Female |
| 12:00 AM to 4:59 AM | 0 (0.0%) | 0 (0.0%) |
| 5:00 AM to 5:29 AM | 0 (0.0%) | 0 (0.0%) |
| 5:30 AM to 5:59 AM | 4 (18.2%) | 0 (0.0%) |
| 6:00 AM to 6:29 AM | 1 (4.5%) | 0 (0.0%) |
| 6:30 AM to 6:59 AM | 10 (45.5%) | 0 (0.0%) |
| 7:00 AM to 7:29 AM | 2 (9.1%) | 7 (70.0%) |
| 7:30 AM to 7:59 AM | 2 (9.1%) | 0 (0.0%) |
| 8:00 AM to 8:29 AM | 0 (0.0%) | 0 (0.0%) |
| 8:30 AM to 8:59 AM | 0 (0.0%) | 0 (0.0%) |
| 9:00 AM to 9:59 AM | 3 (13.6%) | 3 (30.0%) |
| 10:00 AM to 10:59 AM | 0 (0.0%) | 0 (0.0%) |
| 11:00 AM to 11:59 AM | 0 (0.0%) | 0 (0.0%) |
| 12:00 PM to 3:59 PM | 0 (0.0%) | 0 (0.0%) |
| 4:00 PM to 11:59 PM | 0 (0.0%) | 0 (0.0%) |
| Total | 22 (100.0%) | 10 (100.0%) |
Housing Occupancy in Brentford
Occupancy by Ownership in Brentford
Of the total 45 dwellings in Brentford, owner-occupied units account for 41 (91.1%), while renter-occupied units make up 4 (8.9%).
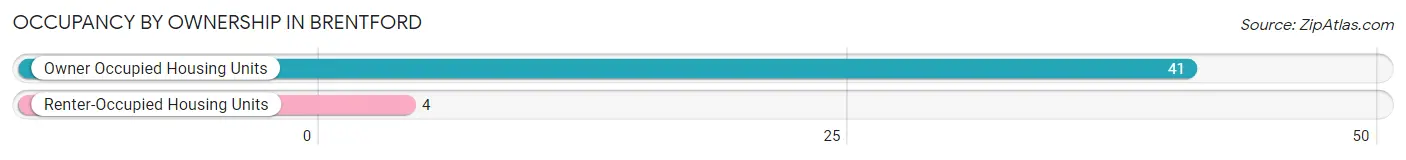
| Occupancy | # Housing Units | % Housing Units |
| Owner Occupied Housing Units | 41 | 91.1% |
| Renter-Occupied Housing Units | 4 | 8.9% |
| Total Occupied Housing Units | 45 | 100.0% |
Occupancy by Household Size in Brentford
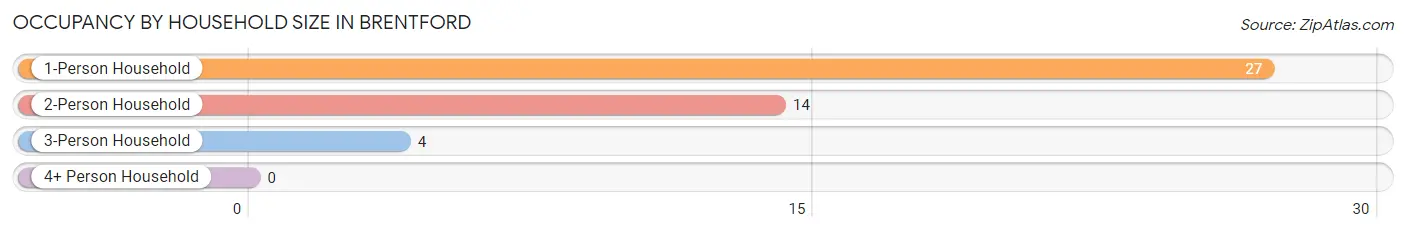
| Household Size | # Housing Units | % Housing Units |
| 1-Person Household | 27 | 60.0% |
| 2-Person Household | 14 | 31.1% |
| 3-Person Household | 4 | 8.9% |
| 4+ Person Household | 0 | 0.0% |
| Total Housing Units | 45 | 100.0% |
Occupancy by Ownership by Household Size in Brentford
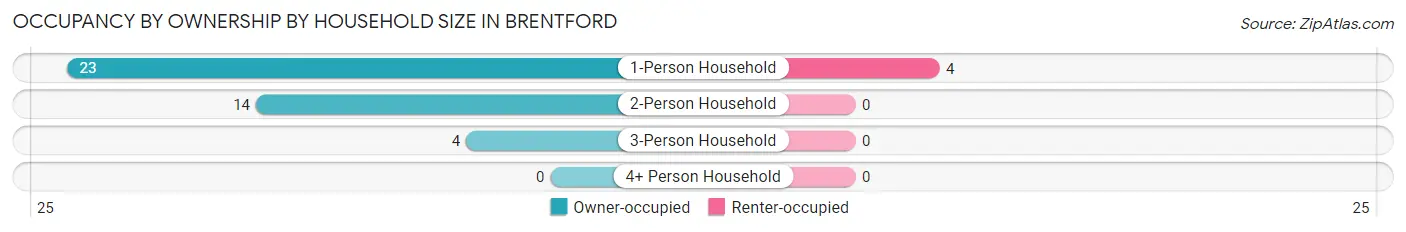
| Household Size | Owner-occupied | Renter-occupied |
| 1-Person Household | 23 (85.2%) | 4 (14.8%) |
| 2-Person Household | 14 (100.0%) | 0 (0.0%) |
| 3-Person Household | 4 (100.0%) | 0 (0.0%) |
| 4+ Person Household | 0 (0.0%) | 0 (0.0%) |
| Total Housing Units | 41 (91.1%) | 4 (8.9%) |
Occupancy by Educational Attainment in Brentford
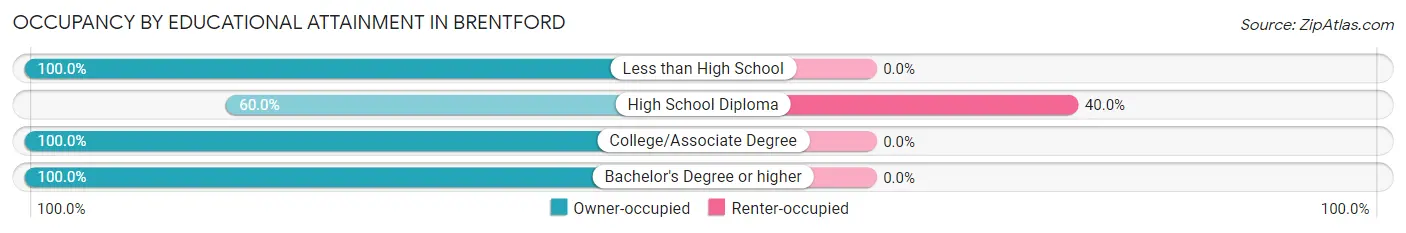
| Household Size | Owner-occupied | Renter-occupied |
| Less than High School | 8 (100.0%) | 0 (0.0%) |
| High School Diploma | 6 (60.0%) | 4 (40.0%) |
| College/Associate Degree | 23 (100.0%) | 0 (0.0%) |
| Bachelor's Degree or higher | 4 (100.0%) | 0 (0.0%) |
Occupancy by Age of Householder in Brentford
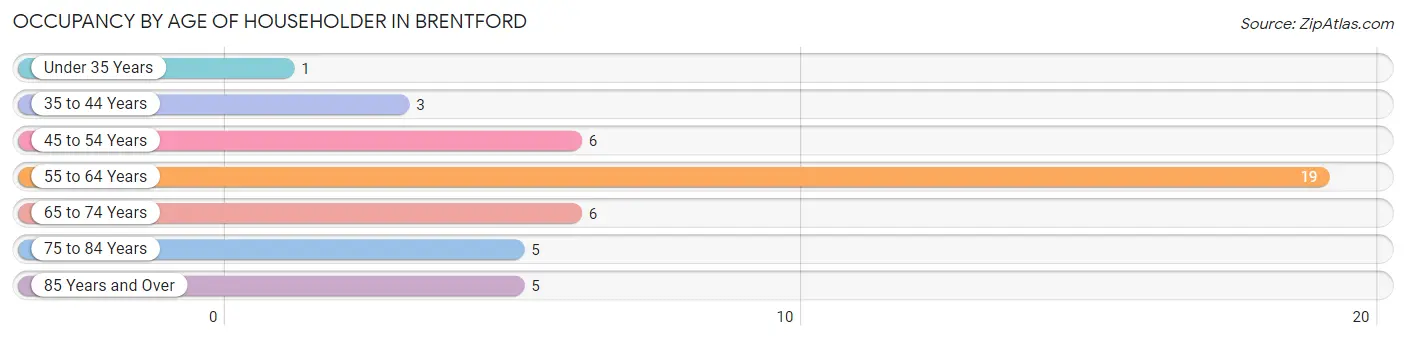
| Age Bracket | # Households | % Households |
| Under 35 Years | 1 | 2.2% |
| 35 to 44 Years | 3 | 6.7% |
| 45 to 54 Years | 6 | 13.3% |
| 55 to 64 Years | 19 | 42.2% |
| 65 to 74 Years | 6 | 13.3% |
| 75 to 84 Years | 5 | 11.1% |
| 85 Years and Over | 5 | 11.1% |
| Total | 45 | 100.0% |
Housing Finances in Brentford
Median Income by Occupancy in Brentford
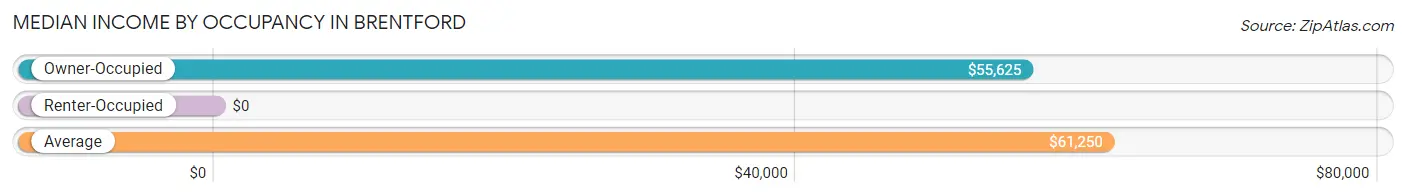
| Occupancy Type | # Households | Median Income |
| Owner-Occupied | 41 (91.1%) | $55,625 |
| Renter-Occupied | 4 (8.9%) | $0 |
| Average | 45 (100.0%) | $61,250 |
Occupancy by Householder Income Bracket in Brentford
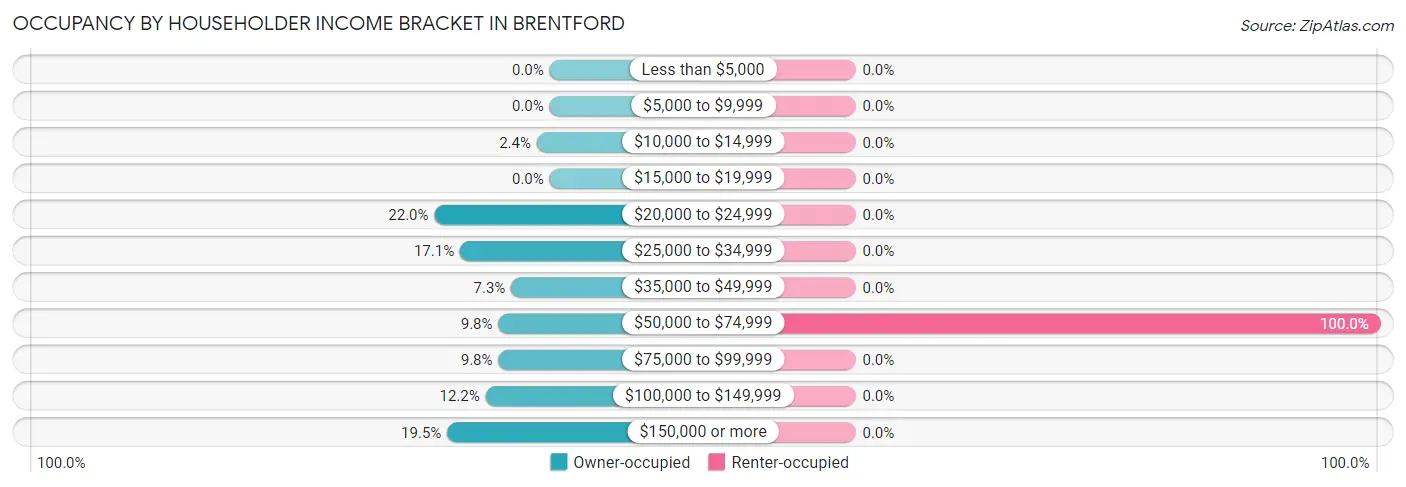
| Income Bracket | Owner-occupied | Renter-occupied |
| Less than $5,000 | 0 (0.0%) | 0 (0.0%) |
| $5,000 to $9,999 | 0 (0.0%) | 0 (0.0%) |
| $10,000 to $14,999 | 1 (2.4%) | 0 (0.0%) |
| $15,000 to $19,999 | 0 (0.0%) | 0 (0.0%) |
| $20,000 to $24,999 | 9 (22.0%) | 0 (0.0%) |
| $25,000 to $34,999 | 7 (17.1%) | 0 (0.0%) |
| $35,000 to $49,999 | 3 (7.3%) | 0 (0.0%) |
| $50,000 to $74,999 | 4 (9.8%) | 4 (100.0%) |
| $75,000 to $99,999 | 4 (9.8%) | 0 (0.0%) |
| $100,000 to $149,999 | 5 (12.2%) | 0 (0.0%) |
| $150,000 or more | 8 (19.5%) | 0 (0.0%) |
| Total | 41 (100.0%) | 4 (100.0%) |
Monthly Housing Cost Tiers in Brentford
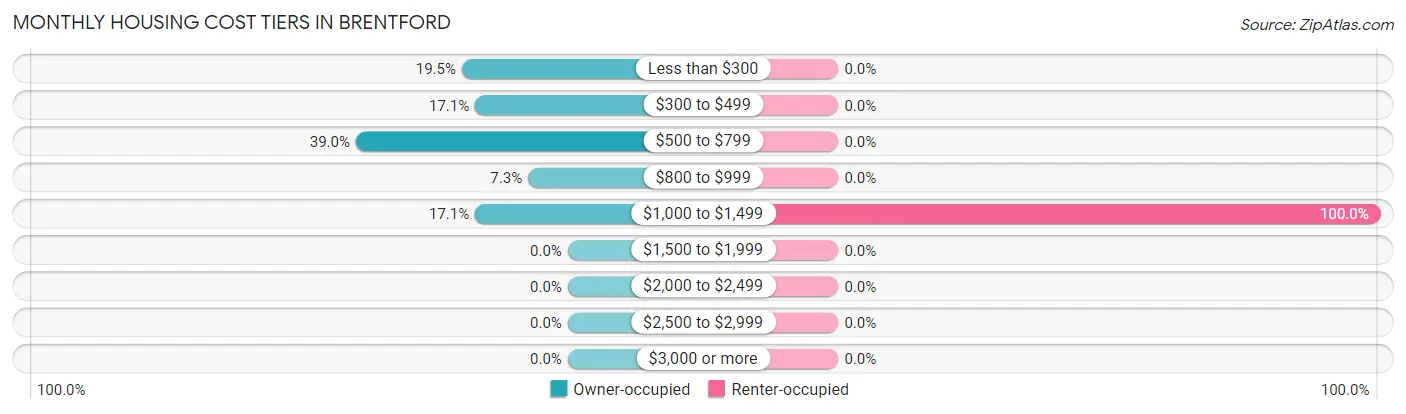
| Monthly Cost | Owner-occupied | Renter-occupied |
| Less than $300 | 8 (19.5%) | 0 (0.0%) |
| $300 to $499 | 7 (17.1%) | 0 (0.0%) |
| $500 to $799 | 16 (39.0%) | 0 (0.0%) |
| $800 to $999 | 3 (7.3%) | 0 (0.0%) |
| $1,000 to $1,499 | 7 (17.1%) | 4 (100.0%) |
| $1,500 to $1,999 | 0 (0.0%) | 0 (0.0%) |
| $2,000 to $2,499 | 0 (0.0%) | 0 (0.0%) |
| $2,500 to $2,999 | 0 (0.0%) | 0 (0.0%) |
| $3,000 or more | 0 (0.0%) | 0 (0.0%) |
| Total | 41 (100.0%) | 4 (100.0%) |
Physical Housing Characteristics in Brentford
Housing Structures in Brentford
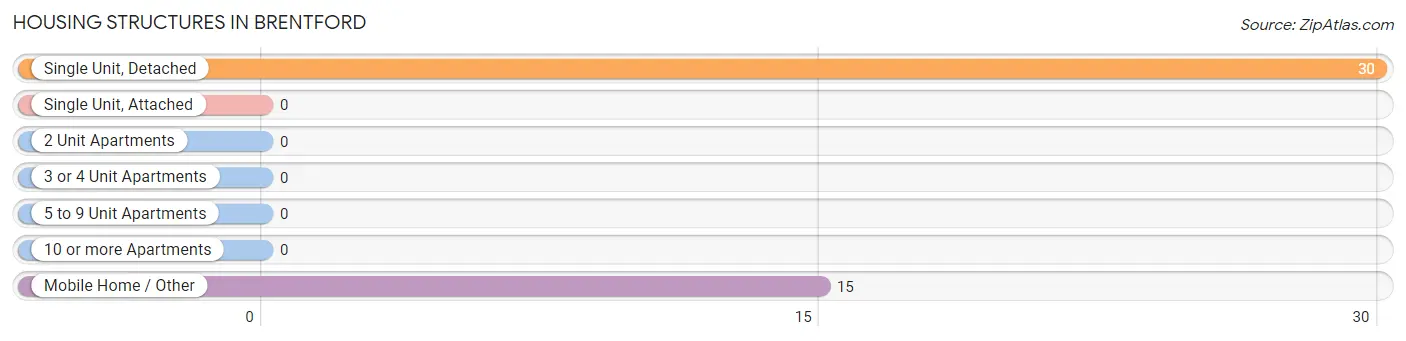
| Structure Type | # Housing Units | % Housing Units |
| Single Unit, Detached | 30 | 66.7% |
| Single Unit, Attached | 0 | 0.0% |
| 2 Unit Apartments | 0 | 0.0% |
| 3 or 4 Unit Apartments | 0 | 0.0% |
| 5 to 9 Unit Apartments | 0 | 0.0% |
| 10 or more Apartments | 0 | 0.0% |
| Mobile Home / Other | 15 | 33.3% |
| Total | 45 | 100.0% |
Housing Structures by Occupancy in Brentford
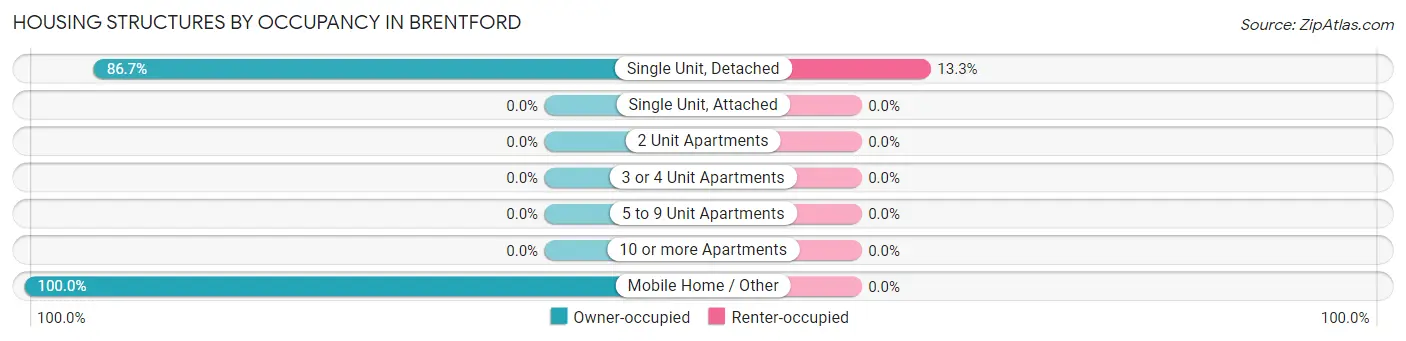
| Structure Type | Owner-occupied | Renter-occupied |
| Single Unit, Detached | 26 (86.7%) | 4 (13.3%) |
| Single Unit, Attached | 0 (0.0%) | 0 (0.0%) |
| 2 Unit Apartments | 0 (0.0%) | 0 (0.0%) |
| 3 or 4 Unit Apartments | 0 (0.0%) | 0 (0.0%) |
| 5 to 9 Unit Apartments | 0 (0.0%) | 0 (0.0%) |
| 10 or more Apartments | 0 (0.0%) | 0 (0.0%) |
| Mobile Home / Other | 15 (100.0%) | 0 (0.0%) |
| Total | 41 (91.1%) | 4 (8.9%) |
Housing Structures by Number of Rooms in Brentford
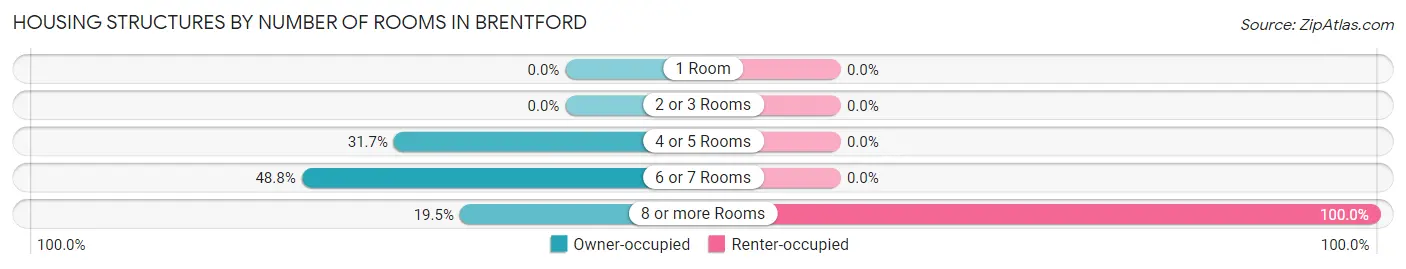
| Number of Rooms | Owner-occupied | Renter-occupied |
| 1 Room | 0 (0.0%) | 0 (0.0%) |
| 2 or 3 Rooms | 0 (0.0%) | 0 (0.0%) |
| 4 or 5 Rooms | 13 (31.7%) | 0 (0.0%) |
| 6 or 7 Rooms | 20 (48.8%) | 0 (0.0%) |
| 8 or more Rooms | 8 (19.5%) | 4 (100.0%) |
| Total | 41 (100.0%) | 4 (100.0%) |
Housing Structure by Heating Type in Brentford
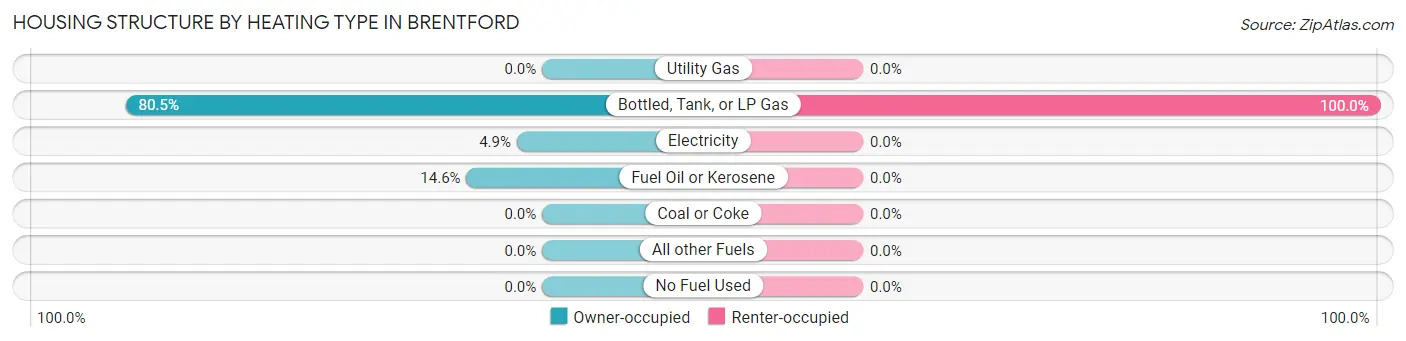
| Heating Type | Owner-occupied | Renter-occupied |
| Utility Gas | 0 (0.0%) | 0 (0.0%) |
| Bottled, Tank, or LP Gas | 33 (80.5%) | 4 (100.0%) |
| Electricity | 2 (4.9%) | 0 (0.0%) |
| Fuel Oil or Kerosene | 6 (14.6%) | 0 (0.0%) |
| Coal or Coke | 0 (0.0%) | 0 (0.0%) |
| All other Fuels | 0 (0.0%) | 0 (0.0%) |
| No Fuel Used | 0 (0.0%) | 0 (0.0%) |
| Total | 41 (100.0%) | 4 (100.0%) |
Household Vehicle Usage in Brentford
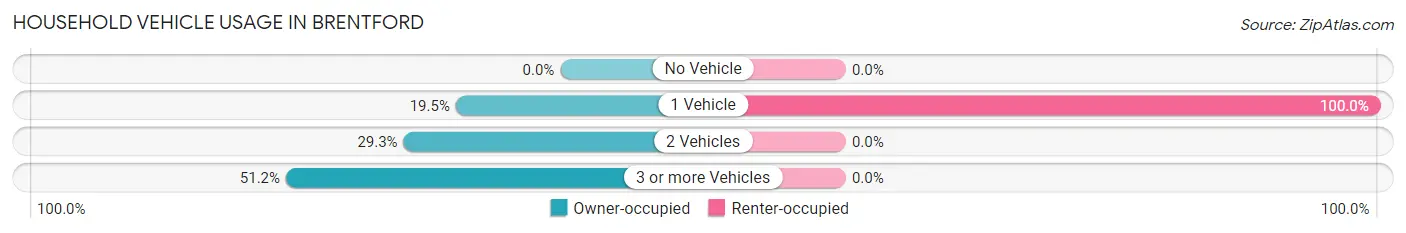
| Vehicles per Household | Owner-occupied | Renter-occupied |
| No Vehicle | 0 (0.0%) | 0 (0.0%) |
| 1 Vehicle | 8 (19.5%) | 4 (100.0%) |
| 2 Vehicles | 12 (29.3%) | 0 (0.0%) |
| 3 or more Vehicles | 21 (51.2%) | 0 (0.0%) |
| Total | 41 (100.0%) | 4 (100.0%) |
Real Estate & Mortgages in Brentford
Real Estate and Mortgage Overview in Brentford
| Characteristic | Without Mortgage | With Mortgage |
| Housing Units | 29 | 12 |
| Median Property Value | $31,900 | $207,100 |
| Median Household Income | $33,750 | $7 |
| Monthly Housing Costs | $483 | $0 |
| Real Estate Taxes | $450 | $0 |
Property Value by Mortgage Status in Brentford
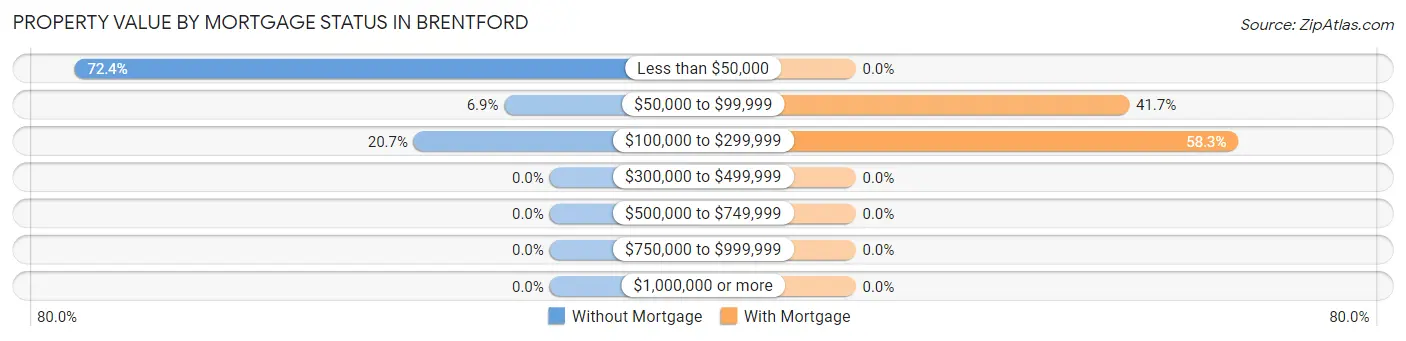
| Property Value | Without Mortgage | With Mortgage |
| Less than $50,000 | 21 (72.4%) | 0 (0.0%) |
| $50,000 to $99,999 | 2 (6.9%) | 5 (41.7%) |
| $100,000 to $299,999 | 6 (20.7%) | 7 (58.3%) |
| $300,000 to $499,999 | 0 (0.0%) | 0 (0.0%) |
| $500,000 to $749,999 | 0 (0.0%) | 0 (0.0%) |
| $750,000 to $999,999 | 0 (0.0%) | 0 (0.0%) |
| $1,000,000 or more | 0 (0.0%) | 0 (0.0%) |
| Total | 29 (100.0%) | 12 (100.0%) |
Household Income by Mortgage Status in Brentford
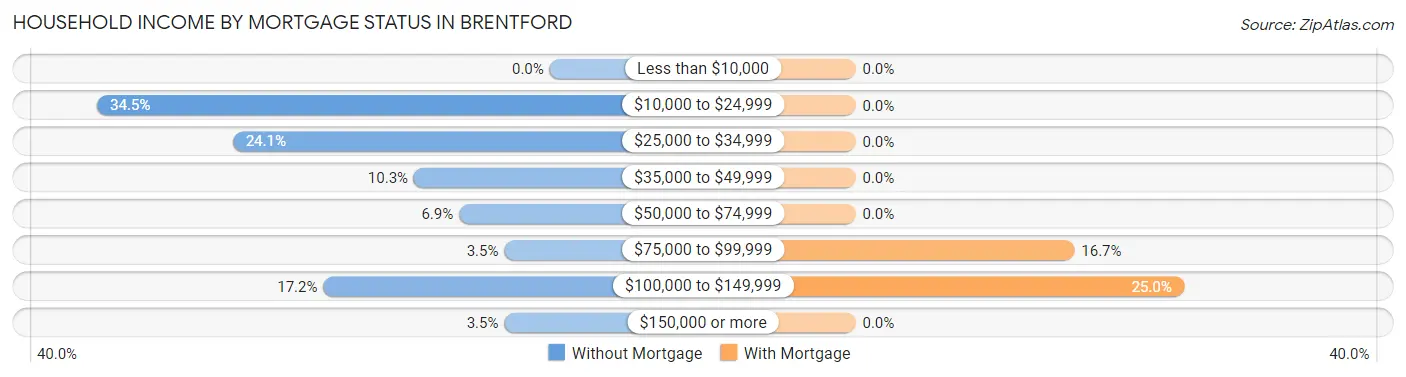
| Household Income | Without Mortgage | With Mortgage |
| Less than $10,000 | 0 (0.0%) | 0 (0.0%) |
| $10,000 to $24,999 | 10 (34.5%) | 0 (0.0%) |
| $25,000 to $34,999 | 7 (24.1%) | 0 (0.0%) |
| $35,000 to $49,999 | 3 (10.3%) | 0 (0.0%) |
| $50,000 to $74,999 | 2 (6.9%) | 0 (0.0%) |
| $75,000 to $99,999 | 1 (3.5%) | 2 (16.7%) |
| $100,000 to $149,999 | 5 (17.2%) | 3 (25.0%) |
| $150,000 or more | 1 (3.5%) | 0 (0.0%) |
| Total | 29 (100.0%) | 12 (100.0%) |
Property Value to Household Income Ratio in Brentford
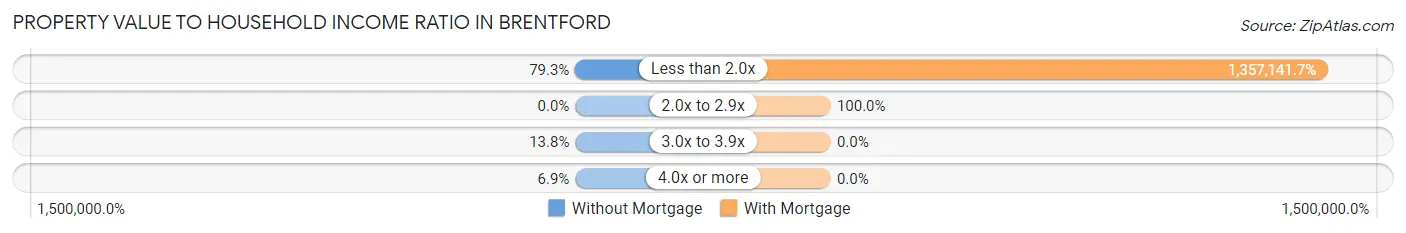
| Value-to-Income Ratio | Without Mortgage | With Mortgage |
| Less than 2.0x | 23 (79.3%) | 162,857 (1,357,141.7%) |
| 2.0x to 2.9x | 0 (0.0%) | 12 (100.0%) |
| 3.0x to 3.9x | 4 (13.8%) | 0 (0.0%) |
| 4.0x or more | 2 (6.9%) | 0 (0.0%) |
| Total | 29 (100.0%) | 12 (100.0%) |
Real Estate Taxes by Mortgage Status in Brentford
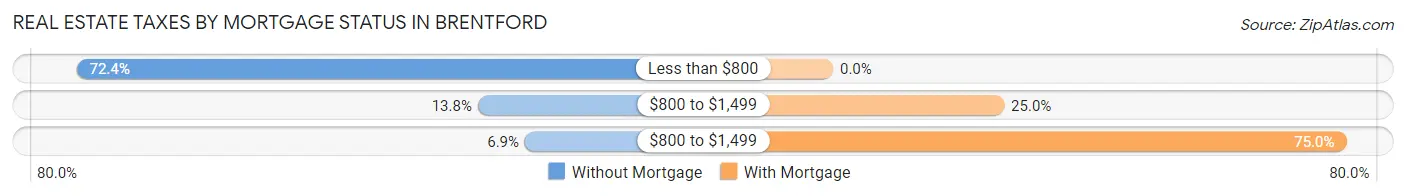
| Property Taxes | Without Mortgage | With Mortgage |
| Less than $800 | 21 (72.4%) | 0 (0.0%) |
| $800 to $1,499 | 4 (13.8%) | 3 (25.0%) |
| $800 to $1,499 | 2 (6.9%) | 9 (75.0%) |
| Total | 29 (100.0%) | 12 (100.0%) |
Health & Disability in Brentford
Health Insurance Coverage by Age in Brentford
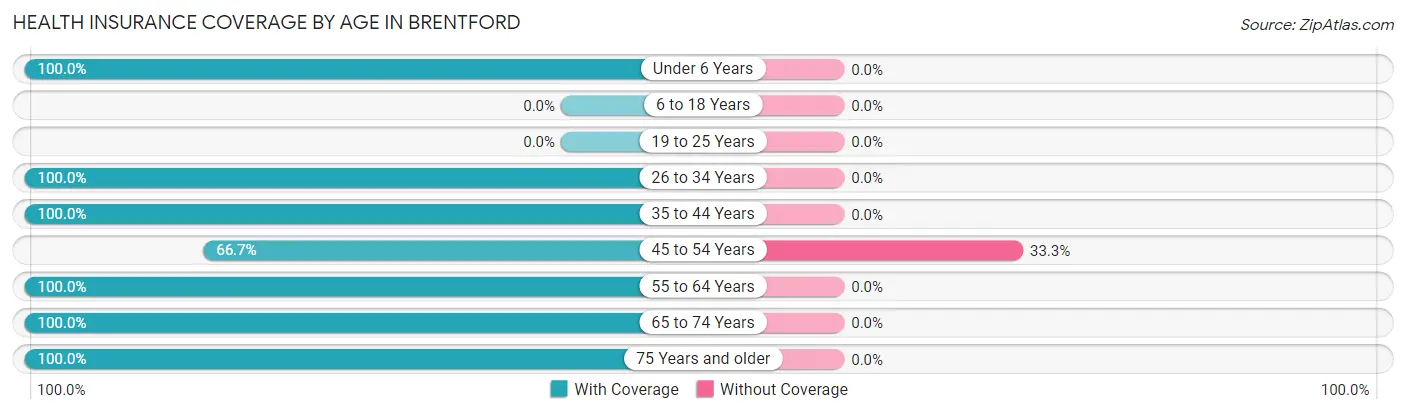
| Age Bracket | With Coverage | Without Coverage |
| Under 6 Years | 4 (100.0%) | 0 (0.0%) |
| 6 to 18 Years | 0 (0.0%) | 0 (0.0%) |
| 19 to 25 Years | 0 (0.0%) | 0 (0.0%) |
| 26 to 34 Years | 2 (100.0%) | 0 (0.0%) |
| 35 to 44 Years | 6 (100.0%) | 0 (0.0%) |
| 45 to 54 Years | 4 (66.7%) | 2 (33.3%) |
| 55 to 64 Years | 25 (100.0%) | 0 (0.0%) |
| 65 to 74 Years | 9 (100.0%) | 0 (0.0%) |
| 75 Years and older | 14 (100.0%) | 0 (0.0%) |
| Total | 64 (97.0%) | 2 (3.0%) |
Health Insurance Coverage by Citizenship Status in Brentford
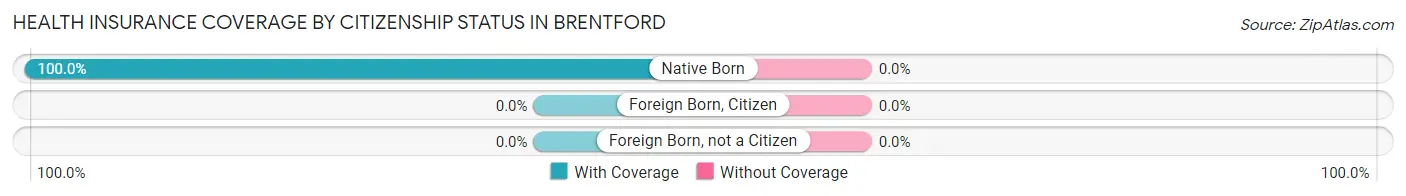
| Citizenship Status | With Coverage | Without Coverage |
| Native Born | 4 (100.0%) | 0 (0.0%) |
| Foreign Born, Citizen | 0 (0.0%) | 0 (0.0%) |
| Foreign Born, not a Citizen | 0 (0.0%) | 0 (0.0%) |
Health Insurance Coverage by Household Income in Brentford
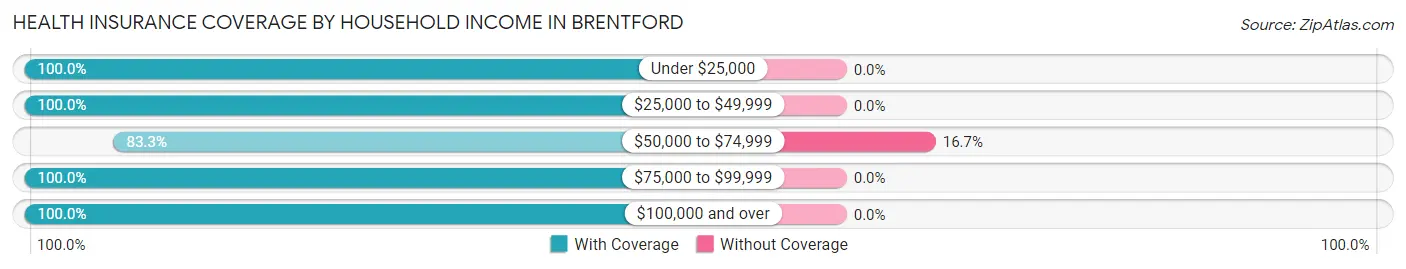
| Household Income | With Coverage | Without Coverage |
| Under $25,000 | 10 (100.0%) | 0 (0.0%) |
| $25,000 to $49,999 | 16 (100.0%) | 0 (0.0%) |
| $50,000 to $74,999 | 10 (83.3%) | 2 (16.7%) |
| $75,000 to $99,999 | 5 (100.0%) | 0 (0.0%) |
| $100,000 and over | 23 (100.0%) | 0 (0.0%) |
Public vs Private Health Insurance Coverage by Age in Brentford
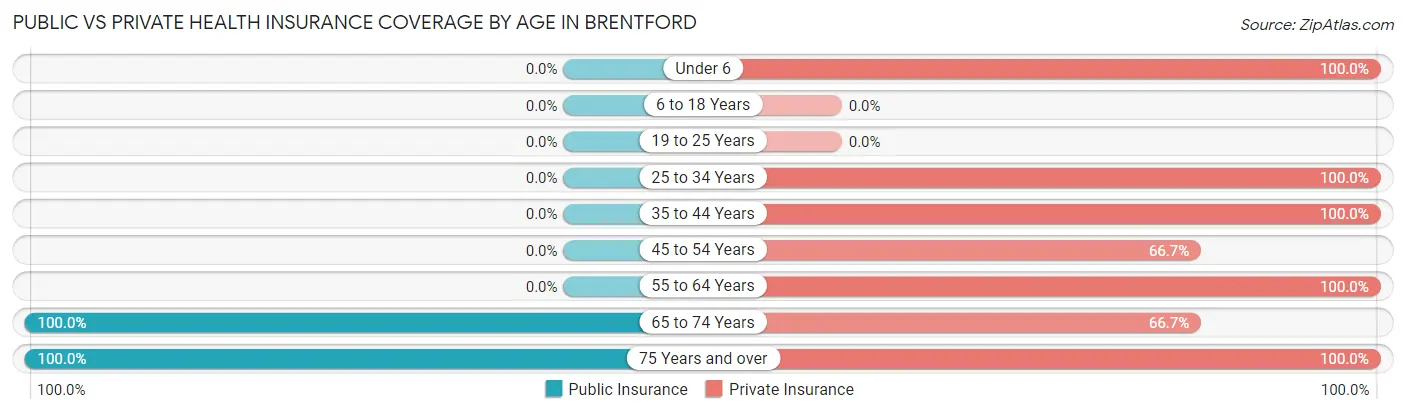
| Age Bracket | Public Insurance | Private Insurance |
| Under 6 | 0 (0.0%) | 4 (100.0%) |
| 6 to 18 Years | 0 (0.0%) | 0 (0.0%) |
| 19 to 25 Years | 0 (0.0%) | 0 (0.0%) |
| 25 to 34 Years | 0 (0.0%) | 2 (100.0%) |
| 35 to 44 Years | 0 (0.0%) | 6 (100.0%) |
| 45 to 54 Years | 0 (0.0%) | 4 (66.7%) |
| 55 to 64 Years | 0 (0.0%) | 25 (100.0%) |
| 65 to 74 Years | 9 (100.0%) | 6 (66.7%) |
| 75 Years and over | 14 (100.0%) | 14 (100.0%) |
| Total | 23 (34.8%) | 61 (92.4%) |
Disability Status by Sex by Age in Brentford
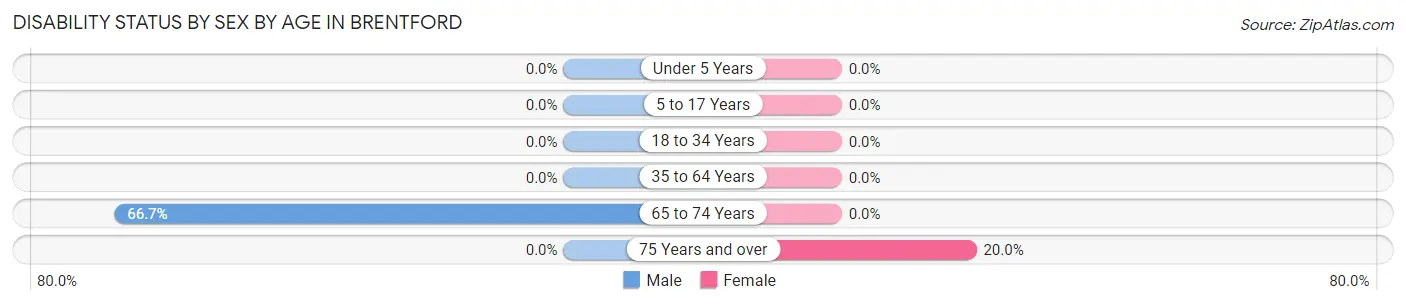
| Age Bracket | Male | Female |
| Under 5 Years | 0 (0.0%) | 0 (0.0%) |
| 5 to 17 Years | 0 (0.0%) | 0 (0.0%) |
| 18 to 34 Years | 0 (0.0%) | 0 (0.0%) |
| 35 to 64 Years | 0 (0.0%) | 0 (0.0%) |
| 65 to 74 Years | 2 (66.7%) | 0 (0.0%) |
| 75 Years and over | 0 (0.0%) | 2 (20.0%) |
Disability Class by Sex by Age in Brentford
Disability Class: Hearing Difficulty
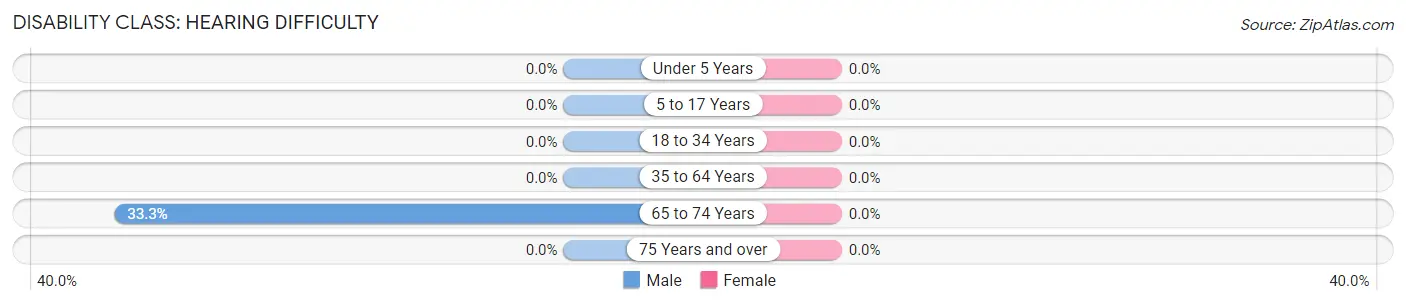
| Age Bracket | Male | Female |
| Under 5 Years | 0 (0.0%) | 0 (0.0%) |
| 5 to 17 Years | 0 (0.0%) | 0 (0.0%) |
| 18 to 34 Years | 0 (0.0%) | 0 (0.0%) |
| 35 to 64 Years | 0 (0.0%) | 0 (0.0%) |
| 65 to 74 Years | 1 (33.3%) | 0 (0.0%) |
| 75 Years and over | 0 (0.0%) | 0 (0.0%) |
Disability Class: Vision Difficulty
| Age Bracket | Male | Female |
| Under 5 Years | 0 (0.0%) | 0 (0.0%) |
| 5 to 17 Years | 0 (0.0%) | 0 (0.0%) |
| 18 to 34 Years | 0 (0.0%) | 0 (0.0%) |
| 35 to 64 Years | 0 (0.0%) | 0 (0.0%) |
| 65 to 74 Years | 0 (0.0%) | 0 (0.0%) |
| 75 Years and over | 0 (0.0%) | 0 (0.0%) |
Disability Class: Cognitive Difficulty
| Age Bracket | Male | Female |
| 5 to 17 Years | 0 (0.0%) | 0 (0.0%) |
| 18 to 34 Years | 0 (0.0%) | 0 (0.0%) |
| 35 to 64 Years | 0 (0.0%) | 0 (0.0%) |
| 65 to 74 Years | 0 (0.0%) | 0 (0.0%) |
| 75 Years and over | 0 (0.0%) | 0 (0.0%) |
Disability Class: Ambulatory Difficulty
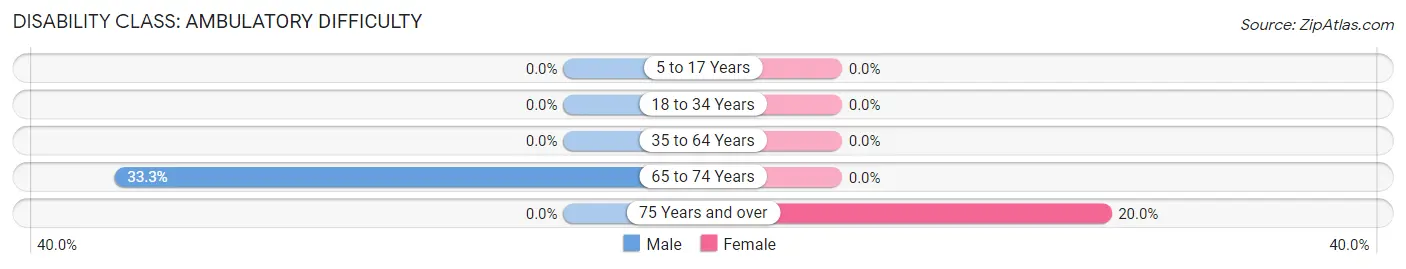
| Age Bracket | Male | Female |
| 5 to 17 Years | 0 (0.0%) | 0 (0.0%) |
| 18 to 34 Years | 0 (0.0%) | 0 (0.0%) |
| 35 to 64 Years | 0 (0.0%) | 0 (0.0%) |
| 65 to 74 Years | 1 (33.3%) | 0 (0.0%) |
| 75 Years and over | 0 (0.0%) | 2 (20.0%) |
Disability Class: Self-Care Difficulty
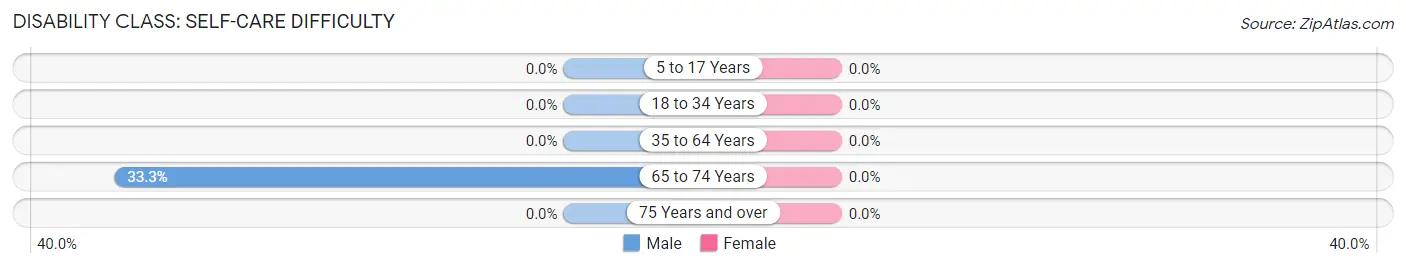
| Age Bracket | Male | Female |
| 5 to 17 Years | 0 (0.0%) | 0 (0.0%) |
| 18 to 34 Years | 0 (0.0%) | 0 (0.0%) |
| 35 to 64 Years | 0 (0.0%) | 0 (0.0%) |
| 65 to 74 Years | 1 (33.3%) | 0 (0.0%) |
| 75 Years and over | 0 (0.0%) | 0 (0.0%) |
Technology Access in Brentford
Computing Device Access in Brentford
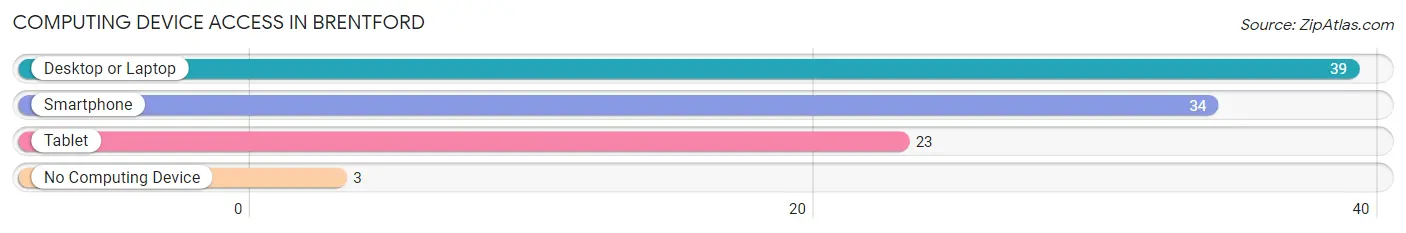
| Device Type | # Households | % Households |
| Desktop or Laptop | 39 | 86.7% |
| Smartphone | 34 | 75.6% |
| Tablet | 23 | 51.1% |
| No Computing Device | 3 | 6.7% |
| Total | 45 | 100.0% |
Internet Access in Brentford
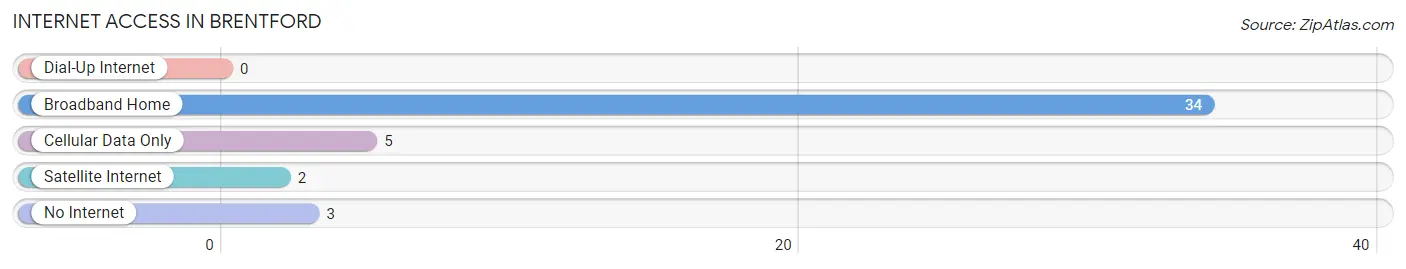
| Internet Type | # Households | % Households |
| Dial-Up Internet | 0 | 0.0% |
| Broadband Home | 34 | 75.6% |
| Cellular Data Only | 5 | 11.1% |
| Satellite Internet | 2 | 4.4% |
| No Internet | 3 | 6.7% |
| Total | 45 | 100.0% |
Brentford Summary
Brentford is a small town located in the state of South Dakota, in the United States. It is situated in the southeastern corner of the state, in the Black Hills region. The town is located in Lawrence County, and is part of the Rapid City Metropolitan Statistical Area. As of the 2010 census, the population of Brentford was 545.
History
Brentford was founded in 1883 by a group of settlers from the Midwest. The town was named after a local rancher, William Brentford. The town was originally a farming community, and the first settlers were primarily of German and Scandinavian descent. The town grew slowly, and by the early 1900s, it had a population of around 200.
In the early 1900s, the town began to experience a period of growth. This was due to the discovery of gold in the nearby Black Hills. The gold rush brought many new settlers to the area, and the population of Brentford increased significantly. By the 1920s, the population had grown to over 500.
The town continued to grow throughout the 20th century, and by the 2000 census, the population had reached 545.
Geography
Brentford is located in the southeastern corner of South Dakota, in the Black Hills region. The town is situated in Lawrence County, and is part of the Rapid City Metropolitan Statistical Area.
The town is located at an elevation of 4,890 feet (1,490 m). The town is situated in a valley, surrounded by hills and mountains. The nearest major city is Rapid City, which is located about 40 miles (64 km) to the northwest.
The climate in Brentford is semi-arid, with hot summers and cold winters. The average annual temperature is 45°F (7°C). The average annual precipitation is 16 inches (406 mm).
Economy
The economy of Brentford is largely based on tourism and agriculture. The town is a popular destination for tourists, who come to visit the nearby Black Hills National Forest and Mount Rushmore National Memorial.
Agriculture is also an important part of the local economy. The town is home to several farms, which produce a variety of crops, including wheat, corn, and hay.
Demographics
As of the 2010 census, the population of Brentford was 545. The racial makeup of the town was 97.3% White, 0.2% African American, 0.4% Native American, 0.2% Asian, 0.2% from other races, and 1.7% from two or more races. Hispanic or Latino of any race were 1.3% of the population.
The median household income in Brentford was $37,500, and the median family income was $45,000. The per capita income was $18,000. About 11.3% of families and 14.2% of the population were below the poverty line, including 18.2% of those under age 18 and 8.3% of those age 65 or over.
Common Questions
What is Per Capita Income in Brentford?
Per Capita income in Brentford is $47,392.
What is the Median Family Income in Brentford?
Median Family Income in Brentford is $116,750.
What is the Median Household income in Brentford?
Median Household Income in Brentford is $61,250.
What is Income or Wage Gap in Brentford?
Income or Wage Gap in Brentford is 67.0%.
Women in Brentford earn 33.0 cents for every dollar earned by a man.
What is Inequality or Gini Index in Brentford?
Inequality or Gini Index in Brentford is 0.39.
What is the Total Population of Brentford?
Total Population of Brentford is 66.
What is the Total Male Population of Brentford?
Total Male Population of Brentford is 28.
What is the Total Female Population of Brentford?
Total Female Population of Brentford is 38.
What is the Ratio of Males per 100 Females in Brentford?
There are 73.68 Males per 100 Females in Brentford.
What is the Ratio of Females per 100 Males in Brentford?
There are 135.71 Females per 100 Males in Brentford.
What is the Median Population Age in Brentford?
Median Population Age in Brentford is 57.9 Years.
What is the Average Family Size in Brentford
Average Family Size in Brentford is 2.2 People.
What is the Average Household Size in Brentford
Average Household Size in Brentford is 1.5 People.
How Large is the Labor Force in Brentford?
There are 41 People in the Labor Forcein in Brentford.
What is the Percentage of People in the Labor Force in Brentford?
66.1% of People are in the Labor Force in Brentford.