Naples, SD Map & Demographics
Naples Map
Naples Overview
$25,803
PER CAPITA INCOME
$133,125
AVG FAMILY INCOME
$134,375
AVG HOUSEHOLD INCOME
0.28
INEQUALITY / GINI INDEX
76
TOTAL POPULATION
34
MALE POPULATION
42
FEMALE POPULATION
80.95
MALES / 100 FEMALES
123.53
FEMALES / 100 MALES
15.0
MEDIAN AGE
6.0
AVG FAMILY SIZE
5.1
AVG HOUSEHOLD SIZE
26
LABOR FORCE [ PEOPLE ]
68.4%
PERCENT IN LABOR FORCE
Income in Naples
Income Overview in Naples
Per Capita Income in Naples is $25,803, while median incomes of families and households are $133,125 and $134,375 respectively.
| Characteristic | Number | Measure |
| Per Capita Income | 76 | $25,803 |
| Median Family Income | 11 | $133,125 |
| Mean Family Income | 11 | $114,327 |
| Median Household Income | 15 | $134,375 |
| Mean Household Income | 15 | $113,513 |
| Income Deficit | 11 | $0 |
| Wage / Income Gap (%) | 76 | 0.00% |
| Wage / Income Gap ($) | 76 | 100.00¢ per $1 |
| Gini / Inequality Index | 76 | 0.28 |
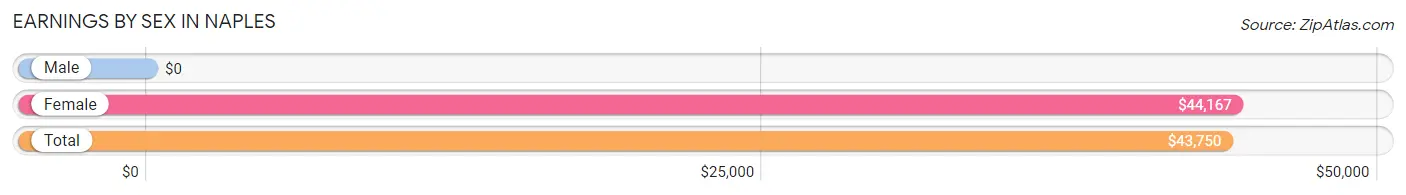
Earnings by Sex in Naples
| Sex | Number | Average Earnings |
| Male | 15 (48.4%) | $0 |
| Female | 16 (51.6%) | $44,167 |
| Total | 31 (100.0%) | $43,750 |
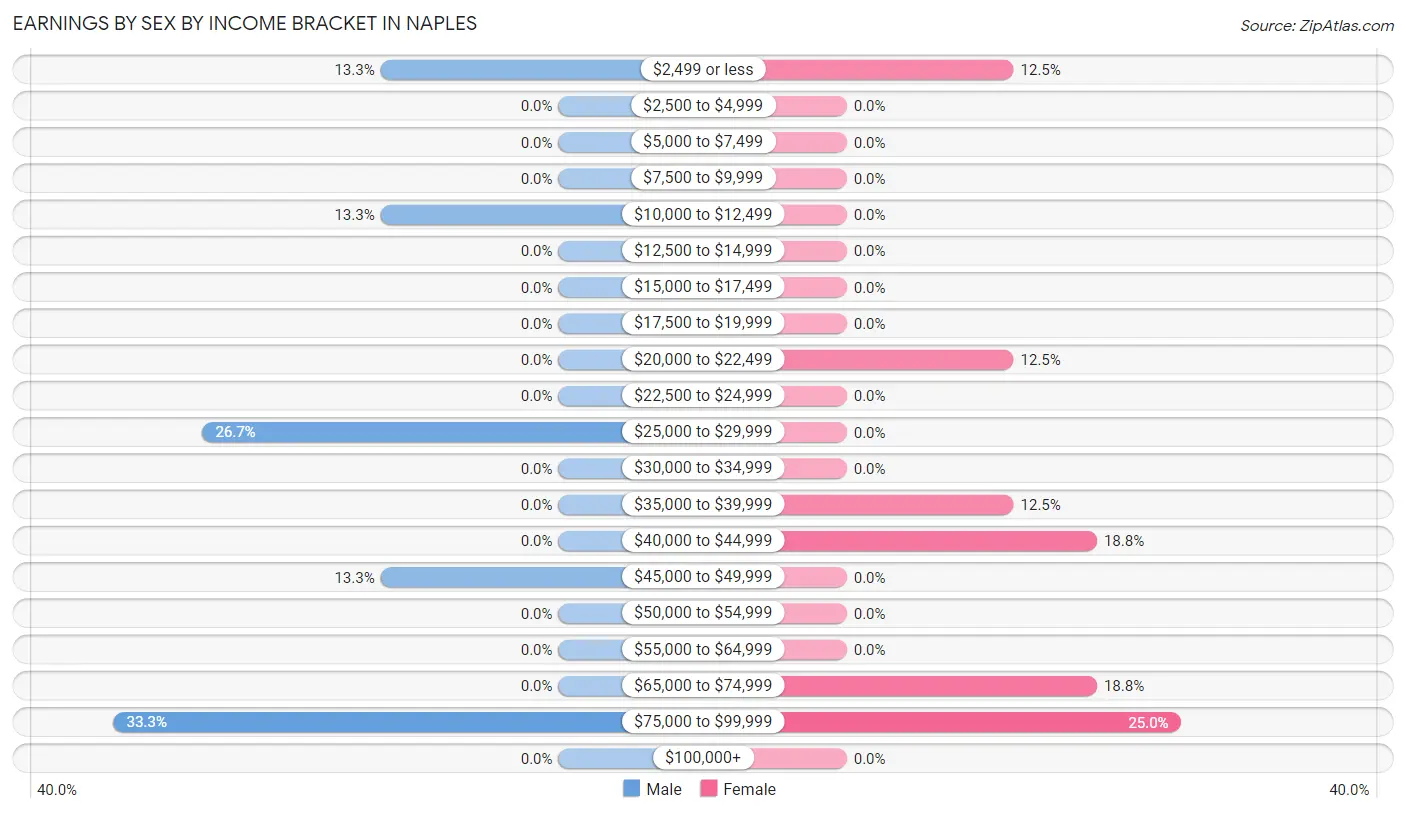
Earnings by Sex by Income Bracket in Naples
The most common earnings brackets in Naples are $75,000 to $99,999 for men (5 | 33.3%) and $75,000 to $99,999 for women (4 | 25.0%).
| Income | Male | Female |
| $2,499 or less | 2 (13.3%) | 2 (12.5%) |
| $2,500 to $4,999 | 0 (0.0%) | 0 (0.0%) |
| $5,000 to $7,499 | 0 (0.0%) | 0 (0.0%) |
| $7,500 to $9,999 | 0 (0.0%) | 0 (0.0%) |
| $10,000 to $12,499 | 2 (13.3%) | 0 (0.0%) |
| $12,500 to $14,999 | 0 (0.0%) | 0 (0.0%) |
| $15,000 to $17,499 | 0 (0.0%) | 0 (0.0%) |
| $17,500 to $19,999 | 0 (0.0%) | 0 (0.0%) |
| $20,000 to $22,499 | 0 (0.0%) | 2 (12.5%) |
| $22,500 to $24,999 | 0 (0.0%) | 0 (0.0%) |
| $25,000 to $29,999 | 4 (26.7%) | 0 (0.0%) |
| $30,000 to $34,999 | 0 (0.0%) | 0 (0.0%) |
| $35,000 to $39,999 | 0 (0.0%) | 2 (12.5%) |
| $40,000 to $44,999 | 0 (0.0%) | 3 (18.8%) |
| $45,000 to $49,999 | 2 (13.3%) | 0 (0.0%) |
| $50,000 to $54,999 | 0 (0.0%) | 0 (0.0%) |
| $55,000 to $64,999 | 0 (0.0%) | 0 (0.0%) |
| $65,000 to $74,999 | 0 (0.0%) | 3 (18.8%) |
| $75,000 to $99,999 | 5 (33.3%) | 4 (25.0%) |
| $100,000+ | 0 (0.0%) | 0 (0.0%) |
| Total | 15 (100.0%) | 16 (100.0%) |
Earnings by Sex by Educational Attainment in Naples
| Educational Attainment | Male Income | Female Income |
| Less than High School | - | - |
| High School Diploma | - | - |
| College or Associate's Degree | - | - |
| Bachelor's Degree | - | - |
| Graduate Degree | - | - |
| Total | - | - |
Family Income in Naples
Family Income Brackets in Naples
According to the Naples family income data, there are 4 families falling into the $100,000 to $149,999 income range, which is the most common income bracket and makes up 36.4% of all families.
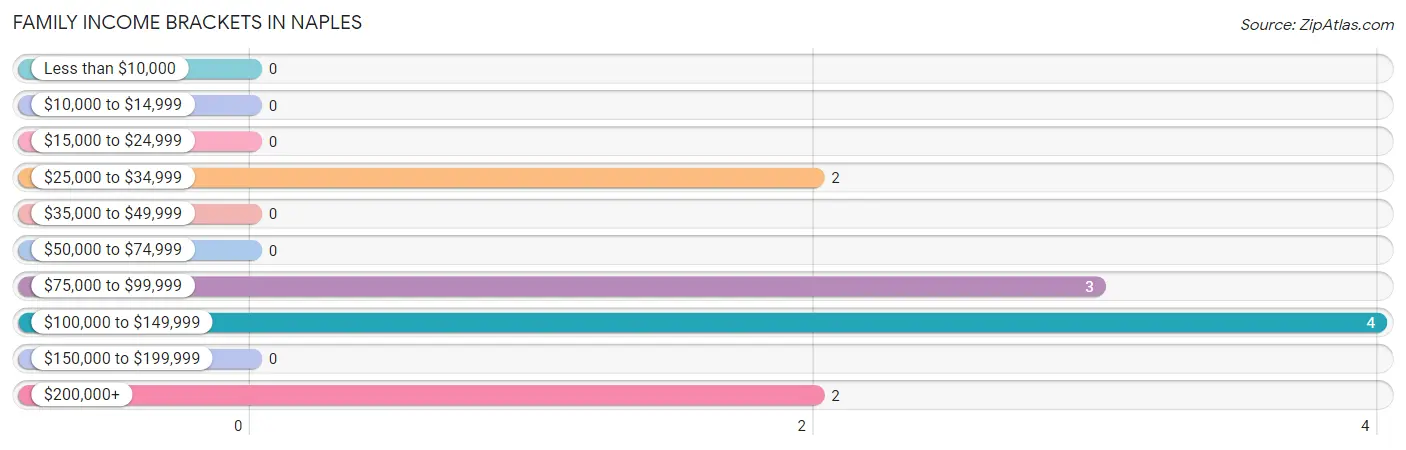
| Income Bracket | # Families | % Families |
| Less than $10,000 | 0 | 0.0% |
| $10,000 to $14,999 | 0 | 0.0% |
| $15,000 to $24,999 | 0 | 0.0% |
| $25,000 to $34,999 | 2 | 18.2% |
| $35,000 to $49,999 | 0 | 0.0% |
| $50,000 to $74,999 | 0 | 0.0% |
| $75,000 to $99,999 | 3 | 27.3% |
| $100,000 to $149,999 | 4 | 36.4% |
| $150,000 to $199,999 | 0 | 0.0% |
| $200,000+ | 2 | 18.2% |
Family Income by Famaliy Size in Naples
| Income Bracket | # Families | Median Income |
| 2-Person Families | 0 (0.0%) | $0 |
| 3-Person Families | 5 (45.5%) | $0 |
| 4-Person Families | 0 (0.0%) | $0 |
| 5-Person Families | 4 (36.4%) | $0 |
| 6-Person Families | 0 (0.0%) | $0 |
| 7+ Person Families | 2 (18.2%) | $0 |
| Total | 11 (100.0%) | $133,125 |
Family Income by Number of Earners in Naples
| Number of Earners | # Families | Median Income |
| No Earners | 0 (0.0%) | $0 |
| 1 Earner | 7 (63.6%) | $0 |
| 2 Earners | 2 (18.2%) | $0 |
| 3+ Earners | 2 (18.2%) | $0 |
| Total | 11 (100.0%) | $133,125 |
Household Income in Naples
Household Income Brackets in Naples
With 4 households falling in the category, the $100,000 to $149,999 income range is the most frequent in Naples, accounting for 26.7% of all households.
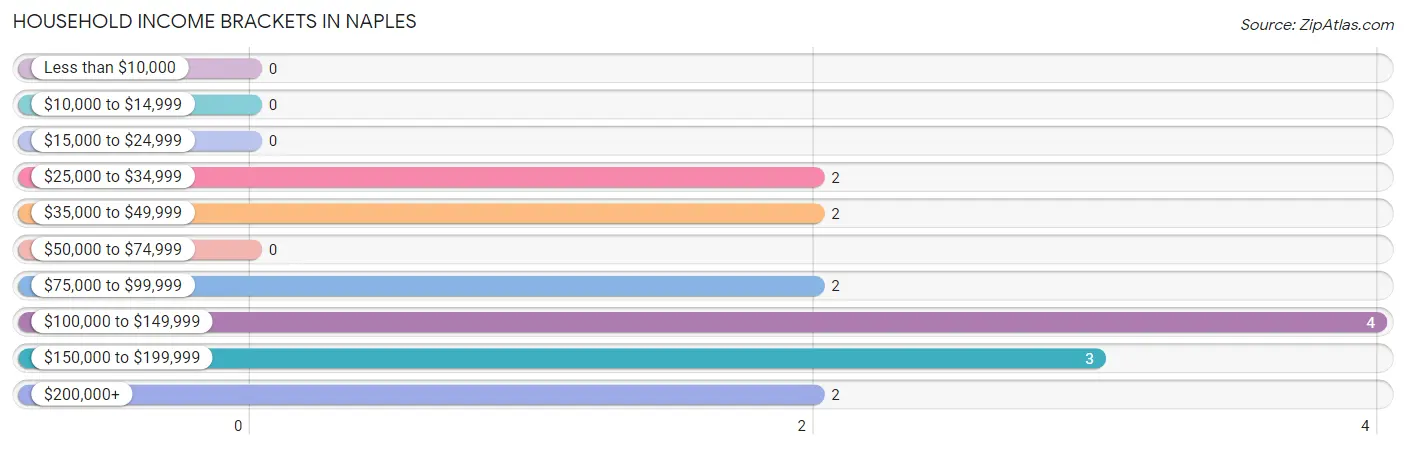
| Income Bracket | # Households | % Households |
| Less than $10,000 | 0 | 0.0% |
| $10,000 to $14,999 | 0 | 0.0% |
| $15,000 to $24,999 | 0 | 0.0% |
| $25,000 to $34,999 | 2 | 13.3% |
| $35,000 to $49,999 | 2 | 13.3% |
| $50,000 to $74,999 | 0 | 0.0% |
| $75,000 to $99,999 | 2 | 13.3% |
| $100,000 to $149,999 | 4 | 26.7% |
| $150,000 to $199,999 | 3 | 20.0% |
| $200,000+ | 2 | 13.3% |
Household Income by Householder Age in Naples
| Income Bracket | # Households | Median Income |
| 15 to 24 Years | 0 (0.0%) | $0 |
| 25 to 44 Years | 9 (60.0%) | $0 |
| 45 to 64 Years | 2 (13.3%) | $0 |
| 65+ Years | 4 (26.7%) | $0 |
| Total | 15 (100.0%) | $134,375 |
Poverty in Naples
Income Below Poverty by Sex and Age in Naples
With 32.4% poverty level for males and 26.2% for females among the residents of Naples, under 5 year old males and under 5 year old females are the most vulnerable to poverty, with 4 males (100.0%) and 5 females (71.4%) in their respective age groups living below the poverty level.
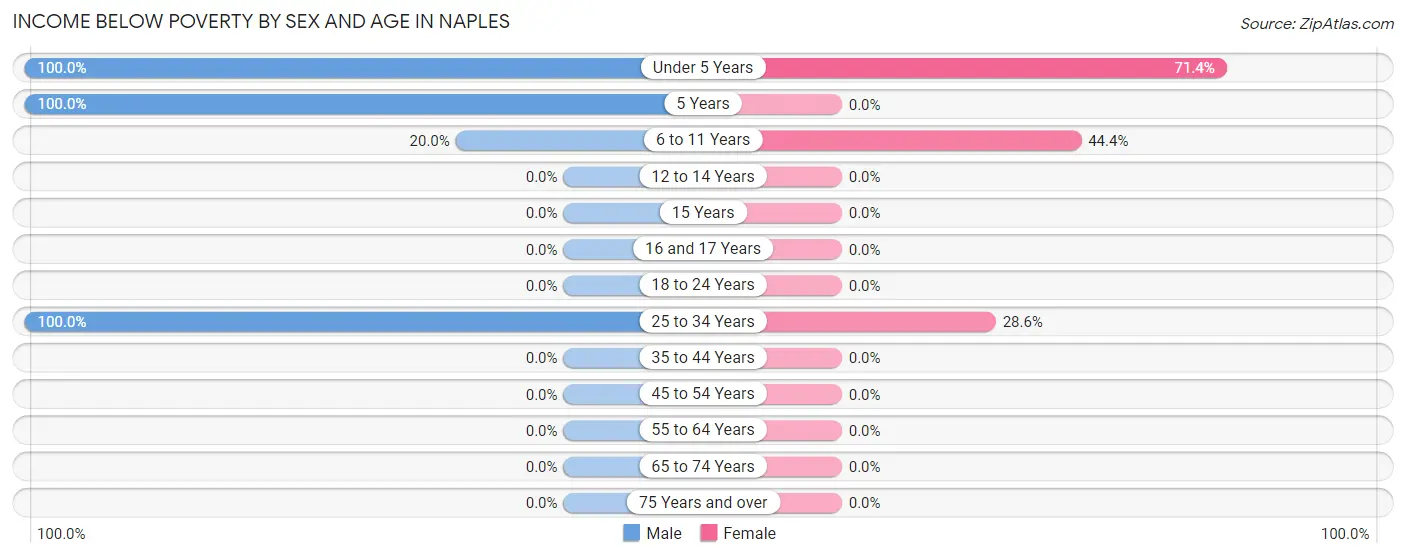
| Age Bracket | Male | Female |
| Under 5 Years | 4 (100.0%) | 5 (71.4%) |
| 5 Years | 3 (100.0%) | 0 (0.0%) |
| 6 to 11 Years | 2 (20.0%) | 4 (44.4%) |
| 12 to 14 Years | 0 (0.0%) | 0 (0.0%) |
| 15 Years | 0 (0.0%) | 0 (0.0%) |
| 16 and 17 Years | 0 (0.0%) | 0 (0.0%) |
| 18 to 24 Years | 0 (0.0%) | 0 (0.0%) |
| 25 to 34 Years | 2 (100.0%) | 2 (28.6%) |
| 35 to 44 Years | 0 (0.0%) | 0 (0.0%) |
| 45 to 54 Years | 0 (0.0%) | 0 (0.0%) |
| 55 to 64 Years | 0 (0.0%) | 0 (0.0%) |
| 65 to 74 Years | 0 (0.0%) | 0 (0.0%) |
| 75 Years and over | 0 (0.0%) | 0 (0.0%) |
| Total | 11 (32.4%) | 11 (26.2%) |
Income Above Poverty by Sex and Age in Naples
According to the poverty statistics in Naples, males aged 18 to 24 years and females aged 12 to 14 years are the age groups that are most secure financially, with 100.0% of males and 100.0% of females in these age groups living above the poverty line.
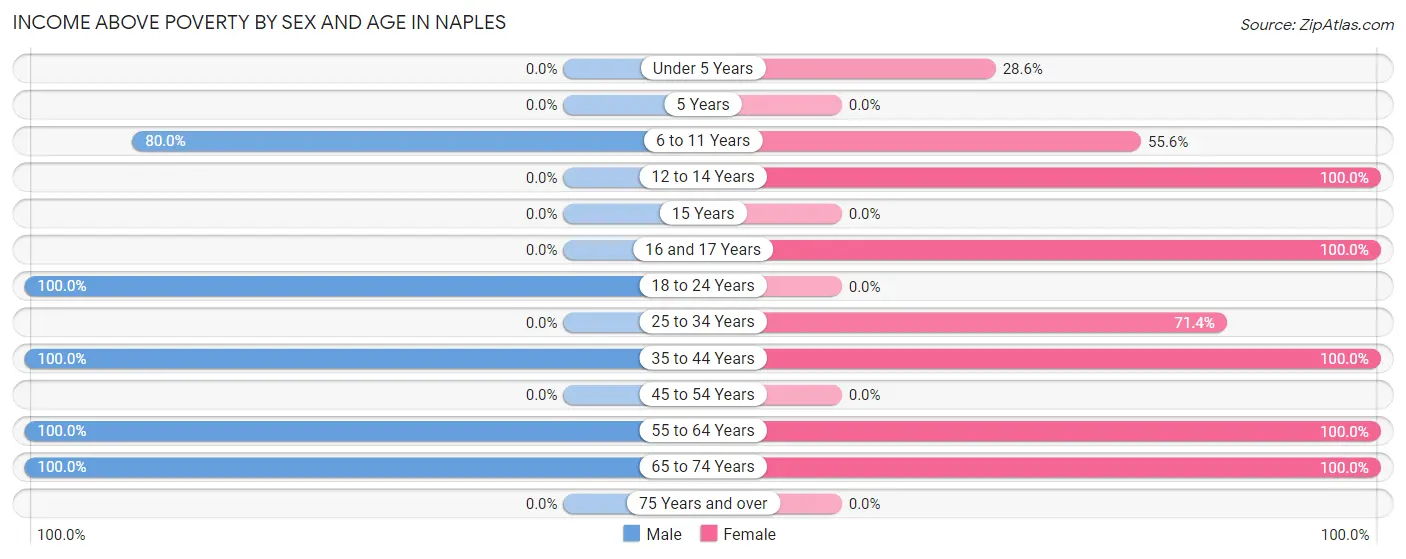
| Age Bracket | Male | Female |
| Under 5 Years | 0 (0.0%) | 2 (28.6%) |
| 5 Years | 0 (0.0%) | 0 (0.0%) |
| 6 to 11 Years | 8 (80.0%) | 5 (55.6%) |
| 12 to 14 Years | 0 (0.0%) | 5 (100.0%) |
| 15 Years | 0 (0.0%) | 0 (0.0%) |
| 16 and 17 Years | 0 (0.0%) | 1 (100.0%) |
| 18 to 24 Years | 4 (100.0%) | 0 (0.0%) |
| 25 to 34 Years | 0 (0.0%) | 5 (71.4%) |
| 35 to 44 Years | 5 (100.0%) | 6 (100.0%) |
| 45 to 54 Years | 0 (0.0%) | 0 (0.0%) |
| 55 to 64 Years | 2 (100.0%) | 5 (100.0%) |
| 65 to 74 Years | 4 (100.0%) | 2 (100.0%) |
| 75 Years and over | 0 (0.0%) | 0 (0.0%) |
| Total | 23 (67.6%) | 31 (73.8%) |
Income Below Poverty Among Married-Couple Families in Naples
The poverty statistics for married-couple families in Naples show that 25.0% or 2 of the total 8 families live below the poverty line. Families with 5 or more children have the highest poverty rate of 100.0%, comprising of 2 families. On the other hand, families with no children have the lowest poverty rate of 0.0%, which includes 0 families.
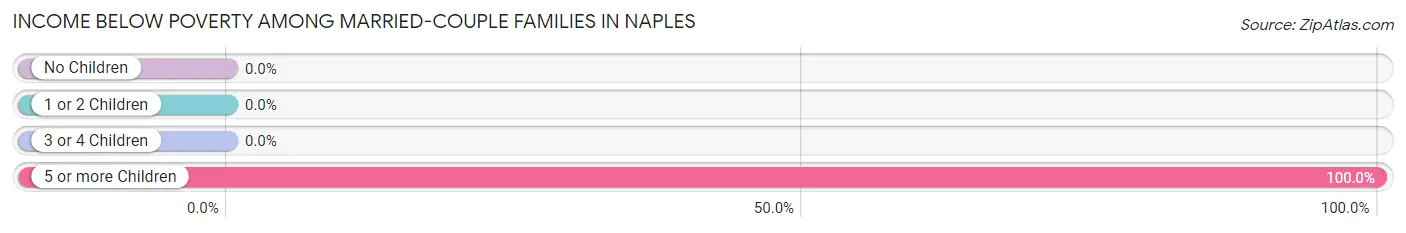
| Children | Above Poverty | Below Poverty |
| No Children | 2 (100.0%) | 0 (0.0%) |
| 1 or 2 Children | 2 (100.0%) | 0 (0.0%) |
| 3 or 4 Children | 2 (100.0%) | 0 (0.0%) |
| 5 or more Children | 0 (0.0%) | 2 (100.0%) |
| Total | 6 (75.0%) | 2 (25.0%) |
Income Below Poverty Among Single-Parent Households in Naples
| Children | Single Father | Single Mother |
| No Children | 0 (0.0%) | 0 (0.0%) |
| 1 or 2 Children | 0 (0.0%) | 0 (0.0%) |
| 3 or 4 Children | 0 (0.0%) | 0 (0.0%) |
| 5 or more Children | 0 (0.0%) | 0 (0.0%) |
| Total | 0 (0.0%) | 0 (0.0%) |
Income Below Poverty Among Married-Couple vs Single-Parent Households in Naples
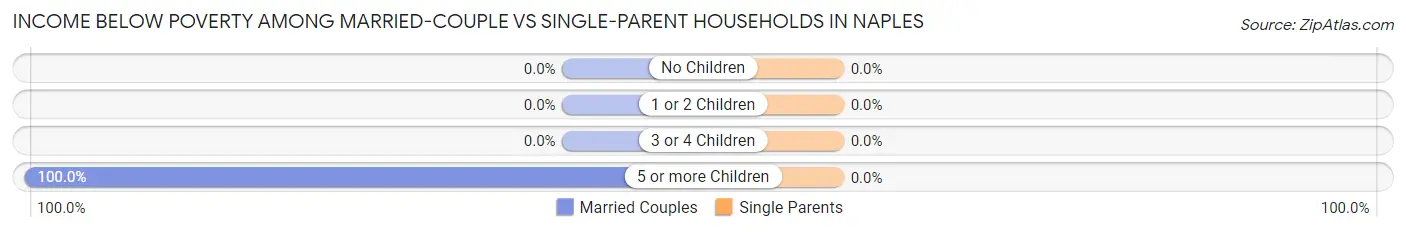
| Children | Married-Couple Families | Single-Parent Households |
| No Children | 0 (0.0%) | 0 (0.0%) |
| 1 or 2 Children | 0 (0.0%) | 0 (0.0%) |
| 3 or 4 Children | 0 (0.0%) | 0 (0.0%) |
| 5 or more Children | 2 (100.0%) | 0 (0.0%) |
| Total | 2 (25.0%) | 0 (0.0%) |
Race in Naples
The most populous races in Naples are , and White / Caucasian (76 | 100.0%).
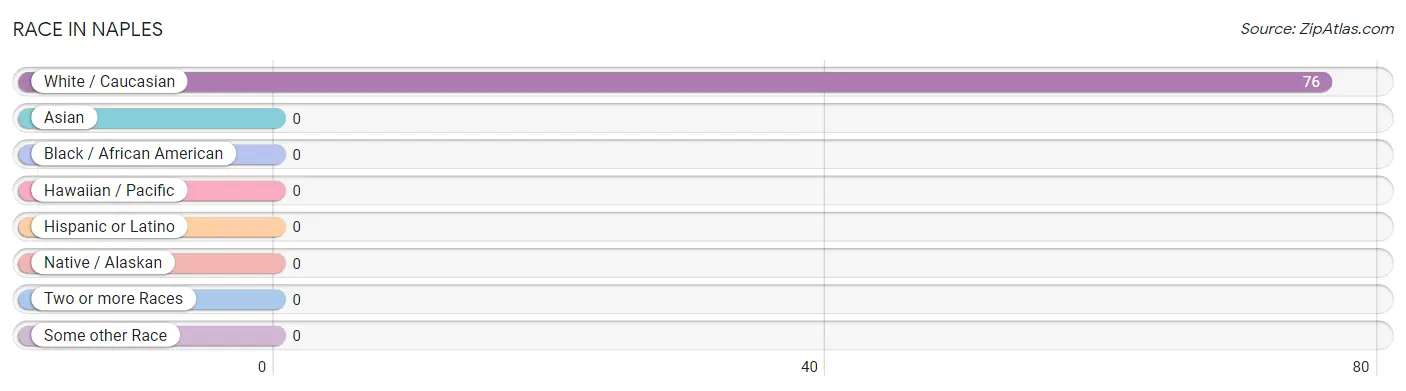
| Race | # Population | % Population |
| Asian | 0 | 0.0% |
| Black / African American | 0 | 0.0% |
| Hawaiian / Pacific | 0 | 0.0% |
| Hispanic or Latino | 0 | 0.0% |
| Native / Alaskan | 0 | 0.0% |
| White / Caucasian | 76 | 100.0% |
| Two or more Races | 0 | 0.0% |
| Some other Race | 0 | 0.0% |
| Total | 76 | 100.0% |
Ancestry in Naples
The most populous ancestries reported in Naples are Norwegian (26 | 34.2%), American (22 | 28.9%), German (21 | 27.6%), Scandinavian (11 | 14.5%), and Swedish (6 | 7.9%), together accounting for 113.1% of all Naples residents.
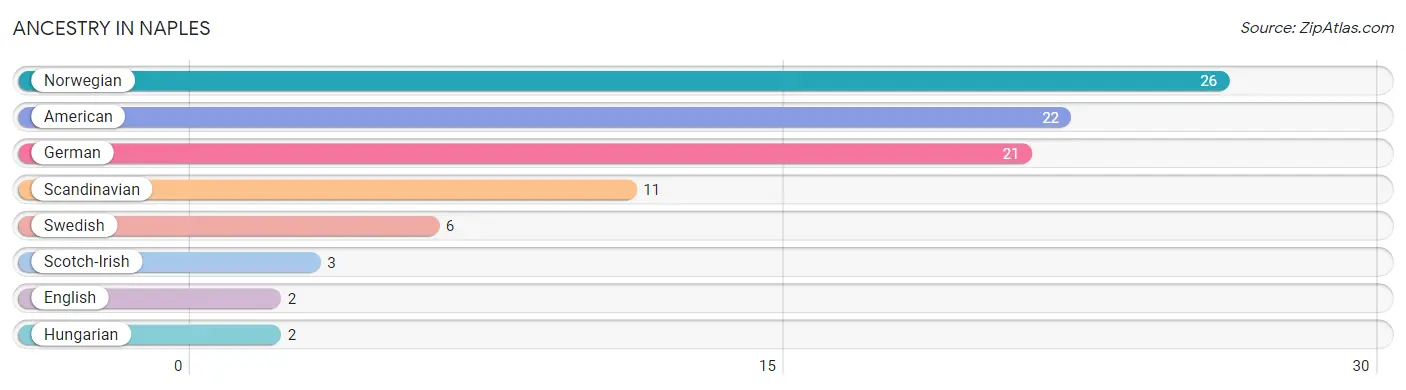
| Ancestry | # Population | % Population |
| American | 22 | 28.9% |
| English | 2 | 2.6% |
| German | 21 | 27.6% |
| Hungarian | 2 | 2.6% |
| Norwegian | 26 | 34.2% |
| Scandinavian | 11 | 14.5% |
| Scotch-Irish | 3 | 4.0% |
| Swedish | 6 | 7.9% | View All 8 Rows |
Immigrants in Naples
The most numerous immigrant groups reported in Naples came from Africa (2 | 2.6%), and South Africa (2 | 2.6%), together accounting for 5.3% of all Naples residents.
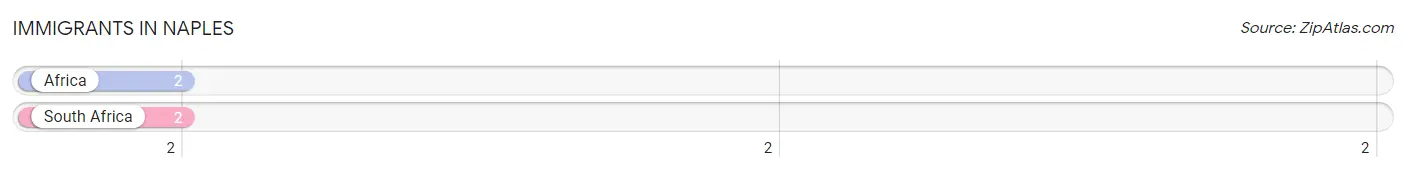
| Immigration Origin | # Population | % Population |
| Africa | 2 | 2.6% |
| South Africa | 2 | 2.6% | View All 2 Rows |
Sex and Age in Naples
Sex and Age in Naples
The most populous age groups in Naples are 10 to 14 Years (8 | 23.5%) for men and Under 5 Years (7 | 16.7%) for women.
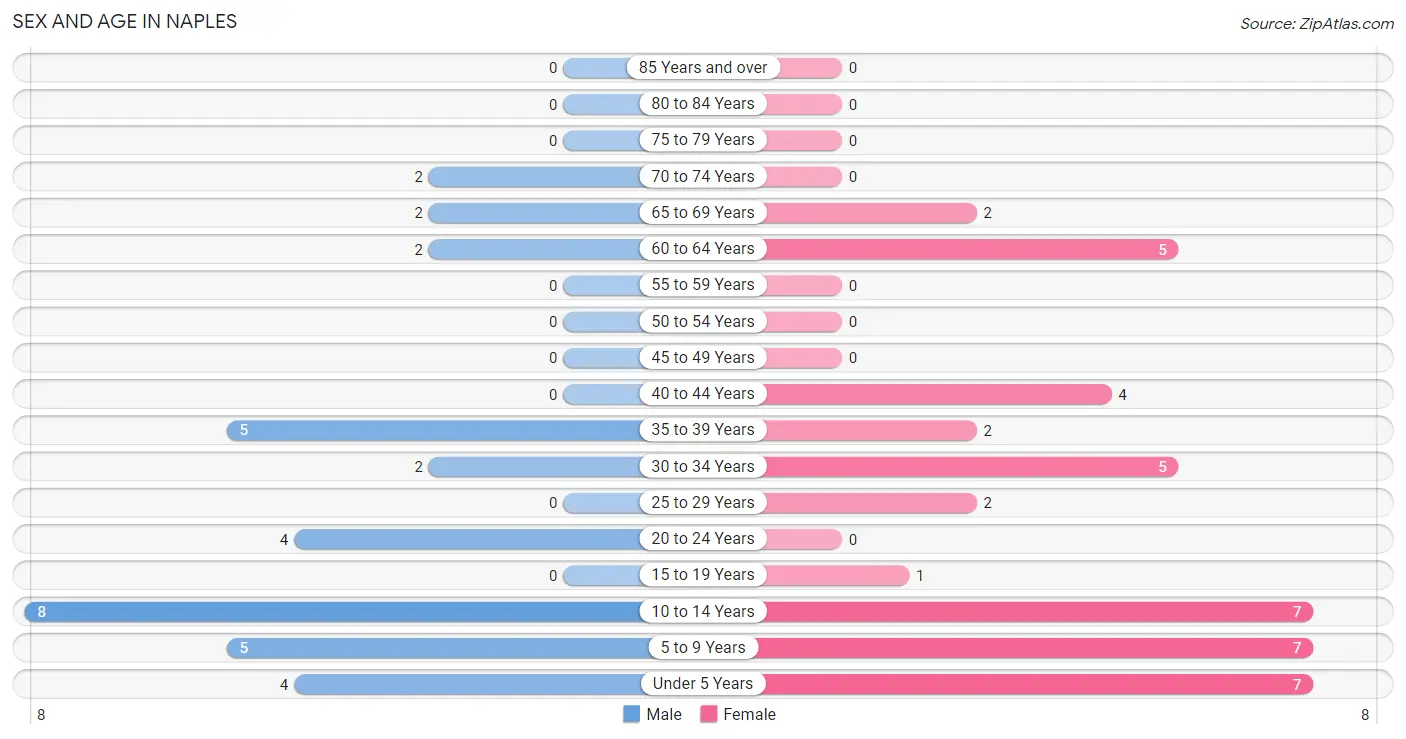
| Age Bracket | Male | Female |
| Under 5 Years | 4 (11.8%) | 7 (16.7%) |
| 5 to 9 Years | 5 (14.7%) | 7 (16.7%) |
| 10 to 14 Years | 8 (23.5%) | 7 (16.7%) |
| 15 to 19 Years | 0 (0.0%) | 1 (2.4%) |
| 20 to 24 Years | 4 (11.8%) | 0 (0.0%) |
| 25 to 29 Years | 0 (0.0%) | 2 (4.8%) |
| 30 to 34 Years | 2 (5.9%) | 5 (11.9%) |
| 35 to 39 Years | 5 (14.7%) | 2 (4.8%) |
| 40 to 44 Years | 0 (0.0%) | 4 (9.5%) |
| 45 to 49 Years | 0 (0.0%) | 0 (0.0%) |
| 50 to 54 Years | 0 (0.0%) | 0 (0.0%) |
| 55 to 59 Years | 0 (0.0%) | 0 (0.0%) |
| 60 to 64 Years | 2 (5.9%) | 5 (11.9%) |
| 65 to 69 Years | 2 (5.9%) | 2 (4.8%) |
| 70 to 74 Years | 2 (5.9%) | 0 (0.0%) |
| 75 to 79 Years | 0 (0.0%) | 0 (0.0%) |
| 80 to 84 Years | 0 (0.0%) | 0 (0.0%) |
| 85 Years and over | 0 (0.0%) | 0 (0.0%) |
| Total | 34 (100.0%) | 42 (100.0%) |
Families and Households in Naples
Median Family Size in Naples
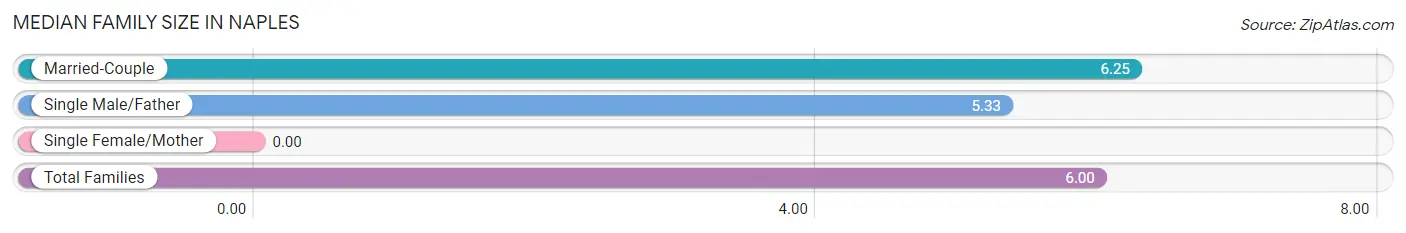
| Family Type | # Families | Family Size |
| Married-Couple | 8 (72.7%) | 6.25 |
| Single Male/Father | 3 (27.3%) | 5.33 |
| Single Female/Mother | 0 (0.0%) | - |
| Total Families | 11 (100.0%) | 6.00 |
Median Household Size in Naples
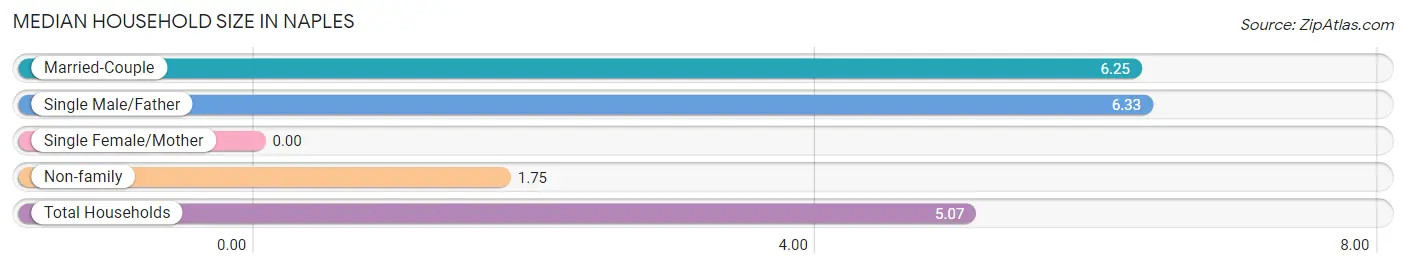
| Household Type | # Households | Household Size |
| Married-Couple | 8 (53.3%) | 6.25 |
| Single Male/Father | 3 (20.0%) | 6.33 |
| Single Female/Mother | 0 (0.0%) | - |
| Non-family | 4 (26.7%) | 1.75 |
| Total Households | 15 (100.0%) | 5.07 |
Household Size by Marriage Status in Naples
Out of a total of 15 households in Naples, 11 (73.3%) are family households, while 4 (26.7%) are nonfamily households. The most numerous type of family households are 5-person households, comprising 4, and the most common type of nonfamily households are 1-person households, comprising 2.
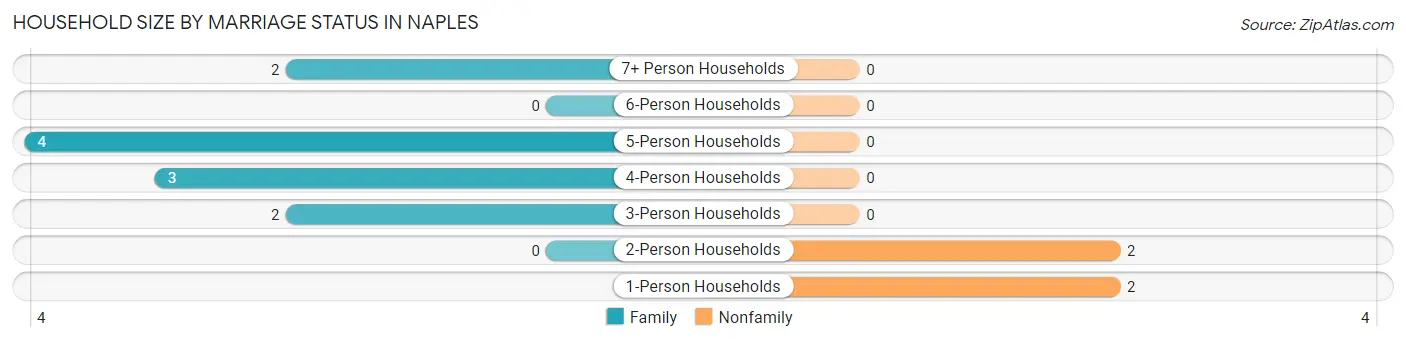
| Household Size | Family Households | Nonfamily Households |
| 1-Person Households | - | 2 (13.3%) |
| 2-Person Households | 0 (0.0%) | 2 (13.3%) |
| 3-Person Households | 2 (13.3%) | 0 (0.0%) |
| 4-Person Households | 3 (20.0%) | 0 (0.0%) |
| 5-Person Households | 4 (26.7%) | 0 (0.0%) |
| 6-Person Households | 0 (0.0%) | 0 (0.0%) |
| 7+ Person Households | 2 (13.3%) | 0 (0.0%) |
| Total | 11 (73.3%) | 4 (26.7%) |
Female Fertility in Naples
Fertility by Age in Naples
Average fertility rate in Naples is 143.0 births per 1,000 women. Women in the age bracket of 20 to 34 years have the highest fertility rate with 286.0 births per 1,000 women. Women in the age bracket of 20 to 34 years acount for 100.0% of all women with births.
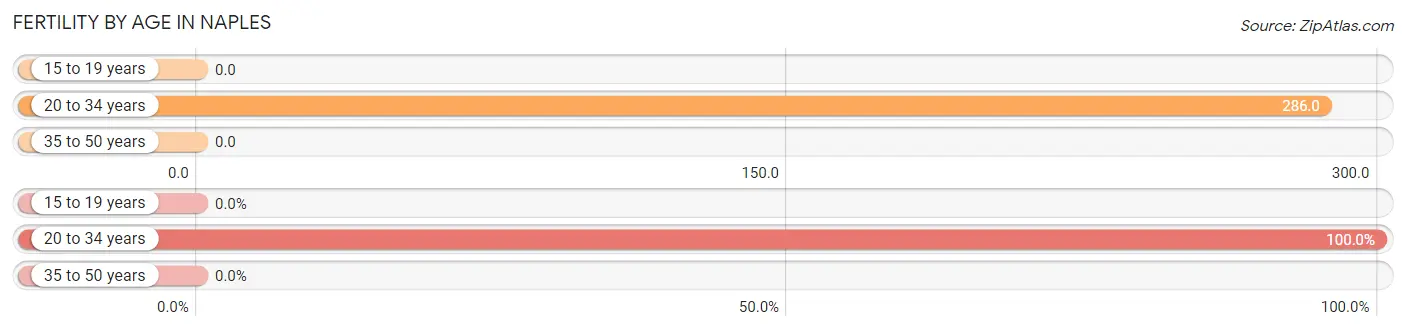
| Age Bracket | Women with Births | Births / 1,000 Women |
| 15 to 19 years | 0 (0.0%) | 0.0 |
| 20 to 34 years | 2 (100.0%) | 286.0 |
| 35 to 50 years | 0 (0.0%) | 0.0 |
| Total | 2 (100.0%) | 143.0 |
Fertility by Age by Marriage Status in Naples
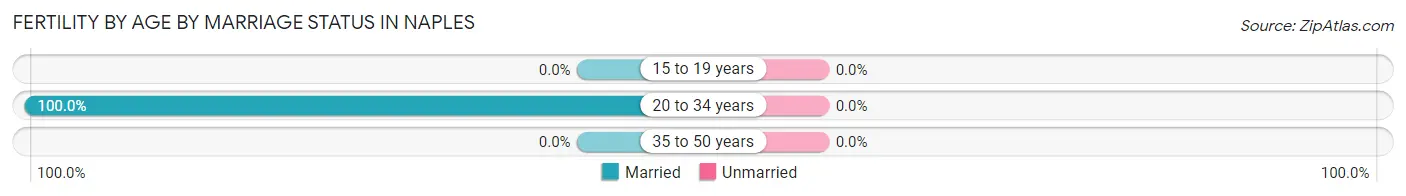
| Age Bracket | Married | Unmarried |
| 15 to 19 years | 0 (0.0%) | 0 (0.0%) |
| 20 to 34 years | 2 (100.0%) | 0 (0.0%) |
| 35 to 50 years | 0 (0.0%) | 0 (0.0%) |
| Total | 2 (100.0%) | 0 (0.0%) |
Fertility by Education in Naples
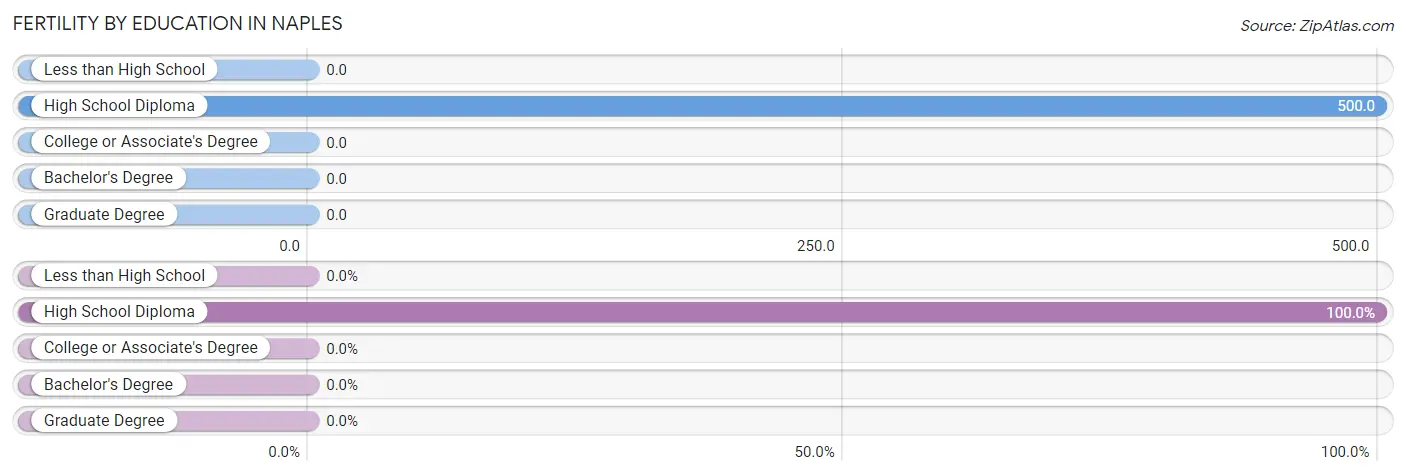
| Educational Attainment | Women with Births | Births / 1,000 Women |
| Less than High School | 0 (0.0%) | 0.0 |
| High School Diploma | 2 (100.0%) | 500.0 |
| College or Associate's Degree | 0 (0.0%) | 0.0 |
| Bachelor's Degree | 0 (0.0%) | 0.0 |
| Graduate Degree | 0 (0.0%) | 0.0 |
| Total | 2 (100.0%) | 143.0 |
Fertility by Education by Marriage Status in Naples
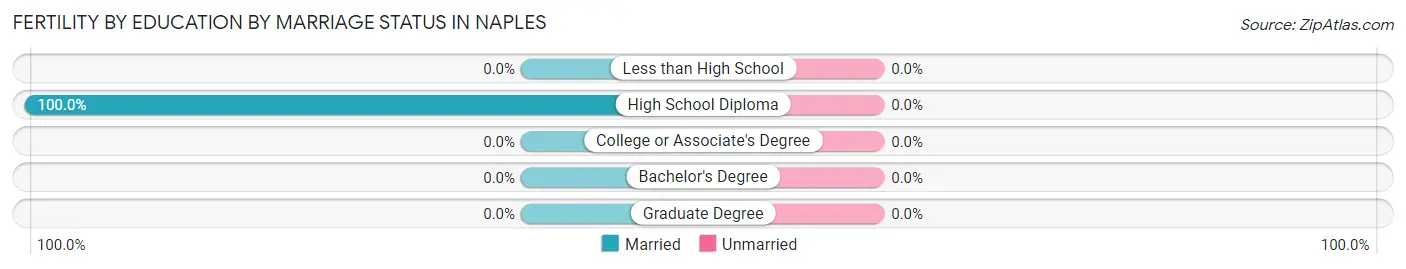
| Educational Attainment | Married | Unmarried |
| Less than High School | 0 (0.0%) | 0 (0.0%) |
| High School Diploma | 2 (100.0%) | 0 (0.0%) |
| College or Associate's Degree | 0 (0.0%) | 0 (0.0%) |
| Bachelor's Degree | 0 (0.0%) | 0 (0.0%) |
| Graduate Degree | 0 (0.0%) | 0 (0.0%) |
| Total | 2 (100.0%) | 0 (0.0%) |
Employment Characteristics in Naples
Employment by Class of Employer in Naples
Among the 24 employed individuals in Naples, private company employees (16 | 66.7%), federal government employees (4 | 16.7%), and self-employed (incorporated) (2 | 8.3%) make up the most common classes of employment.
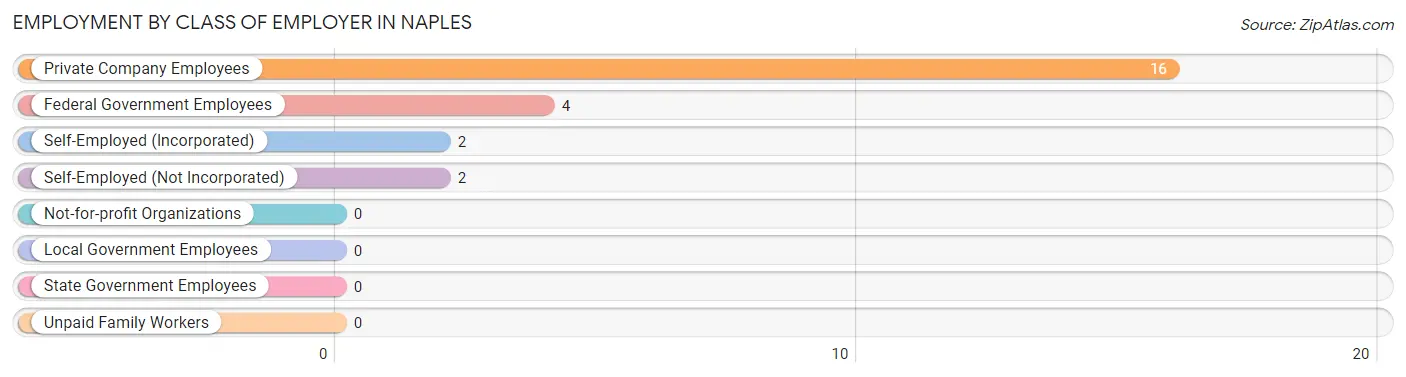
| Employer Class | # Employees | % Employees |
| Private Company Employees | 16 | 66.7% |
| Self-Employed (Incorporated) | 2 | 8.3% |
| Self-Employed (Not Incorporated) | 2 | 8.3% |
| Not-for-profit Organizations | 0 | 0.0% |
| Local Government Employees | 0 | 0.0% |
| State Government Employees | 0 | 0.0% |
| Federal Government Employees | 4 | 16.7% |
| Unpaid Family Workers | 0 | 0.0% |
| Total | 24 | 100.0% |
Employment Status by Age in Naples
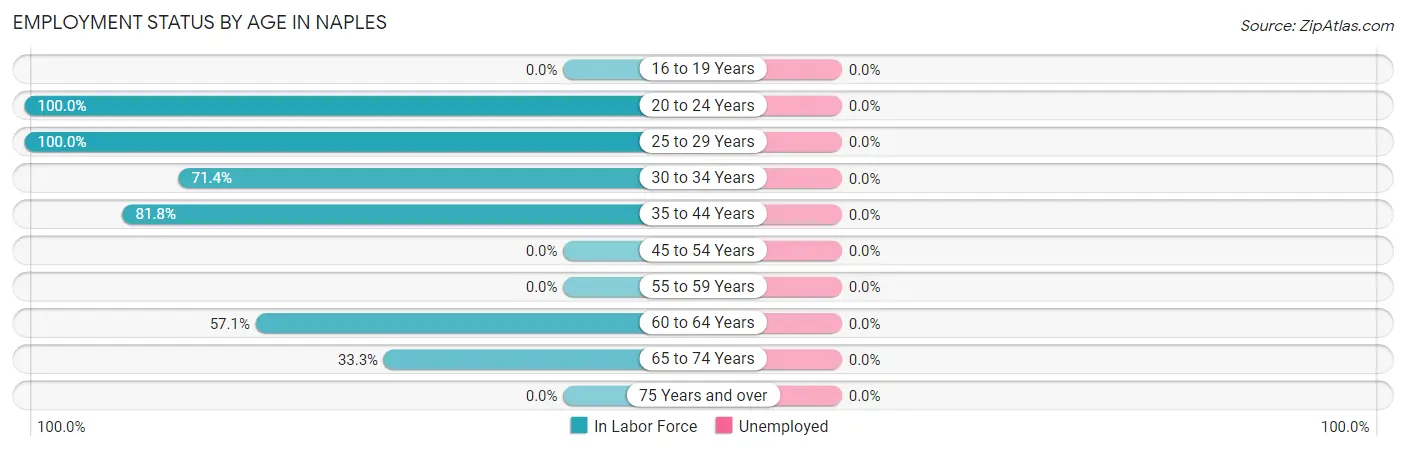
| Age Bracket | In Labor Force | Unemployed |
| 16 to 19 Years | 0 (0.0%) | 0 (0.0%) |
| 20 to 24 Years | 4 (100.0%) | 0 (0.0%) |
| 25 to 29 Years | 2 (100.0%) | 0 (0.0%) |
| 30 to 34 Years | 5 (71.4%) | 0 (0.0%) |
| 35 to 44 Years | 9 (81.8%) | 0 (0.0%) |
| 45 to 54 Years | 0 (0.0%) | 0 (0.0%) |
| 55 to 59 Years | 0 (0.0%) | 0 (0.0%) |
| 60 to 64 Years | 4 (57.1%) | 0 (0.0%) |
| 65 to 74 Years | 2 (33.3%) | 0 (0.0%) |
| 75 Years and over | 0 (0.0%) | 0 (0.0%) |
| Total | 26 (68.4%) | 0 (0.0%) |
Employment Status by Educational Attainment in Naples
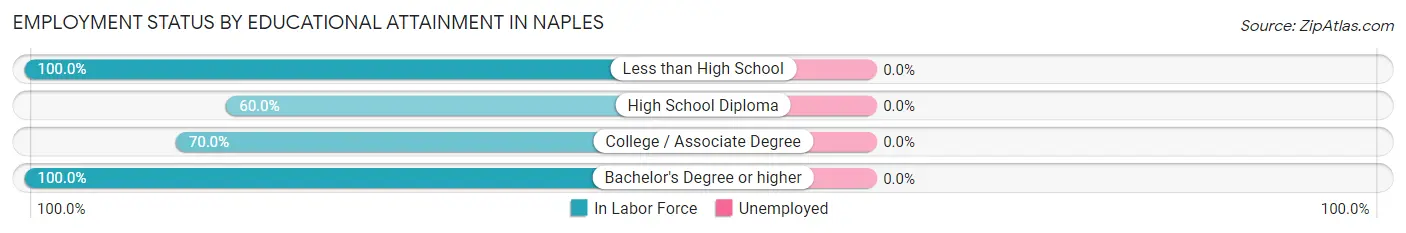
| Educational Attainment | In Labor Force | Unemployed |
| Less than High School | 3 (100.0%) | 0 (0.0%) |
| High School Diploma | 6 (60.0%) | 0 (0.0%) |
| College / Associate Degree | 7 (70.0%) | 0 (0.0%) |
| Bachelor's Degree or higher | 4 (100.0%) | 0 (0.0%) |
| Total | 20 (74.1%) | 0 (0.0%) |
Employment Occupations by Sex in Naples
Management, Business, Science and Arts Occupations
The most common Management, Business, Science and Arts occupations in Naples are Management (4 | 15.4%), Health Diagnosing & Treating (4 | 15.4%), and Health Technologists (4 | 15.4%).
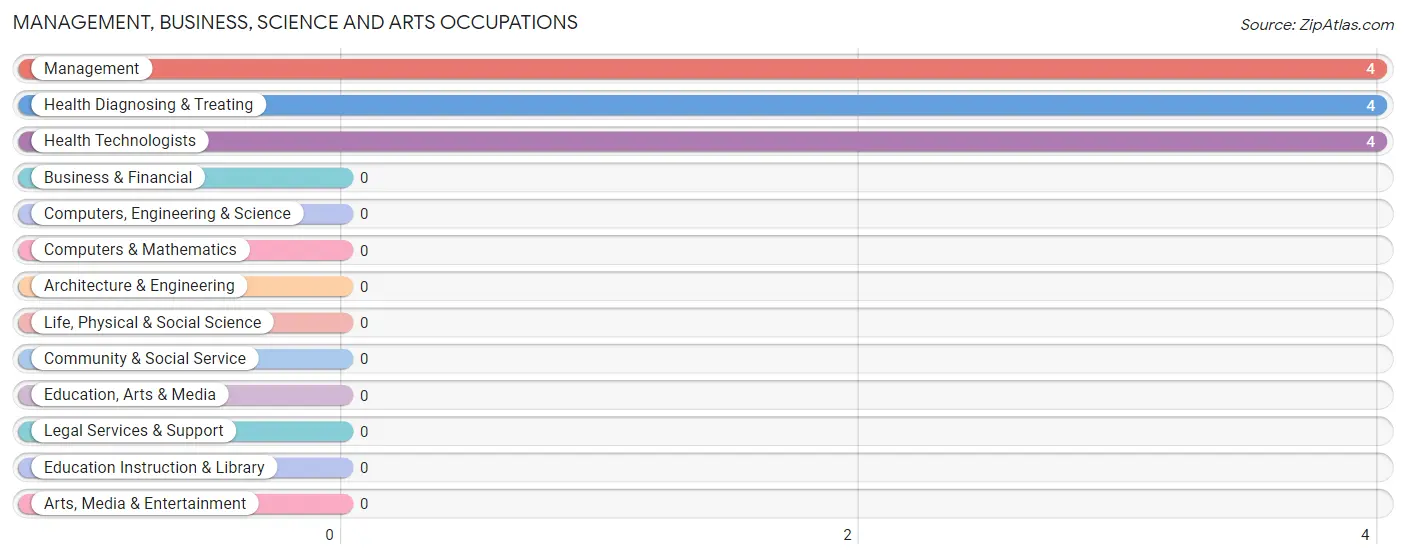
Management, Business, Science and Arts Occupations by Sex
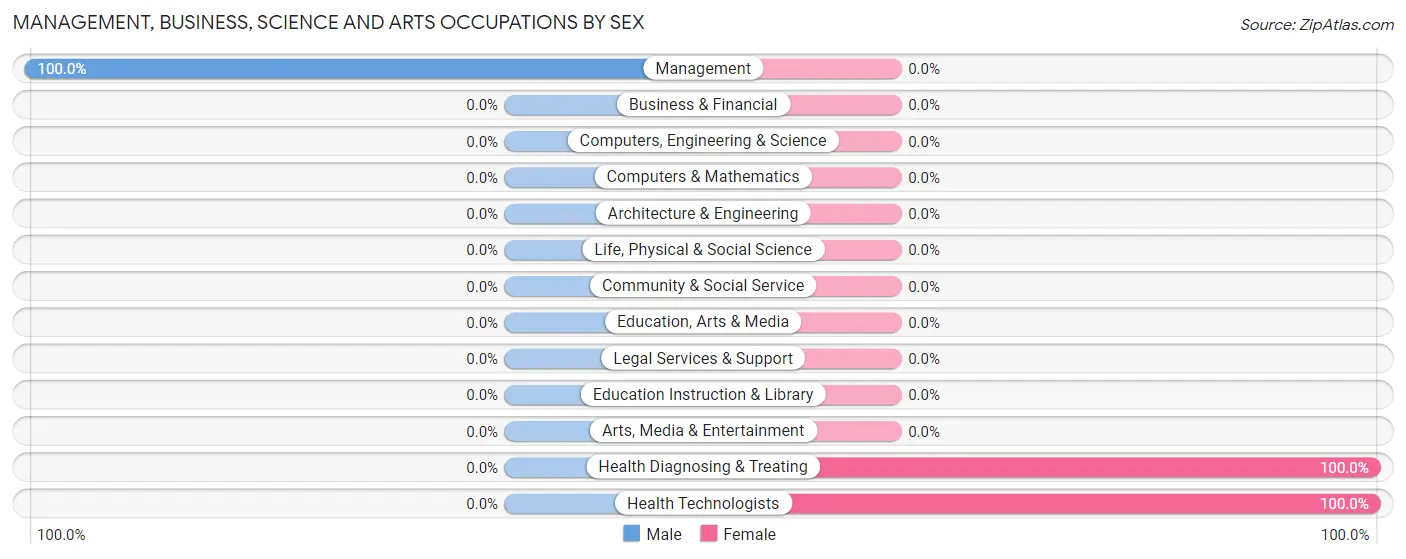
| Occupation | Male | Female |
| Management | 4 (100.0%) | 0 (0.0%) |
| Business & Financial | 0 (0.0%) | 0 (0.0%) |
| Computers, Engineering & Science | 0 (0.0%) | 0 (0.0%) |
| Computers & Mathematics | 0 (0.0%) | 0 (0.0%) |
| Architecture & Engineering | 0 (0.0%) | 0 (0.0%) |
| Life, Physical & Social Science | 0 (0.0%) | 0 (0.0%) |
| Community & Social Service | 0 (0.0%) | 0 (0.0%) |
| Education, Arts & Media | 0 (0.0%) | 0 (0.0%) |
| Legal Services & Support | 0 (0.0%) | 0 (0.0%) |
| Education Instruction & Library | 0 (0.0%) | 0 (0.0%) |
| Arts, Media & Entertainment | 0 (0.0%) | 0 (0.0%) |
| Health Diagnosing & Treating | 0 (0.0%) | 4 (100.0%) |
| Health Technologists | 0 (0.0%) | 4 (100.0%) |
| Total (Category) | 4 (50.0%) | 4 (50.0%) |
| Total (Overall) | 15 (57.7%) | 11 (42.3%) |
Services Occupations
Services Occupations by Sex
| Occupation | Male | Female |
| Healthcare Support | 0 (0.0%) | 0 (0.0%) |
| Security & Protection | 0 (0.0%) | 0 (0.0%) |
| Firefighting & Prevention | 0 (0.0%) | 0 (0.0%) |
| Law Enforcement | 0 (0.0%) | 0 (0.0%) |
| Food Preparation & Serving | 0 (0.0%) | 0 (0.0%) |
| Cleaning & Maintenance | 0 (0.0%) | 0 (0.0%) |
| Personal Care & Service | 0 (0.0%) | 0 (0.0%) |
| Total (Category) | 0 (0.0%) | 0 (0.0%) |
| Total (Overall) | 15 (57.7%) | 11 (42.3%) |
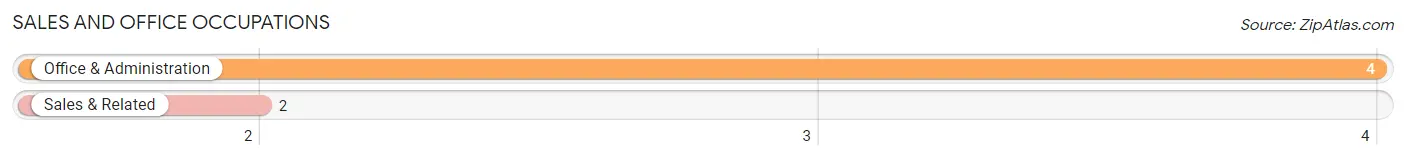
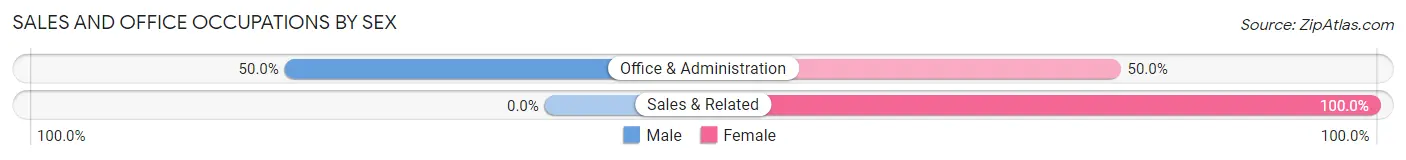
Sales and Office Occupations
The most common Sales and Office occupations in Naples are Office & Administration (4 | 15.4%), and Sales & Related (2 | 7.7%).
Sales and Office Occupations by Sex
| Occupation | Male | Female |
| Sales & Related | 0 (0.0%) | 2 (100.0%) |
| Office & Administration | 2 (50.0%) | 2 (50.0%) |
| Total (Category) | 2 (33.3%) | 4 (66.7%) |
| Total (Overall) | 15 (57.7%) | 11 (42.3%) |
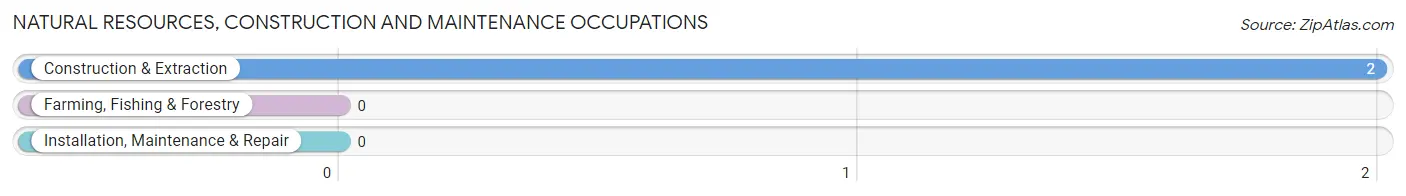
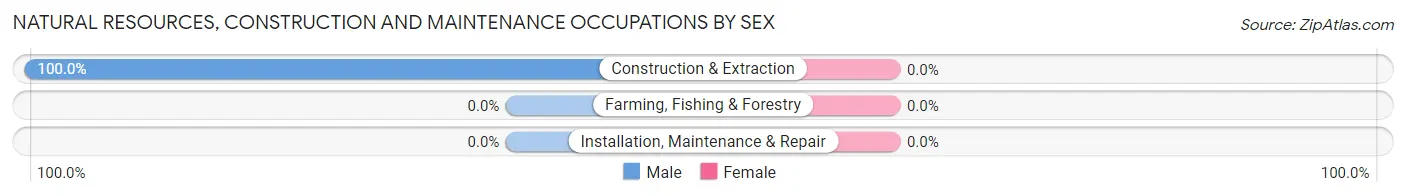
Natural Resources, Construction and Maintenance Occupations
The most common Natural Resources, Construction and Maintenance occupations in Naples are , and Construction & Extraction (2 | 7.7%).
Natural Resources, Construction and Maintenance Occupations by Sex
| Occupation | Male | Female |
| Farming, Fishing & Forestry | 0 (0.0%) | 0 (0.0%) |
| Construction & Extraction | 2 (100.0%) | 0 (0.0%) |
| Installation, Maintenance & Repair | 0 (0.0%) | 0 (0.0%) |
| Total (Category) | 2 (100.0%) | 0 (0.0%) |
| Total (Overall) | 15 (57.7%) | 11 (42.3%) |
Production, Transportation and Moving Occupations
The most common Production, Transportation and Moving occupations in Naples are Production (8 | 30.8%), and Transportation (2 | 7.7%).
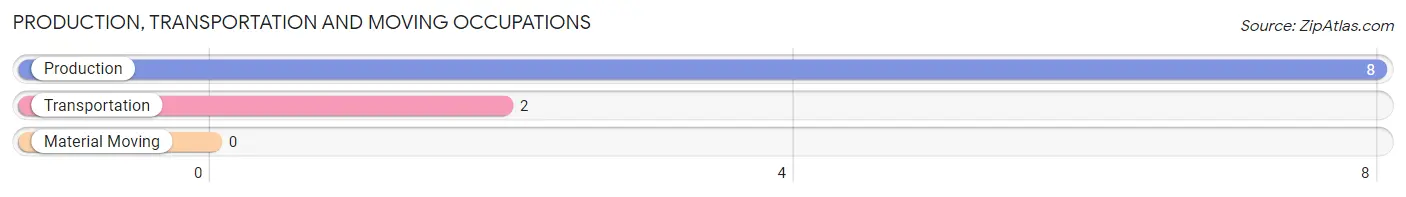
Production, Transportation and Moving Occupations by Sex
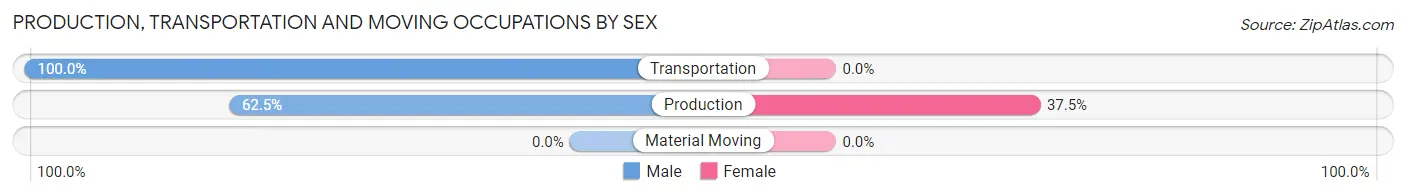
| Occupation | Male | Female |
| Production | 5 (62.5%) | 3 (37.5%) |
| Transportation | 2 (100.0%) | 0 (0.0%) |
| Material Moving | 0 (0.0%) | 0 (0.0%) |
| Total (Category) | 7 (70.0%) | 3 (30.0%) |
| Total (Overall) | 15 (57.7%) | 11 (42.3%) |
Employment Industries by Sex in Naples
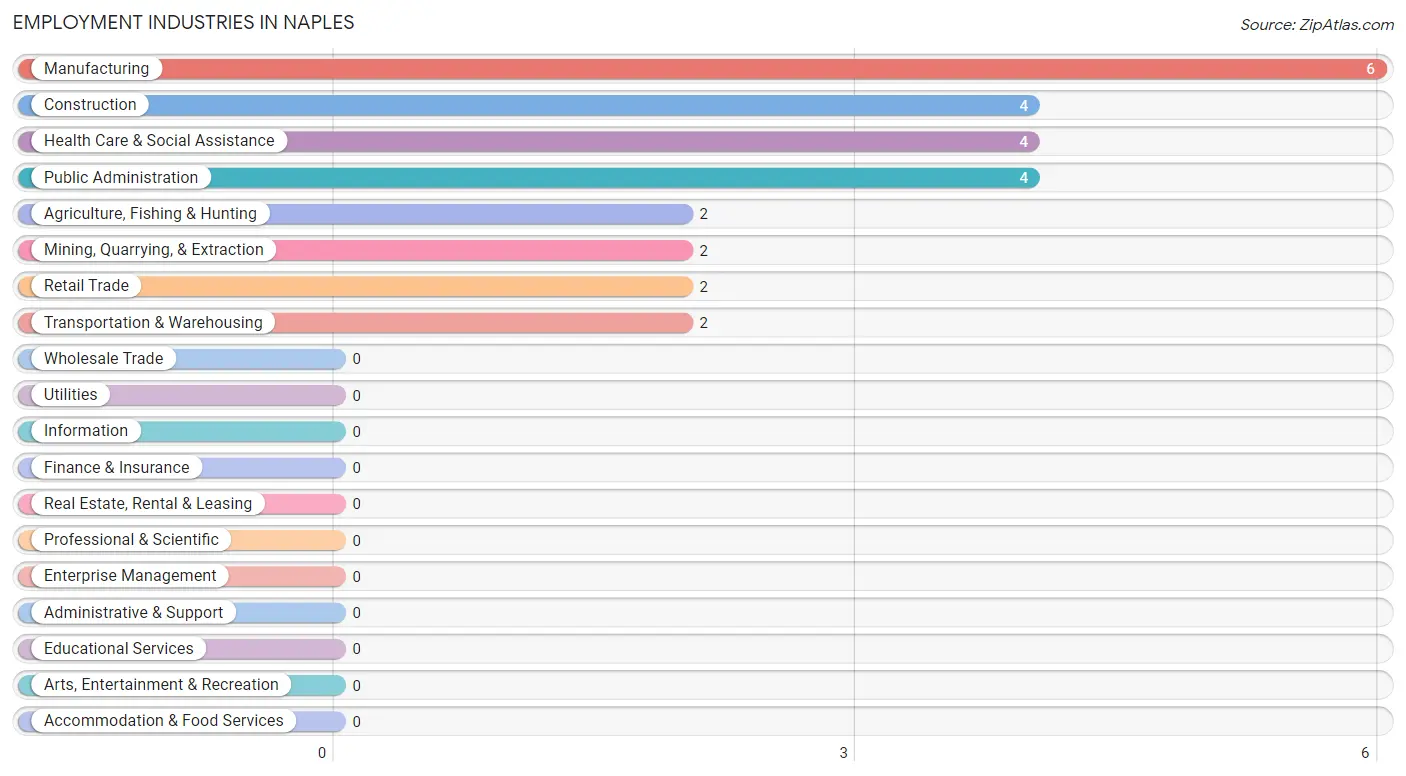
Employment Industries in Naples
The major employment industries in Naples include Manufacturing (6 | 23.1%), Construction (4 | 15.4%), Health Care & Social Assistance (4 | 15.4%), Public Administration (4 | 15.4%), and Agriculture, Fishing & Hunting (2 | 7.7%).
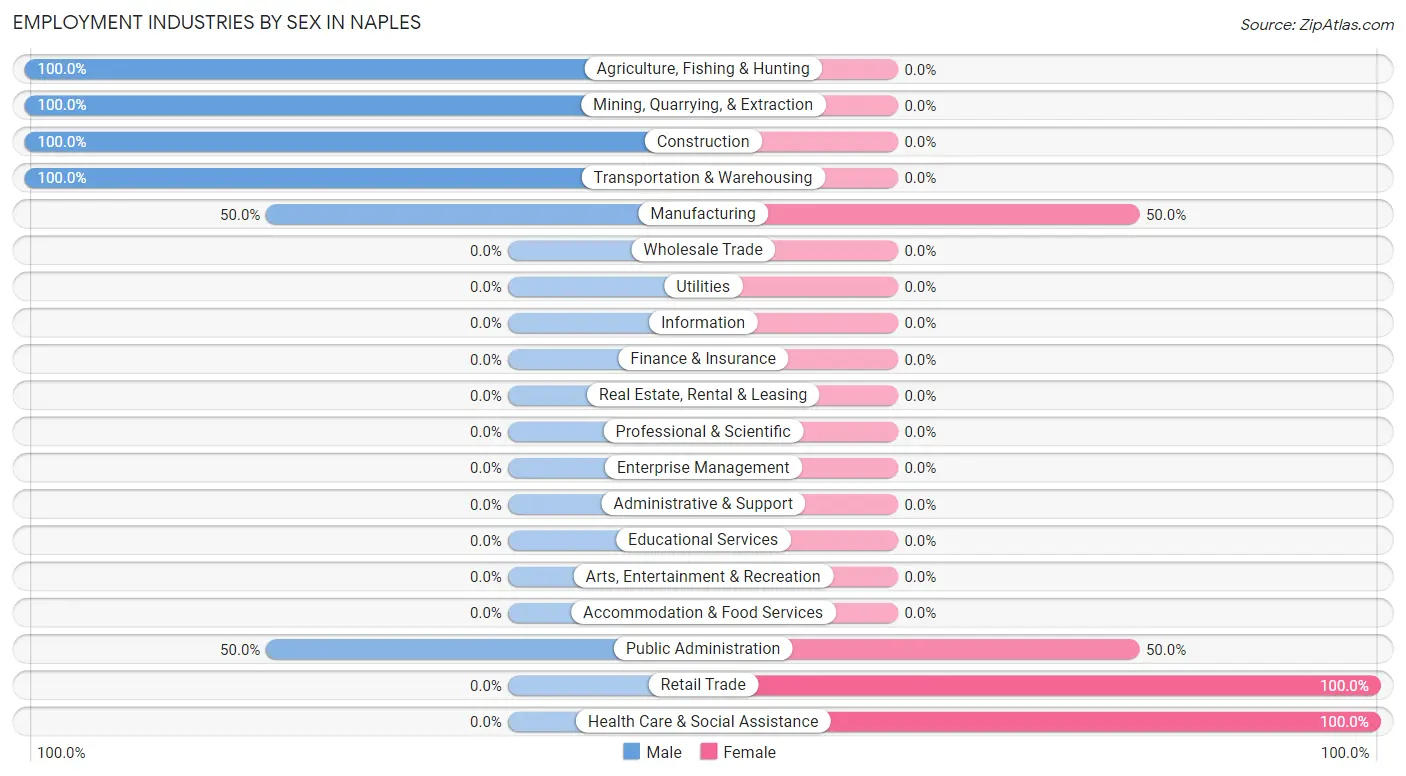
Employment Industries by Sex in Naples
The Naples industries that see more men than women are Agriculture, Fishing & Hunting (100.0%), Mining, Quarrying, & Extraction (100.0%), and Construction (100.0%), whereas the industries that tend to have a higher number of women are Retail Trade (100.0%), Health Care & Social Assistance (100.0%), and Manufacturing (50.0%).
| Industry | Male | Female |
| Agriculture, Fishing & Hunting | 2 (100.0%) | 0 (0.0%) |
| Mining, Quarrying, & Extraction | 2 (100.0%) | 0 (0.0%) |
| Construction | 4 (100.0%) | 0 (0.0%) |
| Manufacturing | 3 (50.0%) | 3 (50.0%) |
| Wholesale Trade | 0 (0.0%) | 0 (0.0%) |
| Retail Trade | 0 (0.0%) | 2 (100.0%) |
| Transportation & Warehousing | 2 (100.0%) | 0 (0.0%) |
| Utilities | 0 (0.0%) | 0 (0.0%) |
| Information | 0 (0.0%) | 0 (0.0%) |
| Finance & Insurance | 0 (0.0%) | 0 (0.0%) |
| Real Estate, Rental & Leasing | 0 (0.0%) | 0 (0.0%) |
| Professional & Scientific | 0 (0.0%) | 0 (0.0%) |
| Enterprise Management | 0 (0.0%) | 0 (0.0%) |
| Administrative & Support | 0 (0.0%) | 0 (0.0%) |
| Educational Services | 0 (0.0%) | 0 (0.0%) |
| Health Care & Social Assistance | 0 (0.0%) | 4 (100.0%) |
| Arts, Entertainment & Recreation | 0 (0.0%) | 0 (0.0%) |
| Accommodation & Food Services | 0 (0.0%) | 0 (0.0%) |
| Public Administration | 2 (50.0%) | 2 (50.0%) |
| Total | 15 (57.7%) | 11 (42.3%) |
Education in Naples
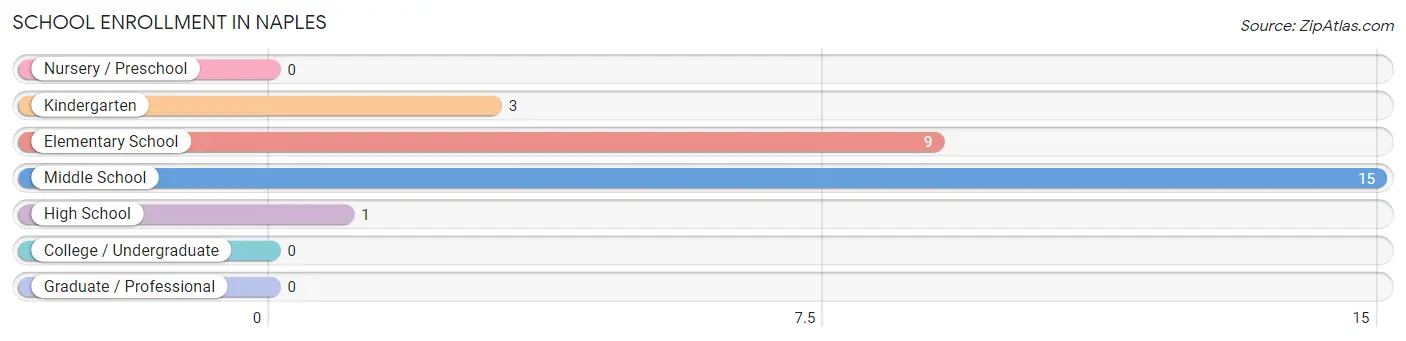
School Enrollment in Naples
The most common levels of schooling among the 28 students in Naples are middle school (15 | 53.6%), elementary school (9 | 32.1%), and kindergarten (3 | 10.7%).
| School Level | # Students | % Students |
| Nursery / Preschool | 0 | 0.0% |
| Kindergarten | 3 | 10.7% |
| Elementary School | 9 | 32.1% |
| Middle School | 15 | 53.6% |
| High School | 1 | 3.6% |
| College / Undergraduate | 0 | 0.0% |
| Graduate / Professional | 0 | 0.0% |
| Total | 28 | 100.0% |
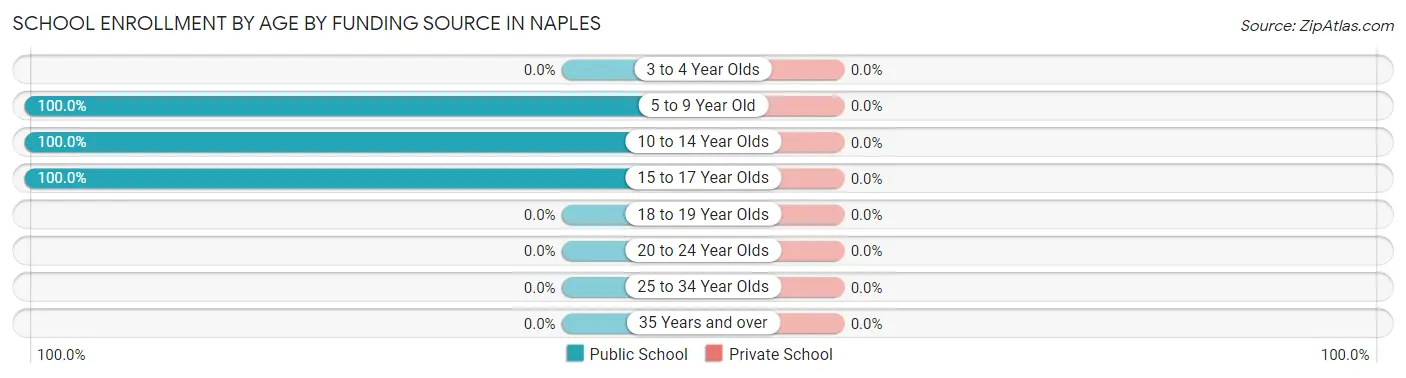
School Enrollment by Age by Funding Source in Naples
| Age Bracket | Public School | Private School |
| 3 to 4 Year Olds | 0 (0.0%) | 0 (0.0%) |
| 5 to 9 Year Old | 12 (100.0%) | 0 (0.0%) |
| 10 to 14 Year Olds | 15 (100.0%) | 0 (0.0%) |
| 15 to 17 Year Olds | 1 (100.0%) | 0 (0.0%) |
| 18 to 19 Year Olds | 0 (0.0%) | 0 (0.0%) |
| 20 to 24 Year Olds | 0 (0.0%) | 0 (0.0%) |
| 25 to 34 Year Olds | 0 (0.0%) | 0 (0.0%) |
| 35 Years and over | 0 (0.0%) | 0 (0.0%) |
| Total | 28 (100.0%) | 0 (0.0%) |
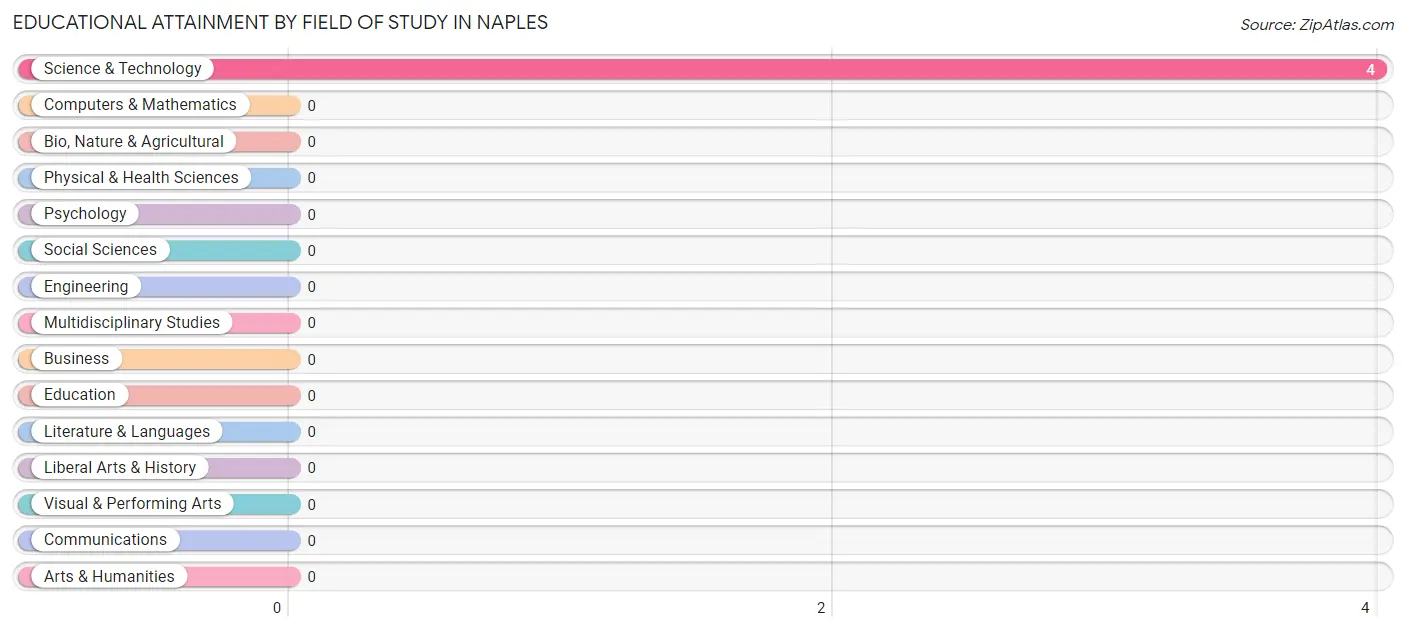
Educational Attainment by Field of Study in Naples
, and science & technology (4 | 100.0%) are the most common fields of study among 4 individuals in Naples who have obtained a bachelor's degree or higher.
| Field of Study | # Graduates | % Graduates |
| Computers & Mathematics | 0 | 0.0% |
| Bio, Nature & Agricultural | 0 | 0.0% |
| Physical & Health Sciences | 0 | 0.0% |
| Psychology | 0 | 0.0% |
| Social Sciences | 0 | 0.0% |
| Engineering | 0 | 0.0% |
| Multidisciplinary Studies | 0 | 0.0% |
| Science & Technology | 4 | 100.0% |
| Business | 0 | 0.0% |
| Education | 0 | 0.0% |
| Literature & Languages | 0 | 0.0% |
| Liberal Arts & History | 0 | 0.0% |
| Visual & Performing Arts | 0 | 0.0% |
| Communications | 0 | 0.0% |
| Arts & Humanities | 0 | 0.0% |
| Total | 4 | 100.0% |
Transportation & Commute in Naples
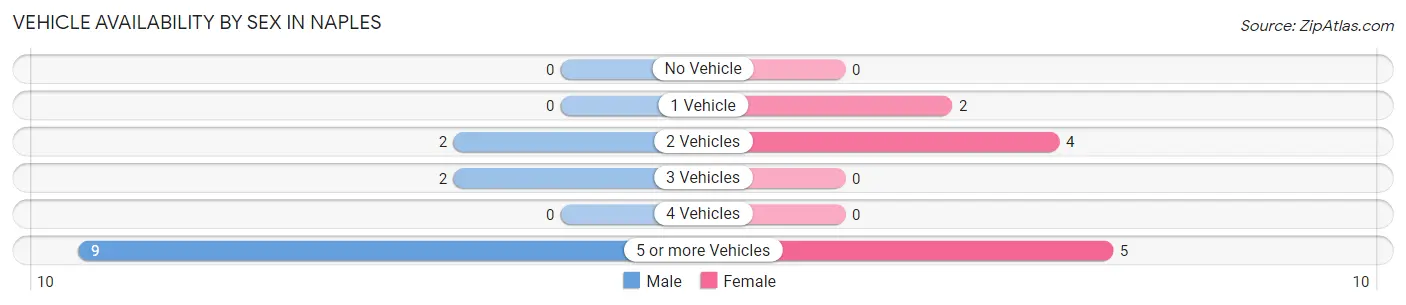
Vehicle Availability by Sex in Naples
The most prevalent vehicle ownership categories in Naples are males with 5 or more vehicles (9, accounting for 69.2%) and females with 5 or more vehicles (5, making up 81.8%).
| Vehicles Available | Male | Female |
| No Vehicle | 0 (0.0%) | 0 (0.0%) |
| 1 Vehicle | 0 (0.0%) | 2 (18.2%) |
| 2 Vehicles | 2 (15.4%) | 4 (36.4%) |
| 3 Vehicles | 2 (15.4%) | 0 (0.0%) |
| 4 Vehicles | 0 (0.0%) | 0 (0.0%) |
| 5 or more Vehicles | 9 (69.2%) | 5 (45.5%) |
| Total | 13 (100.0%) | 11 (100.0%) |
Commute Time in Naples
The most frequently occuring commute durations in Naples are 40 to 44 minutes (6 commuters, 27.3%), 45 to 59 minutes (6 commuters, 27.3%), and 30 to 34 minutes (4 commuters, 18.2%).
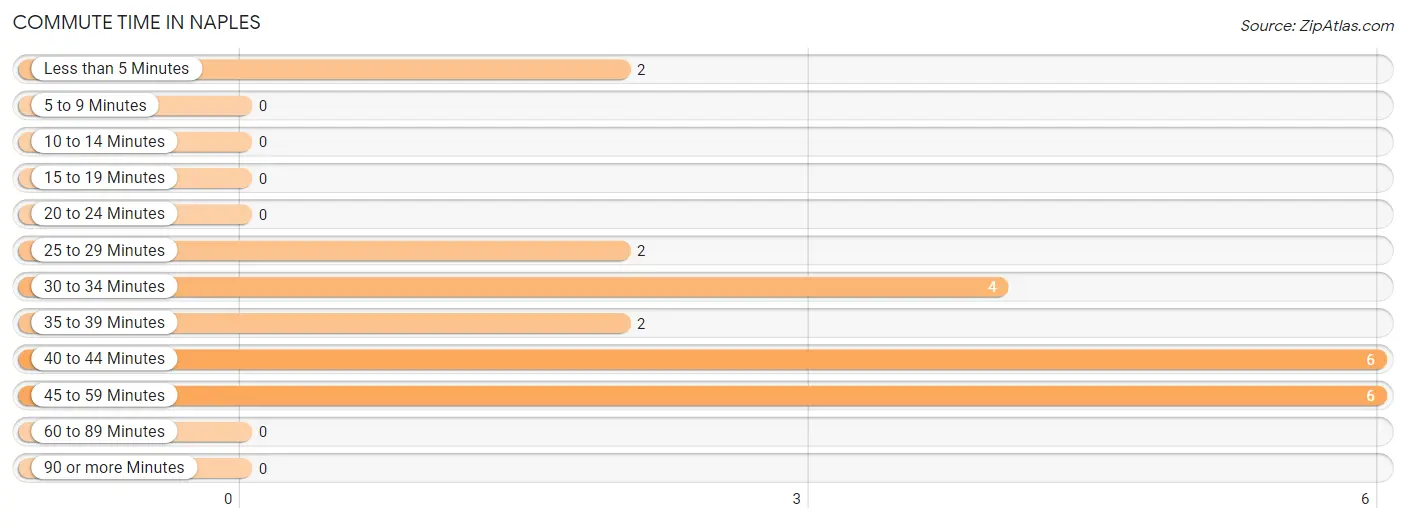
| Commute Time | # Commuters | % Commuters |
| Less than 5 Minutes | 2 | 9.1% |
| 5 to 9 Minutes | 0 | 0.0% |
| 10 to 14 Minutes | 0 | 0.0% |
| 15 to 19 Minutes | 0 | 0.0% |
| 20 to 24 Minutes | 0 | 0.0% |
| 25 to 29 Minutes | 2 | 9.1% |
| 30 to 34 Minutes | 4 | 18.2% |
| 35 to 39 Minutes | 2 | 9.1% |
| 40 to 44 Minutes | 6 | 27.3% |
| 45 to 59 Minutes | 6 | 27.3% |
| 60 to 89 Minutes | 0 | 0.0% |
| 90 or more Minutes | 0 | 0.0% |
Commute Time by Sex in Naples
The most common commute times in Naples are 40 to 44 minutes (3 commuters, 27.3%) for males and 30 to 34 minutes (4 commuters, 36.4%) for females.
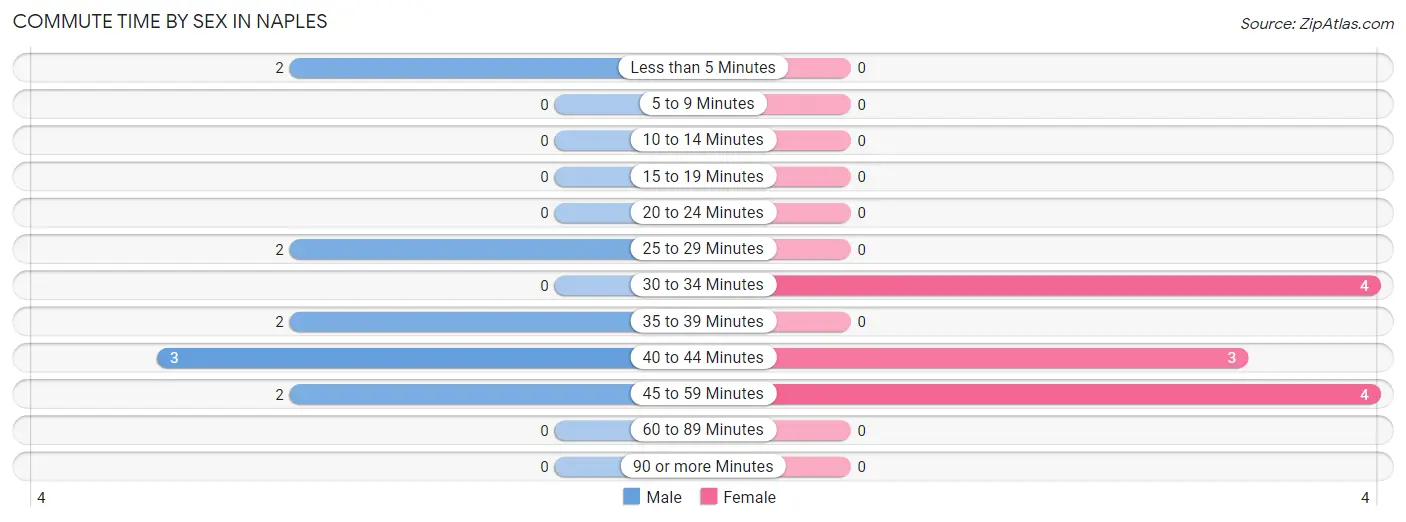
| Commute Time | Male | Female |
| Less than 5 Minutes | 2 (18.2%) | 0 (0.0%) |
| 5 to 9 Minutes | 0 (0.0%) | 0 (0.0%) |
| 10 to 14 Minutes | 0 (0.0%) | 0 (0.0%) |
| 15 to 19 Minutes | 0 (0.0%) | 0 (0.0%) |
| 20 to 24 Minutes | 0 (0.0%) | 0 (0.0%) |
| 25 to 29 Minutes | 2 (18.2%) | 0 (0.0%) |
| 30 to 34 Minutes | 0 (0.0%) | 4 (36.4%) |
| 35 to 39 Minutes | 2 (18.2%) | 0 (0.0%) |
| 40 to 44 Minutes | 3 (27.3%) | 3 (27.3%) |
| 45 to 59 Minutes | 2 (18.2%) | 4 (36.4%) |
| 60 to 89 Minutes | 0 (0.0%) | 0 (0.0%) |
| 90 or more Minutes | 0 (0.0%) | 0 (0.0%) |
Time of Departure to Work by Sex in Naples
The most frequent times of departure to work in Naples are 6:00 AM to 6:29 AM (6, 54.5%) for males and 7:30 AM to 7:59 AM (4, 36.4%) for females.
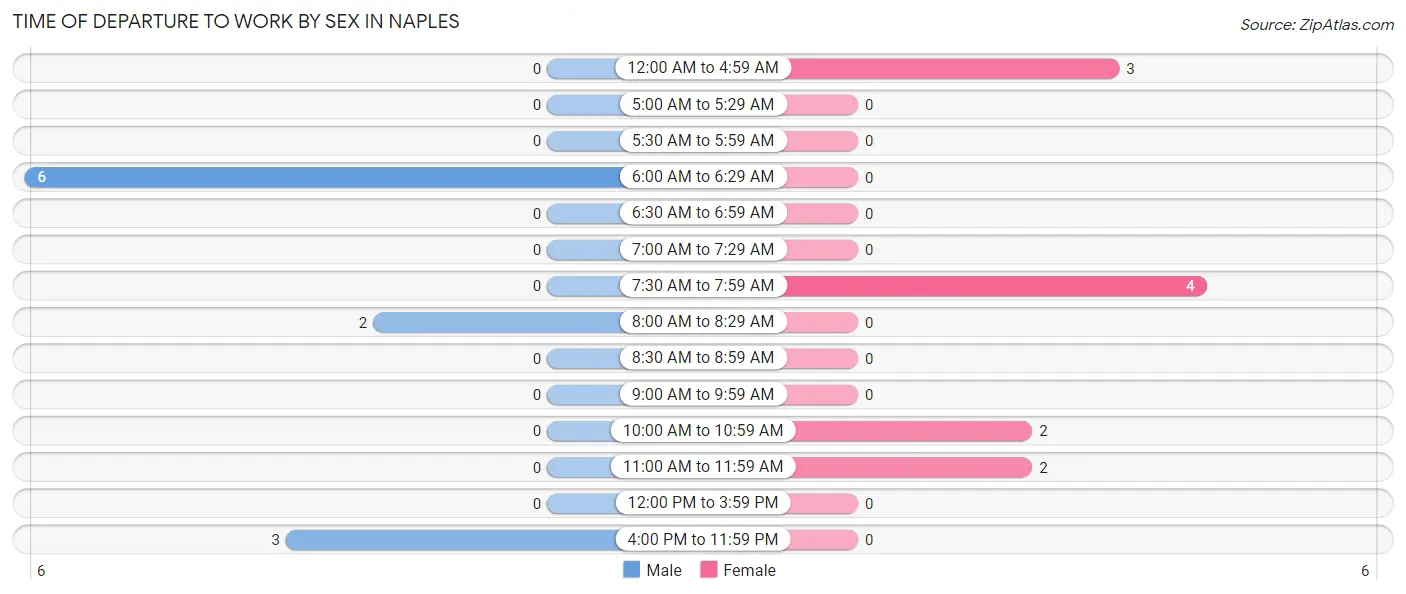
| Time of Departure | Male | Female |
| 12:00 AM to 4:59 AM | 0 (0.0%) | 3 (27.3%) |
| 5:00 AM to 5:29 AM | 0 (0.0%) | 0 (0.0%) |
| 5:30 AM to 5:59 AM | 0 (0.0%) | 0 (0.0%) |
| 6:00 AM to 6:29 AM | 6 (54.5%) | 0 (0.0%) |
| 6:30 AM to 6:59 AM | 0 (0.0%) | 0 (0.0%) |
| 7:00 AM to 7:29 AM | 0 (0.0%) | 0 (0.0%) |
| 7:30 AM to 7:59 AM | 0 (0.0%) | 4 (36.4%) |
| 8:00 AM to 8:29 AM | 2 (18.2%) | 0 (0.0%) |
| 8:30 AM to 8:59 AM | 0 (0.0%) | 0 (0.0%) |
| 9:00 AM to 9:59 AM | 0 (0.0%) | 0 (0.0%) |
| 10:00 AM to 10:59 AM | 0 (0.0%) | 2 (18.2%) |
| 11:00 AM to 11:59 AM | 0 (0.0%) | 2 (18.2%) |
| 12:00 PM to 3:59 PM | 0 (0.0%) | 0 (0.0%) |
| 4:00 PM to 11:59 PM | 3 (27.3%) | 0 (0.0%) |
| Total | 11 (100.0%) | 11 (100.0%) |
Housing Occupancy in Naples
Occupancy by Ownership in Naples
Of the total 15 dwellings in Naples, owner-occupied units account for 13 (86.7%), while renter-occupied units make up 2 (13.3%).
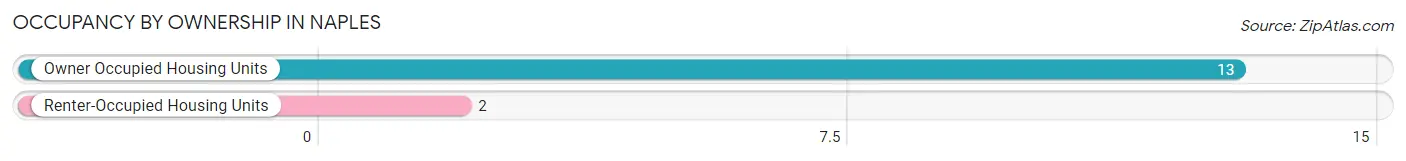
| Occupancy | # Housing Units | % Housing Units |
| Owner Occupied Housing Units | 13 | 86.7% |
| Renter-Occupied Housing Units | 2 | 13.3% |
| Total Occupied Housing Units | 15 | 100.0% |
Occupancy by Household Size in Naples
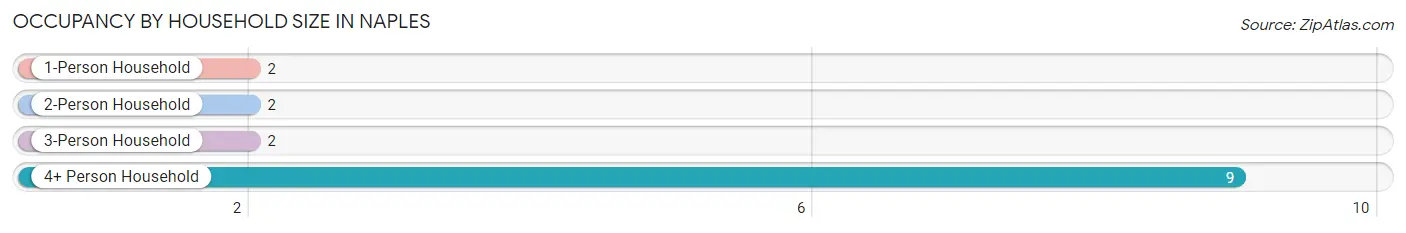
| Household Size | # Housing Units | % Housing Units |
| 1-Person Household | 2 | 13.3% |
| 2-Person Household | 2 | 13.3% |
| 3-Person Household | 2 | 13.3% |
| 4+ Person Household | 9 | 60.0% |
| Total Housing Units | 15 | 100.0% |
Occupancy by Ownership by Household Size in Naples
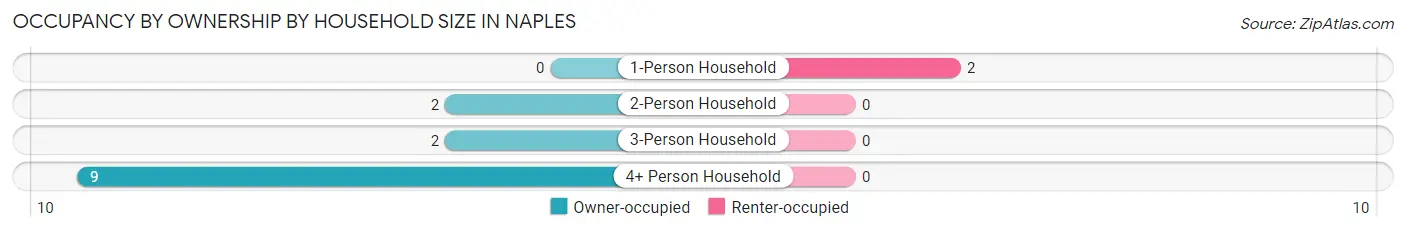
| Household Size | Owner-occupied | Renter-occupied |
| 1-Person Household | 0 (0.0%) | 2 (100.0%) |
| 2-Person Household | 2 (100.0%) | 0 (0.0%) |
| 3-Person Household | 2 (100.0%) | 0 (0.0%) |
| 4+ Person Household | 9 (100.0%) | 0 (0.0%) |
| Total Housing Units | 13 (86.7%) | 2 (13.3%) |
Occupancy by Educational Attainment in Naples
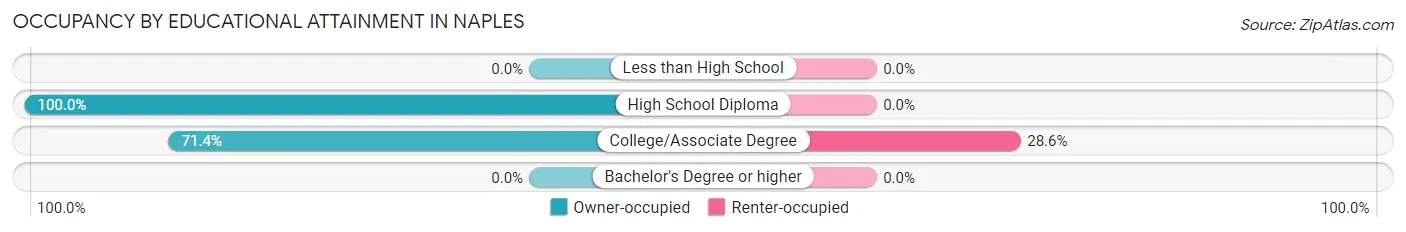
| Household Size | Owner-occupied | Renter-occupied |
| Less than High School | 0 (0.0%) | 0 (0.0%) |
| High School Diploma | 8 (100.0%) | 0 (0.0%) |
| College/Associate Degree | 5 (71.4%) | 2 (28.6%) |
| Bachelor's Degree or higher | 0 (0.0%) | 0 (0.0%) |
Occupancy by Age of Householder in Naples
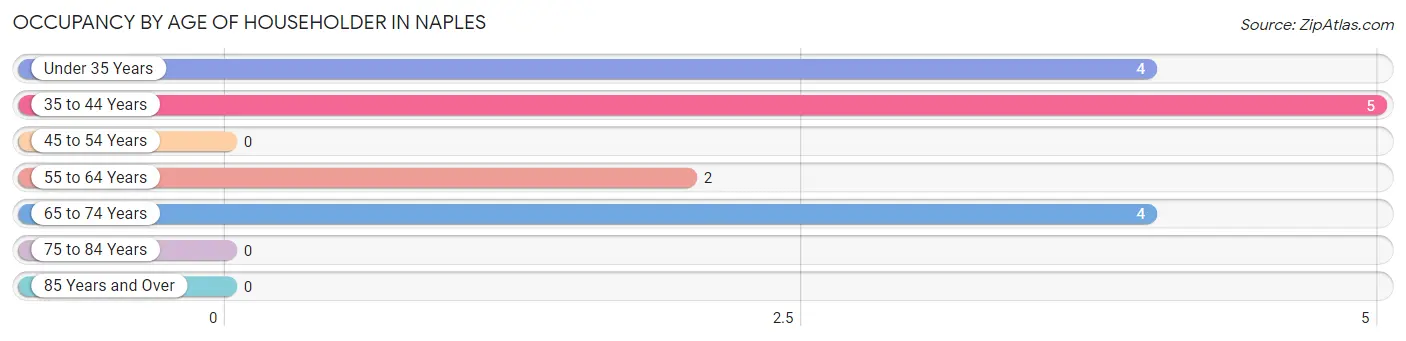
| Age Bracket | # Households | % Households |
| Under 35 Years | 4 | 26.7% |
| 35 to 44 Years | 5 | 33.3% |
| 45 to 54 Years | 0 | 0.0% |
| 55 to 64 Years | 2 | 13.3% |
| 65 to 74 Years | 4 | 26.7% |
| 75 to 84 Years | 0 | 0.0% |
| 85 Years and Over | 0 | 0.0% |
| Total | 15 | 100.0% |
Housing Finances in Naples
Median Income by Occupancy in Naples
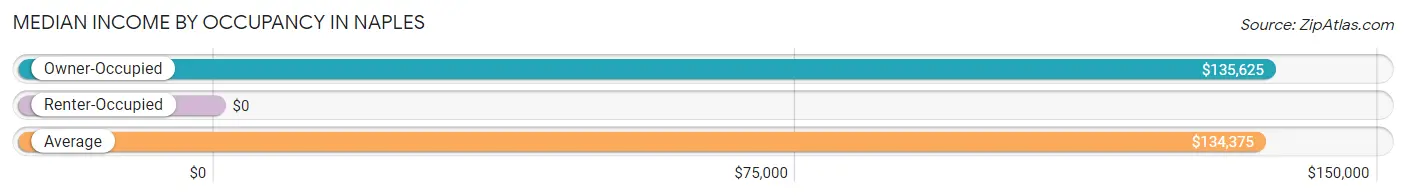
| Occupancy Type | # Households | Median Income |
| Owner-Occupied | 13 (86.7%) | $135,625 |
| Renter-Occupied | 2 (13.3%) | $0 |
| Average | 15 (100.0%) | $134,375 |
Occupancy by Householder Income Bracket in Naples
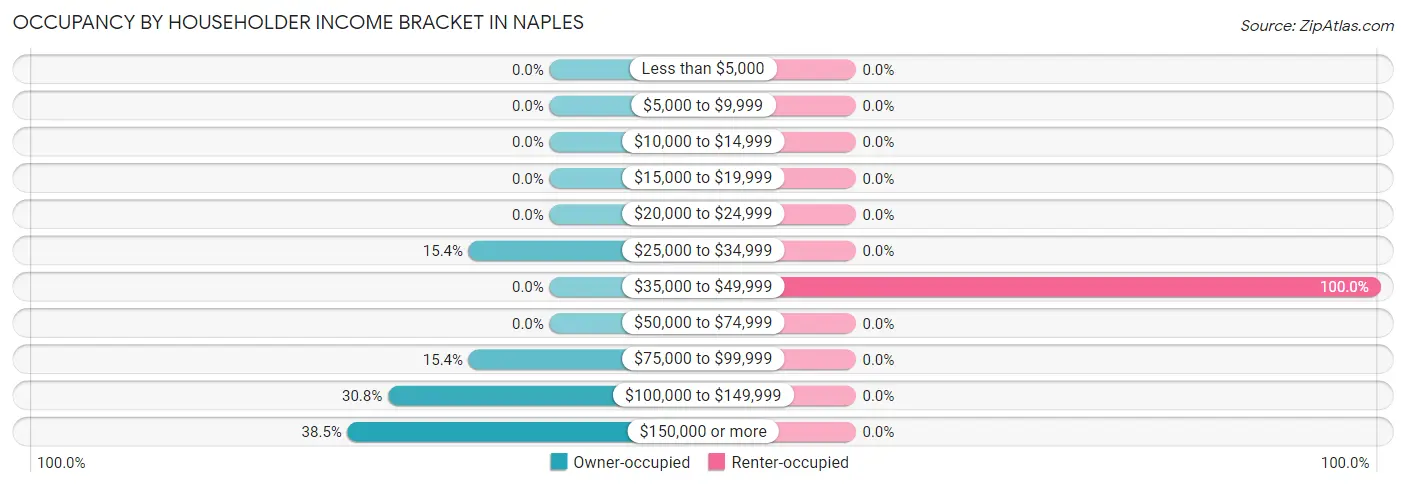
| Income Bracket | Owner-occupied | Renter-occupied |
| Less than $5,000 | 0 (0.0%) | 0 (0.0%) |
| $5,000 to $9,999 | 0 (0.0%) | 0 (0.0%) |
| $10,000 to $14,999 | 0 (0.0%) | 0 (0.0%) |
| $15,000 to $19,999 | 0 (0.0%) | 0 (0.0%) |
| $20,000 to $24,999 | 0 (0.0%) | 0 (0.0%) |
| $25,000 to $34,999 | 2 (15.4%) | 0 (0.0%) |
| $35,000 to $49,999 | 0 (0.0%) | 2 (100.0%) |
| $50,000 to $74,999 | 0 (0.0%) | 0 (0.0%) |
| $75,000 to $99,999 | 2 (15.4%) | 0 (0.0%) |
| $100,000 to $149,999 | 4 (30.8%) | 0 (0.0%) |
| $150,000 or more | 5 (38.5%) | 0 (0.0%) |
| Total | 13 (100.0%) | 2 (100.0%) |
Monthly Housing Cost Tiers in Naples
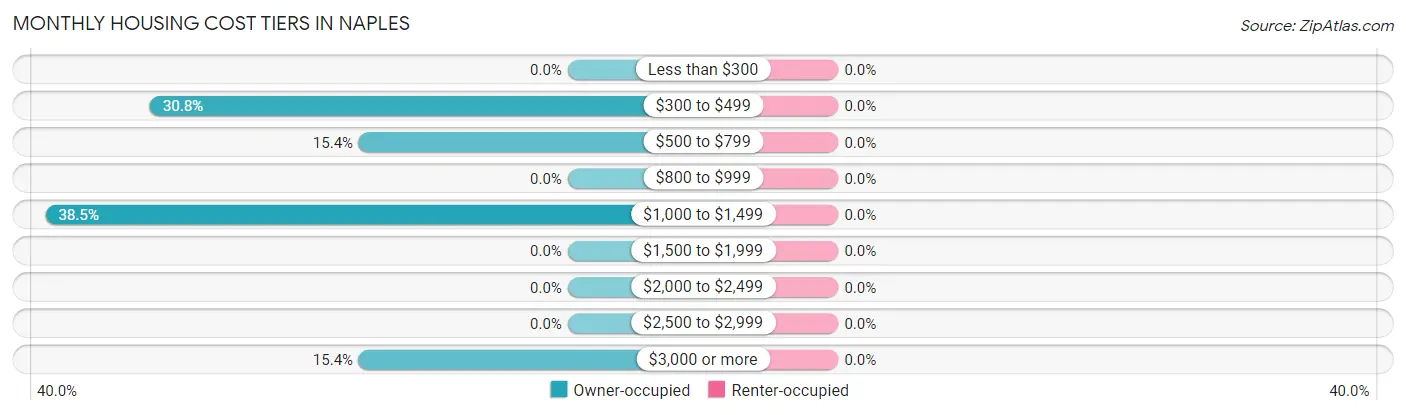
| Monthly Cost | Owner-occupied | Renter-occupied |
| Less than $300 | 0 (0.0%) | 0 (0.0%) |
| $300 to $499 | 4 (30.8%) | 0 (0.0%) |
| $500 to $799 | 2 (15.4%) | 0 (0.0%) |
| $800 to $999 | 0 (0.0%) | 0 (0.0%) |
| $1,000 to $1,499 | 5 (38.5%) | 0 (0.0%) |
| $1,500 to $1,999 | 0 (0.0%) | 0 (0.0%) |
| $2,000 to $2,499 | 0 (0.0%) | 0 (0.0%) |
| $2,500 to $2,999 | 0 (0.0%) | 0 (0.0%) |
| $3,000 or more | 2 (15.4%) | 0 (0.0%) |
| Total | 13 (100.0%) | 2 (100.0%) |
Physical Housing Characteristics in Naples
Housing Structures in Naples
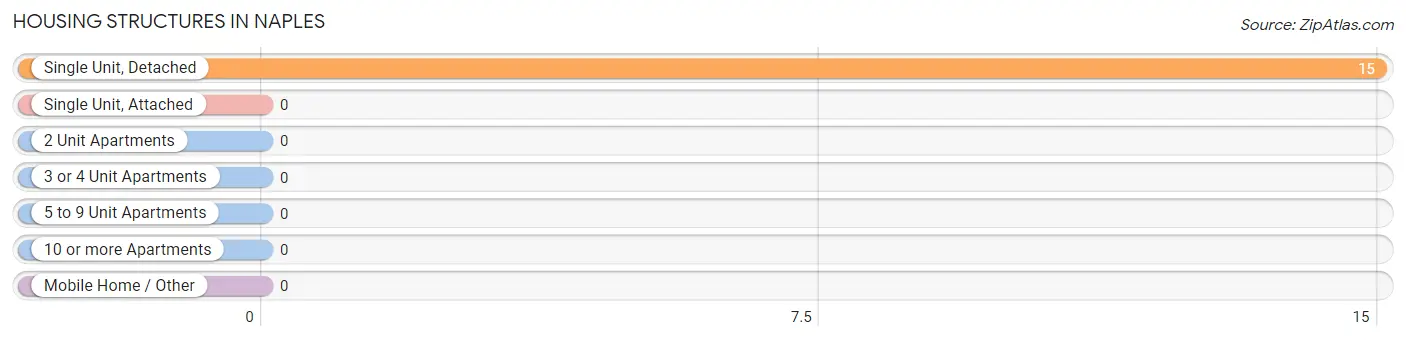
| Structure Type | # Housing Units | % Housing Units |
| Single Unit, Detached | 15 | 100.0% |
| Single Unit, Attached | 0 | 0.0% |
| 2 Unit Apartments | 0 | 0.0% |
| 3 or 4 Unit Apartments | 0 | 0.0% |
| 5 to 9 Unit Apartments | 0 | 0.0% |
| 10 or more Apartments | 0 | 0.0% |
| Mobile Home / Other | 0 | 0.0% |
| Total | 15 | 100.0% |
Housing Structures by Occupancy in Naples
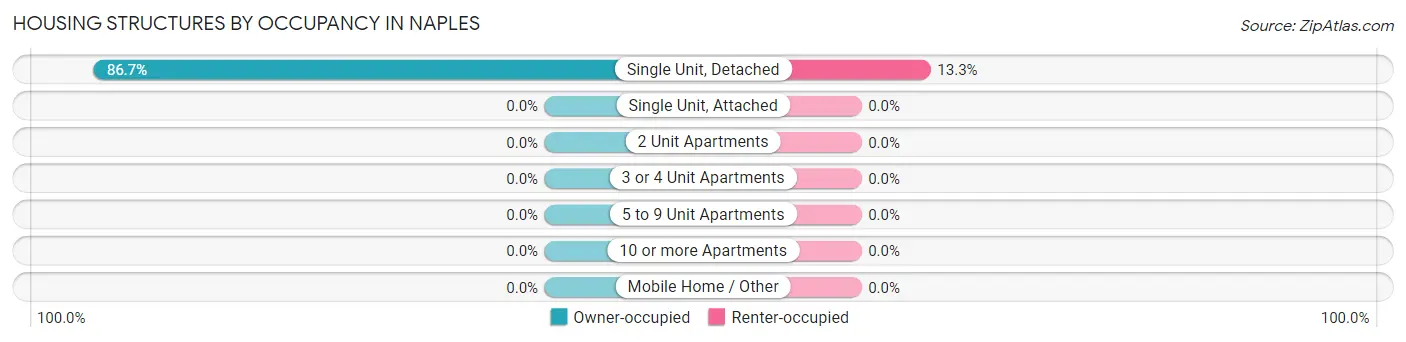
| Structure Type | Owner-occupied | Renter-occupied |
| Single Unit, Detached | 13 (86.7%) | 2 (13.3%) |
| Single Unit, Attached | 0 (0.0%) | 0 (0.0%) |
| 2 Unit Apartments | 0 (0.0%) | 0 (0.0%) |
| 3 or 4 Unit Apartments | 0 (0.0%) | 0 (0.0%) |
| 5 to 9 Unit Apartments | 0 (0.0%) | 0 (0.0%) |
| 10 or more Apartments | 0 (0.0%) | 0 (0.0%) |
| Mobile Home / Other | 0 (0.0%) | 0 (0.0%) |
| Total | 13 (86.7%) | 2 (13.3%) |
Housing Structures by Number of Rooms in Naples
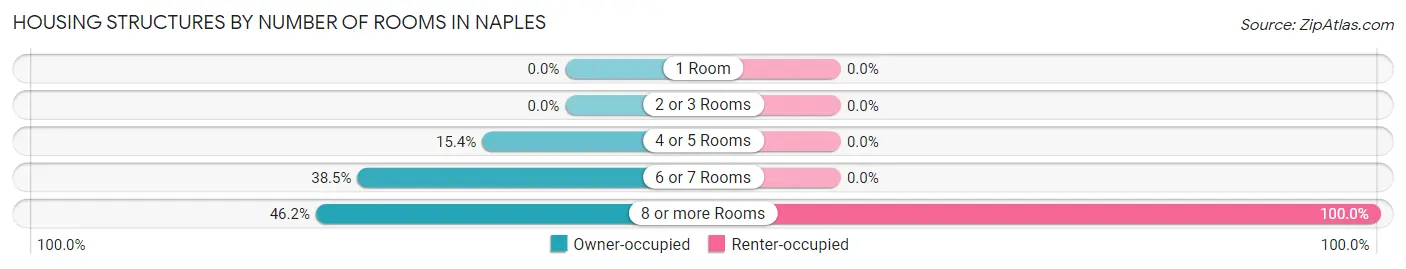
| Number of Rooms | Owner-occupied | Renter-occupied |
| 1 Room | 0 (0.0%) | 0 (0.0%) |
| 2 or 3 Rooms | 0 (0.0%) | 0 (0.0%) |
| 4 or 5 Rooms | 2 (15.4%) | 0 (0.0%) |
| 6 or 7 Rooms | 5 (38.5%) | 0 (0.0%) |
| 8 or more Rooms | 6 (46.2%) | 2 (100.0%) |
| Total | 13 (100.0%) | 2 (100.0%) |
Housing Structure by Heating Type in Naples
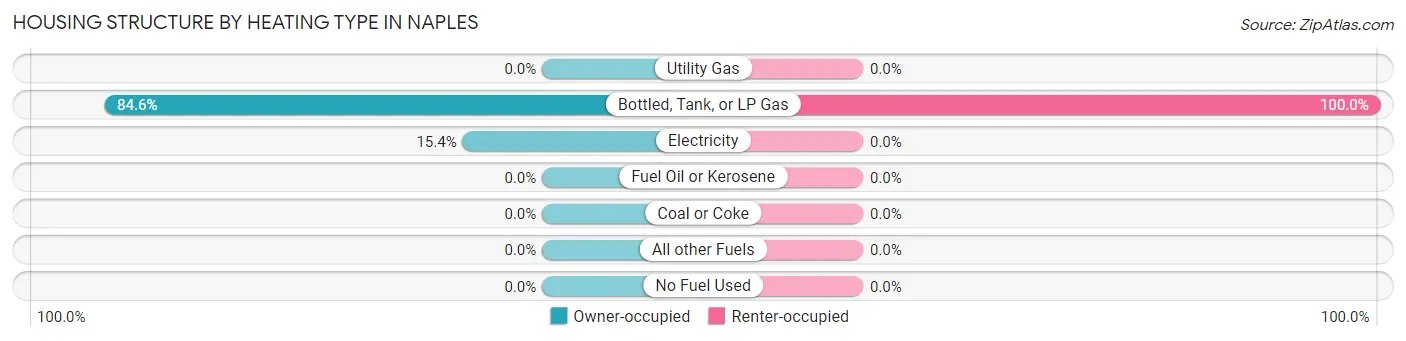
| Heating Type | Owner-occupied | Renter-occupied |
| Utility Gas | 0 (0.0%) | 0 (0.0%) |
| Bottled, Tank, or LP Gas | 11 (84.6%) | 2 (100.0%) |
| Electricity | 2 (15.4%) | 0 (0.0%) |
| Fuel Oil or Kerosene | 0 (0.0%) | 0 (0.0%) |
| Coal or Coke | 0 (0.0%) | 0 (0.0%) |
| All other Fuels | 0 (0.0%) | 0 (0.0%) |
| No Fuel Used | 0 (0.0%) | 0 (0.0%) |
| Total | 13 (100.0%) | 2 (100.0%) |
Household Vehicle Usage in Naples
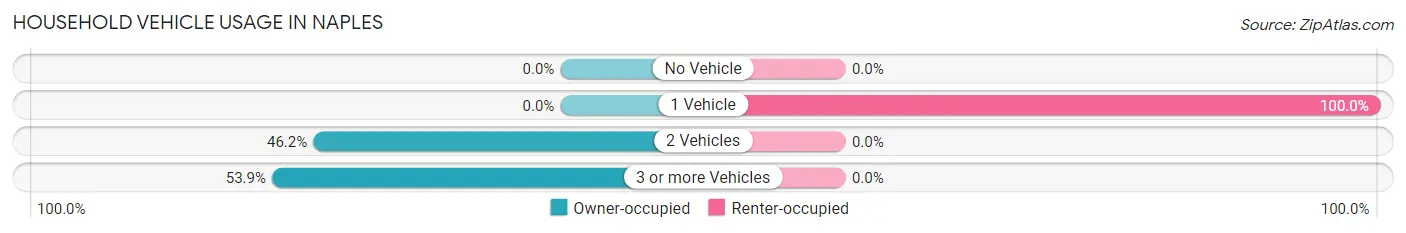
| Vehicles per Household | Owner-occupied | Renter-occupied |
| No Vehicle | 0 (0.0%) | 0 (0.0%) |
| 1 Vehicle | 0 (0.0%) | 2 (100.0%) |
| 2 Vehicles | 6 (46.2%) | 0 (0.0%) |
| 3 or more Vehicles | 7 (53.8%) | 0 (0.0%) |
| Total | 13 (100.0%) | 2 (100.0%) |
Real Estate & Mortgages in Naples
Real Estate and Mortgage Overview in Naples
| Characteristic | Without Mortgage | With Mortgage |
| Housing Units | 10 | 3 |
| Median Property Value | - | - |
| Median Household Income | $133,750 | $3 |
| Monthly Housing Costs | - | - |
| Real Estate Taxes | $225 | $0 |
Property Value by Mortgage Status in Naples
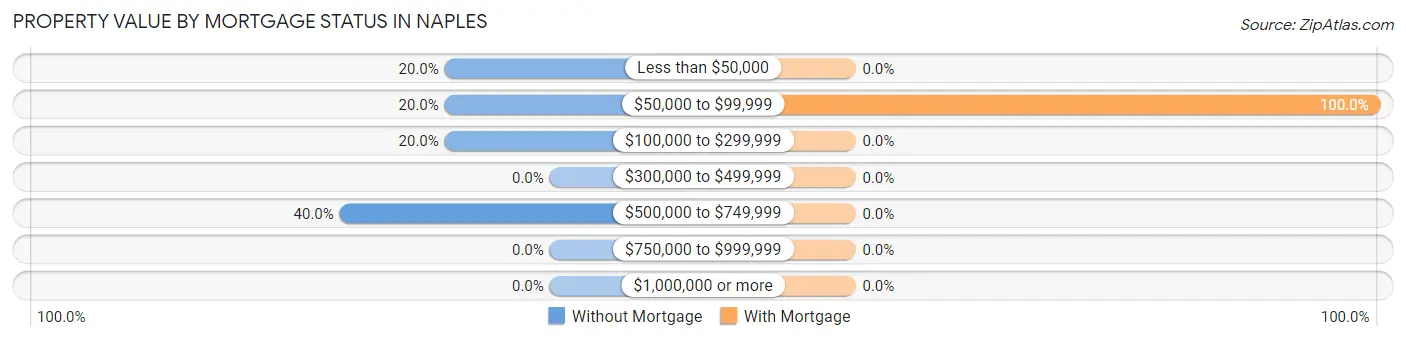
| Property Value | Without Mortgage | With Mortgage |
| Less than $50,000 | 2 (20.0%) | 0 (0.0%) |
| $50,000 to $99,999 | 2 (20.0%) | 3 (100.0%) |
| $100,000 to $299,999 | 2 (20.0%) | 0 (0.0%) |
| $300,000 to $499,999 | 0 (0.0%) | 0 (0.0%) |
| $500,000 to $749,999 | 4 (40.0%) | 0 (0.0%) |
| $750,000 to $999,999 | 0 (0.0%) | 0 (0.0%) |
| $1,000,000 or more | 0 (0.0%) | 0 (0.0%) |
| Total | 10 (100.0%) | 3 (100.0%) |
Household Income by Mortgage Status in Naples
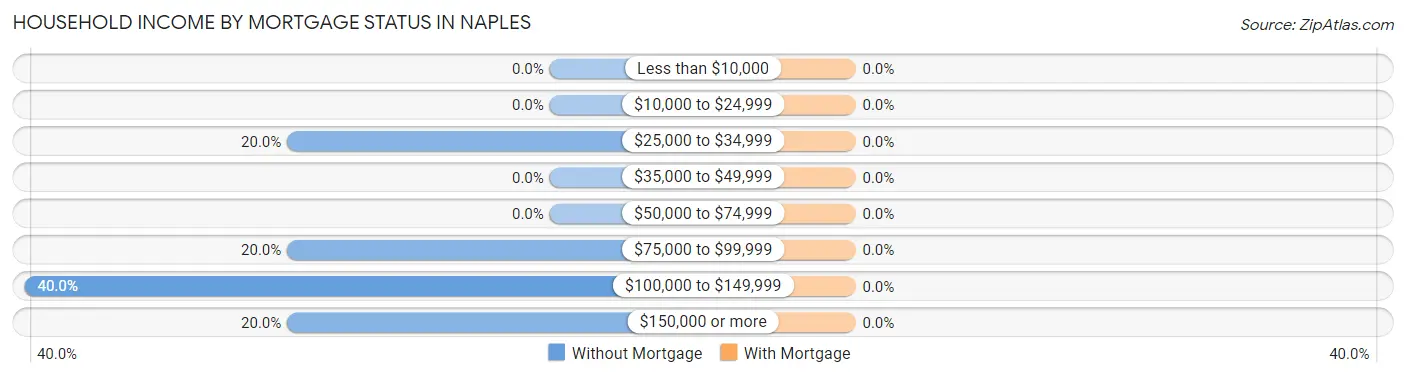
| Household Income | Without Mortgage | With Mortgage |
| Less than $10,000 | 0 (0.0%) | 0 (0.0%) |
| $10,000 to $24,999 | 0 (0.0%) | 0 (0.0%) |
| $25,000 to $34,999 | 2 (20.0%) | 0 (0.0%) |
| $35,000 to $49,999 | 0 (0.0%) | 0 (0.0%) |
| $50,000 to $74,999 | 0 (0.0%) | 0 (0.0%) |
| $75,000 to $99,999 | 2 (20.0%) | 0 (0.0%) |
| $100,000 to $149,999 | 4 (40.0%) | 0 (0.0%) |
| $150,000 or more | 2 (20.0%) | 0 (0.0%) |
| Total | 10 (100.0%) | 3 (100.0%) |
Property Value to Household Income Ratio in Naples
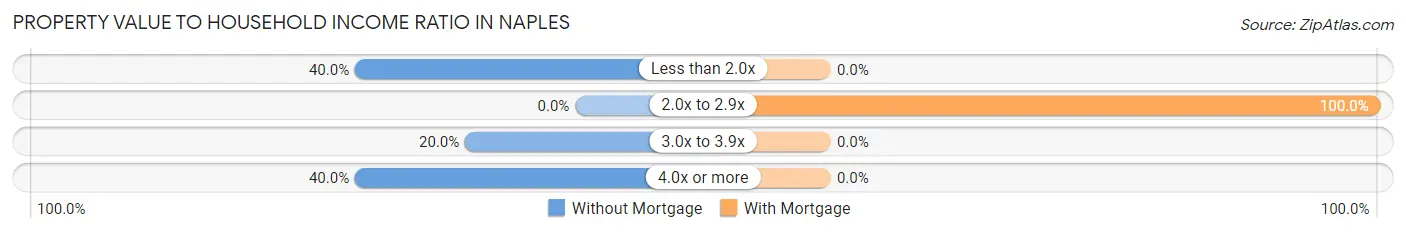
| Value-to-Income Ratio | Without Mortgage | With Mortgage |
| Less than 2.0x | 4 (40.0%) | 0 (0.0%) |
| 2.0x to 2.9x | 0 (0.0%) | 3 (100.0%) |
| 3.0x to 3.9x | 2 (20.0%) | 0 (0.0%) |
| 4.0x or more | 4 (40.0%) | 0 (0.0%) |
| Total | 10 (100.0%) | 3 (100.0%) |
Real Estate Taxes by Mortgage Status in Naples
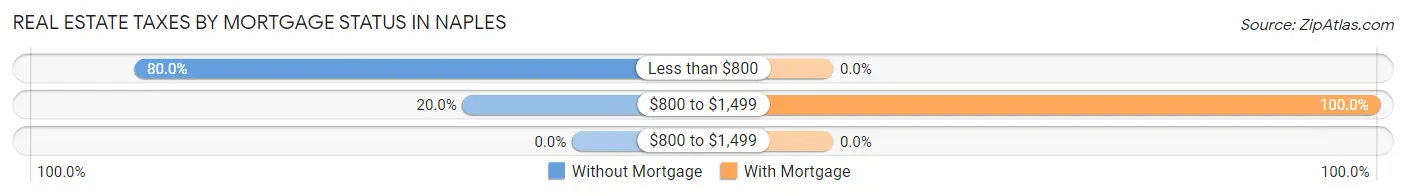
| Property Taxes | Without Mortgage | With Mortgage |
| Less than $800 | 8 (80.0%) | 0 (0.0%) |
| $800 to $1,499 | 2 (20.0%) | 3 (100.0%) |
| $800 to $1,499 | 0 (0.0%) | 0 (0.0%) |
| Total | 10 (100.0%) | 3 (100.0%) |
Health & Disability in Naples
Health Insurance Coverage by Age in Naples
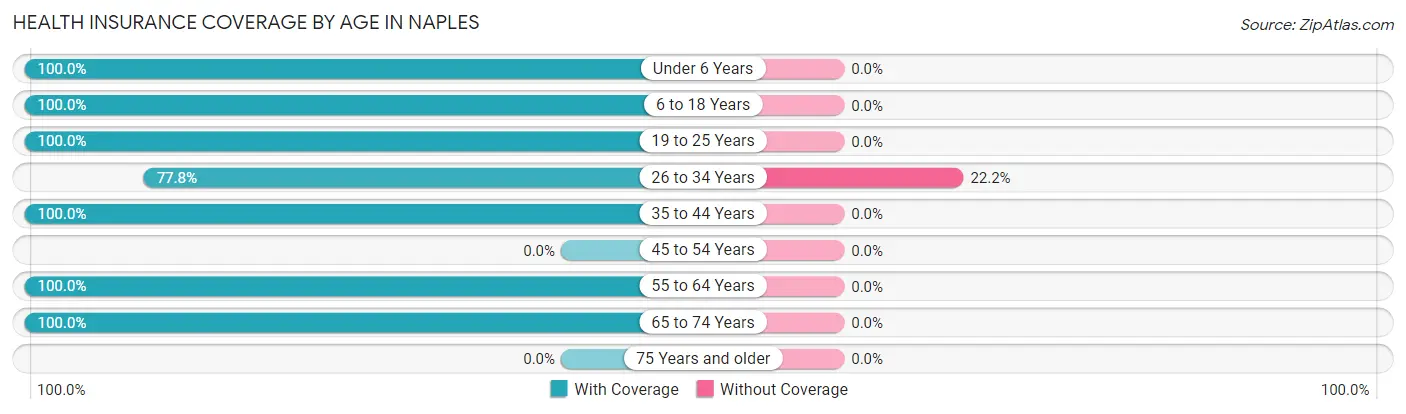
| Age Bracket | With Coverage | Without Coverage |
| Under 6 Years | 14 (100.0%) | 0 (0.0%) |
| 6 to 18 Years | 25 (100.0%) | 0 (0.0%) |
| 19 to 25 Years | 4 (100.0%) | 0 (0.0%) |
| 26 to 34 Years | 7 (77.8%) | 2 (22.2%) |
| 35 to 44 Years | 11 (100.0%) | 0 (0.0%) |
| 45 to 54 Years | 0 (0.0%) | 0 (0.0%) |
| 55 to 64 Years | 7 (100.0%) | 0 (0.0%) |
| 65 to 74 Years | 6 (100.0%) | 0 (0.0%) |
| 75 Years and older | 0 (0.0%) | 0 (0.0%) |
| Total | 74 (97.4%) | 2 (2.6%) |
Health Insurance Coverage by Citizenship Status in Naples
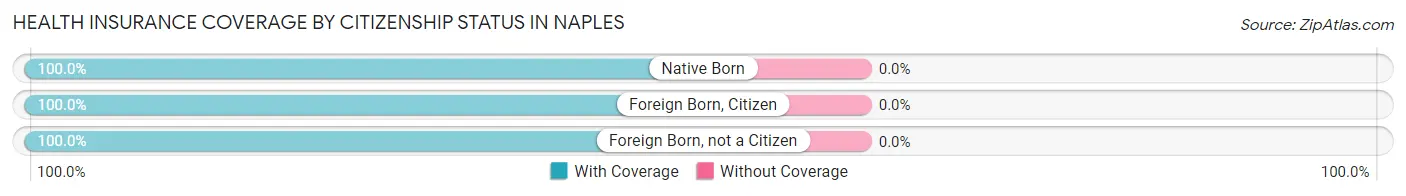
| Citizenship Status | With Coverage | Without Coverage |
| Native Born | 14 (100.0%) | 0 (0.0%) |
| Foreign Born, Citizen | 25 (100.0%) | 0 (0.0%) |
| Foreign Born, not a Citizen | 4 (100.0%) | 0 (0.0%) |
Health Insurance Coverage by Household Income in Naples
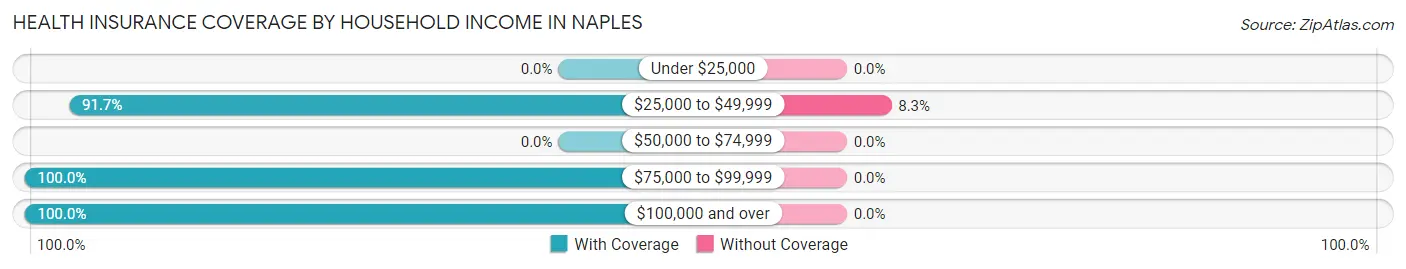
| Household Income | With Coverage | Without Coverage |
| Under $25,000 | 0 (0.0%) | 0 (0.0%) |
| $25,000 to $49,999 | 22 (91.7%) | 2 (8.3%) |
| $50,000 to $74,999 | 0 (0.0%) | 0 (0.0%) |
| $75,000 to $99,999 | 5 (100.0%) | 0 (0.0%) |
| $100,000 and over | 47 (100.0%) | 0 (0.0%) |
Public vs Private Health Insurance Coverage by Age in Naples
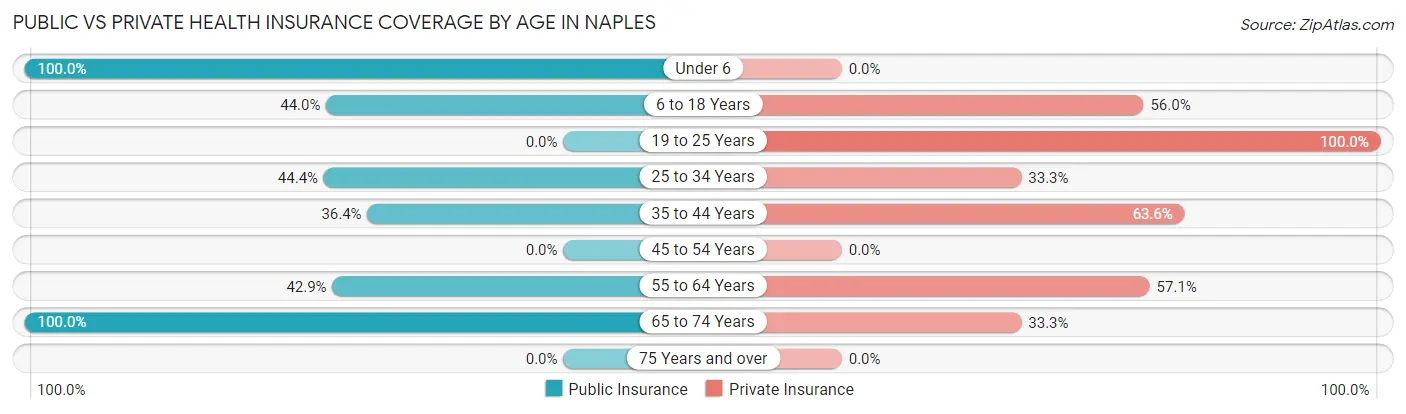
| Age Bracket | Public Insurance | Private Insurance |
| Under 6 | 14 (100.0%) | 0 (0.0%) |
| 6 to 18 Years | 11 (44.0%) | 14 (56.0%) |
| 19 to 25 Years | 0 (0.0%) | 4 (100.0%) |
| 25 to 34 Years | 4 (44.4%) | 3 (33.3%) |
| 35 to 44 Years | 4 (36.4%) | 7 (63.6%) |
| 45 to 54 Years | 0 (0.0%) | 0 (0.0%) |
| 55 to 64 Years | 3 (42.9%) | 4 (57.1%) |
| 65 to 74 Years | 6 (100.0%) | 2 (33.3%) |
| 75 Years and over | 0 (0.0%) | 0 (0.0%) |
| Total | 42 (55.3%) | 34 (44.7%) |
Disability Status by Sex by Age in Naples
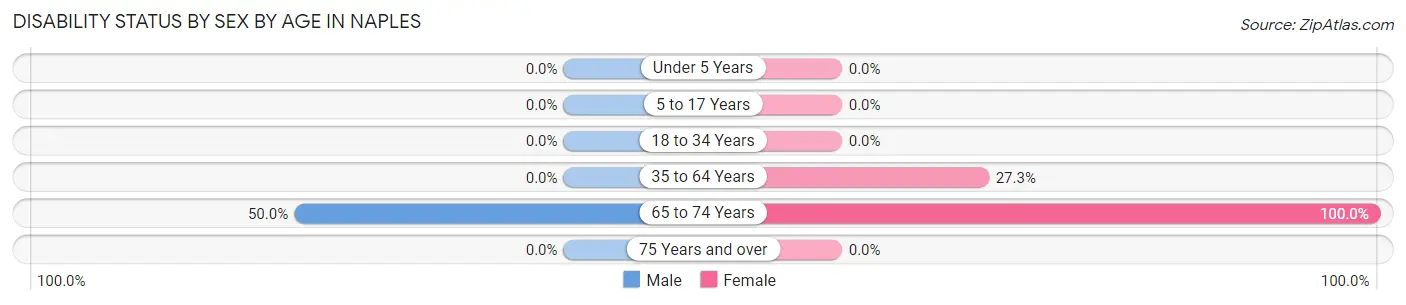
| Age Bracket | Male | Female |
| Under 5 Years | 0 (0.0%) | 0 (0.0%) |
| 5 to 17 Years | 0 (0.0%) | 0 (0.0%) |
| 18 to 34 Years | 0 (0.0%) | 0 (0.0%) |
| 35 to 64 Years | 0 (0.0%) | 3 (27.3%) |
| 65 to 74 Years | 2 (50.0%) | 2 (100.0%) |
| 75 Years and over | 0 (0.0%) | 0 (0.0%) |
Disability Class by Sex by Age in Naples
Disability Class: Hearing Difficulty
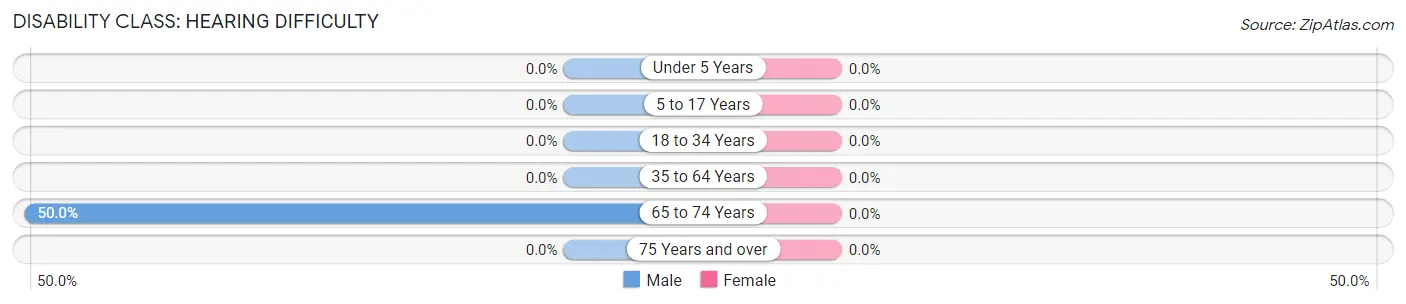
| Age Bracket | Male | Female |
| Under 5 Years | 0 (0.0%) | 0 (0.0%) |
| 5 to 17 Years | 0 (0.0%) | 0 (0.0%) |
| 18 to 34 Years | 0 (0.0%) | 0 (0.0%) |
| 35 to 64 Years | 0 (0.0%) | 0 (0.0%) |
| 65 to 74 Years | 2 (50.0%) | 0 (0.0%) |
| 75 Years and over | 0 (0.0%) | 0 (0.0%) |
Disability Class: Vision Difficulty
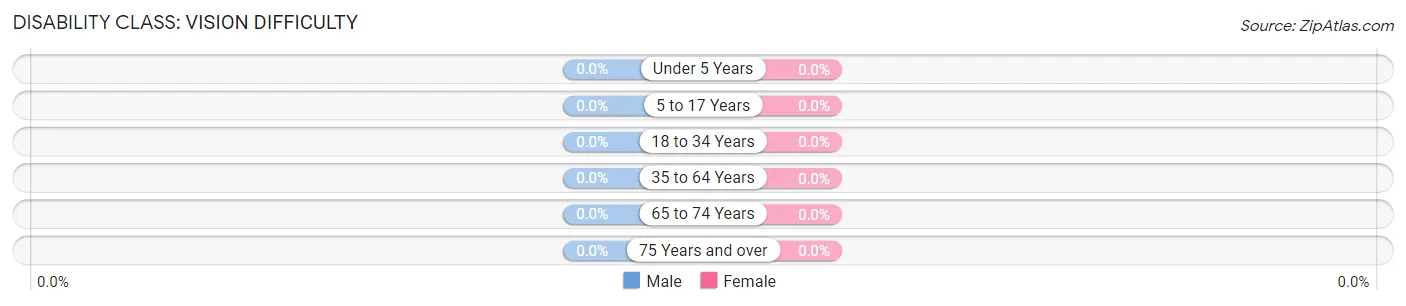
| Age Bracket | Male | Female |
| Under 5 Years | 0 (0.0%) | 0 (0.0%) |
| 5 to 17 Years | 0 (0.0%) | 0 (0.0%) |
| 18 to 34 Years | 0 (0.0%) | 0 (0.0%) |
| 35 to 64 Years | 0 (0.0%) | 0 (0.0%) |
| 65 to 74 Years | 0 (0.0%) | 0 (0.0%) |
| 75 Years and over | 0 (0.0%) | 0 (0.0%) |
Disability Class: Cognitive Difficulty
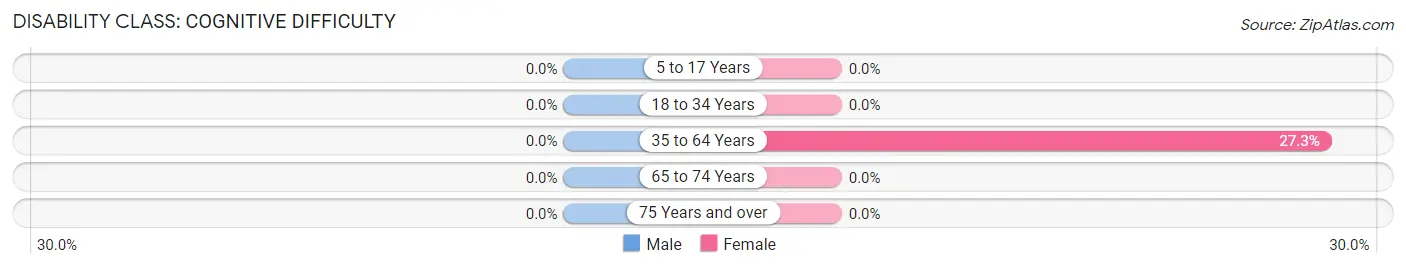
| Age Bracket | Male | Female |
| 5 to 17 Years | 0 (0.0%) | 0 (0.0%) |
| 18 to 34 Years | 0 (0.0%) | 0 (0.0%) |
| 35 to 64 Years | 0 (0.0%) | 3 (27.3%) |
| 65 to 74 Years | 0 (0.0%) | 0 (0.0%) |
| 75 Years and over | 0 (0.0%) | 0 (0.0%) |
Disability Class: Ambulatory Difficulty
| Age Bracket | Male | Female |
| 5 to 17 Years | 0 (0.0%) | 0 (0.0%) |
| 18 to 34 Years | 0 (0.0%) | 0 (0.0%) |
| 35 to 64 Years | 0 (0.0%) | 0 (0.0%) |
| 65 to 74 Years | 0 (0.0%) | 0 (0.0%) |
| 75 Years and over | 0 (0.0%) | 0 (0.0%) |
Disability Class: Self-Care Difficulty
| Age Bracket | Male | Female |
| 5 to 17 Years | 0 (0.0%) | 0 (0.0%) |
| 18 to 34 Years | 0 (0.0%) | 0 (0.0%) |
| 35 to 64 Years | 0 (0.0%) | 0 (0.0%) |
| 65 to 74 Years | 0 (0.0%) | 0 (0.0%) |
| 75 Years and over | 0 (0.0%) | 0 (0.0%) |
Technology Access in Naples
Computing Device Access in Naples
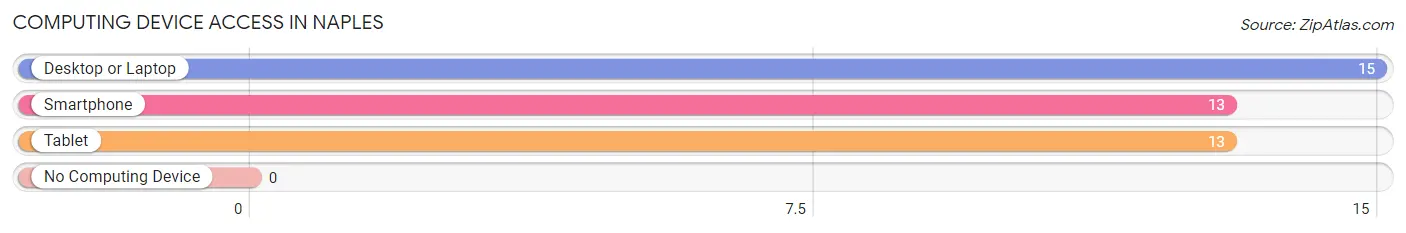
| Device Type | # Households | % Households |
| Desktop or Laptop | 15 | 100.0% |
| Smartphone | 13 | 86.7% |
| Tablet | 13 | 86.7% |
| No Computing Device | 0 | 0.0% |
| Total | 15 | 100.0% |
Internet Access in Naples
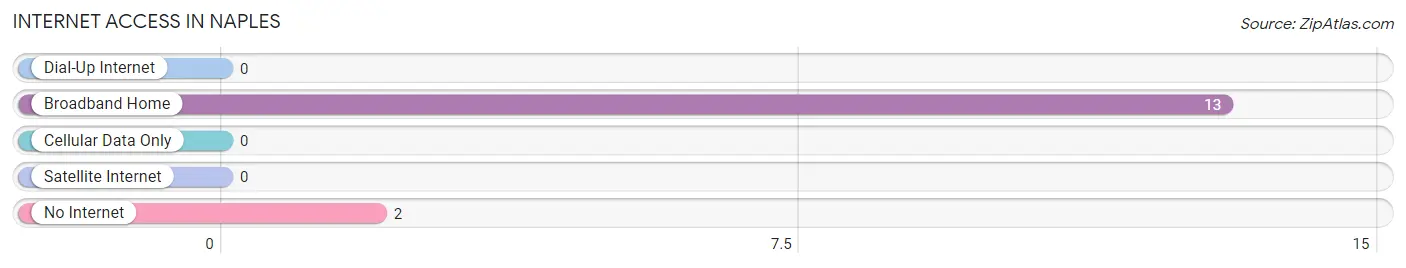
| Internet Type | # Households | % Households |
| Dial-Up Internet | 0 | 0.0% |
| Broadband Home | 13 | 86.7% |
| Cellular Data Only | 0 | 0.0% |
| Satellite Internet | 0 | 0.0% |
| No Internet | 2 | 13.3% |
| Total | 15 | 100.0% |
Naples Summary
Naples is a small town located in the southeastern corner of South Dakota, in the United States. It is situated in the extreme southeastern corner of the state, near the border with Iowa and Nebraska. The town is located in Union County, and is part of the Sioux Falls Metropolitan Statistical Area. As of the 2010 census, the population of Naples was 545.
History
The town of Naples was founded in 1883 by a group of settlers from the nearby town of Elk Point. The town was named after the Italian city of Naples, and was originally intended to be a farming community. The town was incorporated in 1887, and the first post office was established in 1888.
In the early 1900s, the town began to grow and develop, with the construction of a railroad line and the establishment of a bank. The town also became a popular tourist destination, with the opening of a hotel and a number of other businesses.
Geography
Naples is located at 43°2′17″N 96°25′17″W (43.038, -96.421). According to the United States Census Bureau, the town has a total area of 0.6 square miles (1.6 km2), all of it land.
Economy
The economy of Naples is largely based on agriculture. The town is home to a number of farms, and the surrounding area is known for its production of corn, soybeans, and other crops. The town also has a number of small businesses, including a grocery store, a hardware store, and a few restaurants.
Demographics
As of the 2010 census, there were 545 people, 213 households, and 145 families residing in the town. The population density was 890.0 people per square mile (344.3/km2). There were 233 housing units at an average density of 382.5 per square mile (147.6/km2). The racial makeup of the town was 97.3% White, 0.2% African American, 0.2% Native American, 0.2% Asian, 0.4% from other races, and 1.5% from two or more races. Hispanic or Latino of any race were 1.1% of the population.
There were 213 households, out of which 33.2% had children under the age of 18 living with them, 54.5% were married couples living together, 8.0% had a female householder with no husband present, and 33.2% were non-families. 28.5% of all households were made up of individuals, and 14.0% had someone living alone who was 65 years of age or older. The average household size was 2.56 and the average family size was 3.17.
In the town, the population was spread out, with 28.2% under the age of 18, 6.7% from 18 to 24, 25.2% from 25 to 44, 24.2% from 45 to 64, and 15.7% who were 65 years of age or older. The median age was 38 years. For every 100 females, there were 97.3 males. For every 100 females age 18 and over, there were 94.3 males.
The median income for a household in the town was $37,500, and the median income for a family was $45,000. Males had a median income of $30,000 versus $20,000 for females. The per capita income for the town was $17,845. About 5.3% of families and 8.2% of the population were below the poverty line, including 8.3% of those under age 18 and 8.3% of those age 65 or over.
Common Questions
What is Per Capita Income in Naples?
Per Capita income in Naples is $25,803.
What is the Median Family Income in Naples?
Median Family Income in Naples is $133,125.
What is the Median Household income in Naples?
Median Household Income in Naples is $134,375.
What is Inequality or Gini Index in Naples?
Inequality or Gini Index in Naples is 0.28.
What is the Total Population of Naples?
Total Population of Naples is 76.
What is the Total Male Population of Naples?
Total Male Population of Naples is 34.
What is the Total Female Population of Naples?
Total Female Population of Naples is 42.
What is the Ratio of Males per 100 Females in Naples?
There are 80.95 Males per 100 Females in Naples.
What is the Ratio of Females per 100 Males in Naples?
There are 123.53 Females per 100 Males in Naples.
What is the Median Population Age in Naples?
Median Population Age in Naples is 15.0 Years.
What is the Average Family Size in Naples
Average Family Size in Naples is 6.0 People.
What is the Average Household Size in Naples
Average Household Size in Naples is 5.1 People.
How Large is the Labor Force in Naples?
There are 26 People in the Labor Forcein in Naples.
What is the Percentage of People in the Labor Force in Naples?
68.4% of People are in the Labor Force in Naples.