Tabor, SD Map & Demographics
Tabor Map
Tabor Overview
$42,354
PER CAPITA INCOME
$82,500
AVG FAMILY INCOME
$76,250
AVG HOUSEHOLD INCOME
19.2%
WAGE / INCOME GAP [ % ]
80.8¢/ $1
WAGE / INCOME GAP [ $ ]
0.56
INEQUALITY / GINI INDEX
405
TOTAL POPULATION
171
MALE POPULATION
234
FEMALE POPULATION
73.08
MALES / 100 FEMALES
136.84
FEMALES / 100 MALES
44.9
MEDIAN AGE
2.5
AVG FAMILY SIZE
2.3
AVG HOUSEHOLD SIZE
213
LABOR FORCE [ PEOPLE ]
65.5%
PERCENT IN LABOR FORCE
Tabor Zip Codes
Tabor Area Codes
Income in Tabor
Income Overview in Tabor
Per Capita Income in Tabor is $42,354, while median incomes of families and households are $82,500 and $76,250 respectively.
| Characteristic | Number | Measure |
| Per Capita Income | 405 | $42,354 |
| Median Family Income | 134 | $82,500 |
| Mean Family Income | 134 | $146,792 |
| Median Household Income | 179 | $76,250 |
| Mean Household Income | 179 | $125,502 |
| Income Deficit | 134 | $0 |
| Wage / Income Gap (%) | 405 | 19.16% |
| Wage / Income Gap ($) | 405 | 80.84¢ per $1 |
| Gini / Inequality Index | 405 | 0.56 |
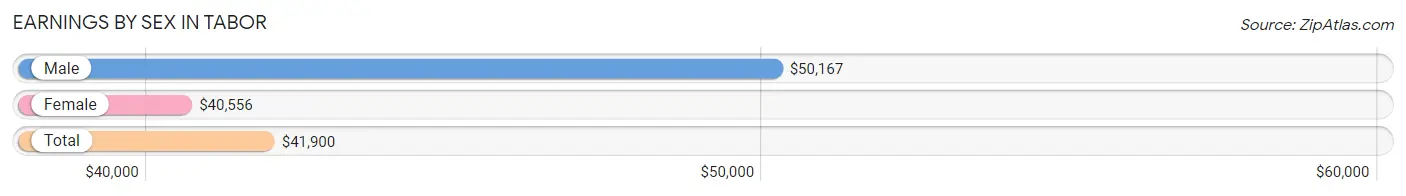
Earnings by Sex in Tabor
Average Earnings in Tabor are $41,900, $50,167 for men and $40,556 for women, a difference of 19.2%.
| Sex | Number | Average Earnings |
| Male | 106 (48.6%) | $50,167 |
| Female | 112 (51.4%) | $40,556 |
| Total | 218 (100.0%) | $41,900 |
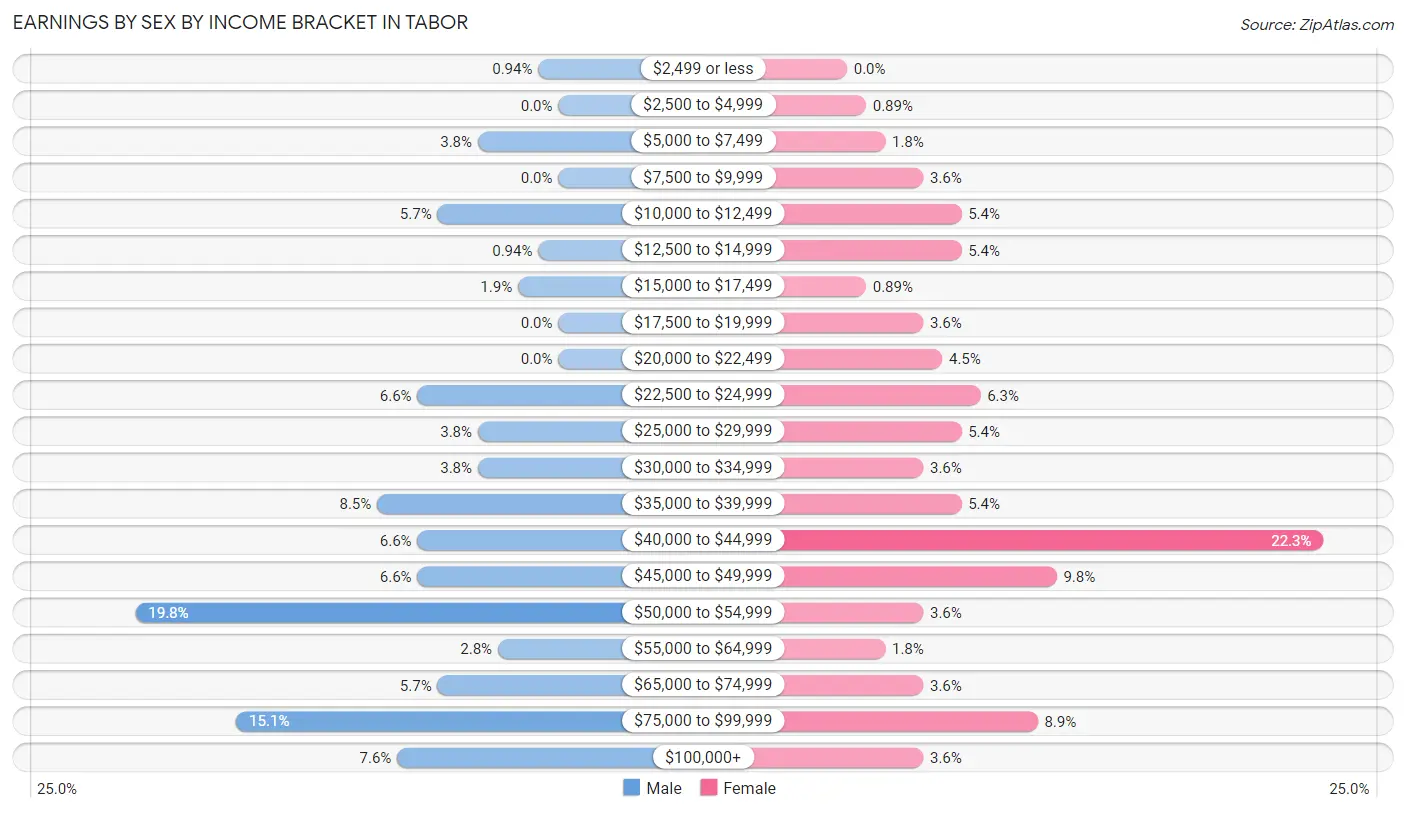
Earnings by Sex by Income Bracket in Tabor
The most common earnings brackets in Tabor are $50,000 to $54,999 for men (21 | 19.8%) and $40,000 to $44,999 for women (25 | 22.3%).
| Income | Male | Female |
| $2,499 or less | 1 (0.9%) | 0 (0.0%) |
| $2,500 to $4,999 | 0 (0.0%) | 1 (0.9%) |
| $5,000 to $7,499 | 4 (3.8%) | 2 (1.8%) |
| $7,500 to $9,999 | 0 (0.0%) | 4 (3.6%) |
| $10,000 to $12,499 | 6 (5.7%) | 6 (5.4%) |
| $12,500 to $14,999 | 1 (0.9%) | 6 (5.4%) |
| $15,000 to $17,499 | 2 (1.9%) | 1 (0.9%) |
| $17,500 to $19,999 | 0 (0.0%) | 4 (3.6%) |
| $20,000 to $22,499 | 0 (0.0%) | 5 (4.5%) |
| $22,500 to $24,999 | 7 (6.6%) | 7 (6.2%) |
| $25,000 to $29,999 | 4 (3.8%) | 6 (5.4%) |
| $30,000 to $34,999 | 4 (3.8%) | 4 (3.6%) |
| $35,000 to $39,999 | 9 (8.5%) | 6 (5.4%) |
| $40,000 to $44,999 | 7 (6.6%) | 25 (22.3%) |
| $45,000 to $49,999 | 7 (6.6%) | 11 (9.8%) |
| $50,000 to $54,999 | 21 (19.8%) | 4 (3.6%) |
| $55,000 to $64,999 | 3 (2.8%) | 2 (1.8%) |
| $65,000 to $74,999 | 6 (5.7%) | 4 (3.6%) |
| $75,000 to $99,999 | 16 (15.1%) | 10 (8.9%) |
| $100,000+ | 8 (7.5%) | 4 (3.6%) |
| Total | 106 (100.0%) | 112 (100.0%) |
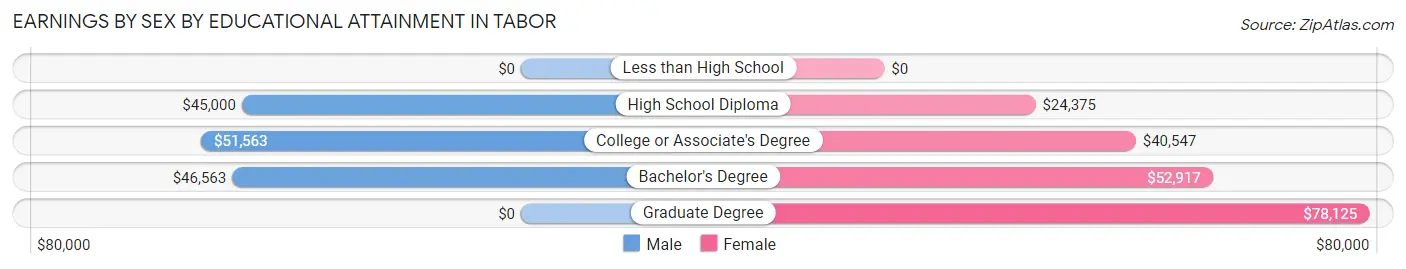
Earnings by Sex by Educational Attainment in Tabor
Average earnings in Tabor are $48,750 for men and $41,875 for women, a difference of 14.1%. Men with an educational attainment of college or associate's degree enjoy the highest average annual earnings of $51,563, while those with high school diploma education earn the least with $45,000. Women with an educational attainment of graduate degree earn the most with the average annual earnings of $78,125, while those with high school diploma education have the smallest earnings of $24,375.
| Educational Attainment | Male Income | Female Income |
| Less than High School | - | - |
| High School Diploma | $45,000 | $24,375 |
| College or Associate's Degree | $51,563 | $40,547 |
| Bachelor's Degree | $46,563 | $52,917 |
| Graduate Degree | - | - |
| Total | $48,750 | $41,875 |
Family Income in Tabor
Family Income Brackets in Tabor
According to the Tabor family income data, there are 34 families falling into the $100,000 to $149,999 income range, which is the most common income bracket and makes up 25.4% of all families.
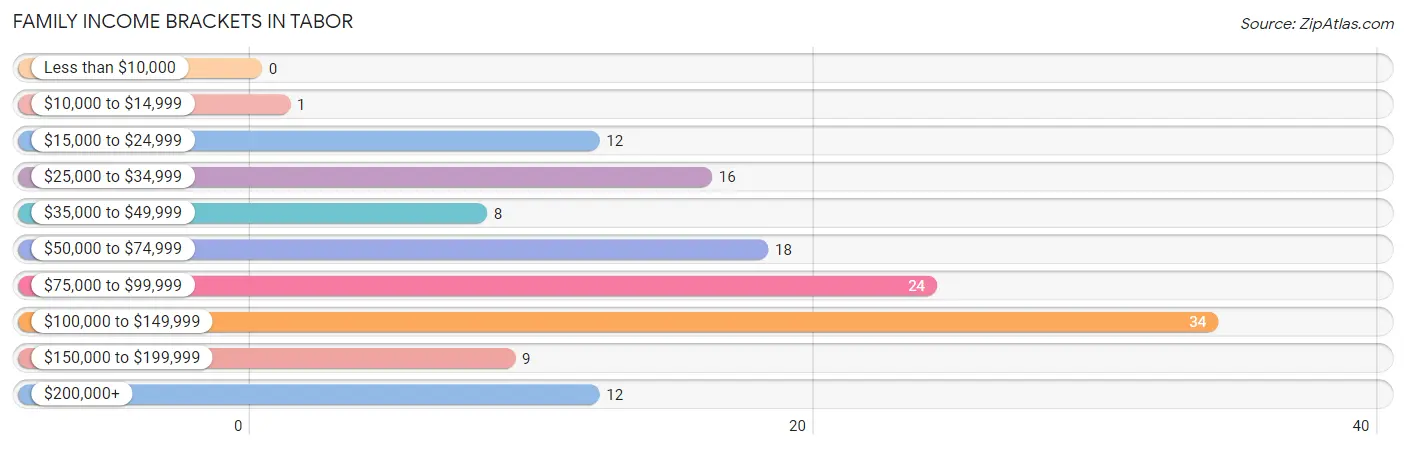
| Income Bracket | # Families | % Families |
| Less than $10,000 | 0 | 0.0% |
| $10,000 to $14,999 | 1 | 0.7% |
| $15,000 to $24,999 | 12 | 9.0% |
| $25,000 to $34,999 | 16 | 11.9% |
| $35,000 to $49,999 | 8 | 6.0% |
| $50,000 to $74,999 | 18 | 13.4% |
| $75,000 to $99,999 | 24 | 17.9% |
| $100,000 to $149,999 | 34 | 25.4% |
| $150,000 to $199,999 | 9 | 6.7% |
| $200,000+ | 12 | 9.0% |
Family Income by Famaliy Size in Tabor
3-person families (33 | 24.6%) account for the highest median family income in Tabor with $117,750 per family, while 3-person families (33 | 24.6%) have the highest median income of $39,250 per family member.
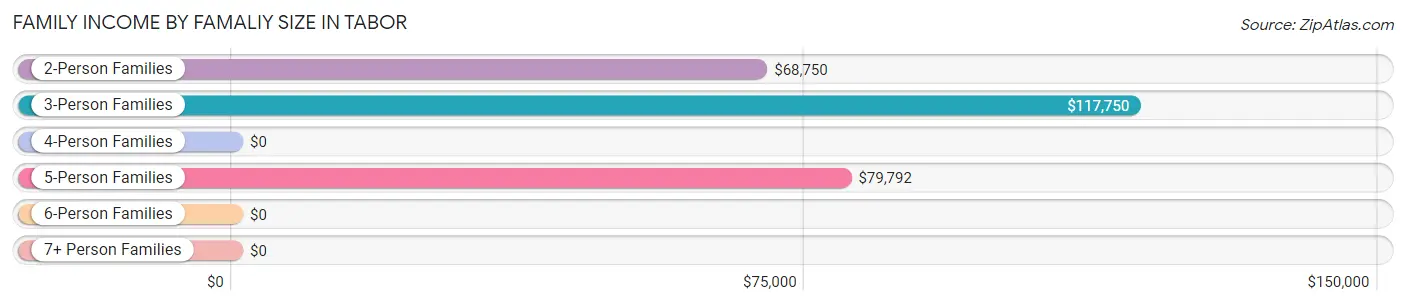
| Income Bracket | # Families | Median Income |
| 2-Person Families | 75 (56.0%) | $68,750 |
| 3-Person Families | 33 (24.6%) | $117,750 |
| 4-Person Families | 13 (9.7%) | $0 |
| 5-Person Families | 11 (8.2%) | $79,792 |
| 6-Person Families | 2 (1.5%) | $0 |
| 7+ Person Families | 0 (0.0%) | $0 |
| Total | 134 (100.0%) | $82,500 |
Family Income by Number of Earners in Tabor
The median family income in Tabor is $82,500, with families comprising 3+ earners (24) having the highest median family income of $213,750, while families with no earners (28) have the lowest median family income of $45,000, accounting for 17.9% and 20.9% of families, respectively.
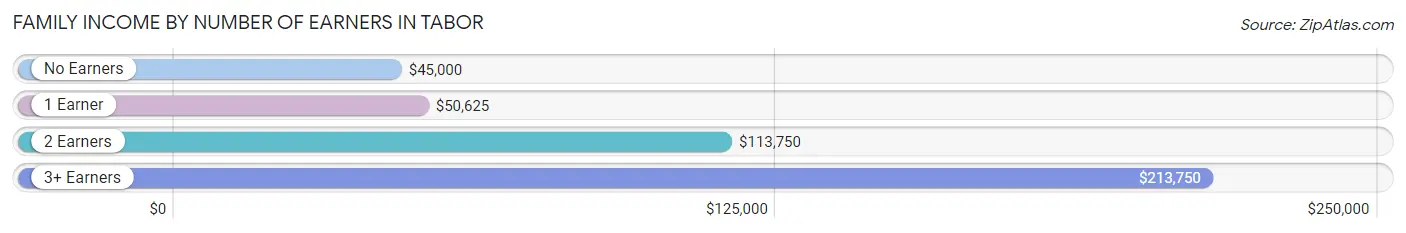
| Number of Earners | # Families | Median Income |
| No Earners | 28 (20.9%) | $45,000 |
| 1 Earner | 46 (34.3%) | $50,625 |
| 2 Earners | 36 (26.9%) | $113,750 |
| 3+ Earners | 24 (17.9%) | $213,750 |
| Total | 134 (100.0%) | $82,500 |
Household Income in Tabor
Household Income Brackets in Tabor
With 32 households falling in the category, the $75,000 to $99,999 income range is the most frequent in Tabor, accounting for 17.9% of all households. In contrast, only 1 households (0.6%) fall into the less than $10,000 income bracket, making it the least populous group.
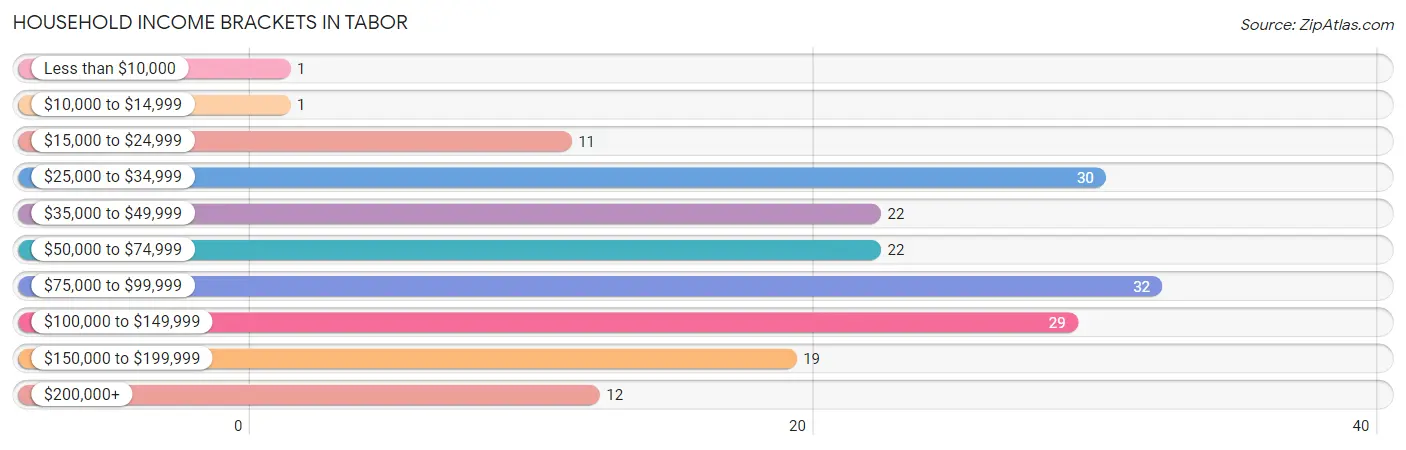
| Income Bracket | # Households | % Households |
| Less than $10,000 | 1 | 0.6% |
| $10,000 to $14,999 | 1 | 0.6% |
| $15,000 to $24,999 | 11 | 6.1% |
| $25,000 to $34,999 | 30 | 16.8% |
| $35,000 to $49,999 | 22 | 12.3% |
| $50,000 to $74,999 | 22 | 12.3% |
| $75,000 to $99,999 | 32 | 17.9% |
| $100,000 to $149,999 | 29 | 16.2% |
| $150,000 to $199,999 | 19 | 10.6% |
| $200,000+ | 12 | 6.7% |
Household Income by Householder Age in Tabor
The median household income in Tabor is $76,250, with the highest median household income of $120,714 found in the 45 to 64 years age bracket for the primary householder. A total of 50 households (27.9%) fall into this category. Meanwhile, the 15 to 24 years age bracket for the primary householder has the lowest median household income of $0, with 15 households (8.4%) in this group.
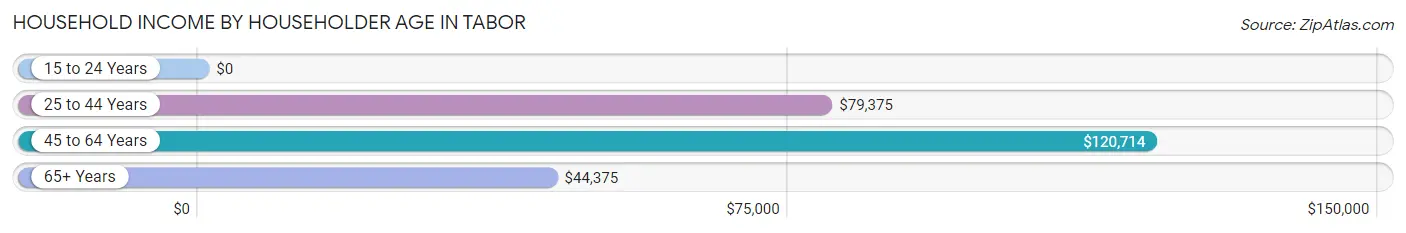
| Income Bracket | # Households | Median Income |
| 15 to 24 Years | 15 (8.4%) | $0 |
| 25 to 44 Years | 47 (26.3%) | $79,375 |
| 45 to 64 Years | 50 (27.9%) | $120,714 |
| 65+ Years | 67 (37.4%) | $44,375 |
| Total | 179 (100.0%) | $76,250 |
Poverty in Tabor
Income Below Poverty by Sex and Age in Tabor
With 3.5% poverty level for males and 4.3% for females among the residents of Tabor, 18 to 24 year old males and 18 to 24 year old females are the most vulnerable to poverty, with 2 males (15.4%) and 3 females (15.8%) in their respective age groups living below the poverty level.
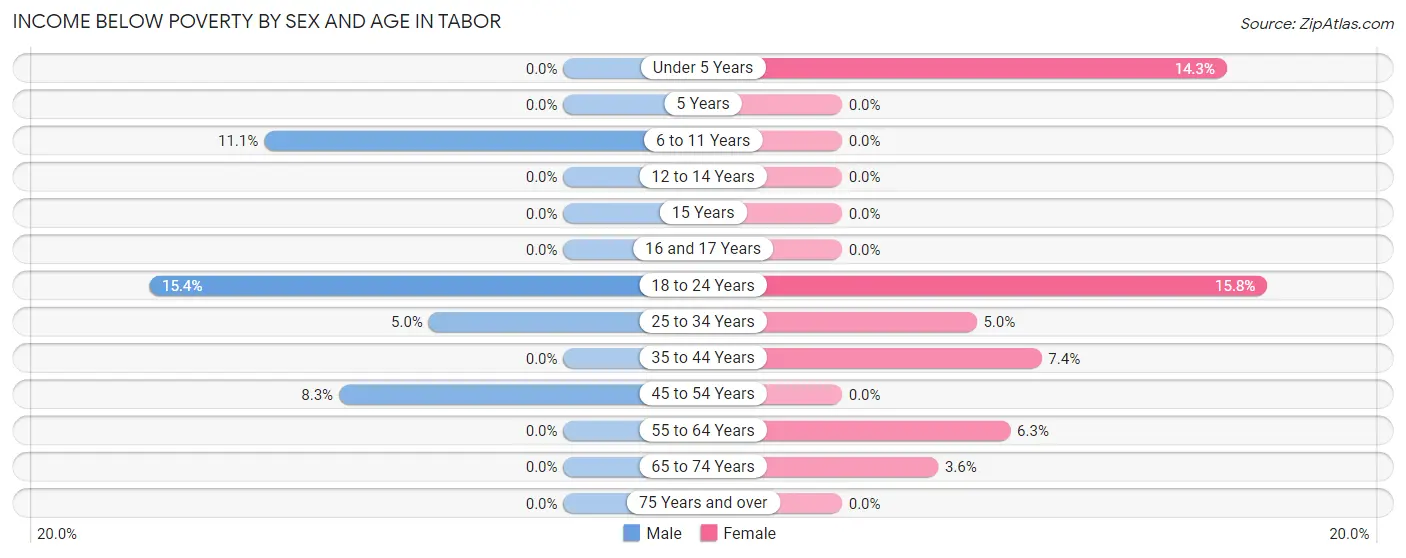
| Age Bracket | Male | Female |
| Under 5 Years | 0 (0.0%) | 2 (14.3%) |
| 5 Years | 0 (0.0%) | 0 (0.0%) |
| 6 to 11 Years | 1 (11.1%) | 0 (0.0%) |
| 12 to 14 Years | 0 (0.0%) | 0 (0.0%) |
| 15 Years | 0 (0.0%) | 0 (0.0%) |
| 16 and 17 Years | 0 (0.0%) | 0 (0.0%) |
| 18 to 24 Years | 2 (15.4%) | 3 (15.8%) |
| 25 to 34 Years | 1 (5.0%) | 1 (5.0%) |
| 35 to 44 Years | 0 (0.0%) | 2 (7.4%) |
| 45 to 54 Years | 2 (8.3%) | 0 (0.0%) |
| 55 to 64 Years | 0 (0.0%) | 1 (6.2%) |
| 65 to 74 Years | 0 (0.0%) | 1 (3.6%) |
| 75 Years and over | 0 (0.0%) | 0 (0.0%) |
| Total | 6 (3.5%) | 10 (4.3%) |
Income Above Poverty by Sex and Age in Tabor
According to the poverty statistics in Tabor, males aged under 5 years and females aged 5 years are the age groups that are most secure financially, with 100.0% of males and 100.0% of females in these age groups living above the poverty line.
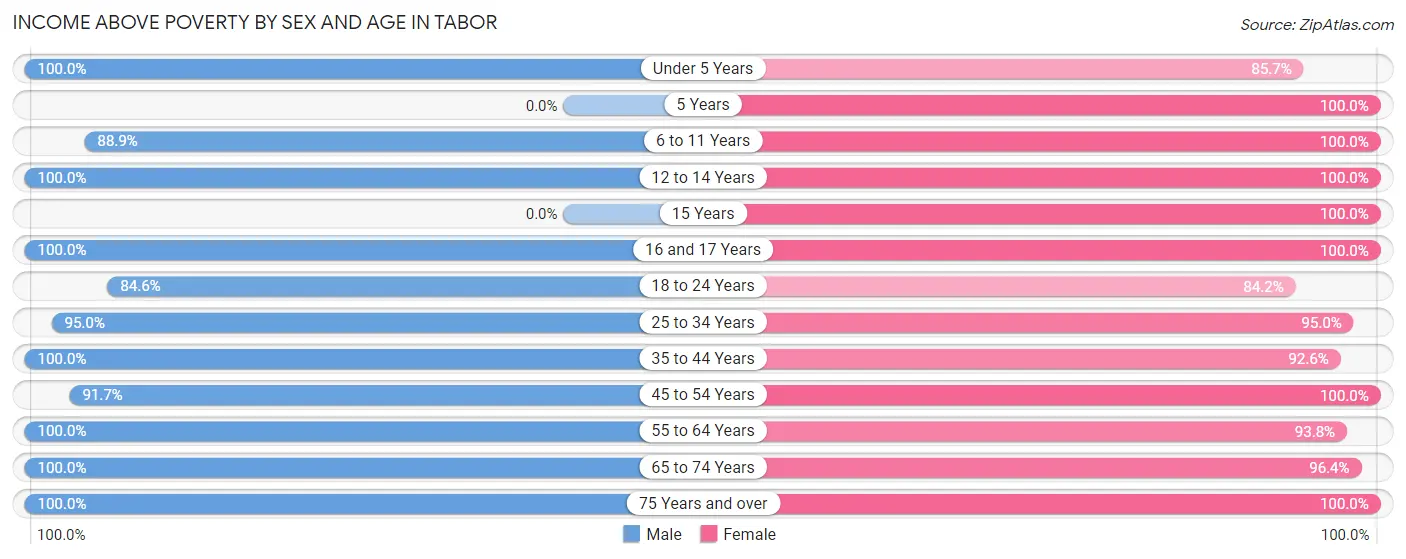
| Age Bracket | Male | Female |
| Under 5 Years | 10 (100.0%) | 12 (85.7%) |
| 5 Years | 0 (0.0%) | 12 (100.0%) |
| 6 to 11 Years | 8 (88.9%) | 12 (100.0%) |
| 12 to 14 Years | 5 (100.0%) | 10 (100.0%) |
| 15 Years | 0 (0.0%) | 5 (100.0%) |
| 16 and 17 Years | 4 (100.0%) | 2 (100.0%) |
| 18 to 24 Years | 11 (84.6%) | 16 (84.2%) |
| 25 to 34 Years | 19 (95.0%) | 19 (95.0%) |
| 35 to 44 Years | 18 (100.0%) | 25 (92.6%) |
| 45 to 54 Years | 22 (91.7%) | 37 (100.0%) |
| 55 to 64 Years | 18 (100.0%) | 15 (93.8%) |
| 65 to 74 Years | 21 (100.0%) | 27 (96.4%) |
| 75 Years and over | 28 (100.0%) | 30 (100.0%) |
| Total | 164 (96.5%) | 222 (95.7%) |
Income Below Poverty Among Married-Couple Families in Tabor
The poverty statistics for married-couple families in Tabor show that 1.8% or 2 of the total 111 families live below the poverty line. Families with 1 or 2 children have the highest poverty rate of 8.7%, comprising of 2 families. On the other hand, families with no children have the lowest poverty rate of 0.0%, which includes 0 families.
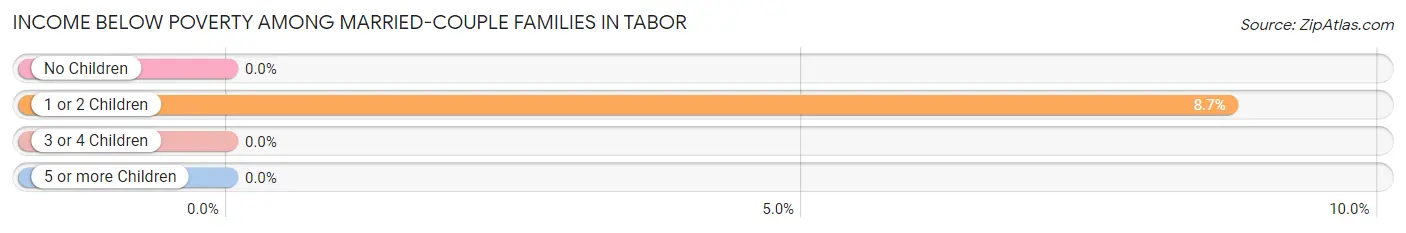
| Children | Above Poverty | Below Poverty |
| No Children | 79 (100.0%) | 0 (0.0%) |
| 1 or 2 Children | 21 (91.3%) | 2 (8.7%) |
| 3 or 4 Children | 9 (100.0%) | 0 (0.0%) |
| 5 or more Children | 0 (0.0%) | 0 (0.0%) |
| Total | 109 (98.2%) | 2 (1.8%) |
Income Below Poverty Among Single-Parent Households in Tabor
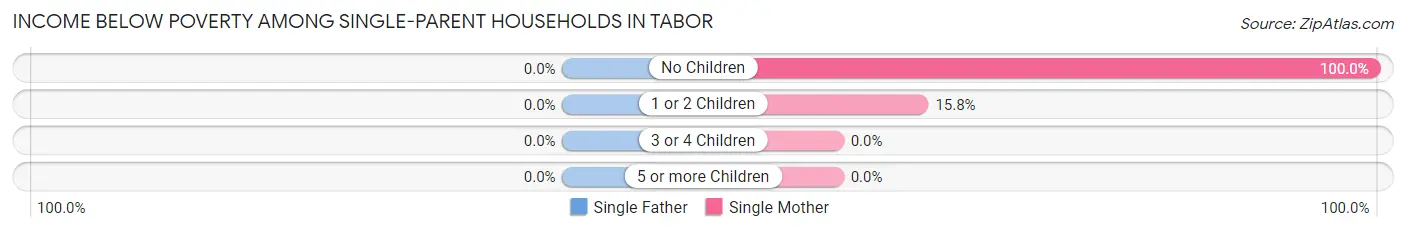
| Children | Single Father | Single Mother |
| No Children | 0 (0.0%) | 1 (100.0%) |
| 1 or 2 Children | 0 (0.0%) | 3 (15.8%) |
| 3 or 4 Children | 0 (0.0%) | 0 (0.0%) |
| 5 or more Children | 0 (0.0%) | 0 (0.0%) |
| Total | 0 (0.0%) | 4 (20.0%) |
Income Below Poverty Among Married-Couple vs Single-Parent Households in Tabor
The poverty data for Tabor shows that 2 of the married-couple family households (1.8%) and 4 of the single-parent households (17.4%) are living below the poverty level. Within the married-couple family households, those with 1 or 2 children have the highest poverty rate, with 2 households (8.7%) falling below the poverty line. Among the single-parent households, those with no children have the highest poverty rate, with 1 household (100.0%) living below poverty.
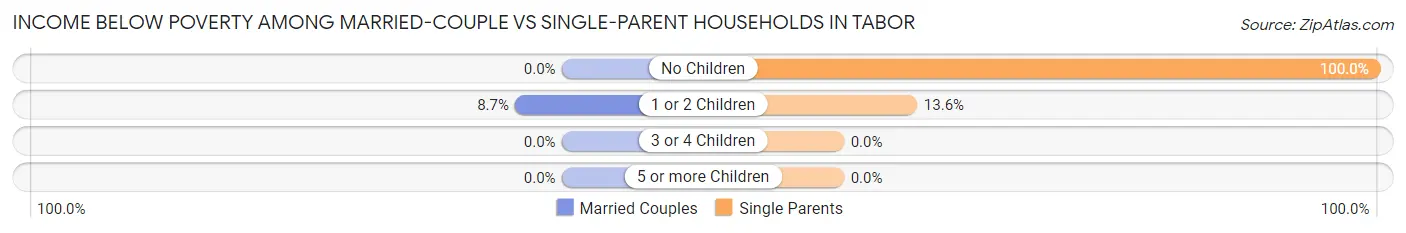
| Children | Married-Couple Families | Single-Parent Households |
| No Children | 0 (0.0%) | 1 (100.0%) |
| 1 or 2 Children | 2 (8.7%) | 3 (13.6%) |
| 3 or 4 Children | 0 (0.0%) | 0 (0.0%) |
| 5 or more Children | 0 (0.0%) | 0 (0.0%) |
| Total | 2 (1.8%) | 4 (17.4%) |
Race in Tabor
The most populous races in Tabor are White / Caucasian (391 | 96.5%), Hispanic or Latino (12 | 3.0%), and Two or more Races (9 | 2.2%).
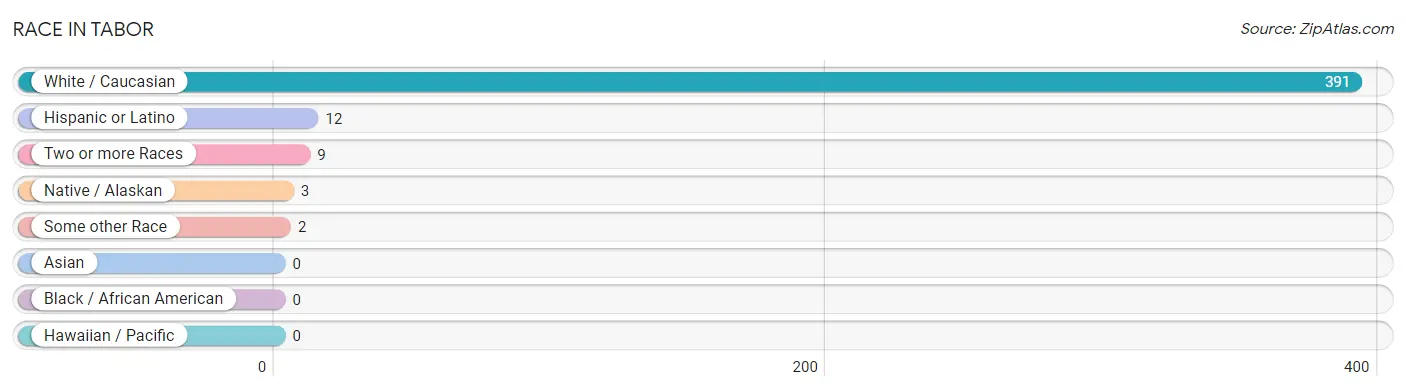
| Race | # Population | % Population |
| Asian | 0 | 0.0% |
| Black / African American | 0 | 0.0% |
| Hawaiian / Pacific | 0 | 0.0% |
| Hispanic or Latino | 12 | 3.0% |
| Native / Alaskan | 3 | 0.7% |
| White / Caucasian | 391 | 96.5% |
| Two or more Races | 9 | 2.2% |
| Some other Race | 2 | 0.5% |
| Total | 405 | 100.0% |
Ancestry in Tabor
The most populous ancestries reported in Tabor are German (126 | 31.1%), Czech (100 | 24.7%), Irish (43 | 10.6%), English (36 | 8.9%), and Dutch (18 | 4.4%), together accounting for 79.7% of all Tabor residents.
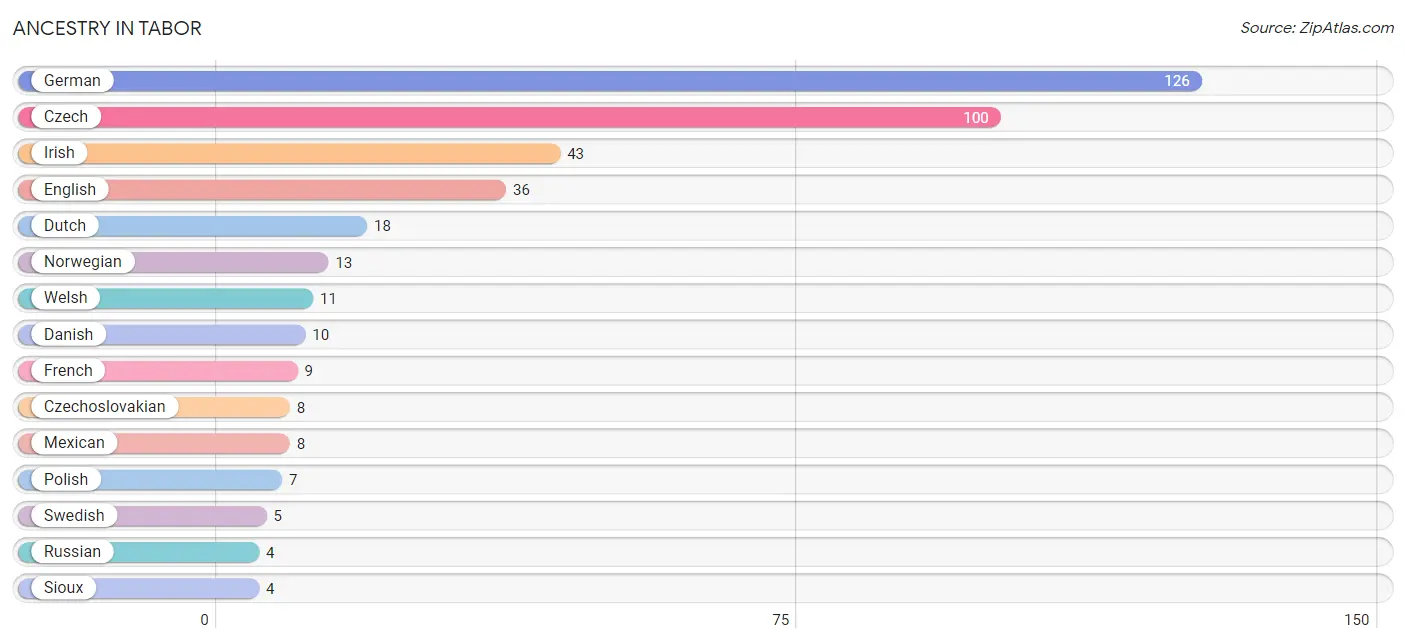
| Ancestry | # Population | % Population |
| American | 2 | 0.5% |
| Austrian | 2 | 0.5% |
| Canadian | 3 | 0.7% |
| Cuban | 3 | 0.7% |
| Czech | 100 | 24.7% |
| Czechoslovakian | 8 | 2.0% |
| Danish | 10 | 2.5% |
| Dutch | 18 | 4.4% |
| English | 36 | 8.9% |
| European | 1 | 0.3% |
| Finnish | 2 | 0.5% |
| French | 9 | 2.2% |
| French American Indian | 1 | 0.3% |
| German | 126 | 31.1% |
| Irish | 43 | 10.6% |
| Mexican | 8 | 2.0% |
| Norwegian | 13 | 3.2% |
| Polish | 7 | 1.7% |
| Puerto Rican | 1 | 0.3% |
| Russian | 4 | 1.0% |
| Scotch-Irish | 1 | 0.3% |
| Sioux | 4 | 1.0% |
| Swedish | 5 | 1.2% |
| Welsh | 11 | 2.7% | View All 24 Rows |
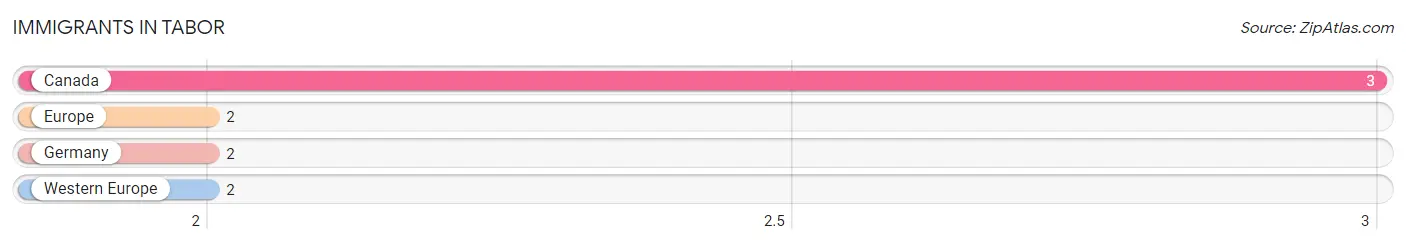
Immigrants in Tabor
The most numerous immigrant groups reported in Tabor came from Canada (3 | 0.7%), Europe (2 | 0.5%), Germany (2 | 0.5%), and Western Europe (2 | 0.5%), together accounting for 2.2% of all Tabor residents.
| Immigration Origin | # Population | % Population |
| Canada | 3 | 0.7% |
| Europe | 2 | 0.5% |
| Germany | 2 | 0.5% |
| Western Europe | 2 | 0.5% | View All 4 Rows |
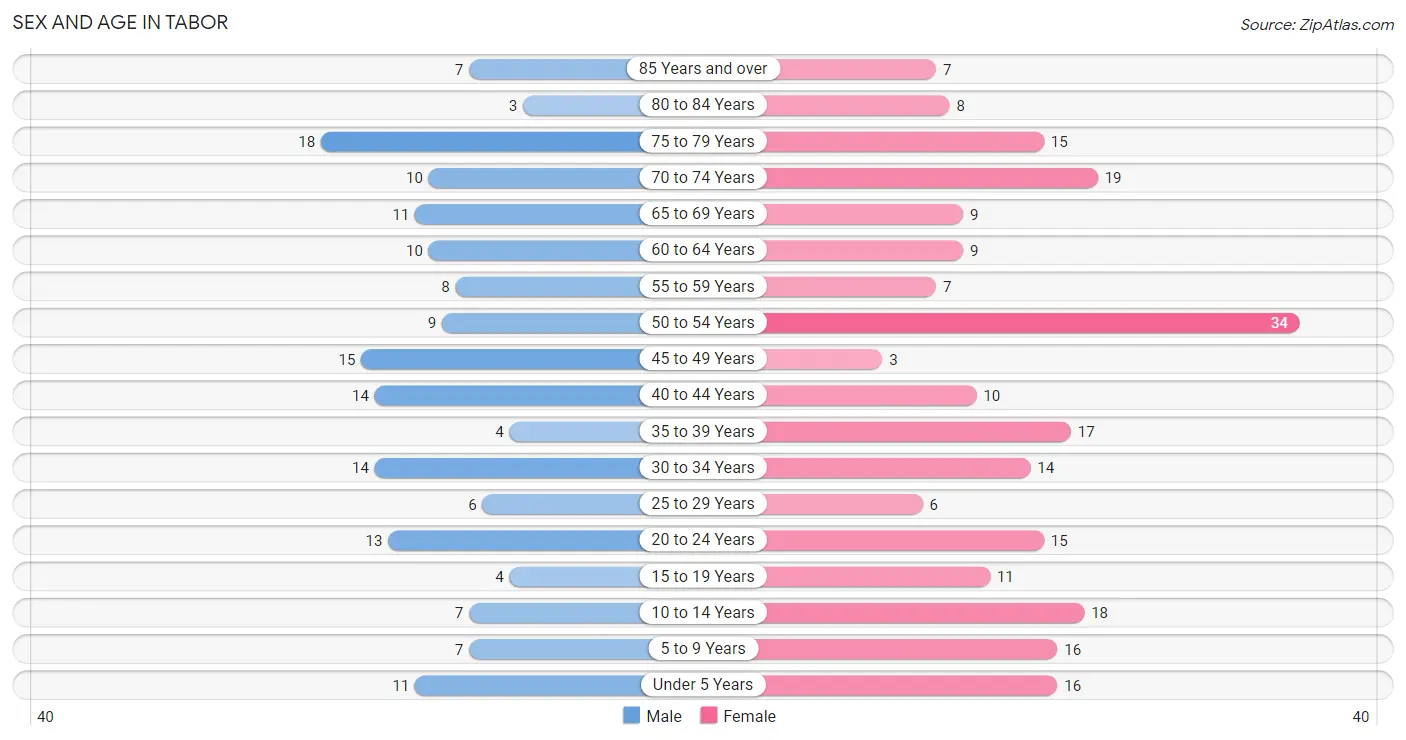
Sex and Age in Tabor
Sex and Age in Tabor
The most populous age groups in Tabor are 75 to 79 Years (18 | 10.5%) for men and 50 to 54 Years (34 | 14.5%) for women.
| Age Bracket | Male | Female |
| Under 5 Years | 11 (6.4%) | 16 (6.8%) |
| 5 to 9 Years | 7 (4.1%) | 16 (6.8%) |
| 10 to 14 Years | 7 (4.1%) | 18 (7.7%) |
| 15 to 19 Years | 4 (2.3%) | 11 (4.7%) |
| 20 to 24 Years | 13 (7.6%) | 15 (6.4%) |
| 25 to 29 Years | 6 (3.5%) | 6 (2.6%) |
| 30 to 34 Years | 14 (8.2%) | 14 (6.0%) |
| 35 to 39 Years | 4 (2.3%) | 17 (7.3%) |
| 40 to 44 Years | 14 (8.2%) | 10 (4.3%) |
| 45 to 49 Years | 15 (8.8%) | 3 (1.3%) |
| 50 to 54 Years | 9 (5.3%) | 34 (14.5%) |
| 55 to 59 Years | 8 (4.7%) | 7 (3.0%) |
| 60 to 64 Years | 10 (5.9%) | 9 (3.8%) |
| 65 to 69 Years | 11 (6.4%) | 9 (3.8%) |
| 70 to 74 Years | 10 (5.9%) | 19 (8.1%) |
| 75 to 79 Years | 18 (10.5%) | 15 (6.4%) |
| 80 to 84 Years | 3 (1.8%) | 8 (3.4%) |
| 85 Years and over | 7 (4.1%) | 7 (3.0%) |
| Total | 171 (100.0%) | 234 (100.0%) |
Families and Households in Tabor
Median Family Size in Tabor
The median family size in Tabor is 2.53 persons per family, with married-couple families (111 | 82.8%) accounting for the largest median family size of 2.62 persons per family. On the other hand, single male/father families (3 | 2.2%) represent the smallest median family size with 1.67 persons per family.
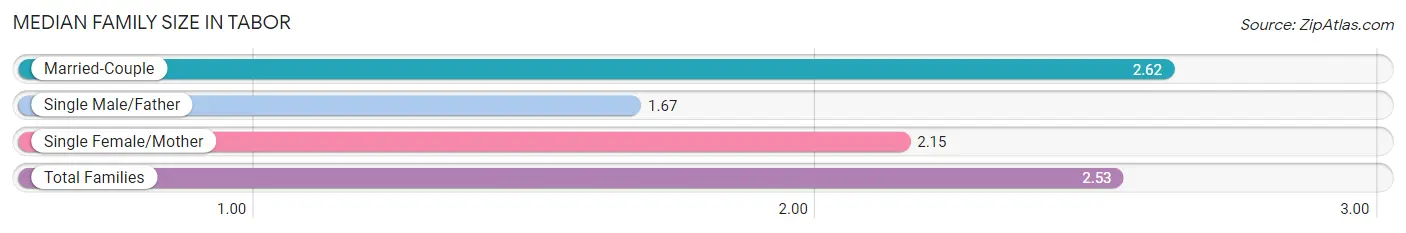
| Family Type | # Families | Family Size |
| Married-Couple | 111 (82.8%) | 2.62 |
| Single Male/Father | 3 (2.2%) | 1.67 |
| Single Female/Mother | 20 (14.9%) | 2.15 |
| Total Families | 134 (100.0%) | 2.53 |
Median Household Size in Tabor
The median household size in Tabor is 2.26 persons per household, with single female/mother households (20 | 11.2%) accounting for the largest median household size of 2.9 persons per household. non-family households (45 | 25.1%) represent the smallest median household size with 1.02 persons per household.
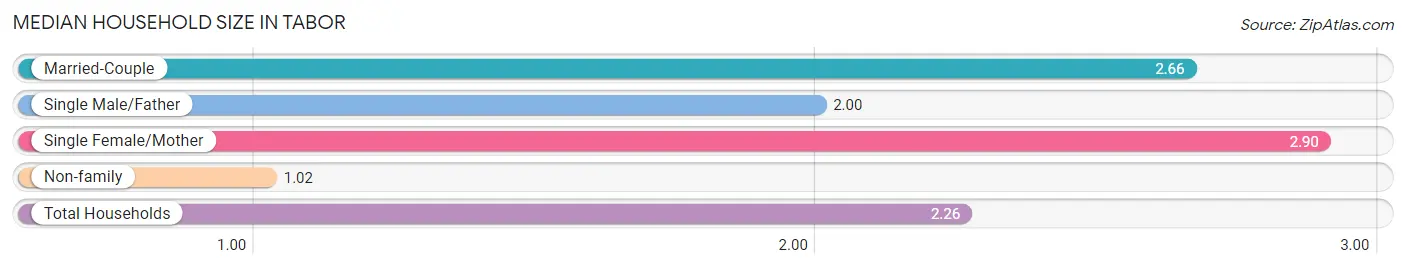
| Household Type | # Households | Household Size |
| Married-Couple | 111 (62.0%) | 2.66 |
| Single Male/Father | 3 (1.7%) | 2.00 |
| Single Female/Mother | 20 (11.2%) | 2.90 |
| Non-family | 45 (25.1%) | 1.02 |
| Total Households | 179 (100.0%) | 2.26 |
Household Size by Marriage Status in Tabor
Out of a total of 179 households in Tabor, 134 (74.9%) are family households, while 45 (25.1%) are nonfamily households. The most numerous type of family households are 2-person households, comprising 64, and the most common type of nonfamily households are 1-person households, comprising 41.
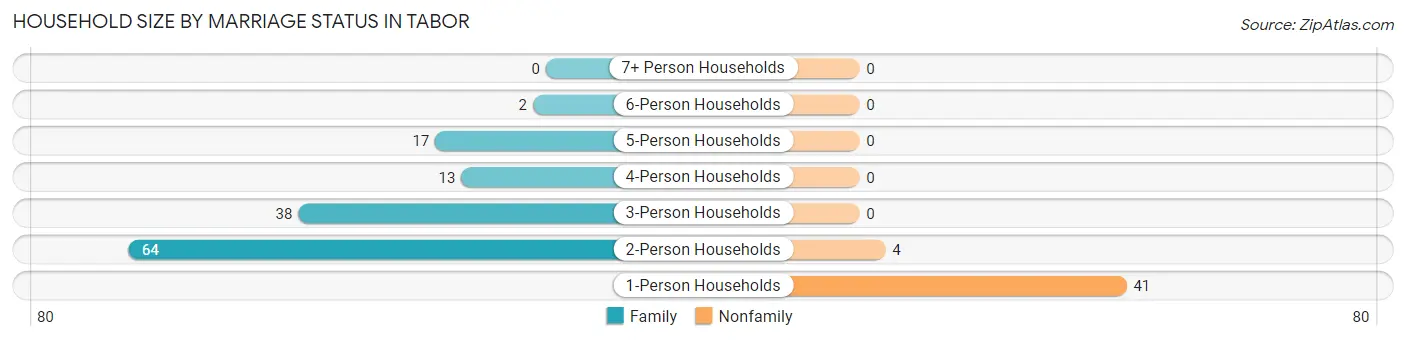
| Household Size | Family Households | Nonfamily Households |
| 1-Person Households | - | 41 (22.9%) |
| 2-Person Households | 64 (35.7%) | 4 (2.2%) |
| 3-Person Households | 38 (21.2%) | 0 (0.0%) |
| 4-Person Households | 13 (7.3%) | 0 (0.0%) |
| 5-Person Households | 17 (9.5%) | 0 (0.0%) |
| 6-Person Households | 2 (1.1%) | 0 (0.0%) |
| 7+ Person Households | 0 (0.0%) | 0 (0.0%) |
| Total | 134 (74.9%) | 45 (25.1%) |
Female Fertility in Tabor
Fertility by Age in Tabor
Average fertility rate in Tabor is 37.0 births per 1,000 women. Women in the age bracket of 20 to 34 years have the highest fertility rate with 57.0 births per 1,000 women. Women in the age bracket of 20 to 34 years acount for 66.7% of all women with births.
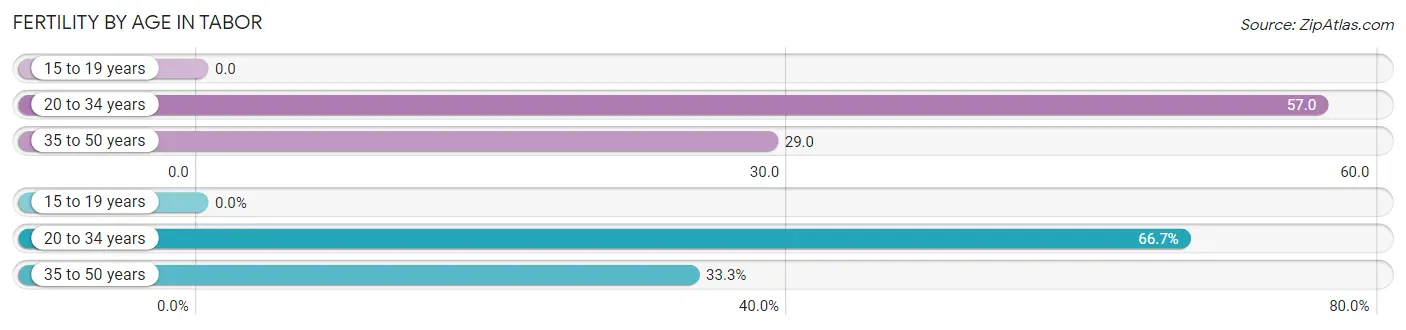
| Age Bracket | Women with Births | Births / 1,000 Women |
| 15 to 19 years | 0 (0.0%) | 0.0 |
| 20 to 34 years | 2 (66.7%) | 57.0 |
| 35 to 50 years | 1 (33.3%) | 29.0 |
| Total | 3 (100.0%) | 37.0 |
Fertility by Age by Marriage Status in Tabor
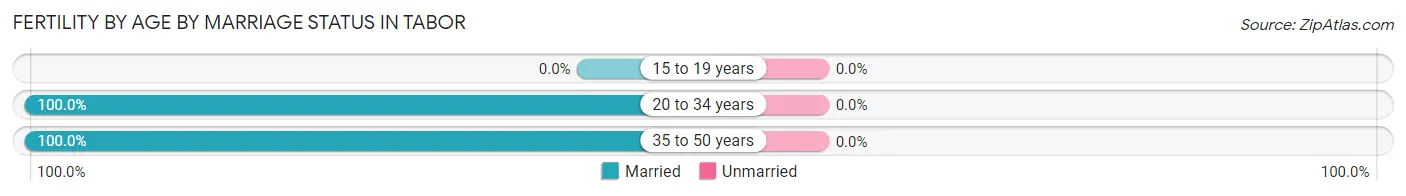
| Age Bracket | Married | Unmarried |
| 15 to 19 years | 0 (0.0%) | 0 (0.0%) |
| 20 to 34 years | 2 (100.0%) | 0 (0.0%) |
| 35 to 50 years | 1 (100.0%) | 0 (0.0%) |
| Total | 3 (100.0%) | 0 (0.0%) |
Fertility by Education in Tabor
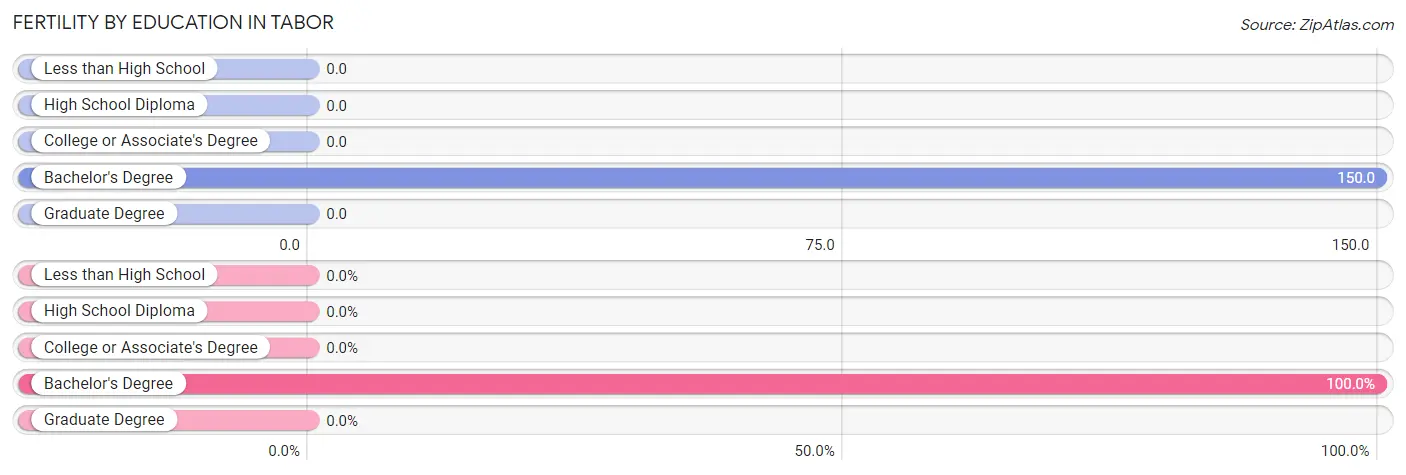
| Educational Attainment | Women with Births | Births / 1,000 Women |
| Less than High School | 0 (0.0%) | 0.0 |
| High School Diploma | 0 (0.0%) | 0.0 |
| College or Associate's Degree | 0 (0.0%) | 0.0 |
| Bachelor's Degree | 3 (100.0%) | 150.0 |
| Graduate Degree | 0 (0.0%) | 0.0 |
| Total | 3 (100.0%) | 37.0 |
Fertility by Education by Marriage Status in Tabor
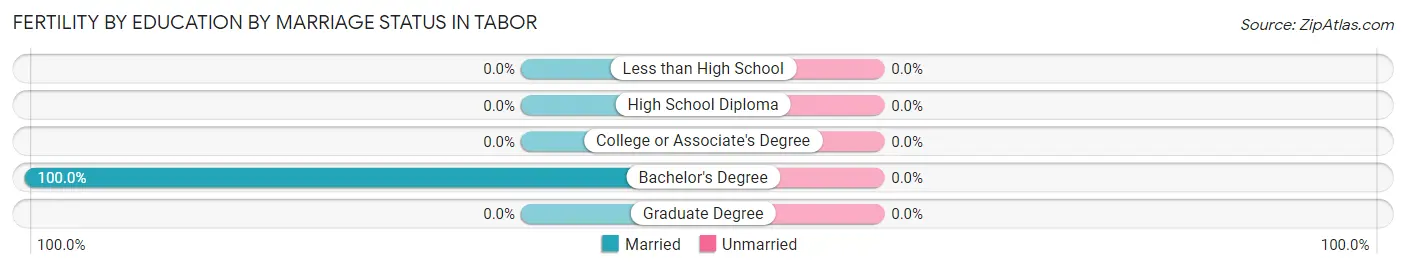
| Educational Attainment | Married | Unmarried |
| Less than High School | 0 (0.0%) | 0 (0.0%) |
| High School Diploma | 0 (0.0%) | 0 (0.0%) |
| College or Associate's Degree | 0 (0.0%) | 0 (0.0%) |
| Bachelor's Degree | 3 (100.0%) | 0 (0.0%) |
| Graduate Degree | 0 (0.0%) | 0 (0.0%) |
| Total | 3 (100.0%) | 0 (0.0%) |
Employment Characteristics in Tabor
Employment by Class of Employer in Tabor
Among the 208 employed individuals in Tabor, private company employees (129 | 62.0%), not-for-profit organizations (33 | 15.9%), and state government employees (19 | 9.1%) make up the most common classes of employment.
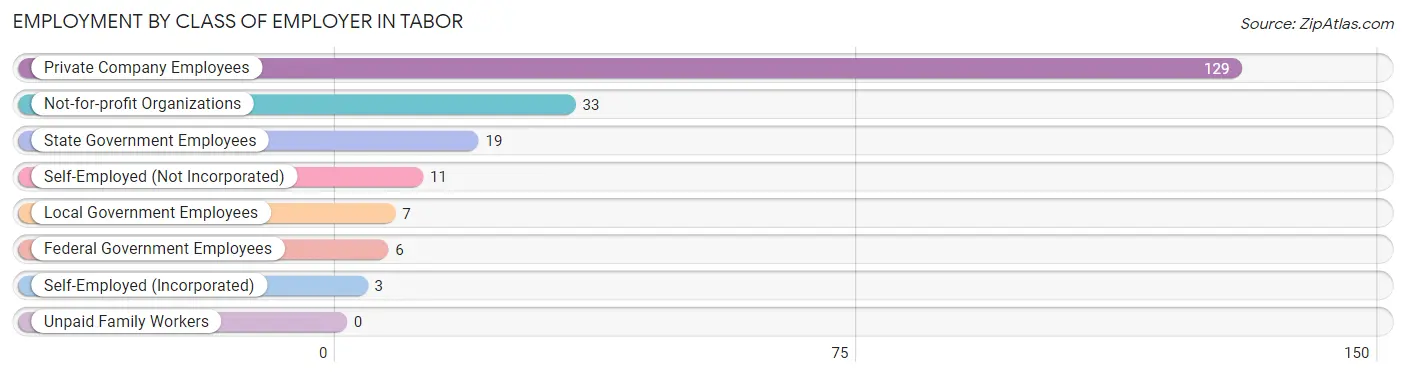
| Employer Class | # Employees | % Employees |
| Private Company Employees | 129 | 62.0% |
| Self-Employed (Incorporated) | 3 | 1.4% |
| Self-Employed (Not Incorporated) | 11 | 5.3% |
| Not-for-profit Organizations | 33 | 15.9% |
| Local Government Employees | 7 | 3.4% |
| State Government Employees | 19 | 9.1% |
| Federal Government Employees | 6 | 2.9% |
| Unpaid Family Workers | 0 | 0.0% |
| Total | 208 | 100.0% |
Employment Status by Age in Tabor
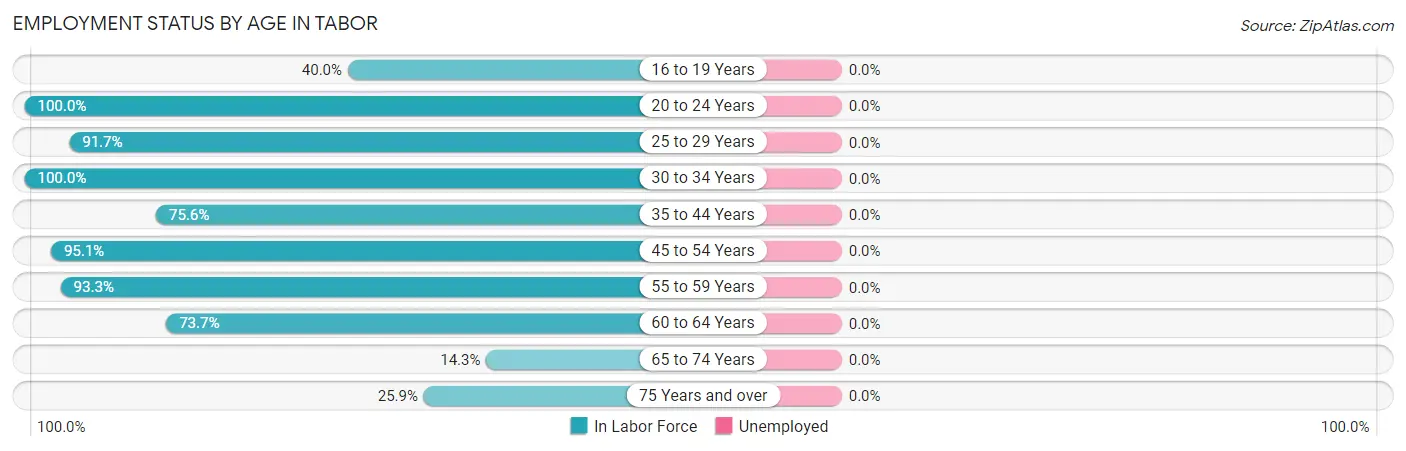
| Age Bracket | In Labor Force | Unemployed |
| 16 to 19 Years | 4 (40.0%) | 0 (0.0%) |
| 20 to 24 Years | 28 (100.0%) | 0 (0.0%) |
| 25 to 29 Years | 11 (91.7%) | 0 (0.0%) |
| 30 to 34 Years | 28 (100.0%) | 0 (0.0%) |
| 35 to 44 Years | 34 (75.6%) | 0 (0.0%) |
| 45 to 54 Years | 58 (95.1%) | 0 (0.0%) |
| 55 to 59 Years | 14 (93.3%) | 0 (0.0%) |
| 60 to 64 Years | 14 (73.7%) | 0 (0.0%) |
| 65 to 74 Years | 7 (14.3%) | 0 (0.0%) |
| 75 Years and over | 15 (25.9%) | 0 (0.0%) |
| Total | 213 (65.5%) | 0 (0.0%) |
Employment Status by Educational Attainment in Tabor
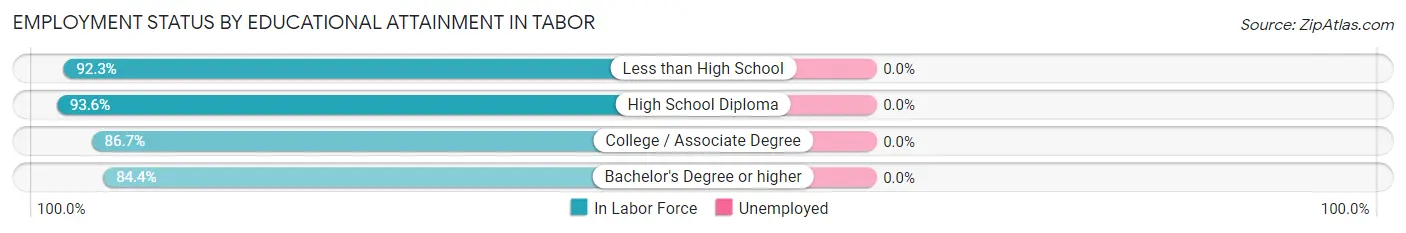
| Educational Attainment | In Labor Force | Unemployed |
| Less than High School | 12 (92.3%) | 0 (0.0%) |
| High School Diploma | 44 (93.6%) | 0 (0.0%) |
| College / Associate Degree | 65 (86.7%) | 0 (0.0%) |
| Bachelor's Degree or higher | 38 (84.4%) | 0 (0.0%) |
| Total | 159 (88.3%) | 0 (0.0%) |
Employment Occupations by Sex in Tabor
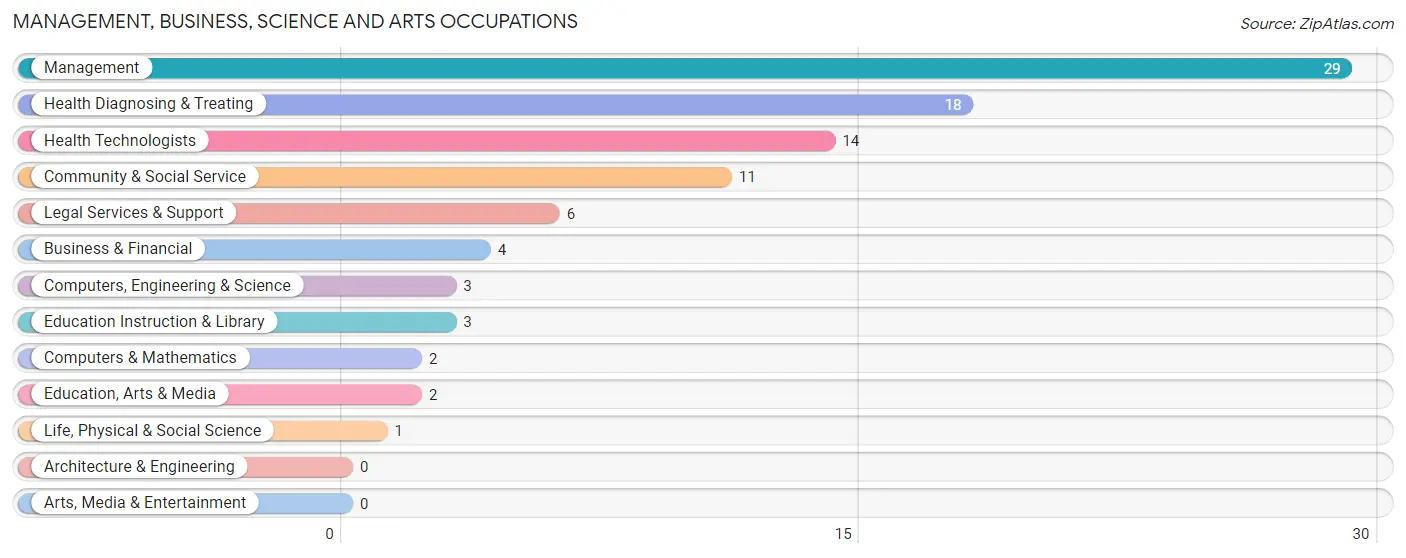
Management, Business, Science and Arts Occupations
The most common Management, Business, Science and Arts occupations in Tabor are Management (29 | 13.9%), Health Diagnosing & Treating (18 | 8.6%), Health Technologists (14 | 6.7%), Community & Social Service (11 | 5.3%), and Legal Services & Support (6 | 2.9%).
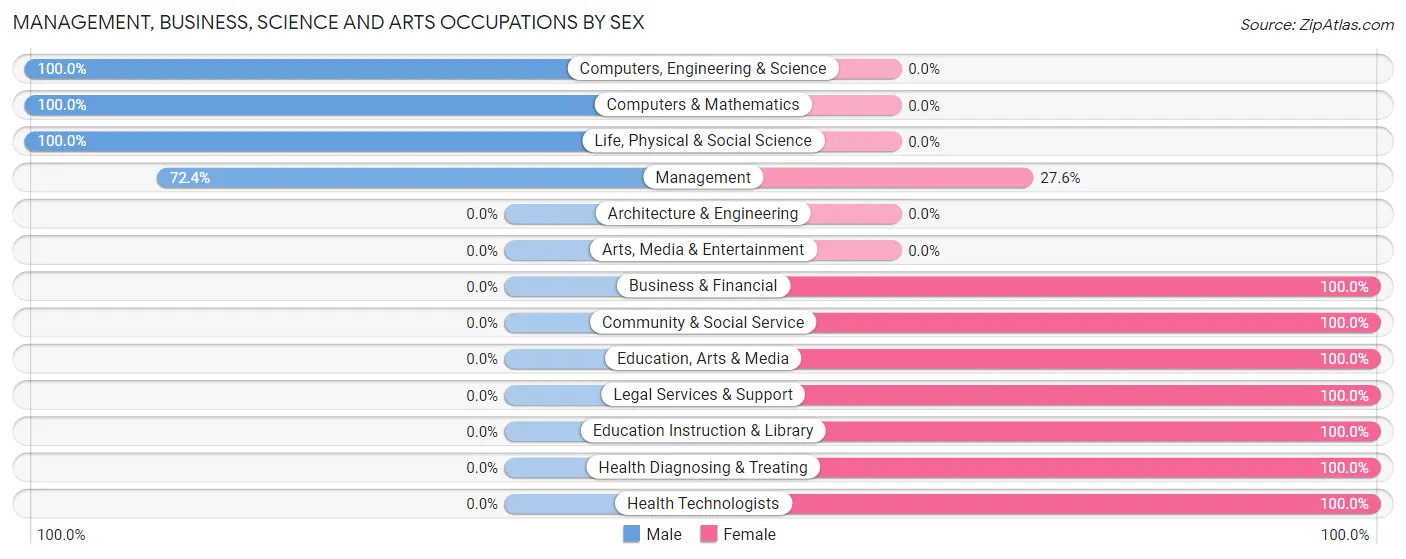
Management, Business, Science and Arts Occupations by Sex
Within the Management, Business, Science and Arts occupations in Tabor, the most male-oriented occupations are Computers, Engineering & Science (100.0%), Computers & Mathematics (100.0%), and Life, Physical & Social Science (100.0%), while the most female-oriented occupations are Business & Financial (100.0%), Community & Social Service (100.0%), and Education, Arts & Media (100.0%).
| Occupation | Male | Female |
| Management | 21 (72.4%) | 8 (27.6%) |
| Business & Financial | 0 (0.0%) | 4 (100.0%) |
| Computers, Engineering & Science | 3 (100.0%) | 0 (0.0%) |
| Computers & Mathematics | 2 (100.0%) | 0 (0.0%) |
| Architecture & Engineering | 0 (0.0%) | 0 (0.0%) |
| Life, Physical & Social Science | 1 (100.0%) | 0 (0.0%) |
| Community & Social Service | 0 (0.0%) | 11 (100.0%) |
| Education, Arts & Media | 0 (0.0%) | 2 (100.0%) |
| Legal Services & Support | 0 (0.0%) | 6 (100.0%) |
| Education Instruction & Library | 0 (0.0%) | 3 (100.0%) |
| Arts, Media & Entertainment | 0 (0.0%) | 0 (0.0%) |
| Health Diagnosing & Treating | 0 (0.0%) | 18 (100.0%) |
| Health Technologists | 0 (0.0%) | 14 (100.0%) |
| Total (Category) | 24 (36.9%) | 41 (63.1%) |
| Total (Overall) | 98 (46.9%) | 111 (53.1%) |
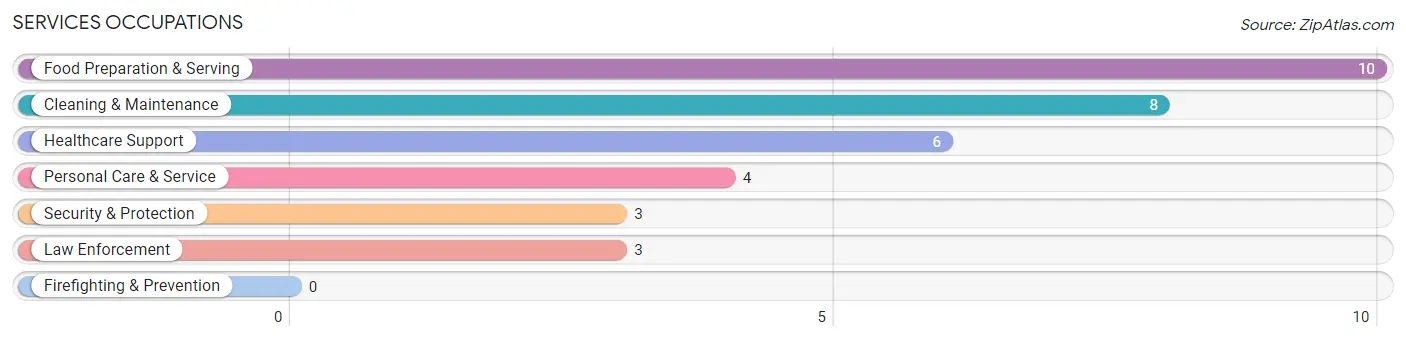
Services Occupations
The most common Services occupations in Tabor are Food Preparation & Serving (10 | 4.8%), Cleaning & Maintenance (8 | 3.8%), Healthcare Support (6 | 2.9%), Personal Care & Service (4 | 1.9%), and Security & Protection (3 | 1.4%).
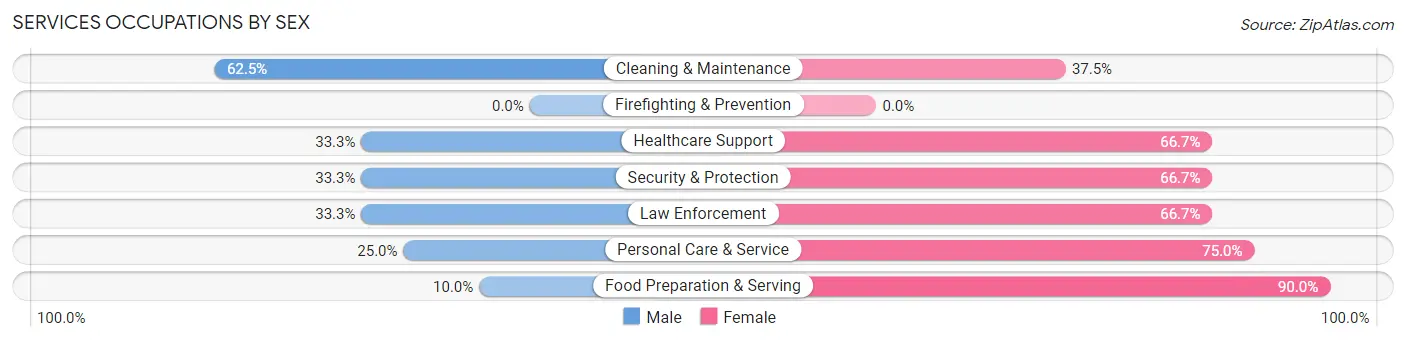
Services Occupations by Sex
Within the Services occupations in Tabor, the most male-oriented occupations are Cleaning & Maintenance (62.5%), Healthcare Support (33.3%), and Security & Protection (33.3%), while the most female-oriented occupations are Food Preparation & Serving (90.0%), Personal Care & Service (75.0%), and Healthcare Support (66.7%).
| Occupation | Male | Female |
| Healthcare Support | 2 (33.3%) | 4 (66.7%) |
| Security & Protection | 1 (33.3%) | 2 (66.7%) |
| Firefighting & Prevention | 0 (0.0%) | 0 (0.0%) |
| Law Enforcement | 1 (33.3%) | 2 (66.7%) |
| Food Preparation & Serving | 1 (10.0%) | 9 (90.0%) |
| Cleaning & Maintenance | 5 (62.5%) | 3 (37.5%) |
| Personal Care & Service | 1 (25.0%) | 3 (75.0%) |
| Total (Category) | 10 (32.3%) | 21 (67.7%) |
| Total (Overall) | 98 (46.9%) | 111 (53.1%) |
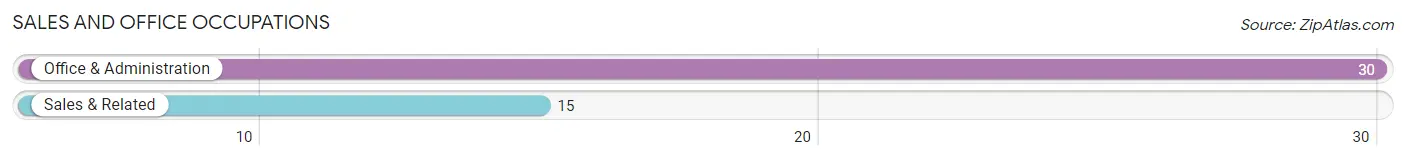
Sales and Office Occupations
The most common Sales and Office occupations in Tabor are Office & Administration (30 | 14.3%), and Sales & Related (15 | 7.2%).
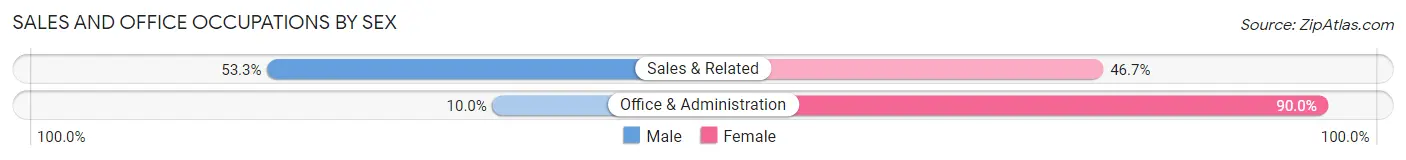
Sales and Office Occupations by Sex
| Occupation | Male | Female |
| Sales & Related | 8 (53.3%) | 7 (46.7%) |
| Office & Administration | 3 (10.0%) | 27 (90.0%) |
| Total (Category) | 11 (24.4%) | 34 (75.6%) |
| Total (Overall) | 98 (46.9%) | 111 (53.1%) |
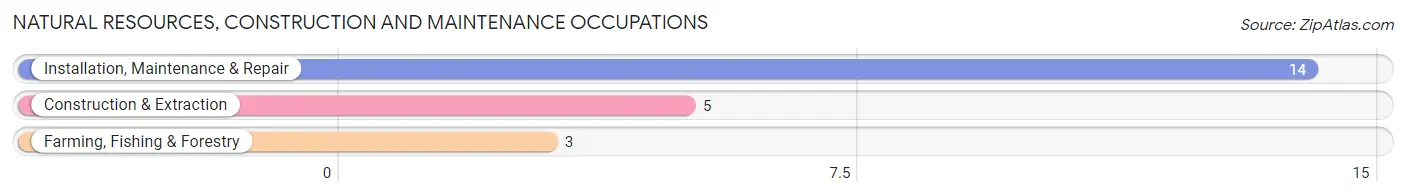
Natural Resources, Construction and Maintenance Occupations
The most common Natural Resources, Construction and Maintenance occupations in Tabor are Installation, Maintenance & Repair (14 | 6.7%), Construction & Extraction (5 | 2.4%), and Farming, Fishing & Forestry (3 | 1.4%).
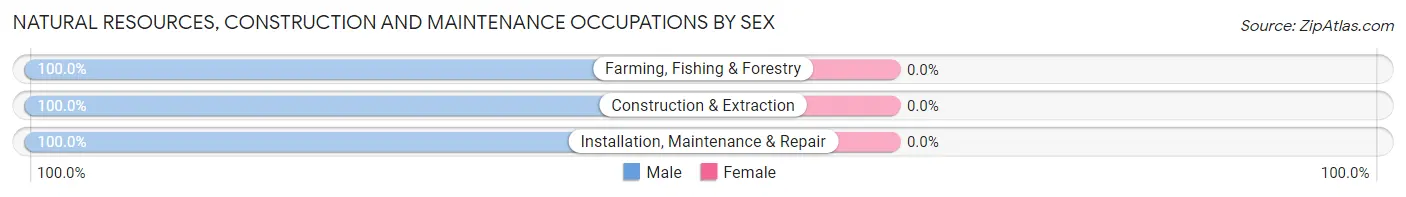
Natural Resources, Construction and Maintenance Occupations by Sex
| Occupation | Male | Female |
| Farming, Fishing & Forestry | 3 (100.0%) | 0 (0.0%) |
| Construction & Extraction | 5 (100.0%) | 0 (0.0%) |
| Installation, Maintenance & Repair | 14 (100.0%) | 0 (0.0%) |
| Total (Category) | 22 (100.0%) | 0 (0.0%) |
| Total (Overall) | 98 (46.9%) | 111 (53.1%) |
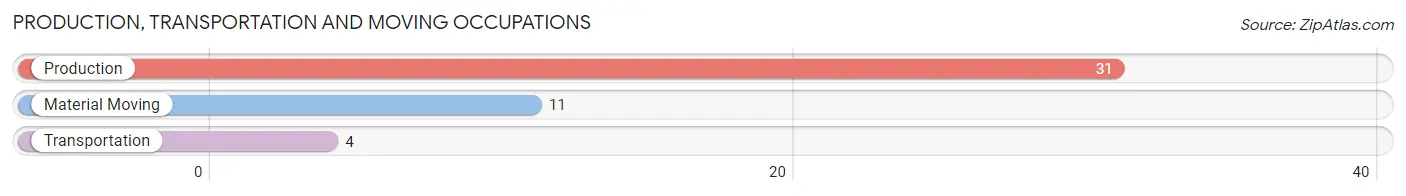
Production, Transportation and Moving Occupations
The most common Production, Transportation and Moving occupations in Tabor are Production (31 | 14.8%), Material Moving (11 | 5.3%), and Transportation (4 | 1.9%).
Production, Transportation and Moving Occupations by Sex
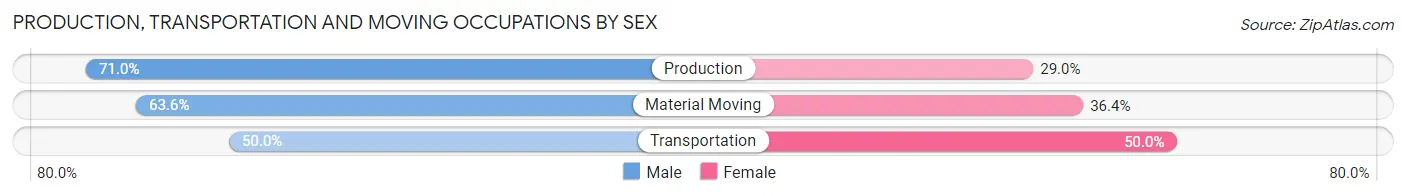
| Occupation | Male | Female |
| Production | 22 (71.0%) | 9 (29.0%) |
| Transportation | 2 (50.0%) | 2 (50.0%) |
| Material Moving | 7 (63.6%) | 4 (36.4%) |
| Total (Category) | 31 (67.4%) | 15 (32.6%) |
| Total (Overall) | 98 (46.9%) | 111 (53.1%) |
Employment Industries by Sex in Tabor
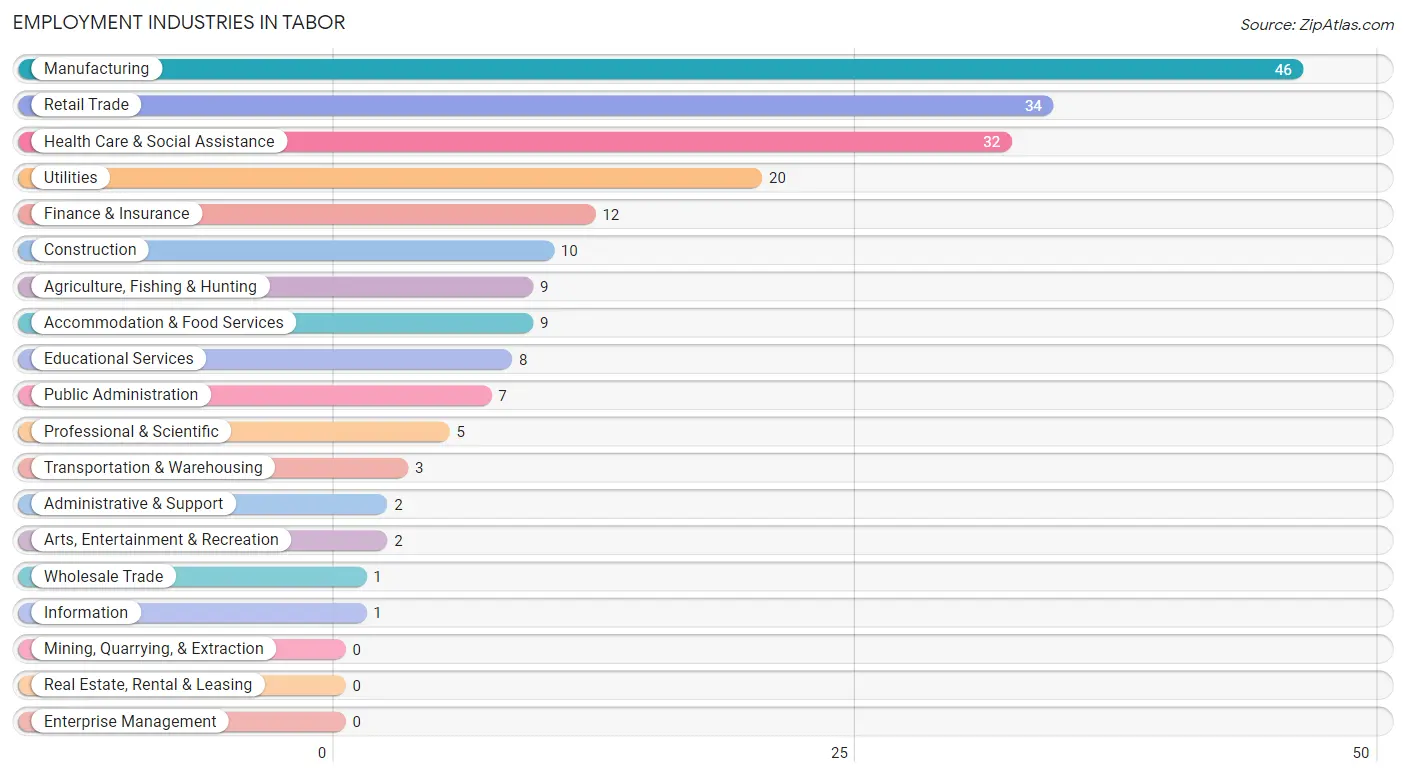
Employment Industries in Tabor
The major employment industries in Tabor include Manufacturing (46 | 22.0%), Retail Trade (34 | 16.3%), Health Care & Social Assistance (32 | 15.3%), Utilities (20 | 9.6%), and Finance & Insurance (12 | 5.7%).
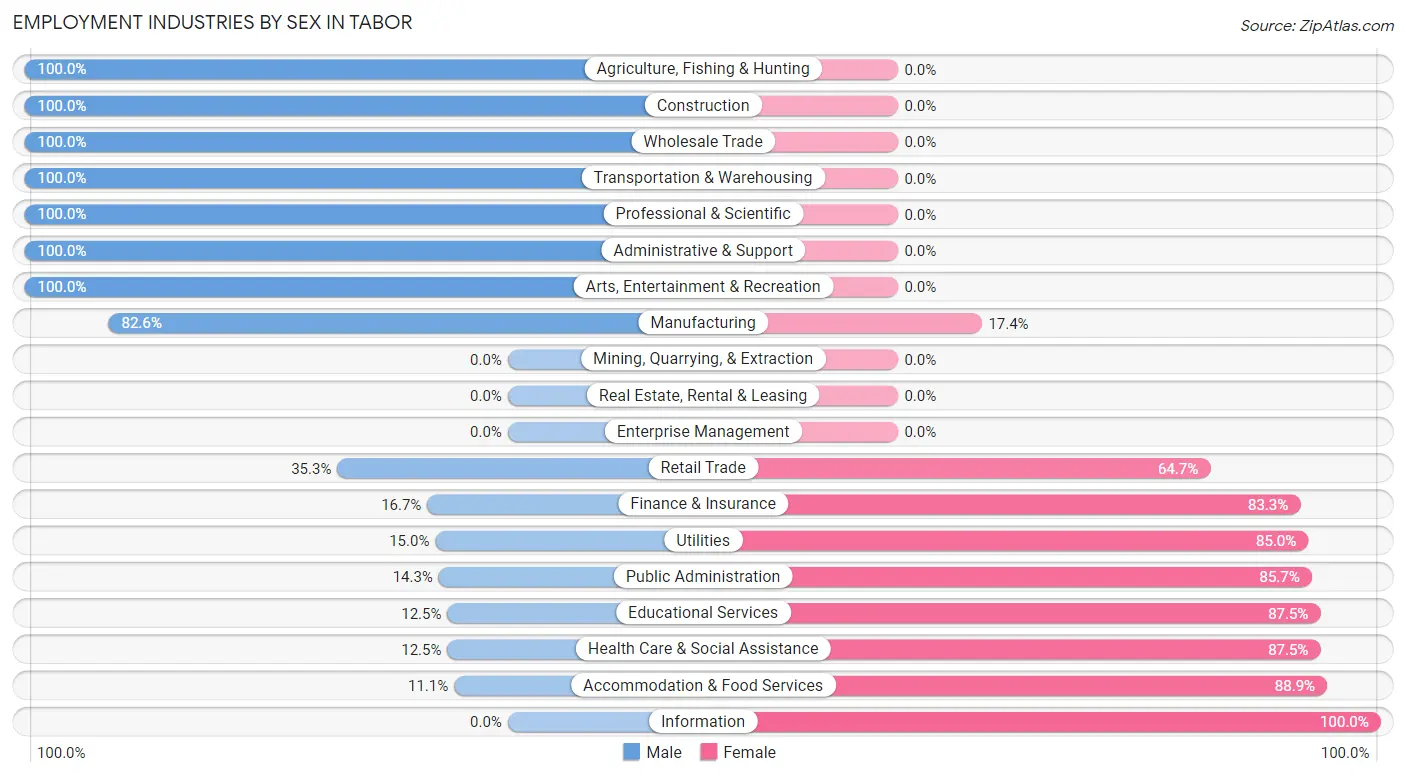
Employment Industries by Sex in Tabor
The Tabor industries that see more men than women are Agriculture, Fishing & Hunting (100.0%), Construction (100.0%), and Wholesale Trade (100.0%), whereas the industries that tend to have a higher number of women are Information (100.0%), Accommodation & Food Services (88.9%), and Educational Services (87.5%).
| Industry | Male | Female |
| Agriculture, Fishing & Hunting | 9 (100.0%) | 0 (0.0%) |
| Mining, Quarrying, & Extraction | 0 (0.0%) | 0 (0.0%) |
| Construction | 10 (100.0%) | 0 (0.0%) |
| Manufacturing | 38 (82.6%) | 8 (17.4%) |
| Wholesale Trade | 1 (100.0%) | 0 (0.0%) |
| Retail Trade | 12 (35.3%) | 22 (64.7%) |
| Transportation & Warehousing | 3 (100.0%) | 0 (0.0%) |
| Utilities | 3 (15.0%) | 17 (85.0%) |
| Information | 0 (0.0%) | 1 (100.0%) |
| Finance & Insurance | 2 (16.7%) | 10 (83.3%) |
| Real Estate, Rental & Leasing | 0 (0.0%) | 0 (0.0%) |
| Professional & Scientific | 5 (100.0%) | 0 (0.0%) |
| Enterprise Management | 0 (0.0%) | 0 (0.0%) |
| Administrative & Support | 2 (100.0%) | 0 (0.0%) |
| Educational Services | 1 (12.5%) | 7 (87.5%) |
| Health Care & Social Assistance | 4 (12.5%) | 28 (87.5%) |
| Arts, Entertainment & Recreation | 2 (100.0%) | 0 (0.0%) |
| Accommodation & Food Services | 1 (11.1%) | 8 (88.9%) |
| Public Administration | 1 (14.3%) | 6 (85.7%) |
| Total | 98 (46.9%) | 111 (53.1%) |
Education in Tabor
School Enrollment in Tabor
The most common levels of schooling among the 72 students in Tabor are middle school (20 | 27.8%), high school (18 | 25.0%), and elementary school (13 | 18.1%).
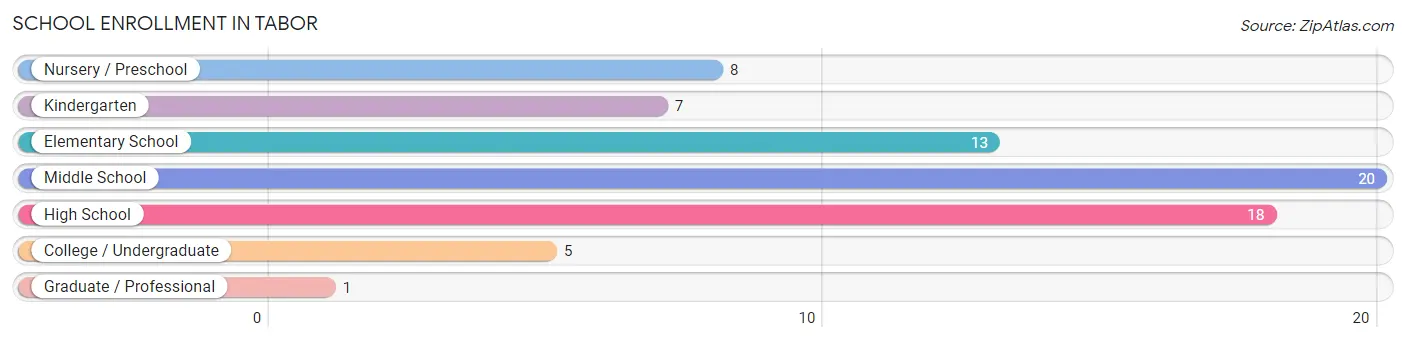
| School Level | # Students | % Students |
| Nursery / Preschool | 8 | 11.1% |
| Kindergarten | 7 | 9.7% |
| Elementary School | 13 | 18.1% |
| Middle School | 20 | 27.8% |
| High School | 18 | 25.0% |
| College / Undergraduate | 5 | 6.9% |
| Graduate / Professional | 1 | 1.4% |
| Total | 72 | 100.0% |
School Enrollment by Age by Funding Source in Tabor
Out of a total of 72 students who are enrolled in schools in Tabor, 2 (2.8%) attend a private institution, while the remaining 70 (97.2%) are enrolled in public schools. The age group of 35 years and over has the highest likelihood of being enrolled in private schools, with 1 (33.3% in the age bracket) enrolled. Conversely, the age group of 3 to 4 year olds has the lowest likelihood of being enrolled in a private school, with 3 (100.0% in the age bracket) attending a public institution.
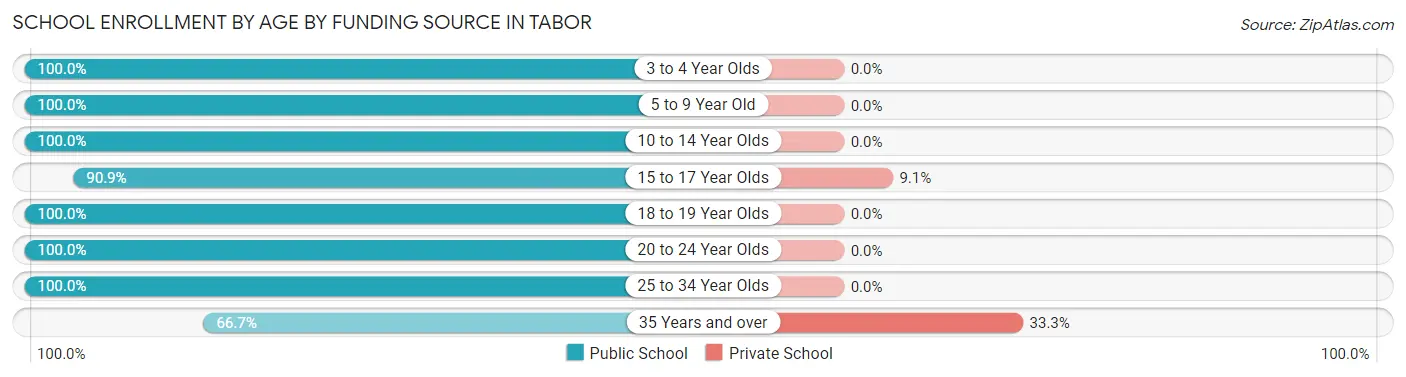
| Age Bracket | Public School | Private School |
| 3 to 4 Year Olds | 3 (100.0%) | 0 (0.0%) |
| 5 to 9 Year Old | 23 (100.0%) | 0 (0.0%) |
| 10 to 14 Year Olds | 25 (100.0%) | 0 (0.0%) |
| 15 to 17 Year Olds | 10 (90.9%) | 1 (9.1%) |
| 18 to 19 Year Olds | 4 (100.0%) | 0 (0.0%) |
| 20 to 24 Year Olds | 2 (100.0%) | 0 (0.0%) |
| 25 to 34 Year Olds | 1 (100.0%) | 0 (0.0%) |
| 35 Years and over | 2 (66.7%) | 1 (33.3%) |
| Total | 70 (97.2%) | 2 (2.8%) |
Educational Attainment by Field of Study in Tabor
Psychology (16 | 25.8%), education (15 | 24.2%), science & technology (10 | 16.1%), business (8 | 12.9%), and bio, nature & agricultural (6 | 9.7%) are the most common fields of study among 62 individuals in Tabor who have obtained a bachelor's degree or higher.
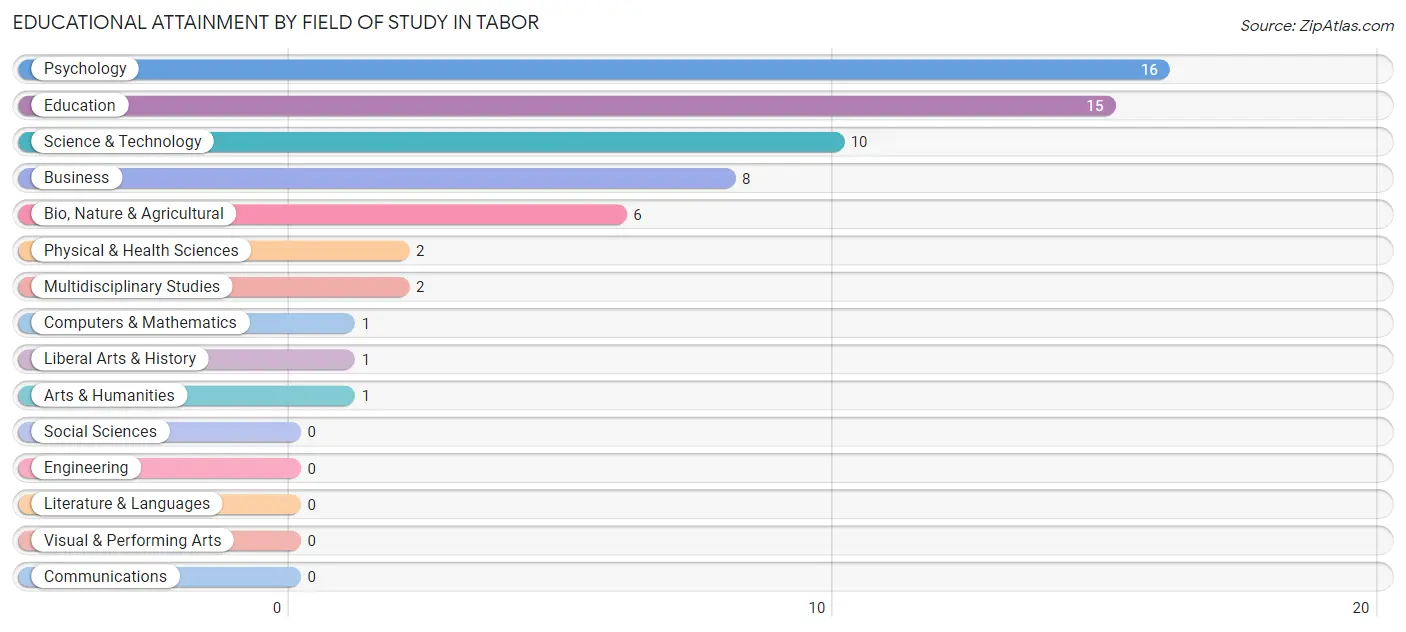
| Field of Study | # Graduates | % Graduates |
| Computers & Mathematics | 1 | 1.6% |
| Bio, Nature & Agricultural | 6 | 9.7% |
| Physical & Health Sciences | 2 | 3.2% |
| Psychology | 16 | 25.8% |
| Social Sciences | 0 | 0.0% |
| Engineering | 0 | 0.0% |
| Multidisciplinary Studies | 2 | 3.2% |
| Science & Technology | 10 | 16.1% |
| Business | 8 | 12.9% |
| Education | 15 | 24.2% |
| Literature & Languages | 0 | 0.0% |
| Liberal Arts & History | 1 | 1.6% |
| Visual & Performing Arts | 0 | 0.0% |
| Communications | 0 | 0.0% |
| Arts & Humanities | 1 | 1.6% |
| Total | 62 | 100.0% |
Transportation & Commute in Tabor
Vehicle Availability by Sex in Tabor
The most prevalent vehicle ownership categories in Tabor are males with 2 vehicles (37, accounting for 36.3%) and females with 2 vehicles (33, making up 34.9%).
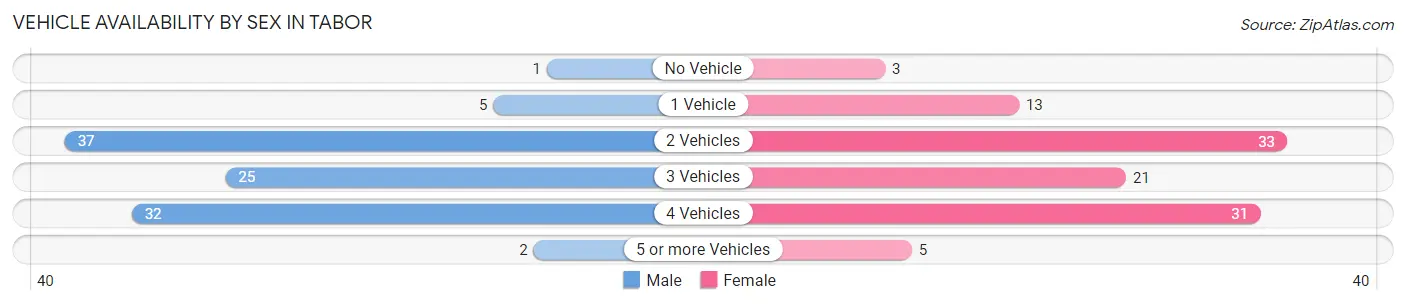
| Vehicles Available | Male | Female |
| No Vehicle | 1 (1.0%) | 3 (2.8%) |
| 1 Vehicle | 5 (4.9%) | 13 (12.3%) |
| 2 Vehicles | 37 (36.3%) | 33 (31.1%) |
| 3 Vehicles | 25 (24.5%) | 21 (19.8%) |
| 4 Vehicles | 32 (31.4%) | 31 (29.2%) |
| 5 or more Vehicles | 2 (2.0%) | 5 (4.7%) |
| Total | 102 (100.0%) | 106 (100.0%) |
Commute Time in Tabor
The most frequently occuring commute durations in Tabor are 20 to 24 minutes (58 commuters, 28.2%), 5 to 9 minutes (31 commuters, 15.0%), and less than 5 minutes (26 commuters, 12.6%).
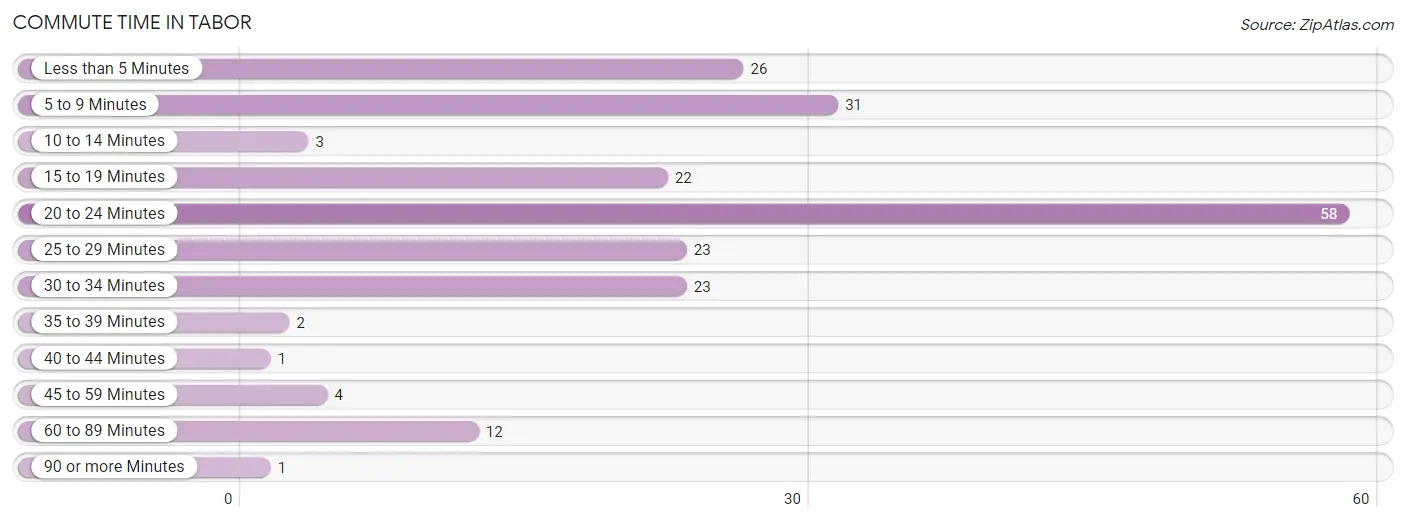
| Commute Time | # Commuters | % Commuters |
| Less than 5 Minutes | 26 | 12.6% |
| 5 to 9 Minutes | 31 | 15.0% |
| 10 to 14 Minutes | 3 | 1.5% |
| 15 to 19 Minutes | 22 | 10.7% |
| 20 to 24 Minutes | 58 | 28.2% |
| 25 to 29 Minutes | 23 | 11.2% |
| 30 to 34 Minutes | 23 | 11.2% |
| 35 to 39 Minutes | 2 | 1.0% |
| 40 to 44 Minutes | 1 | 0.5% |
| 45 to 59 Minutes | 4 | 1.9% |
| 60 to 89 Minutes | 12 | 5.8% |
| 90 or more Minutes | 1 | 0.5% |
Commute Time by Sex in Tabor
The most common commute times in Tabor are 20 to 24 minutes (29 commuters, 28.4%) for males and 5 to 9 minutes (29 commuters, 27.9%) for females.
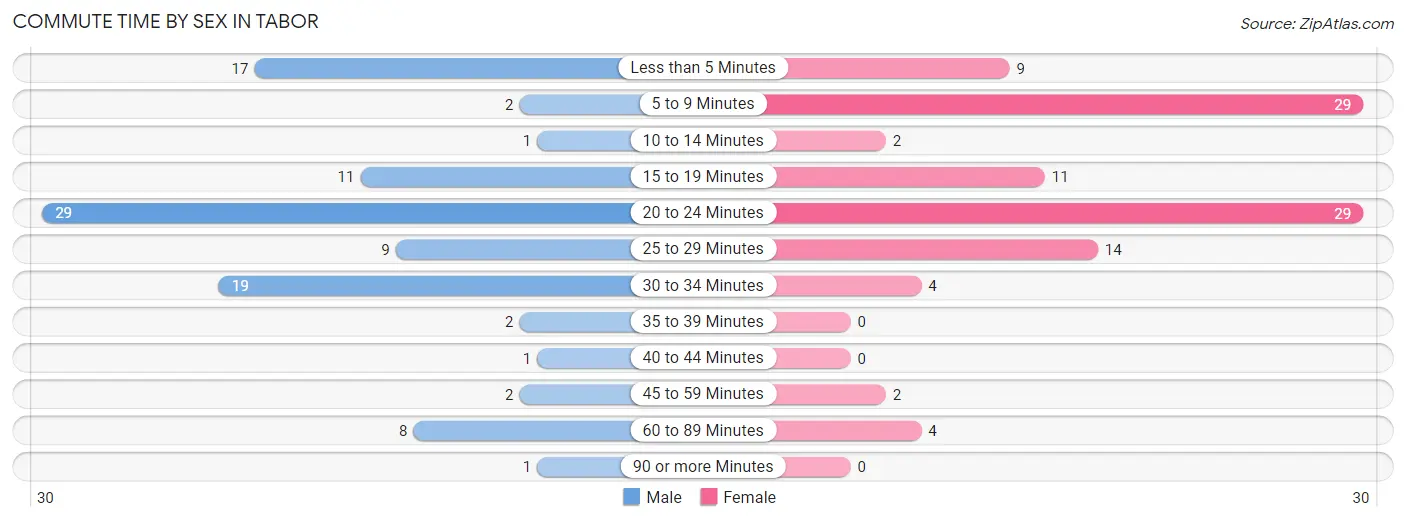
| Commute Time | Male | Female |
| Less than 5 Minutes | 17 (16.7%) | 9 (8.6%) |
| 5 to 9 Minutes | 2 (2.0%) | 29 (27.9%) |
| 10 to 14 Minutes | 1 (1.0%) | 2 (1.9%) |
| 15 to 19 Minutes | 11 (10.8%) | 11 (10.6%) |
| 20 to 24 Minutes | 29 (28.4%) | 29 (27.9%) |
| 25 to 29 Minutes | 9 (8.8%) | 14 (13.5%) |
| 30 to 34 Minutes | 19 (18.6%) | 4 (3.8%) |
| 35 to 39 Minutes | 2 (2.0%) | 0 (0.0%) |
| 40 to 44 Minutes | 1 (1.0%) | 0 (0.0%) |
| 45 to 59 Minutes | 2 (2.0%) | 2 (1.9%) |
| 60 to 89 Minutes | 8 (7.8%) | 4 (3.8%) |
| 90 or more Minutes | 1 (1.0%) | 0 (0.0%) |
Time of Departure to Work by Sex in Tabor
The most frequent times of departure to work in Tabor are 7:00 AM to 7:29 AM (29, 28.4%) for males and 7:30 AM to 7:59 AM (30, 28.8%) for females.
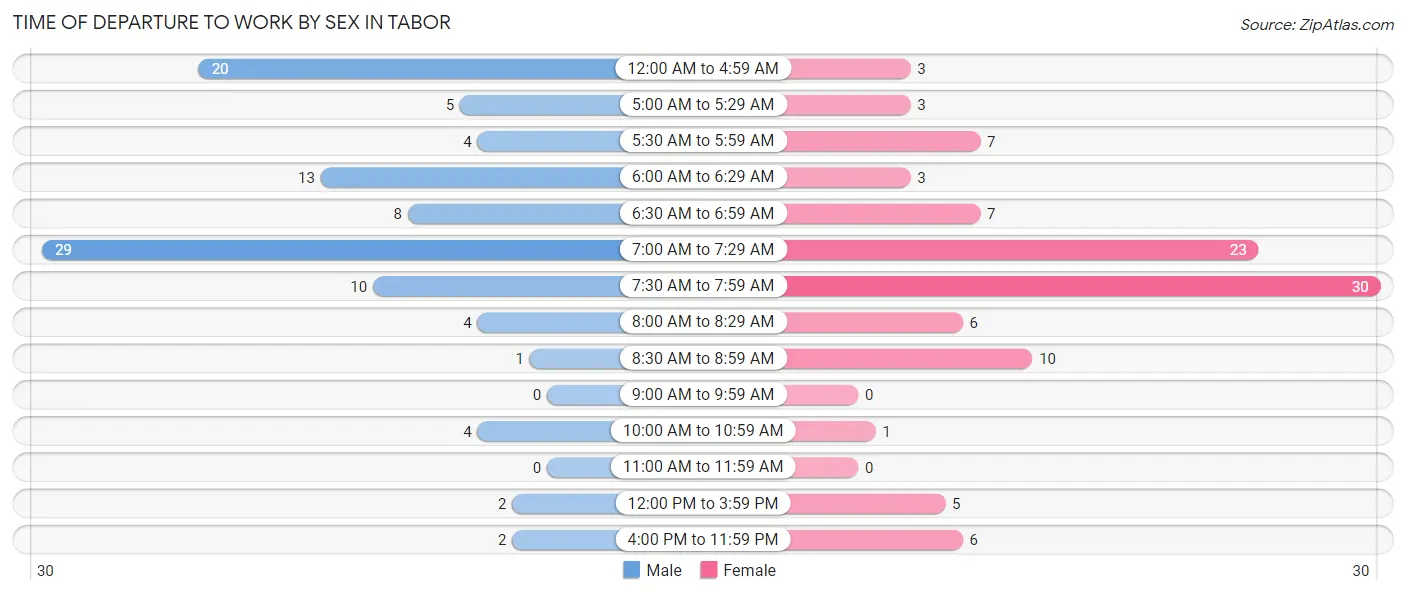
| Time of Departure | Male | Female |
| 12:00 AM to 4:59 AM | 20 (19.6%) | 3 (2.9%) |
| 5:00 AM to 5:29 AM | 5 (4.9%) | 3 (2.9%) |
| 5:30 AM to 5:59 AM | 4 (3.9%) | 7 (6.7%) |
| 6:00 AM to 6:29 AM | 13 (12.8%) | 3 (2.9%) |
| 6:30 AM to 6:59 AM | 8 (7.8%) | 7 (6.7%) |
| 7:00 AM to 7:29 AM | 29 (28.4%) | 23 (22.1%) |
| 7:30 AM to 7:59 AM | 10 (9.8%) | 30 (28.8%) |
| 8:00 AM to 8:29 AM | 4 (3.9%) | 6 (5.8%) |
| 8:30 AM to 8:59 AM | 1 (1.0%) | 10 (9.6%) |
| 9:00 AM to 9:59 AM | 0 (0.0%) | 0 (0.0%) |
| 10:00 AM to 10:59 AM | 4 (3.9%) | 1 (1.0%) |
| 11:00 AM to 11:59 AM | 0 (0.0%) | 0 (0.0%) |
| 12:00 PM to 3:59 PM | 2 (2.0%) | 5 (4.8%) |
| 4:00 PM to 11:59 PM | 2 (2.0%) | 6 (5.8%) |
| Total | 102 (100.0%) | 104 (100.0%) |
Housing Occupancy in Tabor
Occupancy by Ownership in Tabor
Of the total 179 dwellings in Tabor, owner-occupied units account for 133 (74.3%), while renter-occupied units make up 46 (25.7%).
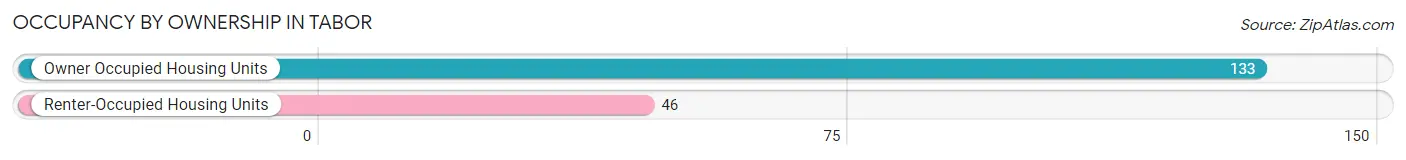
| Occupancy | # Housing Units | % Housing Units |
| Owner Occupied Housing Units | 133 | 74.3% |
| Renter-Occupied Housing Units | 46 | 25.7% |
| Total Occupied Housing Units | 179 | 100.0% |
Occupancy by Household Size in Tabor
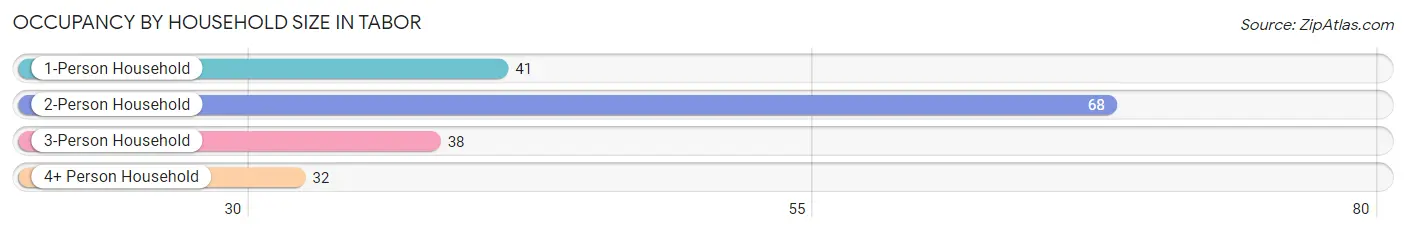
| Household Size | # Housing Units | % Housing Units |
| 1-Person Household | 41 | 22.9% |
| 2-Person Household | 68 | 38.0% |
| 3-Person Household | 38 | 21.2% |
| 4+ Person Household | 32 | 17.9% |
| Total Housing Units | 179 | 100.0% |
Occupancy by Ownership by Household Size in Tabor
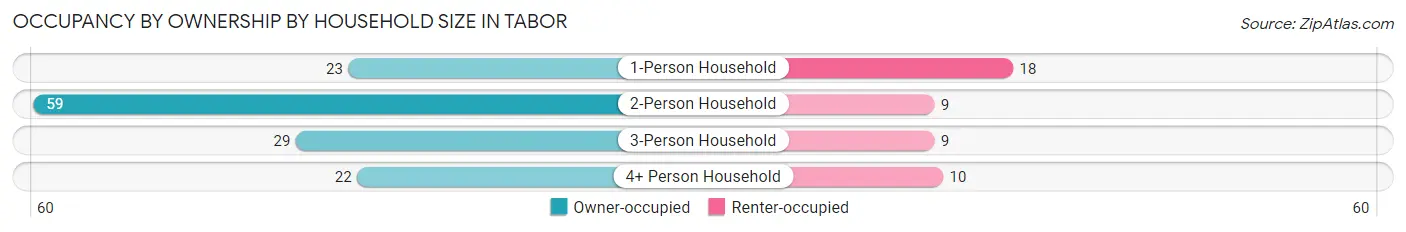
| Household Size | Owner-occupied | Renter-occupied |
| 1-Person Household | 23 (56.1%) | 18 (43.9%) |
| 2-Person Household | 59 (86.8%) | 9 (13.2%) |
| 3-Person Household | 29 (76.3%) | 9 (23.7%) |
| 4+ Person Household | 22 (68.8%) | 10 (31.2%) |
| Total Housing Units | 133 (74.3%) | 46 (25.7%) |
Occupancy by Educational Attainment in Tabor
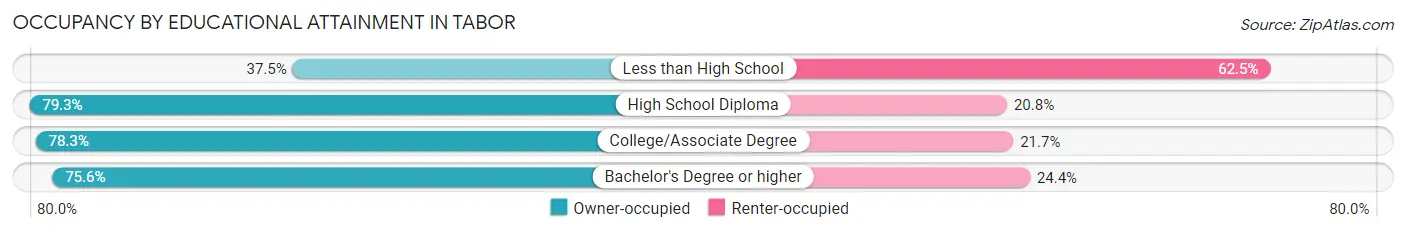
| Household Size | Owner-occupied | Renter-occupied |
| Less than High School | 6 (37.5%) | 10 (62.5%) |
| High School Diploma | 42 (79.2%) | 11 (20.7%) |
| College/Associate Degree | 54 (78.3%) | 15 (21.7%) |
| Bachelor's Degree or higher | 31 (75.6%) | 10 (24.4%) |
Occupancy by Age of Householder in Tabor
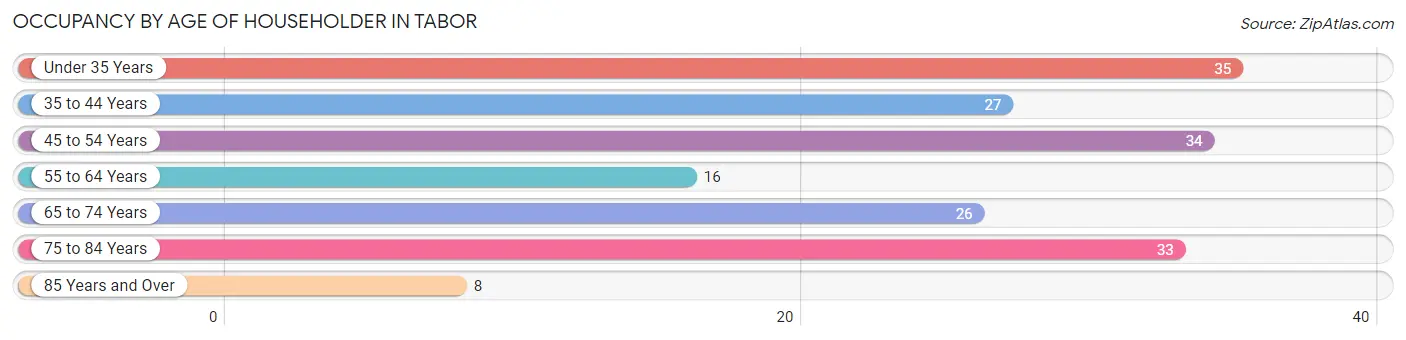
| Age Bracket | # Households | % Households |
| Under 35 Years | 35 | 19.6% |
| 35 to 44 Years | 27 | 15.1% |
| 45 to 54 Years | 34 | 19.0% |
| 55 to 64 Years | 16 | 8.9% |
| 65 to 74 Years | 26 | 14.5% |
| 75 to 84 Years | 33 | 18.4% |
| 85 Years and Over | 8 | 4.5% |
| Total | 179 | 100.0% |
Housing Finances in Tabor
Median Income by Occupancy in Tabor
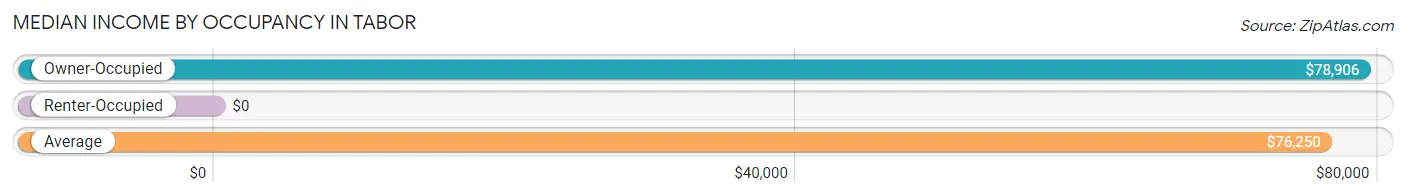
| Occupancy Type | # Households | Median Income |
| Owner-Occupied | 133 (74.3%) | $78,906 |
| Renter-Occupied | 46 (25.7%) | $0 |
| Average | 179 (100.0%) | $76,250 |
Occupancy by Householder Income Bracket in Tabor
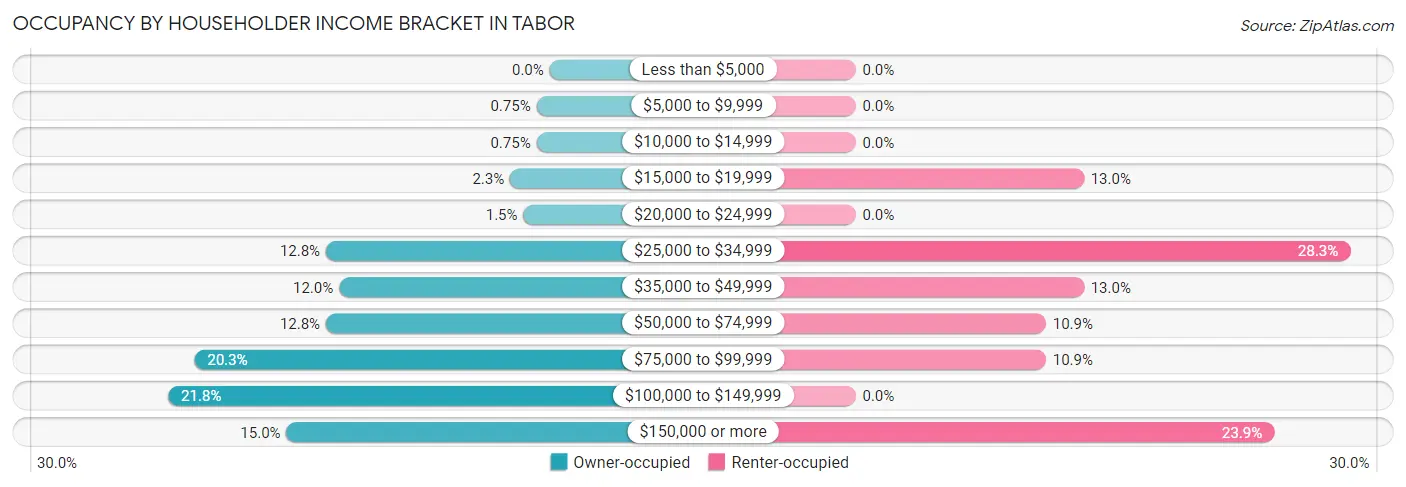
| Income Bracket | Owner-occupied | Renter-occupied |
| Less than $5,000 | 0 (0.0%) | 0 (0.0%) |
| $5,000 to $9,999 | 1 (0.7%) | 0 (0.0%) |
| $10,000 to $14,999 | 1 (0.7%) | 0 (0.0%) |
| $15,000 to $19,999 | 3 (2.3%) | 6 (13.0%) |
| $20,000 to $24,999 | 2 (1.5%) | 0 (0.0%) |
| $25,000 to $34,999 | 17 (12.8%) | 13 (28.3%) |
| $35,000 to $49,999 | 16 (12.0%) | 6 (13.0%) |
| $50,000 to $74,999 | 17 (12.8%) | 5 (10.9%) |
| $75,000 to $99,999 | 27 (20.3%) | 5 (10.9%) |
| $100,000 to $149,999 | 29 (21.8%) | 0 (0.0%) |
| $150,000 or more | 20 (15.0%) | 11 (23.9%) |
| Total | 133 (100.0%) | 46 (100.0%) |
Monthly Housing Cost Tiers in Tabor
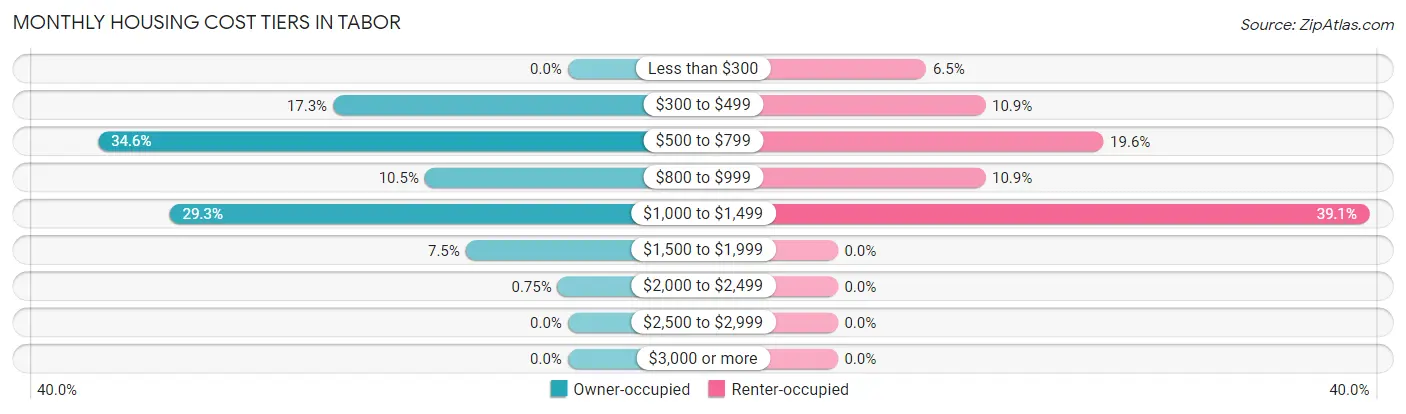
| Monthly Cost | Owner-occupied | Renter-occupied |
| Less than $300 | 0 (0.0%) | 3 (6.5%) |
| $300 to $499 | 23 (17.3%) | 5 (10.9%) |
| $500 to $799 | 46 (34.6%) | 9 (19.6%) |
| $800 to $999 | 14 (10.5%) | 5 (10.9%) |
| $1,000 to $1,499 | 39 (29.3%) | 18 (39.1%) |
| $1,500 to $1,999 | 10 (7.5%) | 0 (0.0%) |
| $2,000 to $2,499 | 1 (0.7%) | 0 (0.0%) |
| $2,500 to $2,999 | 0 (0.0%) | 0 (0.0%) |
| $3,000 or more | 0 (0.0%) | 0 (0.0%) |
| Total | 133 (100.0%) | 46 (100.0%) |
Physical Housing Characteristics in Tabor
Housing Structures in Tabor
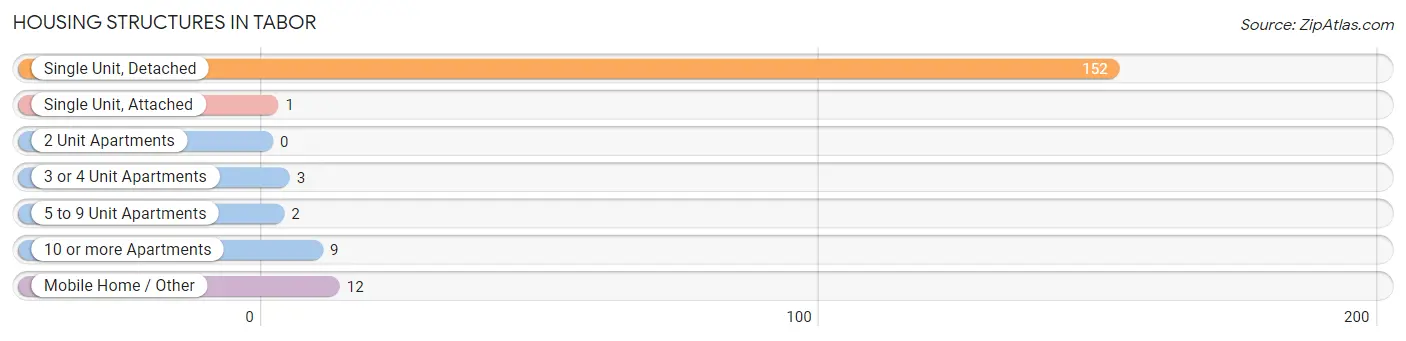
| Structure Type | # Housing Units | % Housing Units |
| Single Unit, Detached | 152 | 84.9% |
| Single Unit, Attached | 1 | 0.6% |
| 2 Unit Apartments | 0 | 0.0% |
| 3 or 4 Unit Apartments | 3 | 1.7% |
| 5 to 9 Unit Apartments | 2 | 1.1% |
| 10 or more Apartments | 9 | 5.0% |
| Mobile Home / Other | 12 | 6.7% |
| Total | 179 | 100.0% |
Housing Structures by Occupancy in Tabor
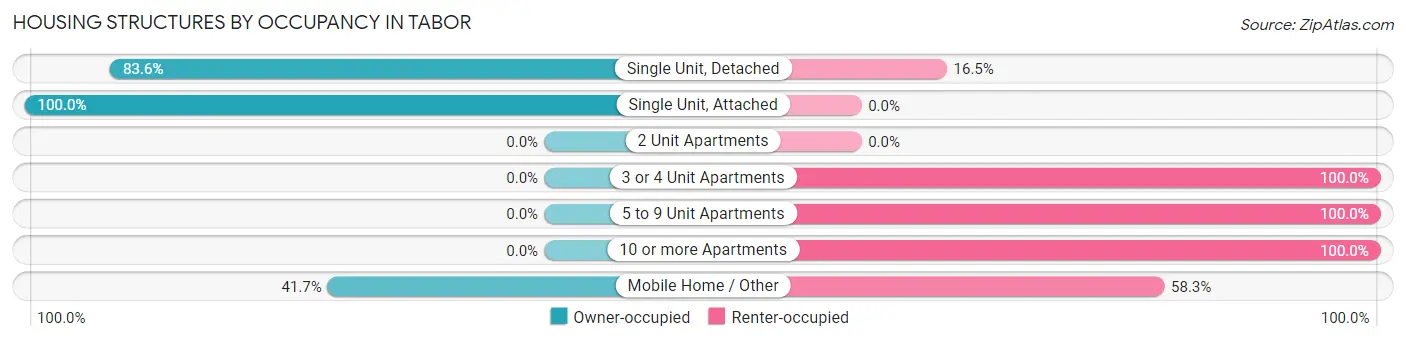
| Structure Type | Owner-occupied | Renter-occupied |
| Single Unit, Detached | 127 (83.6%) | 25 (16.5%) |
| Single Unit, Attached | 1 (100.0%) | 0 (0.0%) |
| 2 Unit Apartments | 0 (0.0%) | 0 (0.0%) |
| 3 or 4 Unit Apartments | 0 (0.0%) | 3 (100.0%) |
| 5 to 9 Unit Apartments | 0 (0.0%) | 2 (100.0%) |
| 10 or more Apartments | 0 (0.0%) | 9 (100.0%) |
| Mobile Home / Other | 5 (41.7%) | 7 (58.3%) |
| Total | 133 (74.3%) | 46 (25.7%) |
Housing Structures by Number of Rooms in Tabor
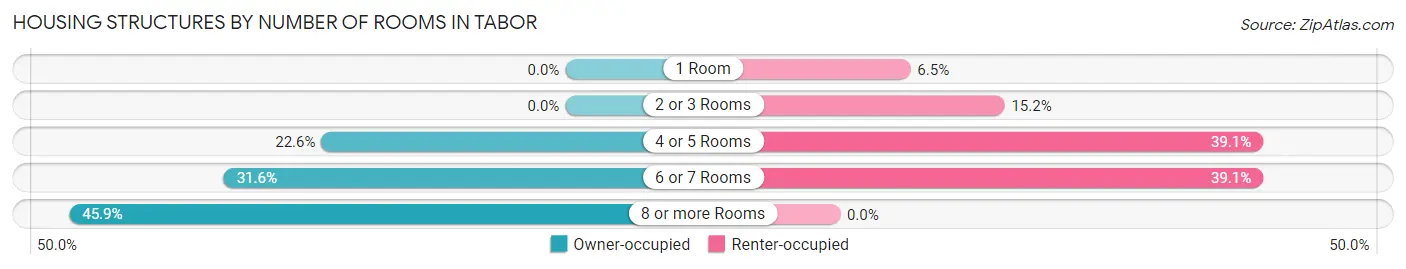
| Number of Rooms | Owner-occupied | Renter-occupied |
| 1 Room | 0 (0.0%) | 3 (6.5%) |
| 2 or 3 Rooms | 0 (0.0%) | 7 (15.2%) |
| 4 or 5 Rooms | 30 (22.6%) | 18 (39.1%) |
| 6 or 7 Rooms | 42 (31.6%) | 18 (39.1%) |
| 8 or more Rooms | 61 (45.9%) | 0 (0.0%) |
| Total | 133 (100.0%) | 46 (100.0%) |
Housing Structure by Heating Type in Tabor
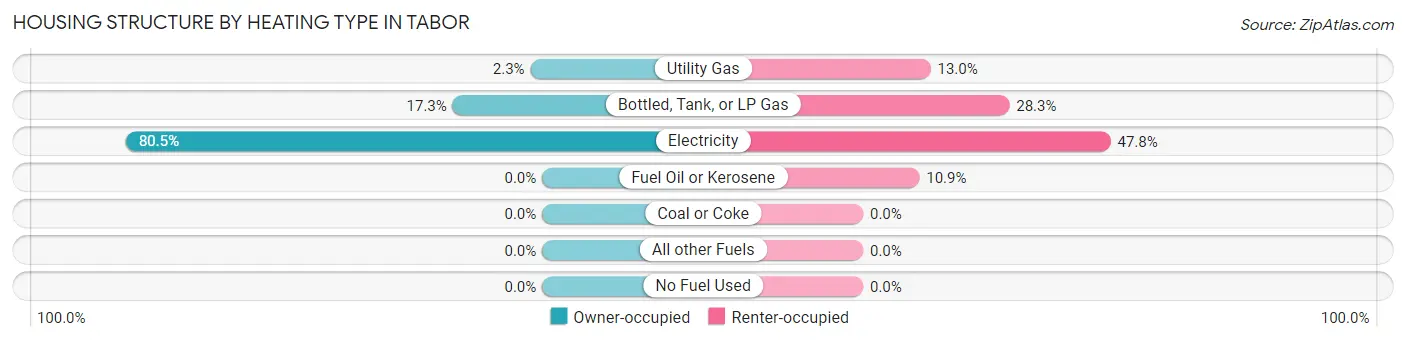
| Heating Type | Owner-occupied | Renter-occupied |
| Utility Gas | 3 (2.3%) | 6 (13.0%) |
| Bottled, Tank, or LP Gas | 23 (17.3%) | 13 (28.3%) |
| Electricity | 107 (80.4%) | 22 (47.8%) |
| Fuel Oil or Kerosene | 0 (0.0%) | 5 (10.9%) |
| Coal or Coke | 0 (0.0%) | 0 (0.0%) |
| All other Fuels | 0 (0.0%) | 0 (0.0%) |
| No Fuel Used | 0 (0.0%) | 0 (0.0%) |
| Total | 133 (100.0%) | 46 (100.0%) |
Household Vehicle Usage in Tabor
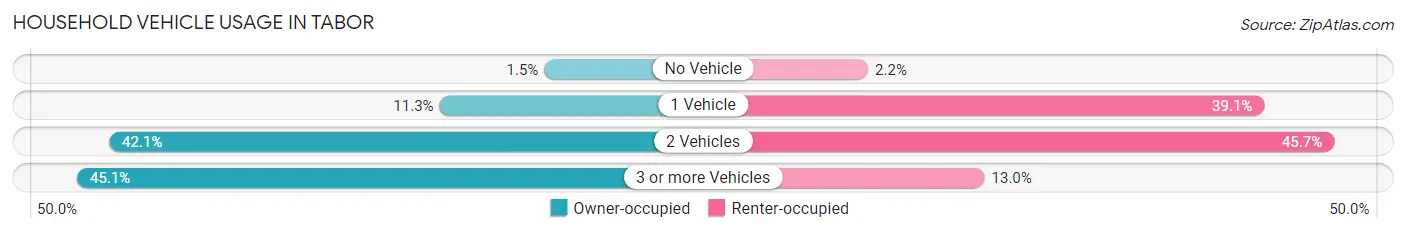
| Vehicles per Household | Owner-occupied | Renter-occupied |
| No Vehicle | 2 (1.5%) | 1 (2.2%) |
| 1 Vehicle | 15 (11.3%) | 18 (39.1%) |
| 2 Vehicles | 56 (42.1%) | 21 (45.7%) |
| 3 or more Vehicles | 60 (45.1%) | 6 (13.0%) |
| Total | 133 (100.0%) | 46 (100.0%) |
Real Estate & Mortgages in Tabor
Real Estate and Mortgage Overview in Tabor
| Characteristic | Without Mortgage | With Mortgage |
| Housing Units | 69 | 64 |
| Median Property Value | $110,500 | $175,000 |
| Median Household Income | $55,313 | $16 |
| Monthly Housing Costs | $537 | $0 |
| Real Estate Taxes | $1,417 | $0 |
Property Value by Mortgage Status in Tabor
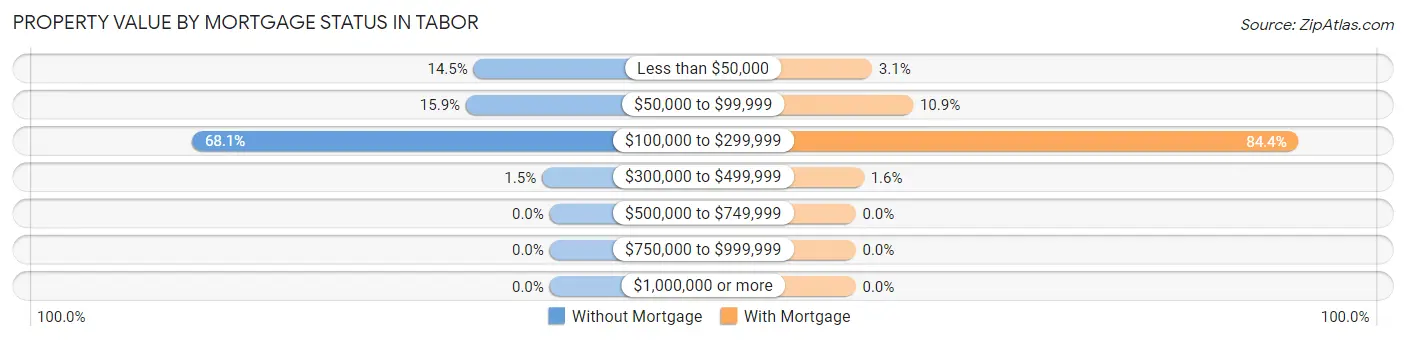
| Property Value | Without Mortgage | With Mortgage |
| Less than $50,000 | 10 (14.5%) | 2 (3.1%) |
| $50,000 to $99,999 | 11 (15.9%) | 7 (10.9%) |
| $100,000 to $299,999 | 47 (68.1%) | 54 (84.4%) |
| $300,000 to $499,999 | 1 (1.5%) | 1 (1.6%) |
| $500,000 to $749,999 | 0 (0.0%) | 0 (0.0%) |
| $750,000 to $999,999 | 0 (0.0%) | 0 (0.0%) |
| $1,000,000 or more | 0 (0.0%) | 0 (0.0%) |
| Total | 69 (100.0%) | 64 (100.0%) |
Household Income by Mortgage Status in Tabor
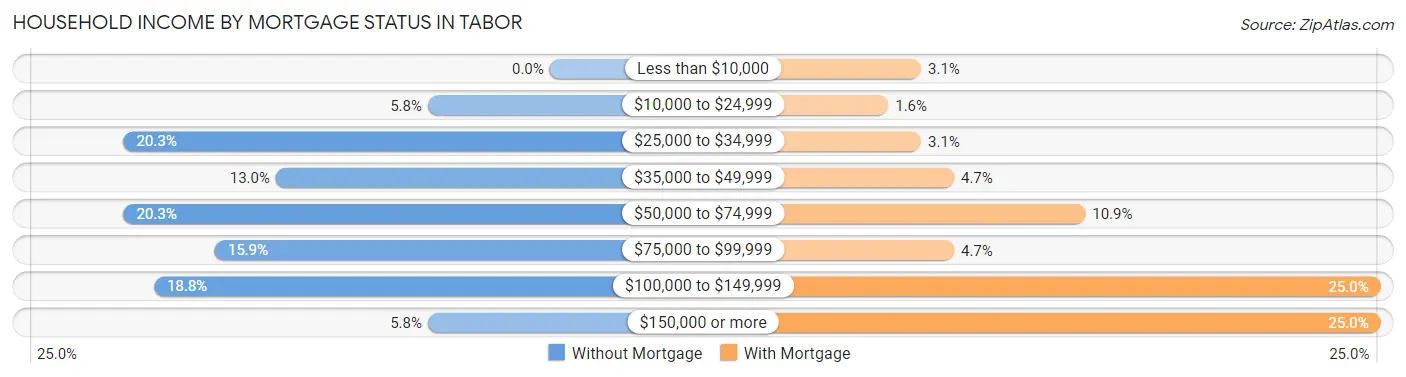
| Household Income | Without Mortgage | With Mortgage |
| Less than $10,000 | 0 (0.0%) | 2 (3.1%) |
| $10,000 to $24,999 | 4 (5.8%) | 1 (1.6%) |
| $25,000 to $34,999 | 14 (20.3%) | 2 (3.1%) |
| $35,000 to $49,999 | 9 (13.0%) | 3 (4.7%) |
| $50,000 to $74,999 | 14 (20.3%) | 7 (10.9%) |
| $75,000 to $99,999 | 11 (15.9%) | 3 (4.7%) |
| $100,000 to $149,999 | 13 (18.8%) | 16 (25.0%) |
| $150,000 or more | 4 (5.8%) | 16 (25.0%) |
| Total | 69 (100.0%) | 64 (100.0%) |
Property Value to Household Income Ratio in Tabor
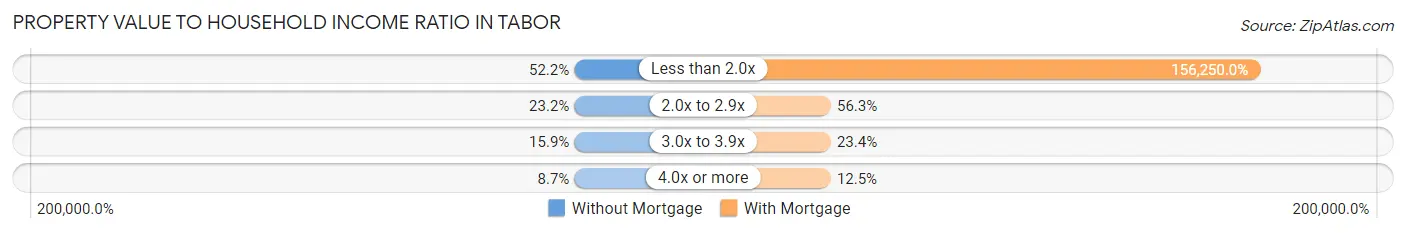
| Value-to-Income Ratio | Without Mortgage | With Mortgage |
| Less than 2.0x | 36 (52.2%) | 100,000 (156,250.0%) |
| 2.0x to 2.9x | 16 (23.2%) | 36 (56.2%) |
| 3.0x to 3.9x | 11 (15.9%) | 15 (23.4%) |
| 4.0x or more | 6 (8.7%) | 8 (12.5%) |
| Total | 69 (100.0%) | 64 (100.0%) |
Real Estate Taxes by Mortgage Status in Tabor
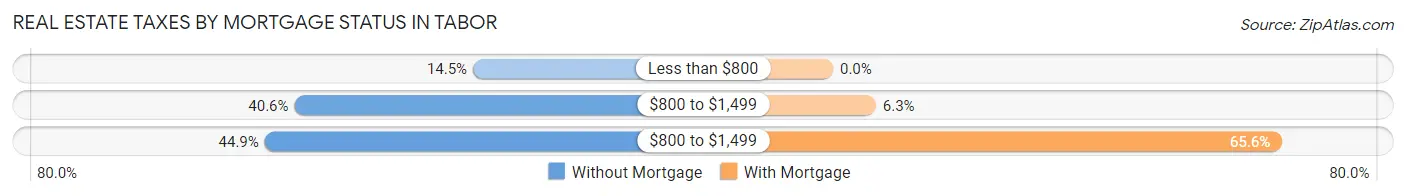
| Property Taxes | Without Mortgage | With Mortgage |
| Less than $800 | 10 (14.5%) | 0 (0.0%) |
| $800 to $1,499 | 28 (40.6%) | 4 (6.2%) |
| $800 to $1,499 | 31 (44.9%) | 42 (65.6%) |
| Total | 69 (100.0%) | 64 (100.0%) |
Health & Disability in Tabor
Health Insurance Coverage by Age in Tabor
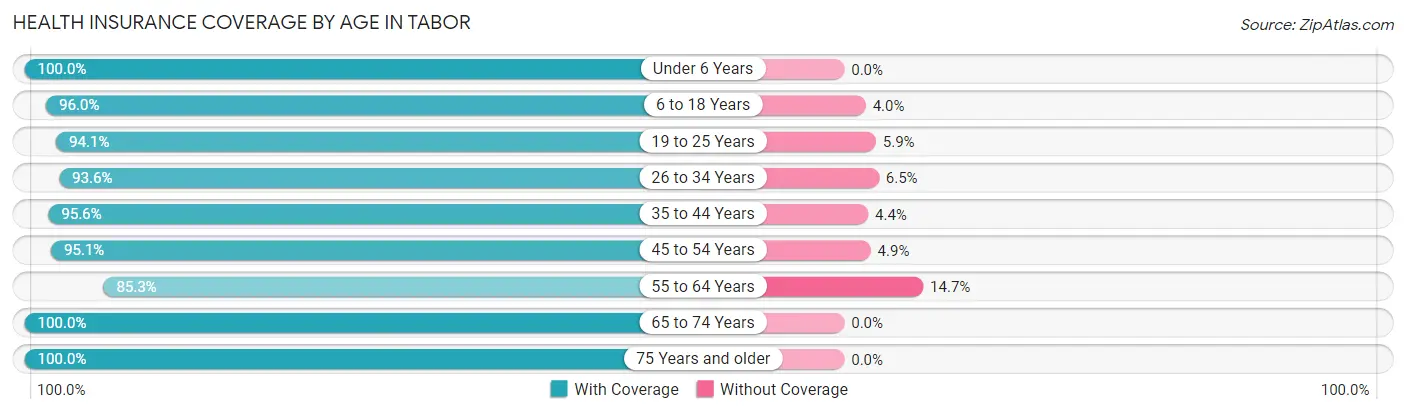
| Age Bracket | With Coverage | Without Coverage |
| Under 6 Years | 39 (100.0%) | 0 (0.0%) |
| 6 to 18 Years | 48 (96.0%) | 2 (4.0%) |
| 19 to 25 Years | 32 (94.1%) | 2 (5.9%) |
| 26 to 34 Years | 29 (93.5%) | 2 (6.5%) |
| 35 to 44 Years | 43 (95.6%) | 2 (4.4%) |
| 45 to 54 Years | 58 (95.1%) | 3 (4.9%) |
| 55 to 64 Years | 29 (85.3%) | 5 (14.7%) |
| 65 to 74 Years | 49 (100.0%) | 0 (0.0%) |
| 75 Years and older | 58 (100.0%) | 0 (0.0%) |
| Total | 385 (96.0%) | 16 (4.0%) |
Health Insurance Coverage by Citizenship Status in Tabor
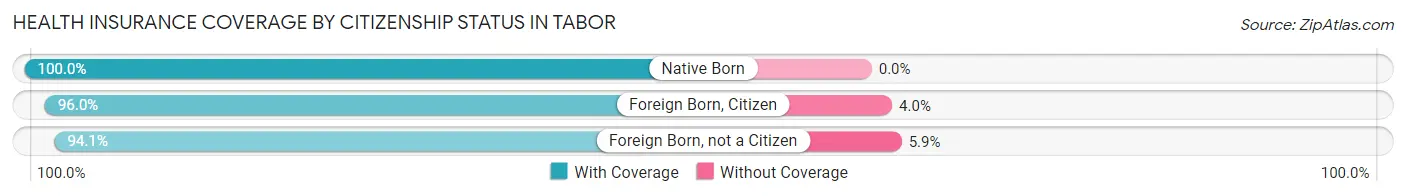
| Citizenship Status | With Coverage | Without Coverage |
| Native Born | 39 (100.0%) | 0 (0.0%) |
| Foreign Born, Citizen | 48 (96.0%) | 2 (4.0%) |
| Foreign Born, not a Citizen | 32 (94.1%) | 2 (5.9%) |
Health Insurance Coverage by Household Income in Tabor
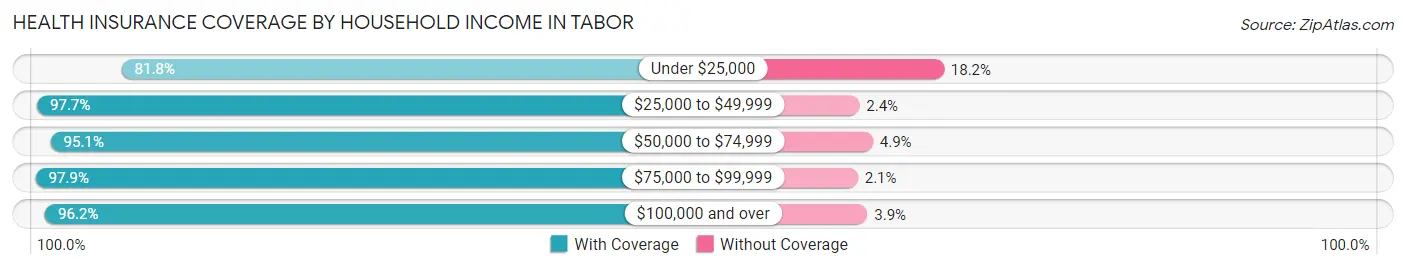
| Household Income | With Coverage | Without Coverage |
| Under $25,000 | 18 (81.8%) | 4 (18.2%) |
| $25,000 to $49,999 | 83 (97.7%) | 2 (2.4%) |
| $50,000 to $74,999 | 39 (95.1%) | 2 (4.9%) |
| $75,000 to $99,999 | 95 (97.9%) | 2 (2.1%) |
| $100,000 and over | 150 (96.2%) | 6 (3.8%) |
Public vs Private Health Insurance Coverage by Age in Tabor
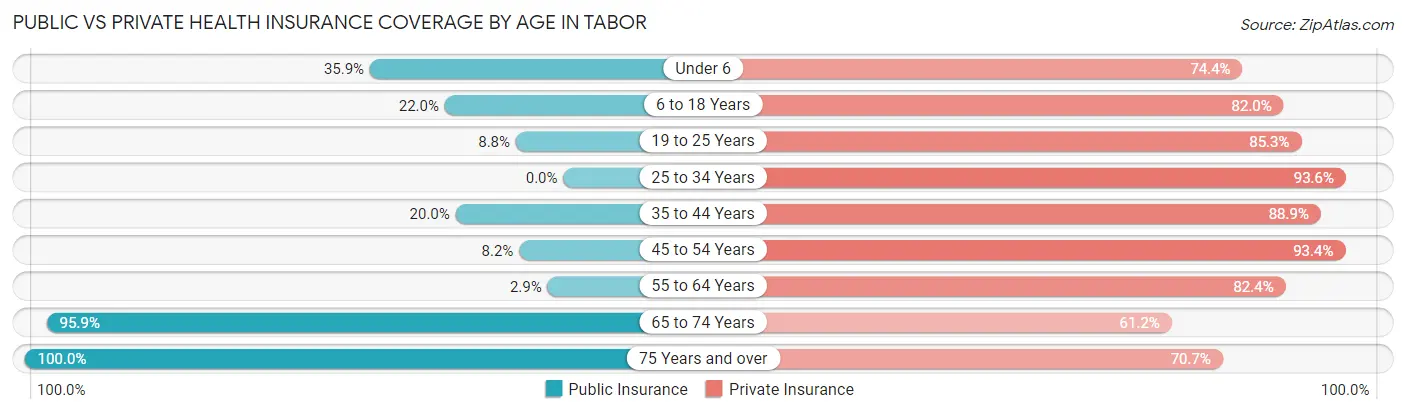
| Age Bracket | Public Insurance | Private Insurance |
| Under 6 | 14 (35.9%) | 29 (74.4%) |
| 6 to 18 Years | 11 (22.0%) | 41 (82.0%) |
| 19 to 25 Years | 3 (8.8%) | 29 (85.3%) |
| 25 to 34 Years | 0 (0.0%) | 29 (93.5%) |
| 35 to 44 Years | 9 (20.0%) | 40 (88.9%) |
| 45 to 54 Years | 5 (8.2%) | 57 (93.4%) |
| 55 to 64 Years | 1 (2.9%) | 28 (82.4%) |
| 65 to 74 Years | 47 (95.9%) | 30 (61.2%) |
| 75 Years and over | 58 (100.0%) | 41 (70.7%) |
| Total | 148 (36.9%) | 324 (80.8%) |
Disability Status by Sex by Age in Tabor
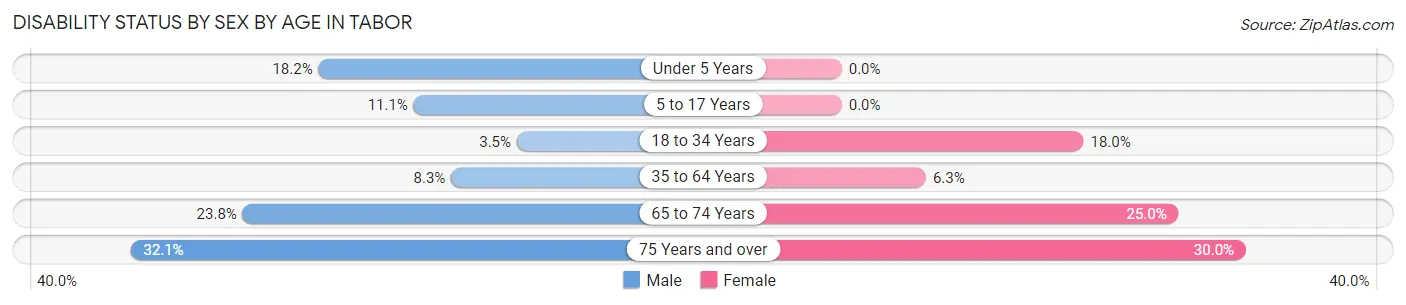
| Age Bracket | Male | Female |
| Under 5 Years | 2 (18.2%) | 0 (0.0%) |
| 5 to 17 Years | 2 (11.1%) | 0 (0.0%) |
| 18 to 34 Years | 1 (3.5%) | 7 (17.9%) |
| 35 to 64 Years | 5 (8.3%) | 5 (6.2%) |
| 65 to 74 Years | 5 (23.8%) | 7 (25.0%) |
| 75 Years and over | 9 (32.1%) | 9 (30.0%) |
Disability Class by Sex by Age in Tabor
Disability Class: Hearing Difficulty
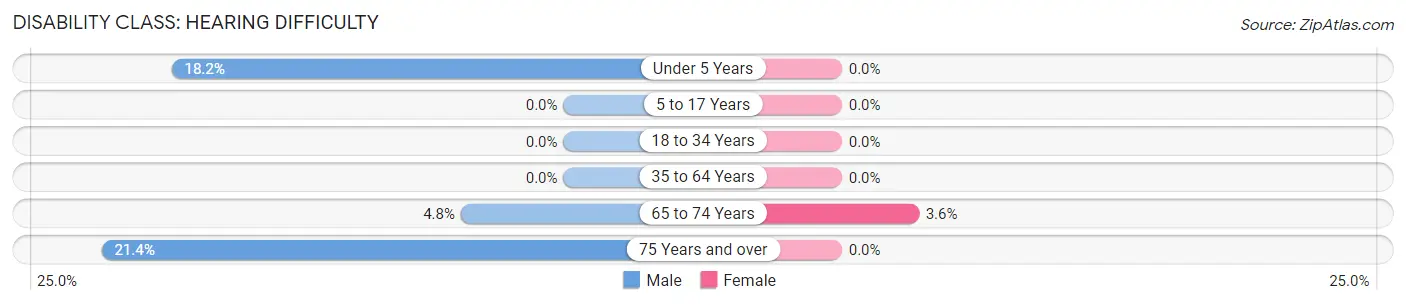
| Age Bracket | Male | Female |
| Under 5 Years | 2 (18.2%) | 0 (0.0%) |
| 5 to 17 Years | 0 (0.0%) | 0 (0.0%) |
| 18 to 34 Years | 0 (0.0%) | 0 (0.0%) |
| 35 to 64 Years | 0 (0.0%) | 0 (0.0%) |
| 65 to 74 Years | 1 (4.8%) | 1 (3.6%) |
| 75 Years and over | 6 (21.4%) | 0 (0.0%) |
Disability Class: Vision Difficulty
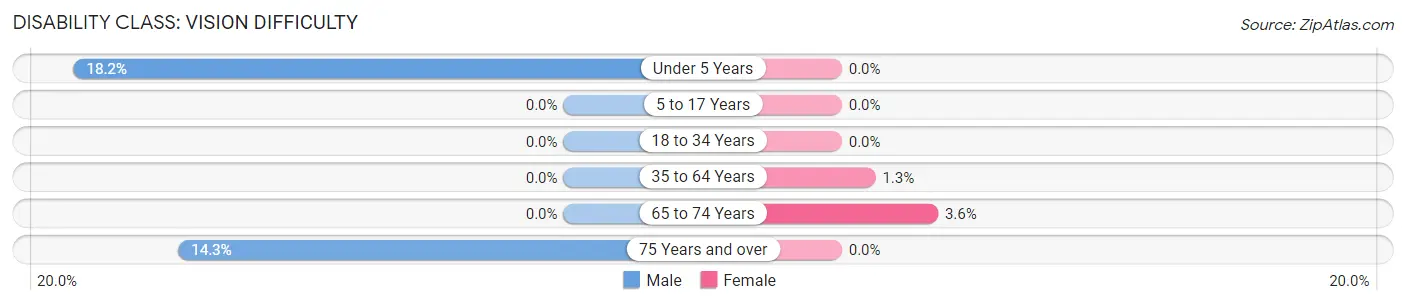
| Age Bracket | Male | Female |
| Under 5 Years | 2 (18.2%) | 0 (0.0%) |
| 5 to 17 Years | 0 (0.0%) | 0 (0.0%) |
| 18 to 34 Years | 0 (0.0%) | 0 (0.0%) |
| 35 to 64 Years | 0 (0.0%) | 1 (1.3%) |
| 65 to 74 Years | 0 (0.0%) | 1 (3.6%) |
| 75 Years and over | 4 (14.3%) | 0 (0.0%) |
Disability Class: Cognitive Difficulty
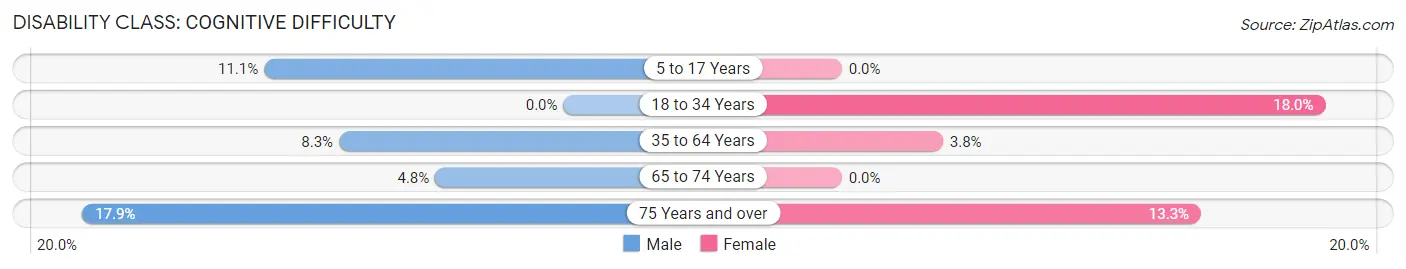
| Age Bracket | Male | Female |
| 5 to 17 Years | 2 (11.1%) | 0 (0.0%) |
| 18 to 34 Years | 0 (0.0%) | 7 (17.9%) |
| 35 to 64 Years | 5 (8.3%) | 3 (3.7%) |
| 65 to 74 Years | 1 (4.8%) | 0 (0.0%) |
| 75 Years and over | 5 (17.9%) | 4 (13.3%) |
Disability Class: Ambulatory Difficulty
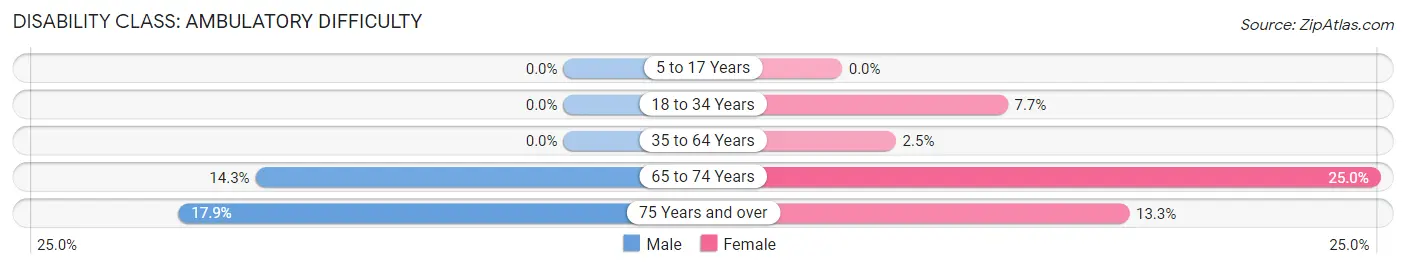
| Age Bracket | Male | Female |
| 5 to 17 Years | 0 (0.0%) | 0 (0.0%) |
| 18 to 34 Years | 0 (0.0%) | 3 (7.7%) |
| 35 to 64 Years | 0 (0.0%) | 2 (2.5%) |
| 65 to 74 Years | 3 (14.3%) | 7 (25.0%) |
| 75 Years and over | 5 (17.9%) | 4 (13.3%) |
Disability Class: Self-Care Difficulty
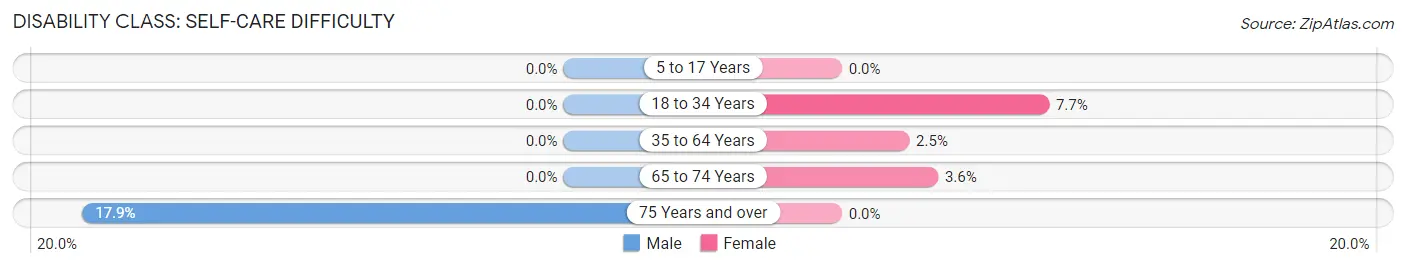
| Age Bracket | Male | Female |
| 5 to 17 Years | 0 (0.0%) | 0 (0.0%) |
| 18 to 34 Years | 0 (0.0%) | 3 (7.7%) |
| 35 to 64 Years | 0 (0.0%) | 2 (2.5%) |
| 65 to 74 Years | 0 (0.0%) | 1 (3.6%) |
| 75 Years and over | 5 (17.9%) | 0 (0.0%) |
Technology Access in Tabor
Computing Device Access in Tabor
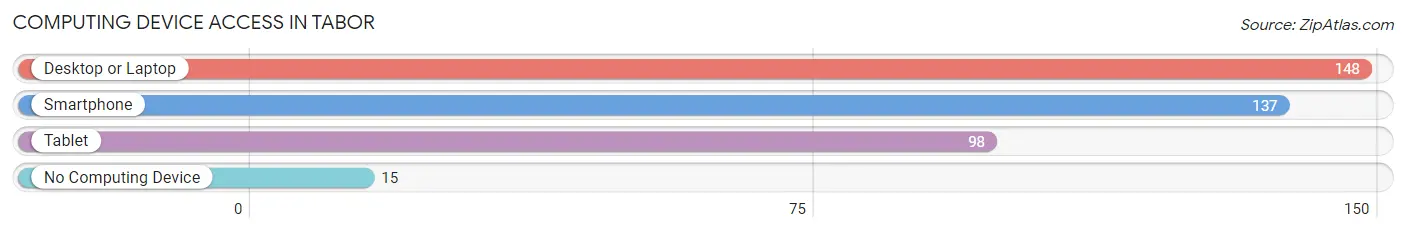
| Device Type | # Households | % Households |
| Desktop or Laptop | 148 | 82.7% |
| Smartphone | 137 | 76.5% |
| Tablet | 98 | 54.7% |
| No Computing Device | 15 | 8.4% |
| Total | 179 | 100.0% |
Internet Access in Tabor
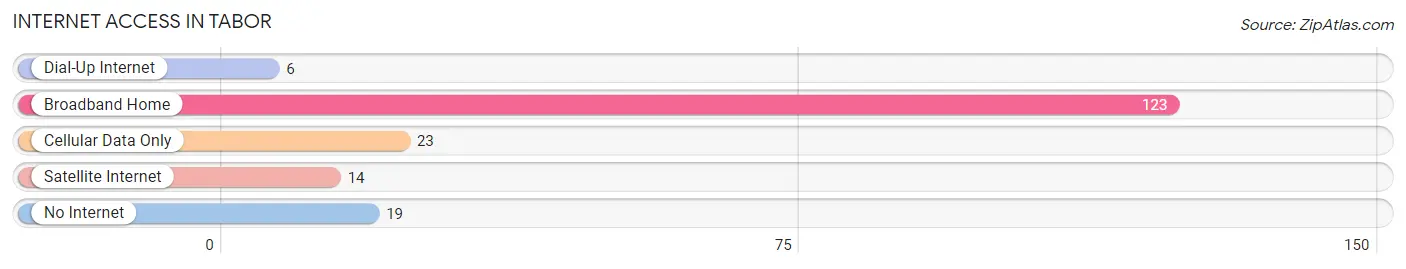
| Internet Type | # Households | % Households |
| Dial-Up Internet | 6 | 3.4% |
| Broadband Home | 123 | 68.7% |
| Cellular Data Only | 23 | 12.9% |
| Satellite Internet | 14 | 7.8% |
| No Internet | 19 | 10.6% |
| Total | 179 | 100.0% |
Tabor Summary
Tabor, South Dakota is a small town located in Bon Homme County in the southeastern corner of the state. It is situated on the Missouri River, just north of the Nebraska border. The town was founded in 1882 and has a population of approximately 500 people.
Tabor is located in the rolling hills of the Great Plains, and is surrounded by agricultural land. The town is home to a variety of businesses, including a grocery store, a hardware store, a bank, a post office, and a few restaurants. The town also has a public library, a fire station, and a police station.
The economy of Tabor is largely based on agriculture. The town is home to several farms, which produce a variety of crops, including corn, soybeans, wheat, and hay. The town also has a few small businesses, such as a gas station, a bar, and a few shops.
The demographics of Tabor are largely white, with a small percentage of African Americans and Native Americans. The median household income is approximately $35,000, and the median age is around 40 years old. The town has a high school, and the majority of the population is employed in the agricultural industry.
Tabor is a small town with a rich history. It was founded in 1882 by a group of settlers from Iowa, and the town was named after a local Native American chief. The town has seen its share of struggles, including a devastating flood in 1952 that destroyed much of the town. Despite this, the town has managed to remain a vibrant community, and it continues to be a popular destination for tourists and outdoor enthusiasts.
Tabor is a great place to live and visit. It is a small town with a big heart, and it offers a unique blend of rural charm and modern amenities. The town is home to a variety of businesses, and it is surrounded by beautiful scenery. The town is also home to a variety of recreational activities, including fishing, hunting, and camping. Tabor is a great place to call home, and it is a great place to visit.
Common Questions
What is Per Capita Income in Tabor?
Per Capita income in Tabor is $42,354.
What is the Median Family Income in Tabor?
Median Family Income in Tabor is $82,500.
What is the Median Household income in Tabor?
Median Household Income in Tabor is $76,250.
What is Income or Wage Gap in Tabor?
Income or Wage Gap in Tabor is 19.2%.
Women in Tabor earn 80.8 cents for every dollar earned by a man.
What is Inequality or Gini Index in Tabor?
Inequality or Gini Index in Tabor is 0.56.
What is the Total Population of Tabor?
Total Population of Tabor is 405.
What is the Total Male Population of Tabor?
Total Male Population of Tabor is 171.
What is the Total Female Population of Tabor?
Total Female Population of Tabor is 234.
What is the Ratio of Males per 100 Females in Tabor?
There are 73.08 Males per 100 Females in Tabor.
What is the Ratio of Females per 100 Males in Tabor?
There are 136.84 Females per 100 Males in Tabor.
What is the Median Population Age in Tabor?
Median Population Age in Tabor is 44.9 Years.
What is the Average Family Size in Tabor
Average Family Size in Tabor is 2.5 People.
What is the Average Household Size in Tabor
Average Household Size in Tabor is 2.3 People.
How Large is the Labor Force in Tabor?
There are 213 People in the Labor Forcein in Tabor.
What is the Percentage of People in the Labor Force in Tabor?
65.5% of People are in the Labor Force in Tabor.