Zip Codes with the Highest Percentage of Population Employed in Agriculture, Fishing & Hunting in Grants Pass, OR
RELATED REPORTS & OPTIONS
Agriculture, Fishing & Hunting
Grants Pass
Compare Zip Codes
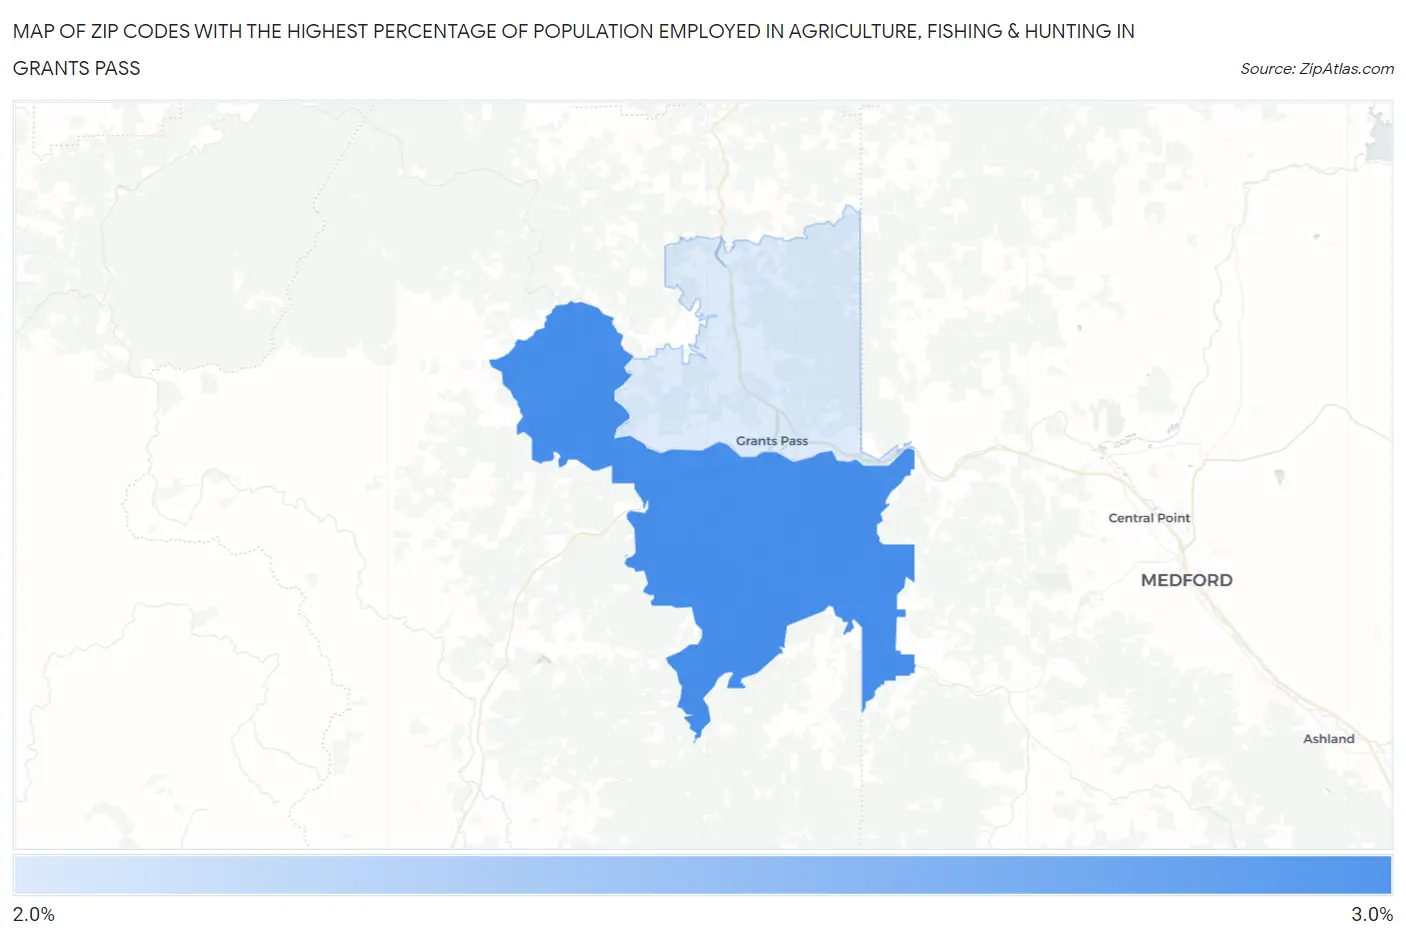
Map of Zip Codes with the Highest Percentage of Population Employed in Agriculture, Fishing & Hunting in Grants Pass
2.5%
2.6%
Zip Codes with the Highest Percentage of Population Employed in Agriculture, Fishing & Hunting in Grants Pass, OR
| Zip Code | % Employed | vs State | vs National | |
| 1. | 97527 | 2.6% | 2.7%(-0.124)#259 | 1.2%(+1.40)#11,358 |
| 2. | 97526 | 2.5% | 2.7%(-0.219)#266 | 1.2%(+1.31)#11,565 |
1
Common Questions
What are the Top Zip Codes with the Highest Percentage of Population Employed in Agriculture, Fishing & Hunting in Grants Pass, OR?
Top Zip Codes with the Highest Percentage of Population Employed in Agriculture, Fishing & Hunting in Grants Pass, OR are:
What zip code has the Highest Percentage of Population Employed in Agriculture, Fishing & Hunting in Grants Pass, OR?
97527 has the Highest Percentage of Population Employed in Agriculture, Fishing & Hunting in Grants Pass, OR with 2.6%.
What is the Percentage of Population Employed in Agriculture, Fishing & Hunting in Grants Pass, OR?
Percentage of Population Employed in Agriculture, Fishing & Hunting in Grants Pass is 1.4%.
What is the Percentage of Population Employed in Agriculture, Fishing & Hunting in Oregon?
Percentage of Population Employed in Agriculture, Fishing & Hunting in Oregon is 2.7%.
What is the Percentage of Population Employed in Agriculture, Fishing & Hunting in the United States?
Percentage of Population Employed in Agriculture, Fishing & Hunting in the United States is 1.2%.