Cayuse, OR Map & Demographics
Cayuse Map
Cayuse Overview
$25,928
PER CAPITA INCOME
$78,750
AVG FAMILY INCOME
$77,813
AVG HOUSEHOLD INCOME
3.4%
WAGE / INCOME GAP [ % ]
96.6¢/ $1
WAGE / INCOME GAP [ $ ]
0.37
INEQUALITY / GINI INDEX
58
TOTAL POPULATION
23
MALE POPULATION
35
FEMALE POPULATION
65.71
MALES / 100 FEMALES
152.17
FEMALES / 100 MALES
44.0
MEDIAN AGE
3.4
AVG FAMILY SIZE
3.0
AVG HOUSEHOLD SIZE
19
LABOR FORCE [ PEOPLE ]
41.3%
PERCENT IN LABOR FORCE
Cayuse Area Codes
Income in Cayuse
Income Overview in Cayuse
Per Capita Income in Cayuse is $25,928, while median incomes of families and households are $78,750 and $77,813 respectively.
| Characteristic | Number | Measure |
| Per Capita Income | 58 | $25,928 |
| Median Family Income | 16 | $78,750 |
| Mean Family Income | 16 | $84,331 |
| Median Household Income | 19 | $77,813 |
| Mean Household Income | 19 | $72,632 |
| Income Deficit | 16 | $0 |
| Wage / Income Gap (%) | 58 | 3.45% |
| Wage / Income Gap ($) | 58 | 96.55¢ per $1 |
| Gini / Inequality Index | 58 | 0.37 |
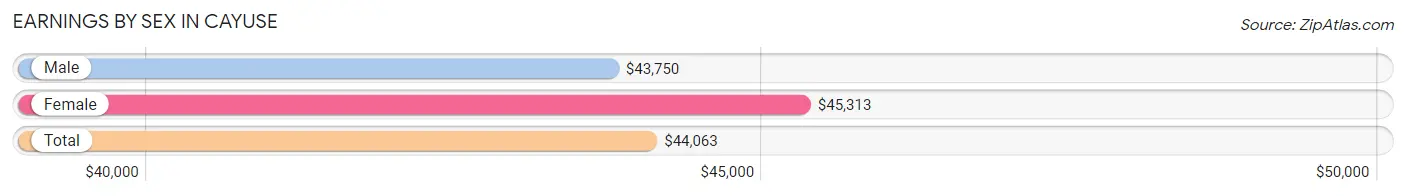
Earnings by Sex in Cayuse
Average Earnings in Cayuse are $44,063, $43,750 for men and $45,313 for women, a difference of 3.5%.
| Sex | Number | Average Earnings |
| Male | 12 (44.4%) | $43,750 |
| Female | 15 (55.6%) | $45,313 |
| Total | 27 (100.0%) | $44,063 |
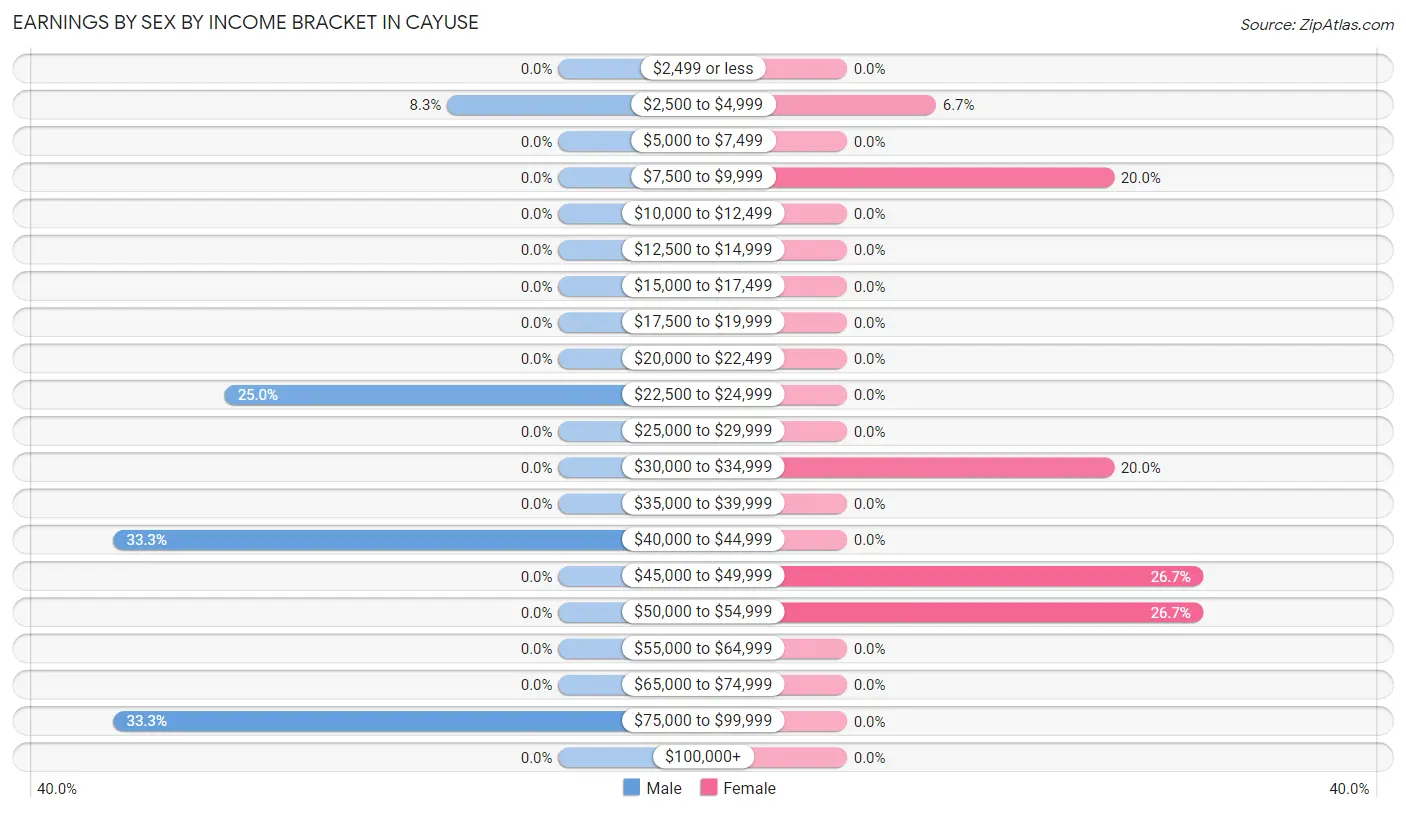
Earnings by Sex by Income Bracket in Cayuse
The most common earnings brackets in Cayuse are $40,000 to $44,999 for men (4 | 33.3%) and $45,000 to $49,999 for women (4 | 26.7%).
| Income | Male | Female |
| $2,499 or less | 0 (0.0%) | 0 (0.0%) |
| $2,500 to $4,999 | 1 (8.3%) | 1 (6.7%) |
| $5,000 to $7,499 | 0 (0.0%) | 0 (0.0%) |
| $7,500 to $9,999 | 0 (0.0%) | 3 (20.0%) |
| $10,000 to $12,499 | 0 (0.0%) | 0 (0.0%) |
| $12,500 to $14,999 | 0 (0.0%) | 0 (0.0%) |
| $15,000 to $17,499 | 0 (0.0%) | 0 (0.0%) |
| $17,500 to $19,999 | 0 (0.0%) | 0 (0.0%) |
| $20,000 to $22,499 | 0 (0.0%) | 0 (0.0%) |
| $22,500 to $24,999 | 3 (25.0%) | 0 (0.0%) |
| $25,000 to $29,999 | 0 (0.0%) | 0 (0.0%) |
| $30,000 to $34,999 | 0 (0.0%) | 3 (20.0%) |
| $35,000 to $39,999 | 0 (0.0%) | 0 (0.0%) |
| $40,000 to $44,999 | 4 (33.3%) | 0 (0.0%) |
| $45,000 to $49,999 | 0 (0.0%) | 4 (26.7%) |
| $50,000 to $54,999 | 0 (0.0%) | 4 (26.7%) |
| $55,000 to $64,999 | 0 (0.0%) | 0 (0.0%) |
| $65,000 to $74,999 | 0 (0.0%) | 0 (0.0%) |
| $75,000 to $99,999 | 4 (33.3%) | 0 (0.0%) |
| $100,000+ | 0 (0.0%) | 0 (0.0%) |
| Total | 12 (100.0%) | 15 (100.0%) |
Earnings by Sex by Educational Attainment in Cayuse
| Educational Attainment | Male Income | Female Income |
| Less than High School | - | - |
| High School Diploma | - | - |
| College or Associate's Degree | - | - |
| Bachelor's Degree | - | - |
| Graduate Degree | - | - |
| Total | - | - |
Family Income in Cayuse
Family Income Brackets in Cayuse
According to the Cayuse family income data, there are 5 families falling into the $100,000 to $149,999 income range, which is the most common income bracket and makes up 31.2% of all families.
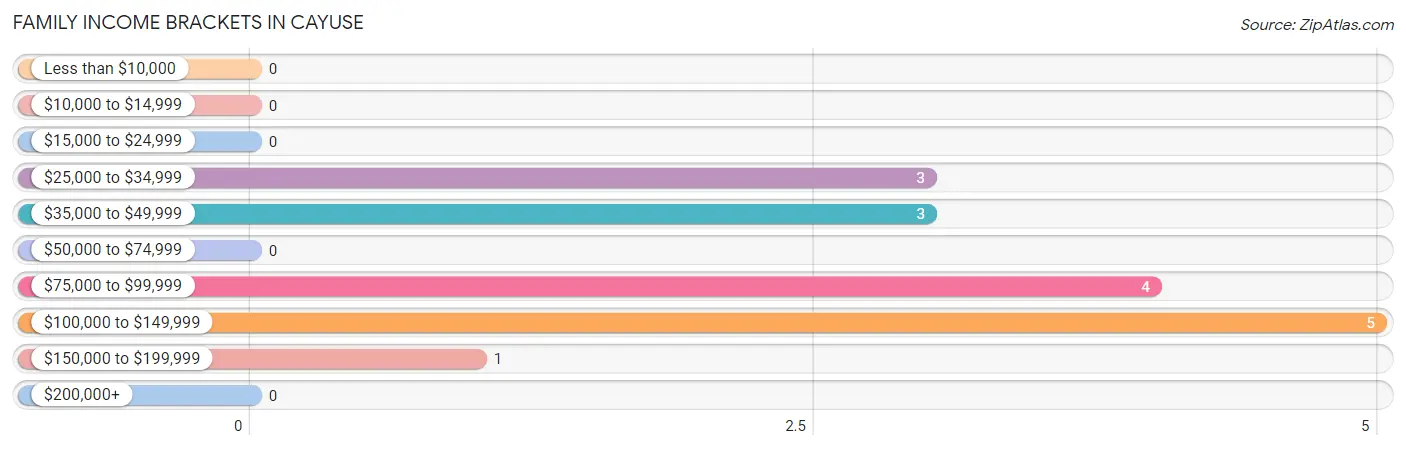
| Income Bracket | # Families | % Families |
| Less than $10,000 | 0 | 0.0% |
| $10,000 to $14,999 | 0 | 0.0% |
| $15,000 to $24,999 | 0 | 0.0% |
| $25,000 to $34,999 | 3 | 18.8% |
| $35,000 to $49,999 | 3 | 18.8% |
| $50,000 to $74,999 | 0 | 0.0% |
| $75,000 to $99,999 | 4 | 25.0% |
| $100,000 to $149,999 | 5 | 31.3% |
| $150,000 to $199,999 | 1 | 6.3% |
| $200,000+ | 0 | 0.0% |
Family Income by Famaliy Size in Cayuse
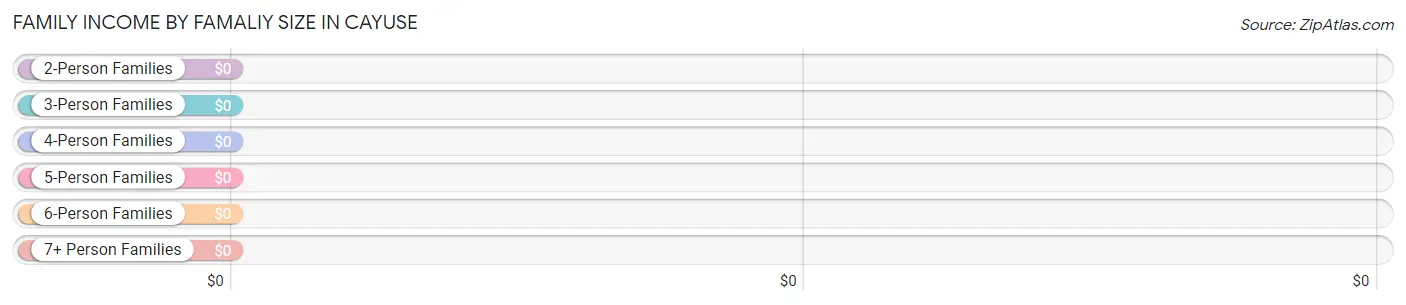
| Income Bracket | # Families | Median Income |
| 2-Person Families | 7 (43.8%) | $0 |
| 3-Person Families | 2 (12.5%) | $0 |
| 4-Person Families | 6 (37.5%) | $0 |
| 5-Person Families | 0 (0.0%) | $0 |
| 6-Person Families | 1 (6.2%) | $0 |
| 7+ Person Families | 0 (0.0%) | $0 |
| Total | 16 (100.0%) | $78,750 |
Family Income by Number of Earners in Cayuse
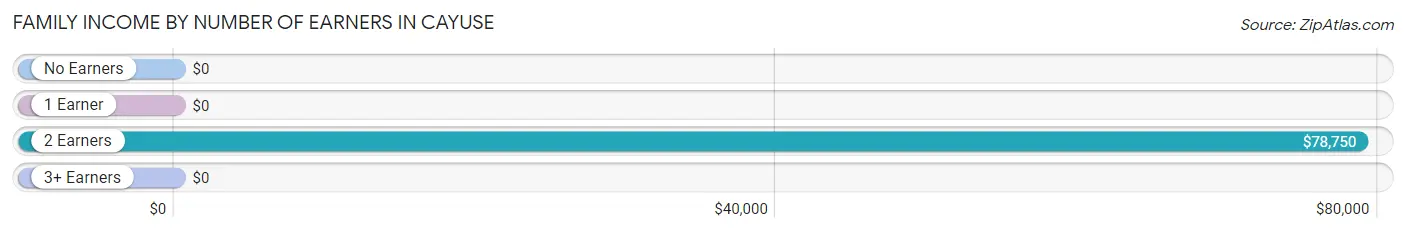
| Number of Earners | # Families | Median Income |
| No Earners | 3 (18.8%) | $0 |
| 1 Earner | 2 (12.5%) | $0 |
| 2 Earners | 10 (62.5%) | $78,750 |
| 3+ Earners | 1 (6.2%) | $0 |
| Total | 16 (100.0%) | $78,750 |
Household Income in Cayuse
Household Income Brackets in Cayuse
With 5 households falling in the category, the $100,000 to $149,999 income range is the most frequent in Cayuse, accounting for 26.3% of all households.
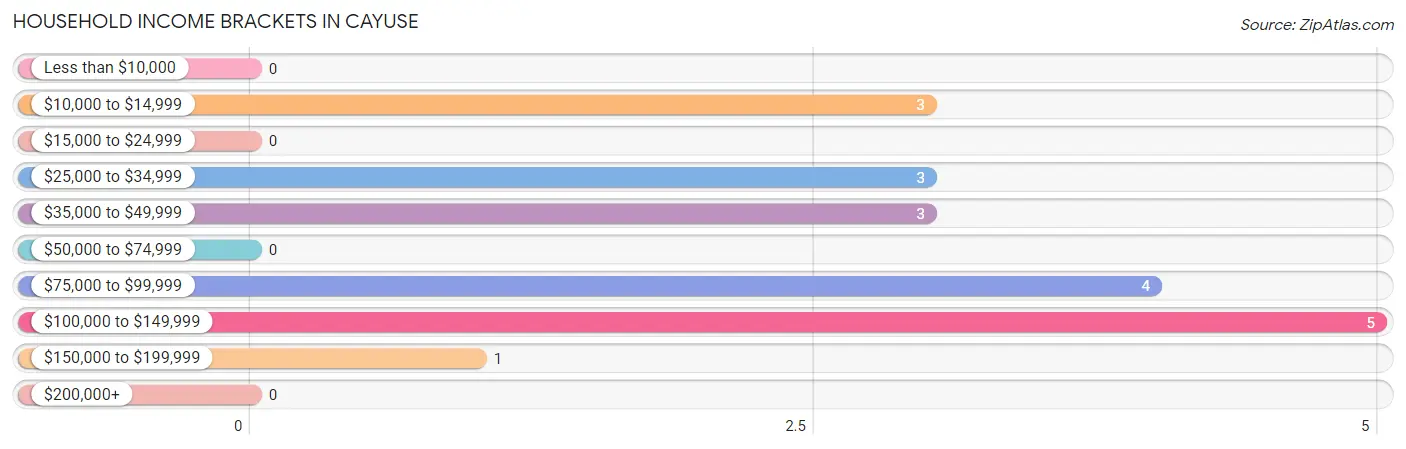
| Income Bracket | # Households | % Households |
| Less than $10,000 | 0 | 0.0% |
| $10,000 to $14,999 | 3 | 15.8% |
| $15,000 to $24,999 | 0 | 0.0% |
| $25,000 to $34,999 | 3 | 15.8% |
| $35,000 to $49,999 | 3 | 15.8% |
| $50,000 to $74,999 | 0 | 0.0% |
| $75,000 to $99,999 | 4 | 21.1% |
| $100,000 to $149,999 | 5 | 26.3% |
| $150,000 to $199,999 | 1 | 5.3% |
| $200,000+ | 0 | 0.0% |
Household Income by Householder Age in Cayuse
The median household income in Cayuse is $77,813, with the highest median household income of $78,438 found in the 65+ years age bracket for the primary householder. A total of 9 households (47.4%) fall into this category.
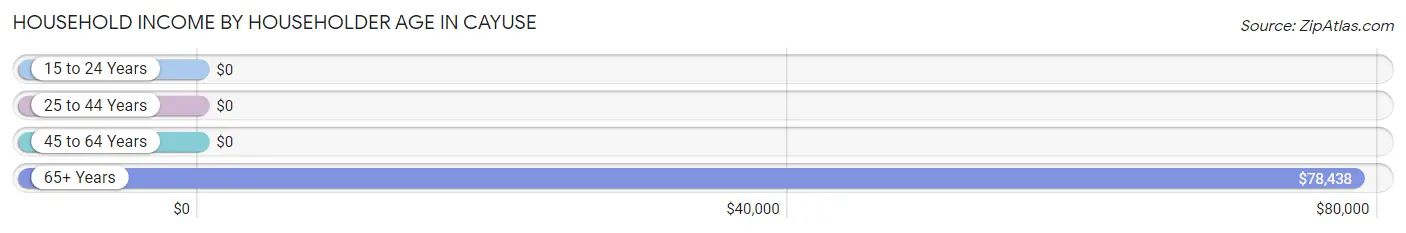
| Income Bracket | # Households | Median Income |
| 15 to 24 Years | 0 (0.0%) | $0 |
| 25 to 44 Years | 4 (21.0%) | $0 |
| 45 to 64 Years | 6 (31.6%) | $0 |
| 65+ Years | 9 (47.4%) | $78,438 |
| Total | 19 (100.0%) | $77,813 |
Poverty in Cayuse
Income Below Poverty by Sex and Age in Cayuse
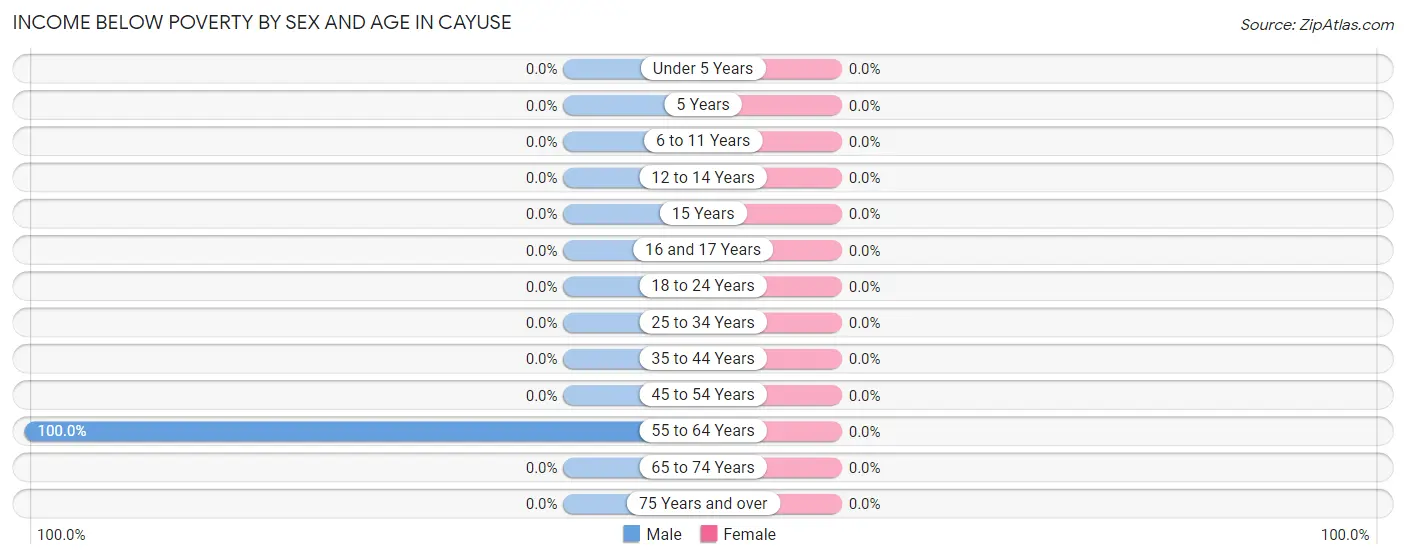
| Age Bracket | Male | Female |
| Under 5 Years | 0 (0.0%) | 0 (0.0%) |
| 5 Years | 0 (0.0%) | 0 (0.0%) |
| 6 to 11 Years | 0 (0.0%) | 0 (0.0%) |
| 12 to 14 Years | 0 (0.0%) | 0 (0.0%) |
| 15 Years | 0 (0.0%) | 0 (0.0%) |
| 16 and 17 Years | 0 (0.0%) | 0 (0.0%) |
| 18 to 24 Years | 0 (0.0%) | 0 (0.0%) |
| 25 to 34 Years | 0 (0.0%) | 0 (0.0%) |
| 35 to 44 Years | 0 (0.0%) | 0 (0.0%) |
| 45 to 54 Years | 0 (0.0%) | 0 (0.0%) |
| 55 to 64 Years | 3 (100.0%) | 0 (0.0%) |
| 65 to 74 Years | 0 (0.0%) | 0 (0.0%) |
| 75 Years and over | 0 (0.0%) | 0 (0.0%) |
| Total | 3 (13.0%) | 0 (0.0%) |
Income Above Poverty by Sex and Age in Cayuse
According to the poverty statistics in Cayuse, males aged 6 to 11 years and females aged under 5 years are the age groups that are most secure financially, with 100.0% of males and 100.0% of females in these age groups living above the poverty line.
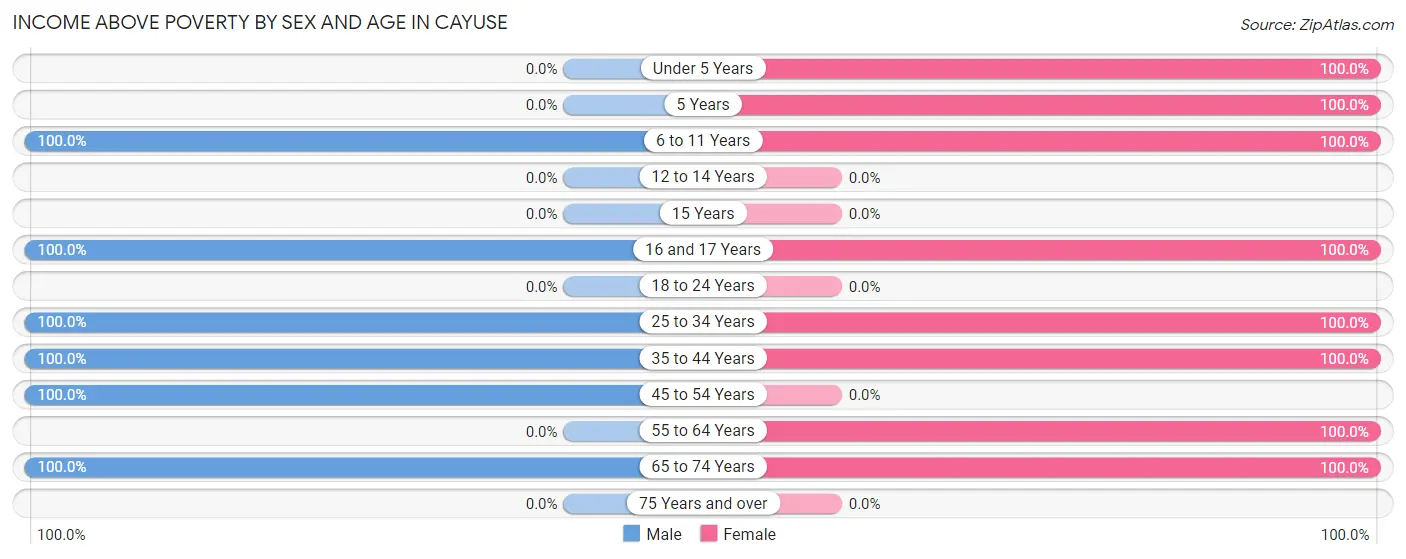
| Age Bracket | Male | Female |
| Under 5 Years | 0 (0.0%) | 2 (100.0%) |
| 5 Years | 0 (0.0%) | 2 (100.0%) |
| 6 to 11 Years | 3 (100.0%) | 5 (100.0%) |
| 12 to 14 Years | 0 (0.0%) | 0 (0.0%) |
| 15 Years | 0 (0.0%) | 0 (0.0%) |
| 16 and 17 Years | 1 (100.0%) | 1 (100.0%) |
| 18 to 24 Years | 0 (0.0%) | 0 (0.0%) |
| 25 to 34 Years | 3 (100.0%) | 10 (100.0%) |
| 35 to 44 Years | 1 (100.0%) | 1 (100.0%) |
| 45 to 54 Years | 3 (100.0%) | 0 (0.0%) |
| 55 to 64 Years | 0 (0.0%) | 3 (100.0%) |
| 65 to 74 Years | 9 (100.0%) | 11 (100.0%) |
| 75 Years and over | 0 (0.0%) | 0 (0.0%) |
| Total | 20 (87.0%) | 35 (100.0%) |
Income Below Poverty Among Married-Couple Families in Cayuse
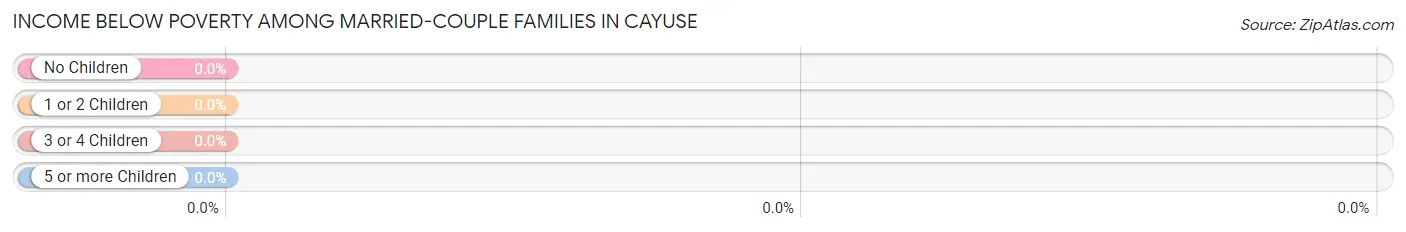
| Children | Above Poverty | Below Poverty |
| No Children | 9 (100.0%) | 0 (0.0%) |
| 1 or 2 Children | 6 (100.0%) | 0 (0.0%) |
| 3 or 4 Children | 1 (100.0%) | 0 (0.0%) |
| 5 or more Children | 0 (0.0%) | 0 (0.0%) |
| Total | 16 (100.0%) | 0 (0.0%) |
Income Below Poverty Among Single-Parent Households in Cayuse
| Children | Single Father | Single Mother |
| No Children | 0 (0.0%) | 0 (0.0%) |
| 1 or 2 Children | 0 (0.0%) | 0 (0.0%) |
| 3 or 4 Children | 0 (0.0%) | 0 (0.0%) |
| 5 or more Children | 0 (0.0%) | 0 (0.0%) |
| Total | 0 (0.0%) | 0 (0.0%) |
Income Below Poverty Among Married-Couple vs Single-Parent Households in Cayuse
| Children | Married-Couple Families | Single-Parent Households |
| No Children | 0 (0.0%) | 0 (0.0%) |
| 1 or 2 Children | 0 (0.0%) | 0 (0.0%) |
| 3 or 4 Children | 0 (0.0%) | 0 (0.0%) |
| 5 or more Children | 0 (0.0%) | 0 (0.0%) |
| Total | 0 (0.0%) | 0 (0.0%) |
Race in Cayuse
The most populous races in Cayuse are White / Caucasian (40 | 69.0%), Native / Alaskan (13 | 22.4%), and Two or more Races (5 | 8.6%).
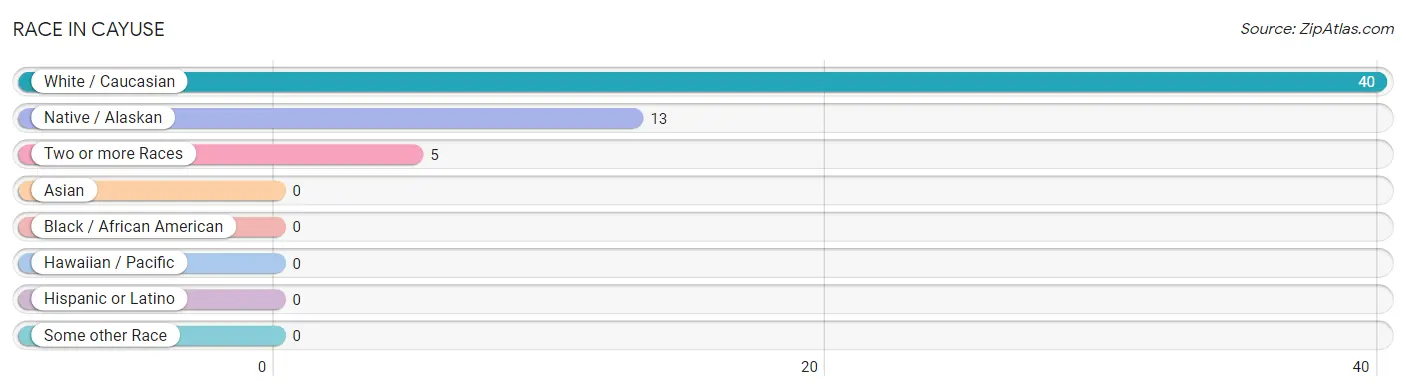
| Race | # Population | % Population |
| Asian | 0 | 0.0% |
| Black / African American | 0 | 0.0% |
| Hawaiian / Pacific | 0 | 0.0% |
| Hispanic or Latino | 0 | 0.0% |
| Native / Alaskan | 13 | 22.4% |
| White / Caucasian | 40 | 69.0% |
| Two or more Races | 5 | 8.6% |
| Some other Race | 0 | 0.0% |
| Total | 58 | 100.0% |
Ancestry in Cayuse
The most populous ancestries reported in Cayuse are German (15 | 25.9%), American (9 | 15.5%), Irish (6 | 10.3%), Norwegian (3 | 5.2%), and Scotch-Irish (3 | 5.2%), together accounting for 62.1% of all Cayuse residents.
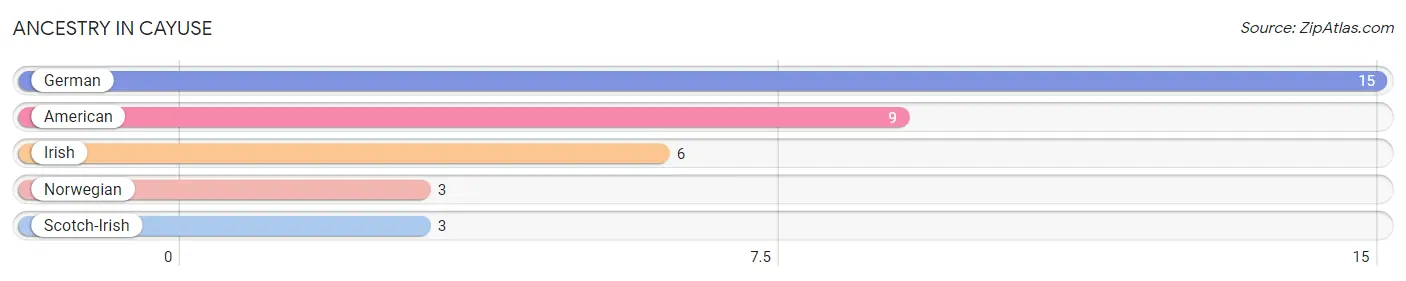
| Ancestry | # Population | % Population |
| American | 9 | 15.5% |
| German | 15 | 25.9% |
| Irish | 6 | 10.3% |
| Norwegian | 3 | 5.2% |
| Scotch-Irish | 3 | 5.2% | View All 5 Rows |
Immigrants in Cayuse

| Immigration Origin | # Population | % Population | View All 0 Rows |
Sex and Age in Cayuse
Sex and Age in Cayuse
The most populous age groups in Cayuse are 65 to 69 Years (9 | 39.1%) for men and 30 to 34 Years (10 | 28.6%) for women.
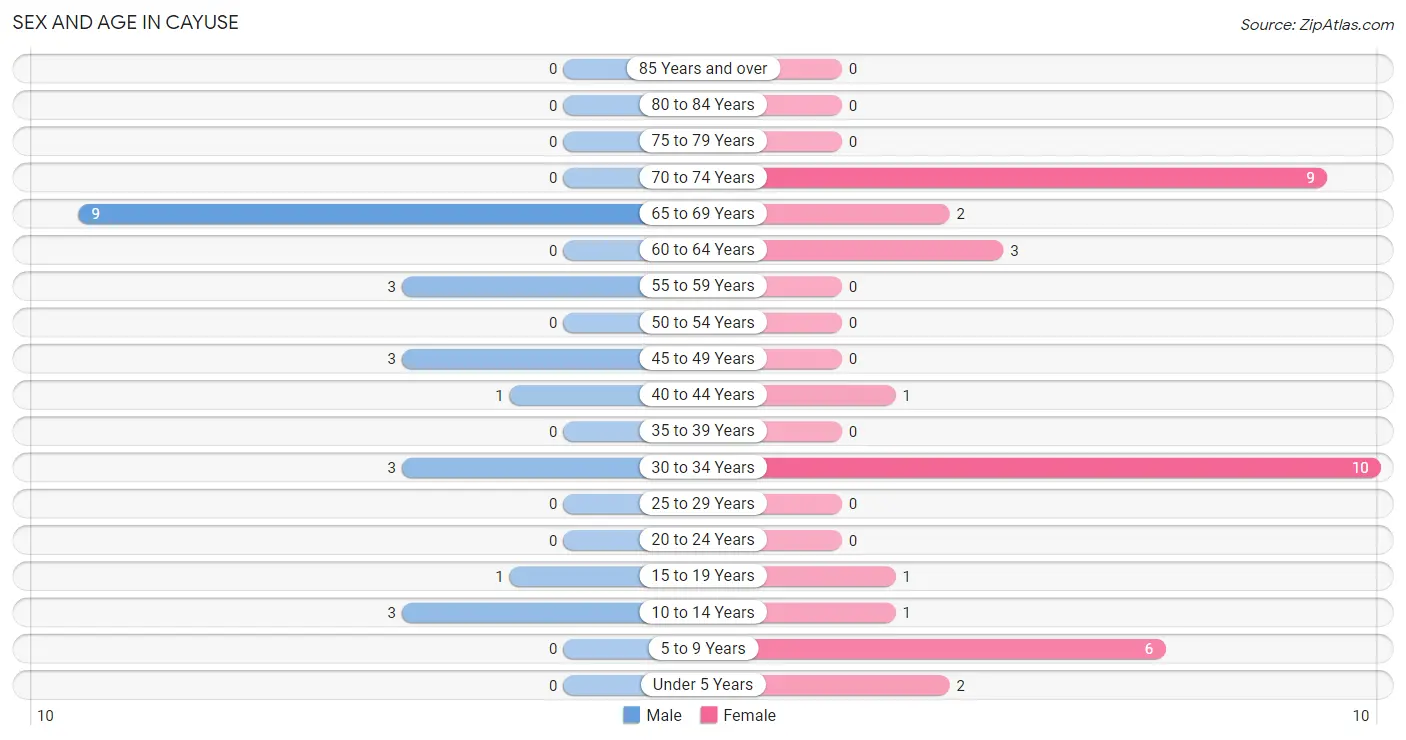
| Age Bracket | Male | Female |
| Under 5 Years | 0 (0.0%) | 2 (5.7%) |
| 5 to 9 Years | 0 (0.0%) | 6 (17.1%) |
| 10 to 14 Years | 3 (13.0%) | 1 (2.9%) |
| 15 to 19 Years | 1 (4.3%) | 1 (2.9%) |
| 20 to 24 Years | 0 (0.0%) | 0 (0.0%) |
| 25 to 29 Years | 0 (0.0%) | 0 (0.0%) |
| 30 to 34 Years | 3 (13.0%) | 10 (28.6%) |
| 35 to 39 Years | 0 (0.0%) | 0 (0.0%) |
| 40 to 44 Years | 1 (4.3%) | 1 (2.9%) |
| 45 to 49 Years | 3 (13.0%) | 0 (0.0%) |
| 50 to 54 Years | 0 (0.0%) | 0 (0.0%) |
| 55 to 59 Years | 3 (13.0%) | 0 (0.0%) |
| 60 to 64 Years | 0 (0.0%) | 3 (8.6%) |
| 65 to 69 Years | 9 (39.1%) | 2 (5.7%) |
| 70 to 74 Years | 0 (0.0%) | 9 (25.7%) |
| 75 to 79 Years | 0 (0.0%) | 0 (0.0%) |
| 80 to 84 Years | 0 (0.0%) | 0 (0.0%) |
| 85 Years and over | 0 (0.0%) | 0 (0.0%) |
| Total | 23 (100.0%) | 35 (100.0%) |
Families and Households in Cayuse
Median Family Size in Cayuse
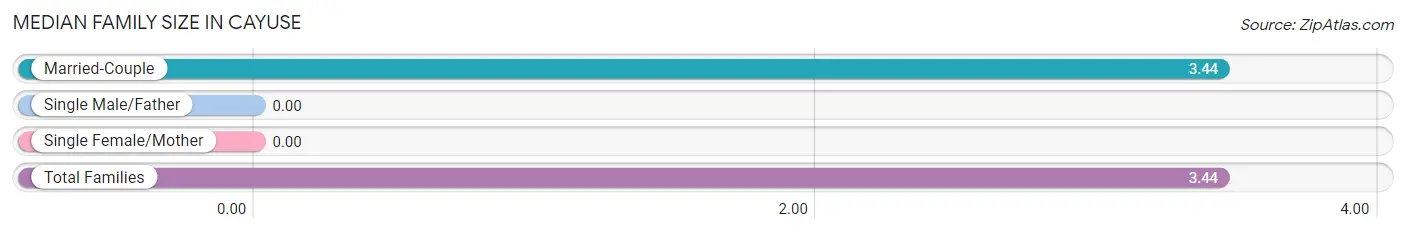
| Family Type | # Families | Family Size |
| Married-Couple | 16 (100.0%) | 3.44 |
| Single Male/Father | 0 (0.0%) | - |
| Single Female/Mother | 0 (0.0%) | - |
| Total Families | 16 (100.0%) | 3.44 |
Median Household Size in Cayuse
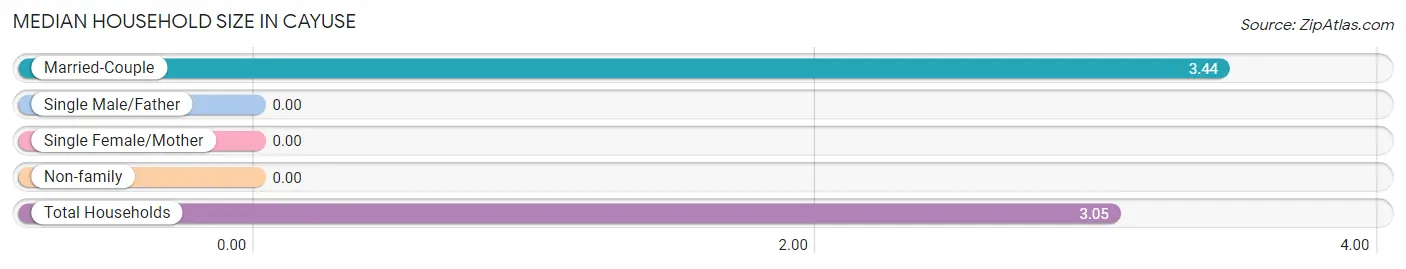
| Household Type | # Households | Household Size |
| Married-Couple | 16 (84.2%) | 3.44 |
| Single Male/Father | 0 (0.0%) | - |
| Single Female/Mother | 0 (0.0%) | - |
| Non-family | 3 (15.8%) | - |
| Total Households | 19 (100.0%) | 3.05 |
Household Size by Marriage Status in Cayuse
Out of a total of 19 households in Cayuse, 16 (84.2%) are family households, while 3 (15.8%) are nonfamily households. The most numerous type of family households are 2-person households, comprising 7, and the most common type of nonfamily households are 1-person households, comprising 3.
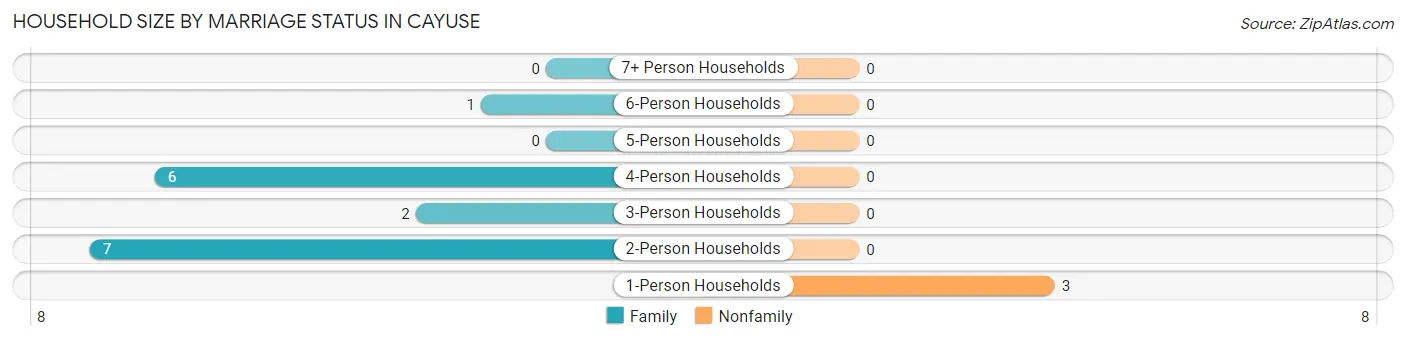
| Household Size | Family Households | Nonfamily Households |
| 1-Person Households | - | 3 (15.8%) |
| 2-Person Households | 7 (36.8%) | 0 (0.0%) |
| 3-Person Households | 2 (10.5%) | 0 (0.0%) |
| 4-Person Households | 6 (31.6%) | 0 (0.0%) |
| 5-Person Households | 0 (0.0%) | 0 (0.0%) |
| 6-Person Households | 1 (5.3%) | 0 (0.0%) |
| 7+ Person Households | 0 (0.0%) | 0 (0.0%) |
| Total | 16 (84.2%) | 3 (15.8%) |
Female Fertility in Cayuse
Fertility by Age in Cayuse
| Age Bracket | Women with Births | Births / 1,000 Women |
| 15 to 19 years | 0 (0.0%) | 0.0 |
| 20 to 34 years | 0 (0.0%) | 0.0 |
| 35 to 50 years | 0 (0.0%) | 0.0 |
| Total | 0 (0.0%) | 0.0 |
Fertility by Age by Marriage Status in Cayuse
| Age Bracket | Married | Unmarried |
| 15 to 19 years | 0 (0.0%) | 0 (0.0%) |
| 20 to 34 years | 0 (0.0%) | 0 (0.0%) |
| 35 to 50 years | 0 (0.0%) | 0 (0.0%) |
| Total | 0 (0.0%) | 0 (0.0%) |
Fertility by Education in Cayuse
| Educational Attainment | Women with Births | Births / 1,000 Women |
| Less than High School | 0 (0.0%) | 0.0 |
| High School Diploma | 0 (0.0%) | 0.0 |
| College or Associate's Degree | 0 (0.0%) | 0.0 |
| Bachelor's Degree | 0 (0.0%) | 0.0 |
| Graduate Degree | 0 (0.0%) | 0.0 |
| Total | 0 (0.0%) | 0.0 |
Fertility by Education by Marriage Status in Cayuse
| Educational Attainment | Married | Unmarried |
| Less than High School | 0 (0.0%) | 0 (0.0%) |
| High School Diploma | 0 (0.0%) | 0 (0.0%) |
| College or Associate's Degree | 0 (0.0%) | 0 (0.0%) |
| Bachelor's Degree | 0 (0.0%) | 0 (0.0%) |
| Graduate Degree | 0 (0.0%) | 0 (0.0%) |
| Total | 0 (0.0%) | 0 (0.0%) |
Employment Characteristics in Cayuse
Employment by Class of Employer in Cayuse
Among the 19 employed individuals in Cayuse, self-employed (not incorporated) (7 | 36.8%), private company employees (6 | 31.6%), and not-for-profit organizations (4 | 21.0%) make up the most common classes of employment.
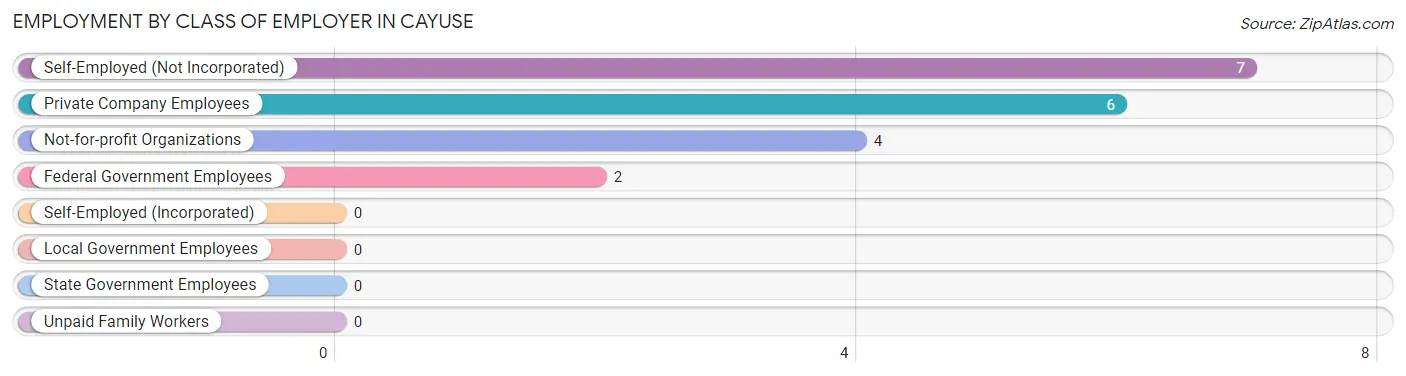
| Employer Class | # Employees | % Employees |
| Private Company Employees | 6 | 31.6% |
| Self-Employed (Incorporated) | 0 | 0.0% |
| Self-Employed (Not Incorporated) | 7 | 36.8% |
| Not-for-profit Organizations | 4 | 21.0% |
| Local Government Employees | 0 | 0.0% |
| State Government Employees | 0 | 0.0% |
| Federal Government Employees | 2 | 10.5% |
| Unpaid Family Workers | 0 | 0.0% |
| Total | 19 | 100.0% |
Employment Status by Age in Cayuse
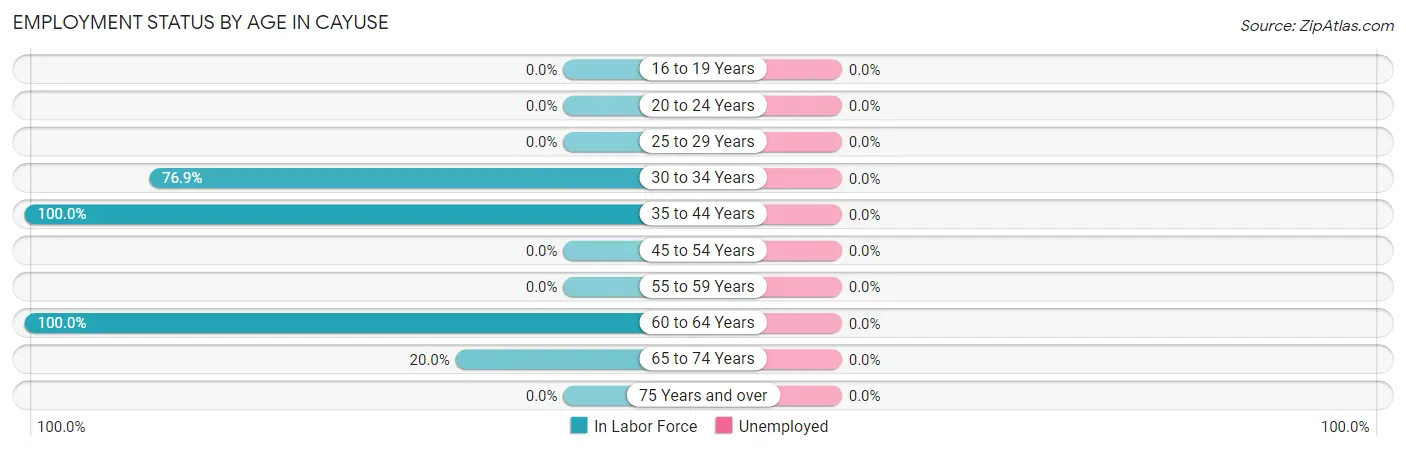
| Age Bracket | In Labor Force | Unemployed |
| 16 to 19 Years | 0 (0.0%) | 0 (0.0%) |
| 20 to 24 Years | 0 (0.0%) | 0 (0.0%) |
| 25 to 29 Years | 0 (0.0%) | 0 (0.0%) |
| 30 to 34 Years | 10 (76.9%) | 0 (0.0%) |
| 35 to 44 Years | 2 (100.0%) | 0 (0.0%) |
| 45 to 54 Years | 0 (0.0%) | 0 (0.0%) |
| 55 to 59 Years | 0 (0.0%) | 0 (0.0%) |
| 60 to 64 Years | 3 (100.0%) | 0 (0.0%) |
| 65 to 74 Years | 4 (20.0%) | 0 (0.0%) |
| 75 Years and over | 0 (0.0%) | 0 (0.0%) |
| Total | 19 (41.3%) | 0 (0.0%) |
Employment Status by Educational Attainment in Cayuse
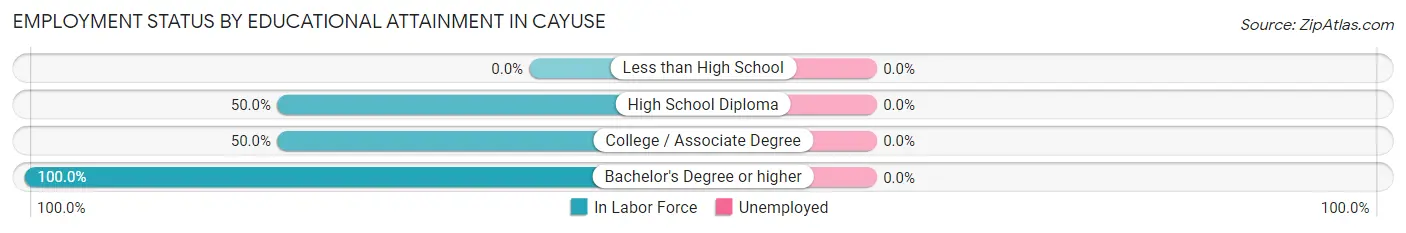
| Educational Attainment | In Labor Force | Unemployed |
| Less than High School | 0 (0.0%) | 0 (0.0%) |
| High School Diploma | 6 (50.0%) | 0 (0.0%) |
| College / Associate Degree | 3 (50.0%) | 0 (0.0%) |
| Bachelor's Degree or higher | 6 (100.0%) | 0 (0.0%) |
| Total | 15 (62.5%) | 0 (0.0%) |
Employment Occupations by Sex in Cayuse
Management, Business, Science and Arts Occupations
The most common Management, Business, Science and Arts occupations in Cayuse are Management (3 | 15.8%), Community & Social Service (2 | 10.5%), Education, Arts & Media (1 | 5.3%), and Education Instruction & Library (1 | 5.3%).
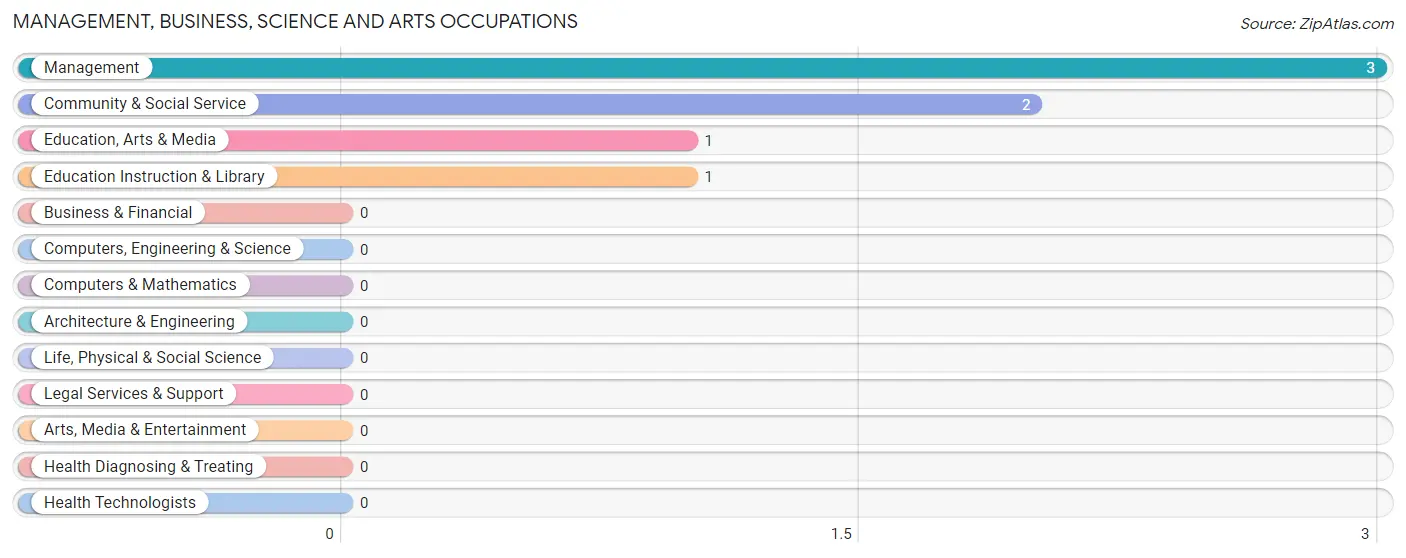
Management, Business, Science and Arts Occupations by Sex
Within the Management, Business, Science and Arts occupations in Cayuse, the most male-oriented occupations are Education, Arts & Media (100.0%), and Community & Social Service (50.0%), while the most female-oriented occupations are Management (100.0%), Education Instruction & Library (100.0%), and Community & Social Service (50.0%).
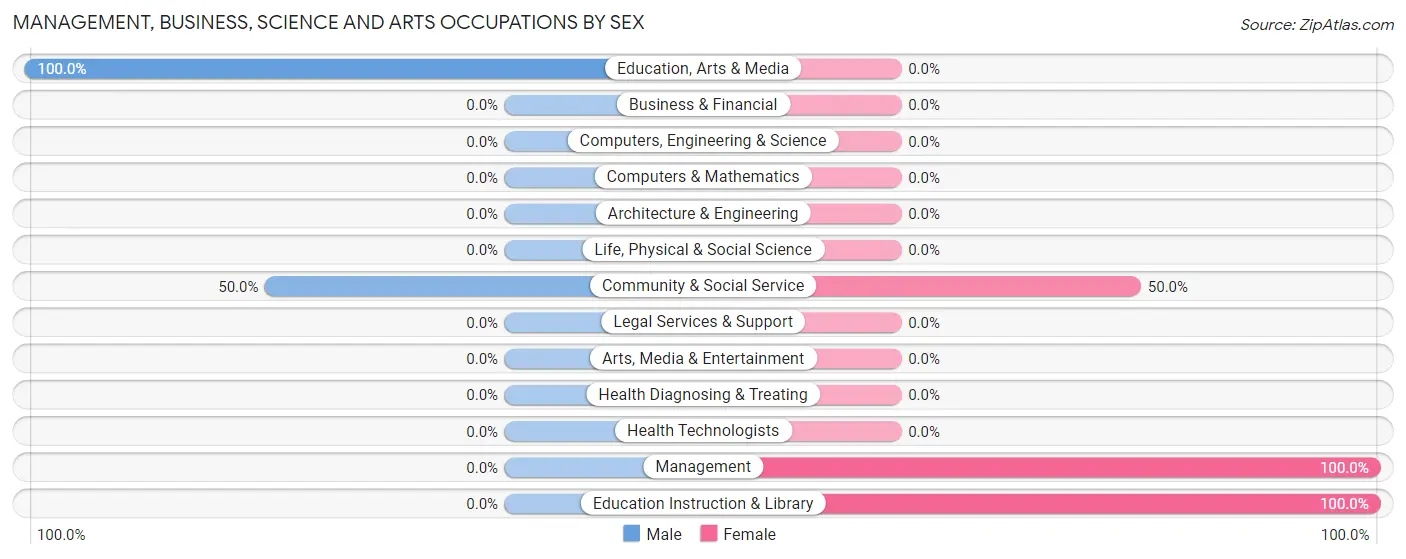
| Occupation | Male | Female |
| Management | 0 (0.0%) | 3 (100.0%) |
| Business & Financial | 0 (0.0%) | 0 (0.0%) |
| Computers, Engineering & Science | 0 (0.0%) | 0 (0.0%) |
| Computers & Mathematics | 0 (0.0%) | 0 (0.0%) |
| Architecture & Engineering | 0 (0.0%) | 0 (0.0%) |
| Life, Physical & Social Science | 0 (0.0%) | 0 (0.0%) |
| Community & Social Service | 1 (50.0%) | 1 (50.0%) |
| Education, Arts & Media | 1 (100.0%) | 0 (0.0%) |
| Legal Services & Support | 0 (0.0%) | 0 (0.0%) |
| Education Instruction & Library | 0 (0.0%) | 1 (100.0%) |
| Arts, Media & Entertainment | 0 (0.0%) | 0 (0.0%) |
| Health Diagnosing & Treating | 0 (0.0%) | 0 (0.0%) |
| Health Technologists | 0 (0.0%) | 0 (0.0%) |
| Total (Category) | 1 (20.0%) | 4 (80.0%) |
| Total (Overall) | 8 (42.1%) | 11 (57.9%) |
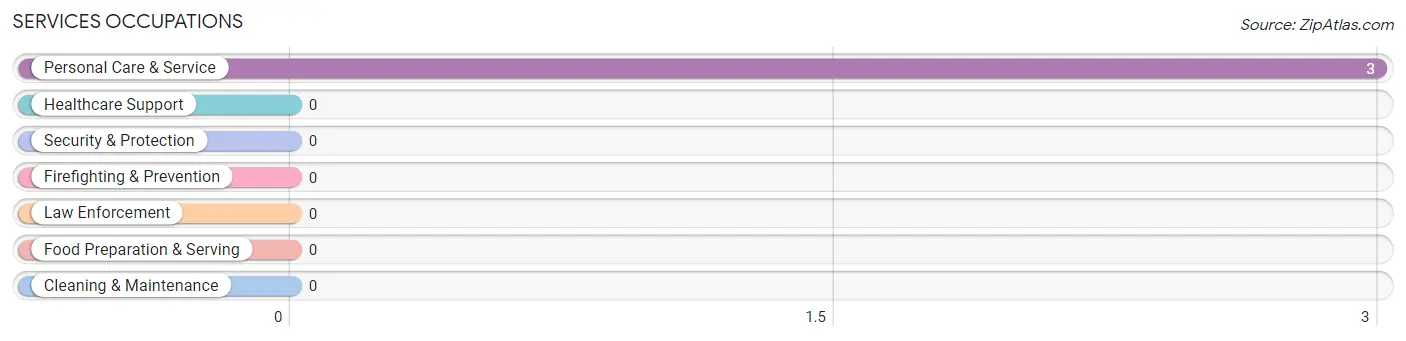
Services Occupations
The most common Services occupations in Cayuse are , and Personal Care & Service (3 | 15.8%).
Services Occupations by Sex
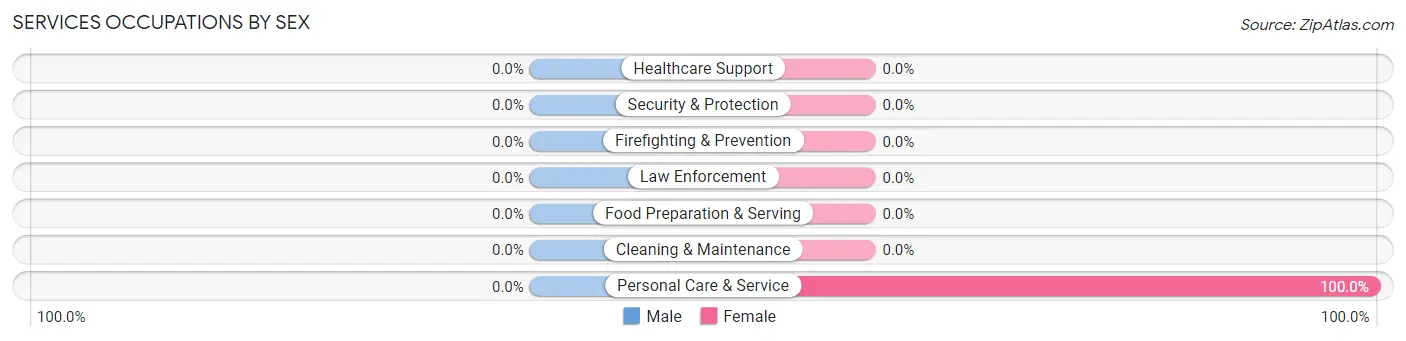
| Occupation | Male | Female |
| Healthcare Support | 0 (0.0%) | 0 (0.0%) |
| Security & Protection | 0 (0.0%) | 0 (0.0%) |
| Firefighting & Prevention | 0 (0.0%) | 0 (0.0%) |
| Law Enforcement | 0 (0.0%) | 0 (0.0%) |
| Food Preparation & Serving | 0 (0.0%) | 0 (0.0%) |
| Cleaning & Maintenance | 0 (0.0%) | 0 (0.0%) |
| Personal Care & Service | 0 (0.0%) | 3 (100.0%) |
| Total (Category) | 0 (0.0%) | 3 (100.0%) |
| Total (Overall) | 8 (42.1%) | 11 (57.9%) |
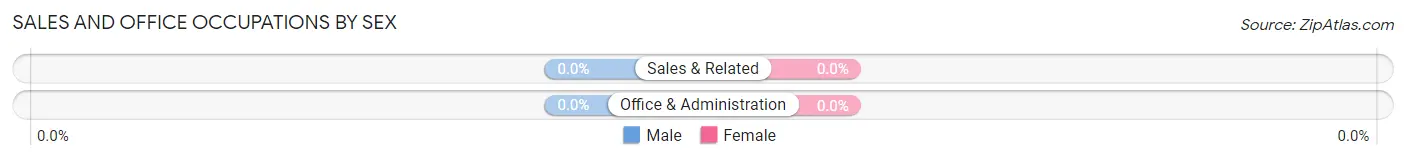
Sales and Office Occupations

Sales and Office Occupations by Sex
| Occupation | Male | Female |
| Sales & Related | 0 (0.0%) | 0 (0.0%) |
| Office & Administration | 0 (0.0%) | 0 (0.0%) |
| Total (Category) | 0 (0.0%) | 0 (0.0%) |
| Total (Overall) | 8 (42.1%) | 11 (57.9%) |
Natural Resources, Construction and Maintenance Occupations
The most common Natural Resources, Construction and Maintenance occupations in Cayuse are Farming, Fishing & Forestry (4 | 21.0%), and Construction & Extraction (4 | 21.0%).
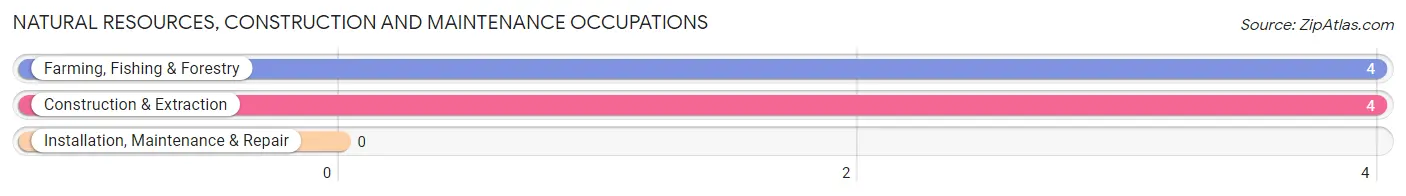
Natural Resources, Construction and Maintenance Occupations by Sex
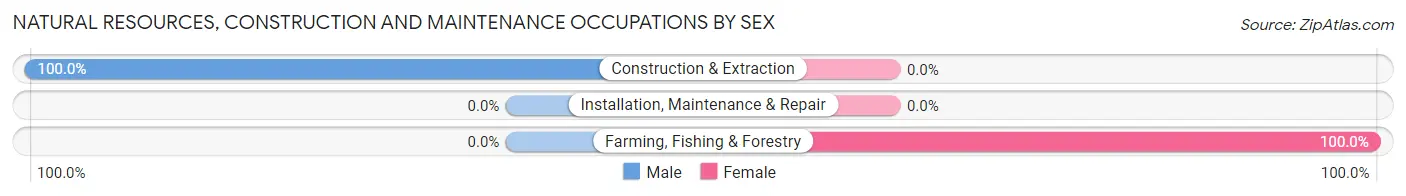
| Occupation | Male | Female |
| Farming, Fishing & Forestry | 0 (0.0%) | 4 (100.0%) |
| Construction & Extraction | 4 (100.0%) | 0 (0.0%) |
| Installation, Maintenance & Repair | 0 (0.0%) | 0 (0.0%) |
| Total (Category) | 4 (50.0%) | 4 (50.0%) |
| Total (Overall) | 8 (42.1%) | 11 (57.9%) |
Production, Transportation and Moving Occupations
The most common Production, Transportation and Moving occupations in Cayuse are , and Production (3 | 15.8%).
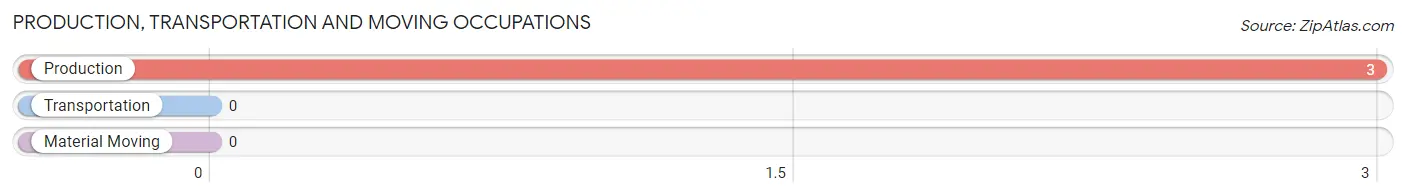
Production, Transportation and Moving Occupations by Sex
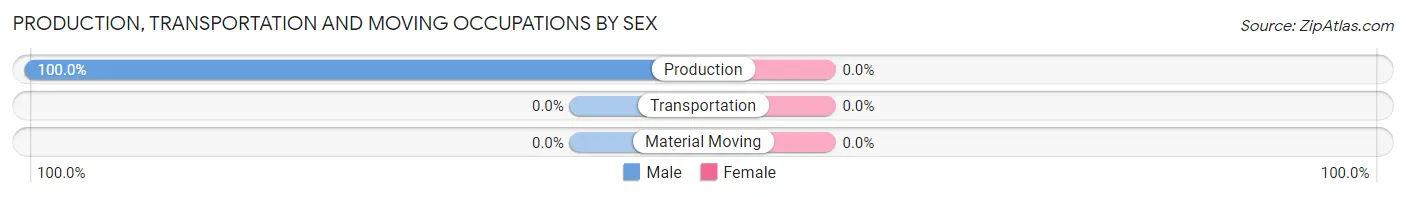
| Occupation | Male | Female |
| Production | 3 (100.0%) | 0 (0.0%) |
| Transportation | 0 (0.0%) | 0 (0.0%) |
| Material Moving | 0 (0.0%) | 0 (0.0%) |
| Total (Category) | 3 (100.0%) | 0 (0.0%) |
| Total (Overall) | 8 (42.1%) | 11 (57.9%) |
Employment Industries by Sex in Cayuse
Employment Industries in Cayuse
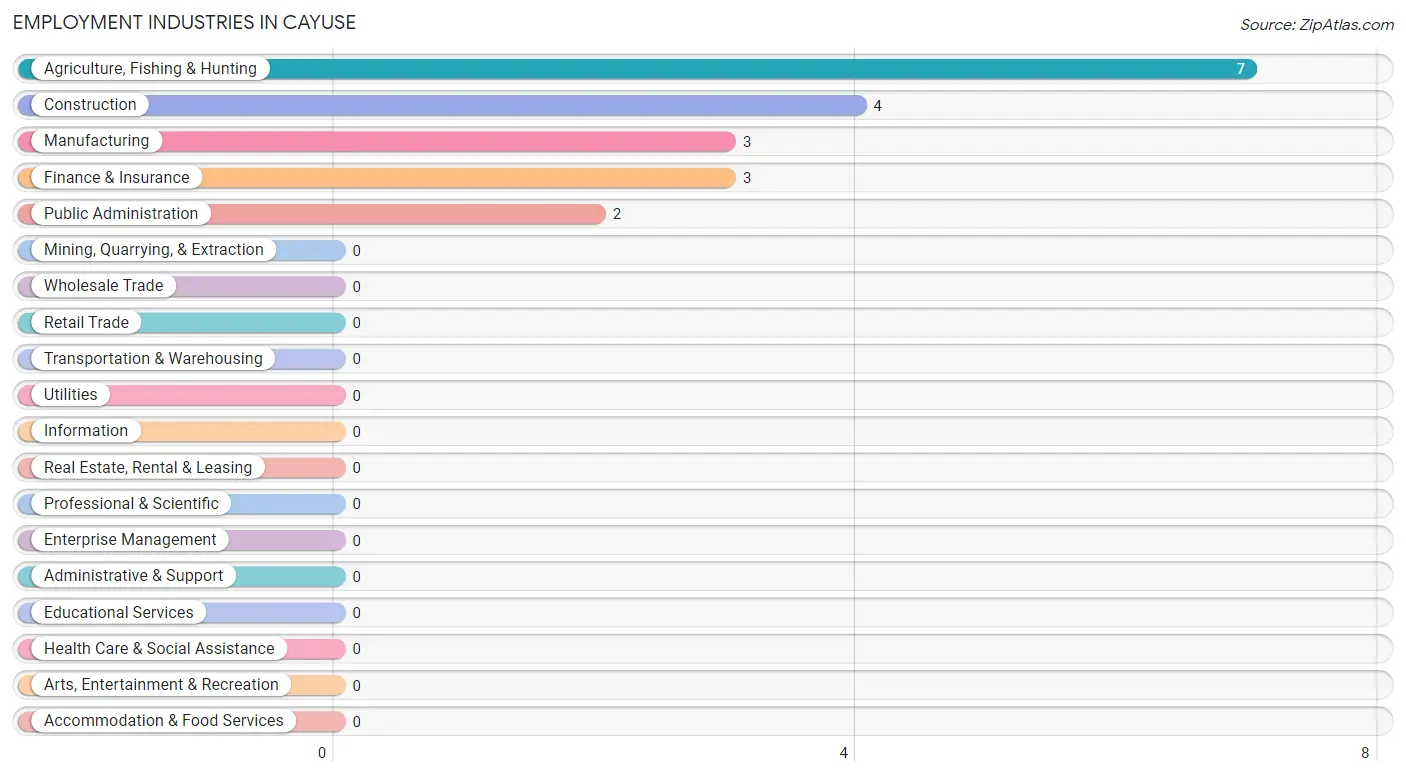
The major employment industries in Cayuse include Agriculture, Fishing & Hunting (7 | 36.8%), Construction (4 | 21.0%), Manufacturing (3 | 15.8%), Finance & Insurance (3 | 15.8%), and Public Administration (2 | 10.5%).
Employment Industries by Sex in Cayuse
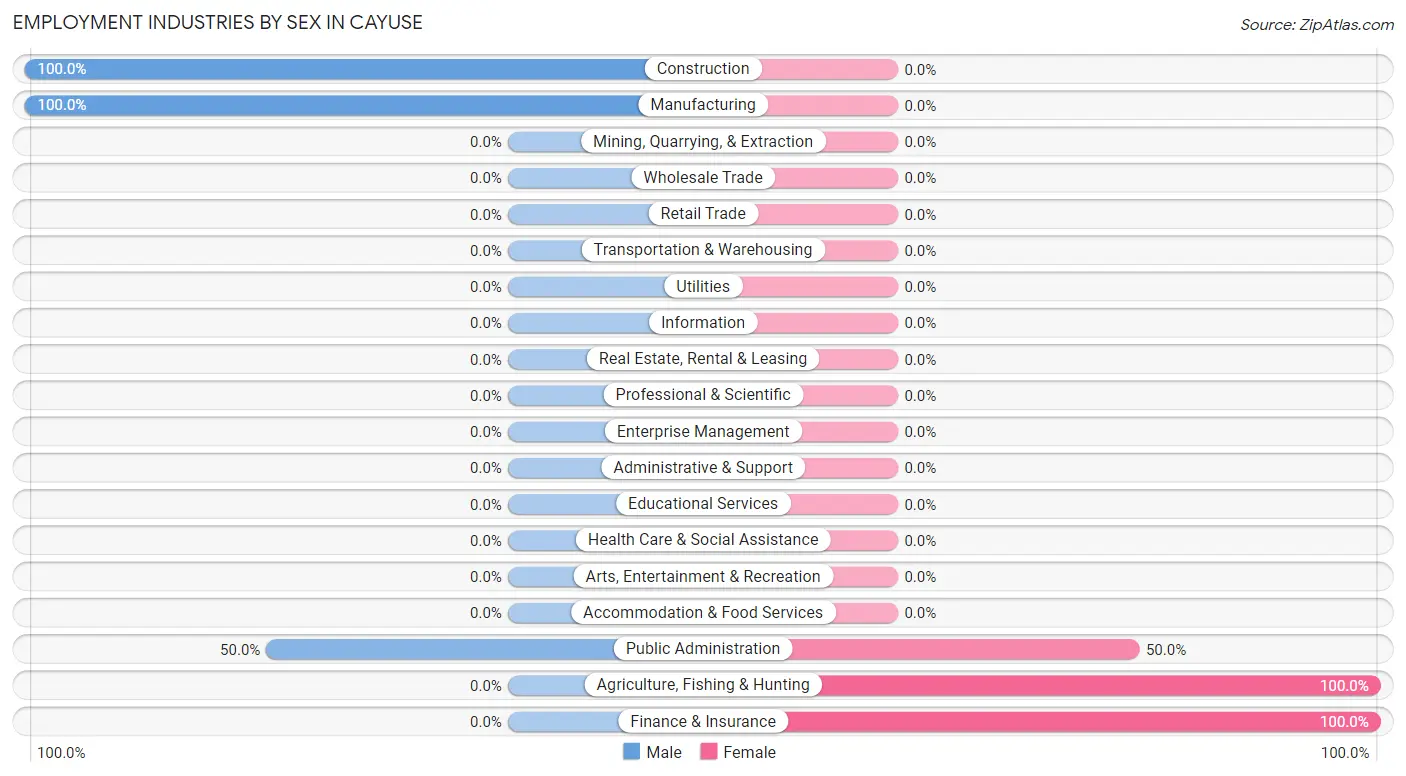
The Cayuse industries that see more men than women are Construction (100.0%), Manufacturing (100.0%), and Public Administration (50.0%), whereas the industries that tend to have a higher number of women are Agriculture, Fishing & Hunting (100.0%), Finance & Insurance (100.0%), and Public Administration (50.0%).
| Industry | Male | Female |
| Agriculture, Fishing & Hunting | 0 (0.0%) | 7 (100.0%) |
| Mining, Quarrying, & Extraction | 0 (0.0%) | 0 (0.0%) |
| Construction | 4 (100.0%) | 0 (0.0%) |
| Manufacturing | 3 (100.0%) | 0 (0.0%) |
| Wholesale Trade | 0 (0.0%) | 0 (0.0%) |
| Retail Trade | 0 (0.0%) | 0 (0.0%) |
| Transportation & Warehousing | 0 (0.0%) | 0 (0.0%) |
| Utilities | 0 (0.0%) | 0 (0.0%) |
| Information | 0 (0.0%) | 0 (0.0%) |
| Finance & Insurance | 0 (0.0%) | 3 (100.0%) |
| Real Estate, Rental & Leasing | 0 (0.0%) | 0 (0.0%) |
| Professional & Scientific | 0 (0.0%) | 0 (0.0%) |
| Enterprise Management | 0 (0.0%) | 0 (0.0%) |
| Administrative & Support | 0 (0.0%) | 0 (0.0%) |
| Educational Services | 0 (0.0%) | 0 (0.0%) |
| Health Care & Social Assistance | 0 (0.0%) | 0 (0.0%) |
| Arts, Entertainment & Recreation | 0 (0.0%) | 0 (0.0%) |
| Accommodation & Food Services | 0 (0.0%) | 0 (0.0%) |
| Public Administration | 1 (50.0%) | 1 (50.0%) |
| Total | 8 (42.1%) | 11 (57.9%) |
Education in Cayuse
School Enrollment in Cayuse
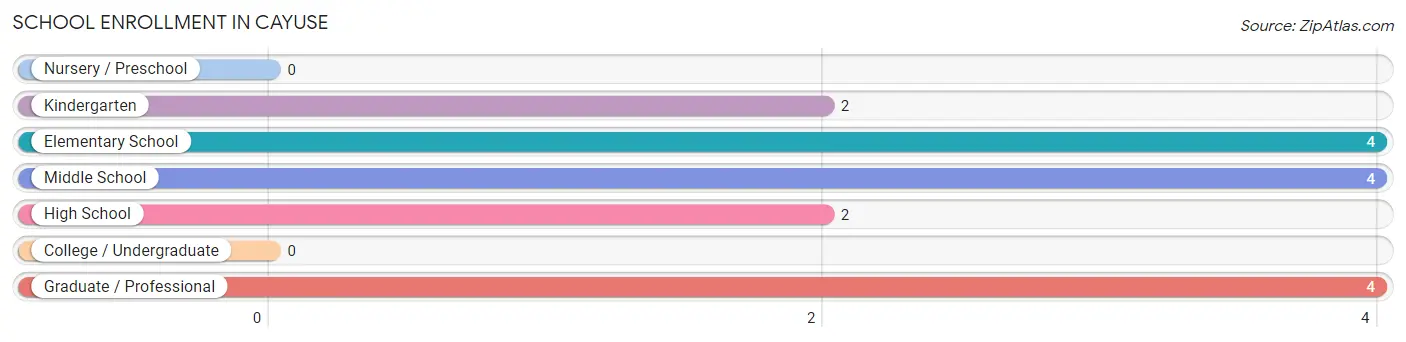
The most common levels of schooling among the 16 students in Cayuse are elementary school (4 | 25.0%), middle school (4 | 25.0%), and graduate / professional (4 | 25.0%).
| School Level | # Students | % Students |
| Nursery / Preschool | 0 | 0.0% |
| Kindergarten | 2 | 12.5% |
| Elementary School | 4 | 25.0% |
| Middle School | 4 | 25.0% |
| High School | 2 | 12.5% |
| College / Undergraduate | 0 | 0.0% |
| Graduate / Professional | 4 | 25.0% |
| Total | 16 | 100.0% |
School Enrollment by Age by Funding Source in Cayuse
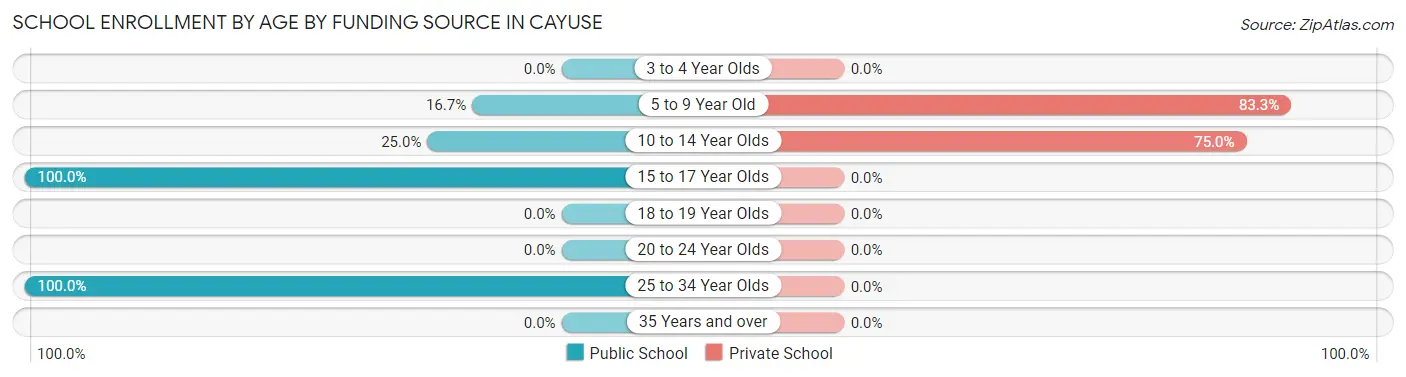
Out of a total of 16 students who are enrolled in schools in Cayuse, 8 (50.0%) attend a private institution, while the remaining 8 (50.0%) are enrolled in public schools. The age group of 5 to 9 year old has the highest likelihood of being enrolled in private schools, with 5 (83.3% in the age bracket) enrolled. Conversely, the age group of 15 to 17 year olds has the lowest likelihood of being enrolled in a private school, with 2 (100.0% in the age bracket) attending a public institution.
| Age Bracket | Public School | Private School |
| 3 to 4 Year Olds | 0 (0.0%) | 0 (0.0%) |
| 5 to 9 Year Old | 1 (16.7%) | 5 (83.3%) |
| 10 to 14 Year Olds | 1 (25.0%) | 3 (75.0%) |
| 15 to 17 Year Olds | 2 (100.0%) | 0 (0.0%) |
| 18 to 19 Year Olds | 0 (0.0%) | 0 (0.0%) |
| 20 to 24 Year Olds | 0 (0.0%) | 0 (0.0%) |
| 25 to 34 Year Olds | 4 (100.0%) | 0 (0.0%) |
| 35 Years and over | 0 (0.0%) | 0 (0.0%) |
| Total | 8 (50.0%) | 8 (50.0%) |
Educational Attainment by Field of Study in Cayuse
Bio, nature & agricultural (5 | 83.3%), and literature & languages (1 | 16.7%) are the most common fields of study among 6 individuals in Cayuse who have obtained a bachelor's degree or higher.
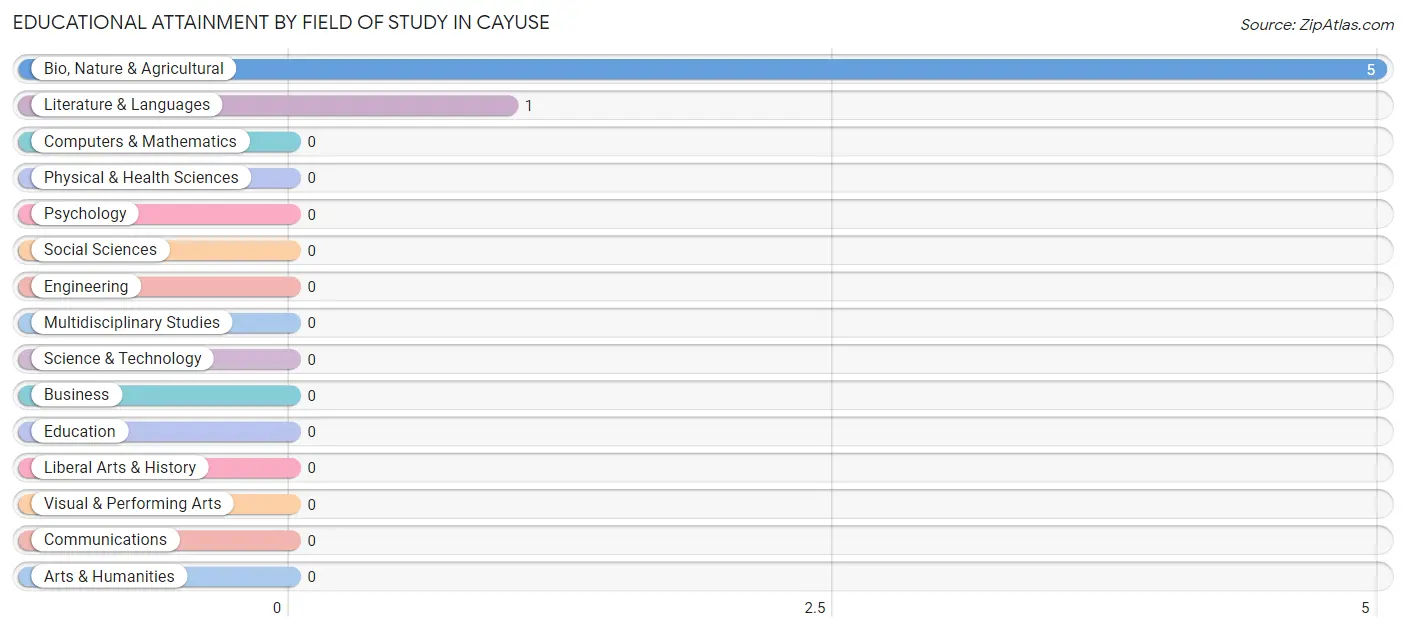
| Field of Study | # Graduates | % Graduates |
| Computers & Mathematics | 0 | 0.0% |
| Bio, Nature & Agricultural | 5 | 83.3% |
| Physical & Health Sciences | 0 | 0.0% |
| Psychology | 0 | 0.0% |
| Social Sciences | 0 | 0.0% |
| Engineering | 0 | 0.0% |
| Multidisciplinary Studies | 0 | 0.0% |
| Science & Technology | 0 | 0.0% |
| Business | 0 | 0.0% |
| Education | 0 | 0.0% |
| Literature & Languages | 1 | 16.7% |
| Liberal Arts & History | 0 | 0.0% |
| Visual & Performing Arts | 0 | 0.0% |
| Communications | 0 | 0.0% |
| Arts & Humanities | 0 | 0.0% |
| Total | 6 | 100.0% |
Transportation & Commute in Cayuse
Vehicle Availability by Sex in Cayuse
The most prevalent vehicle ownership categories in Cayuse are males with 4 vehicles (4, accounting for 50.0%) and females with 4 vehicles (3, making up 36.4%).
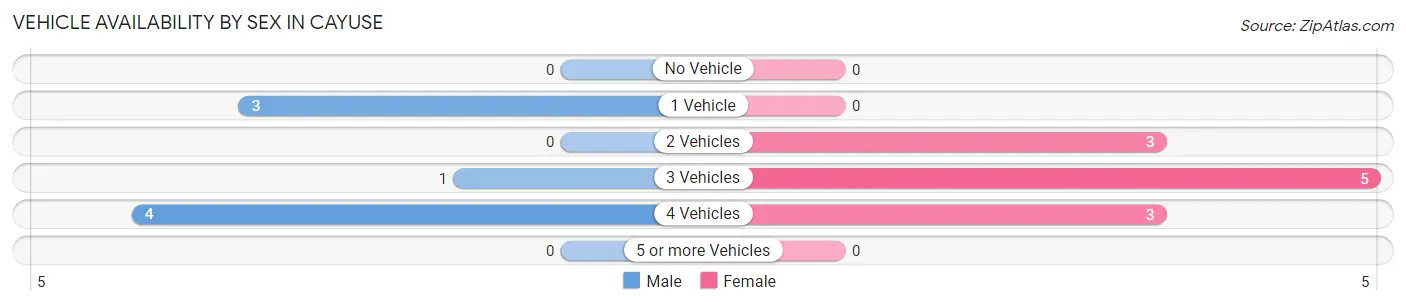
| Vehicles Available | Male | Female |
| No Vehicle | 0 (0.0%) | 0 (0.0%) |
| 1 Vehicle | 3 (37.5%) | 0 (0.0%) |
| 2 Vehicles | 0 (0.0%) | 3 (27.3%) |
| 3 Vehicles | 1 (12.5%) | 5 (45.5%) |
| 4 Vehicles | 4 (50.0%) | 3 (27.3%) |
| 5 or more Vehicles | 0 (0.0%) | 0 (0.0%) |
| Total | 8 (100.0%) | 11 (100.0%) |
Commute Time in Cayuse
The most frequently occuring commute durations in Cayuse are 90 or more minutes (8 commuters, 50.0%), 20 to 24 minutes (3 commuters, 18.8%), and 25 to 29 minutes (3 commuters, 18.8%).
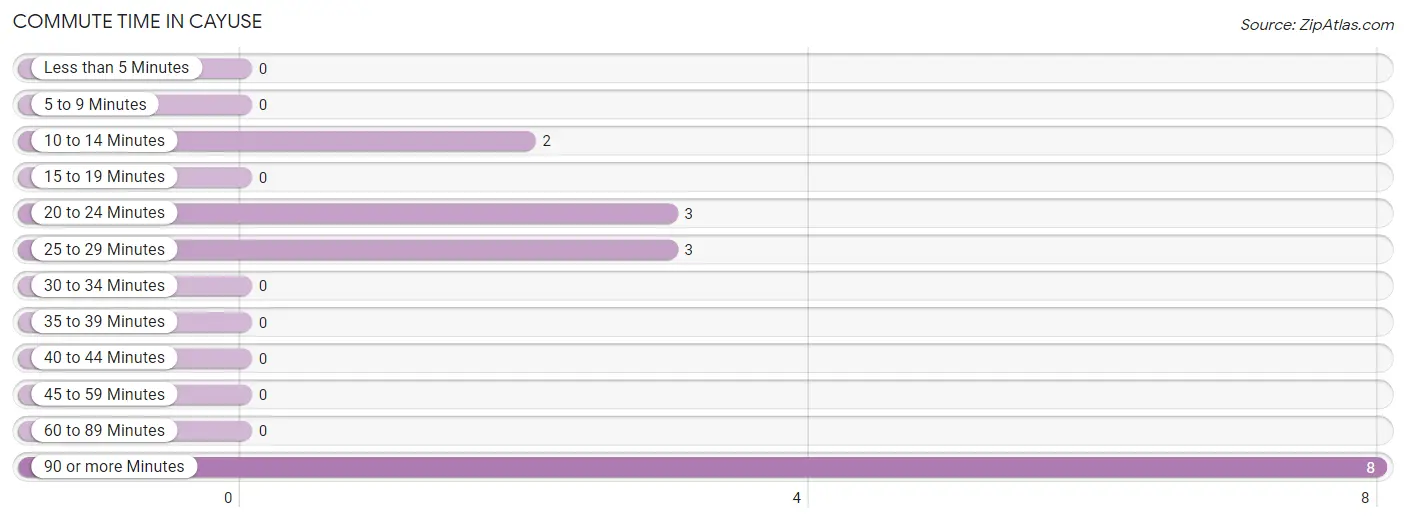
| Commute Time | # Commuters | % Commuters |
| Less than 5 Minutes | 0 | 0.0% |
| 5 to 9 Minutes | 0 | 0.0% |
| 10 to 14 Minutes | 2 | 12.5% |
| 15 to 19 Minutes | 0 | 0.0% |
| 20 to 24 Minutes | 3 | 18.8% |
| 25 to 29 Minutes | 3 | 18.8% |
| 30 to 34 Minutes | 0 | 0.0% |
| 35 to 39 Minutes | 0 | 0.0% |
| 40 to 44 Minutes | 0 | 0.0% |
| 45 to 59 Minutes | 0 | 0.0% |
| 60 to 89 Minutes | 0 | 0.0% |
| 90 or more Minutes | 8 | 50.0% |
Commute Time by Sex in Cayuse
The most common commute times in Cayuse are 90 or more minutes (4 commuters, 50.0%) for males and 90 or more minutes (4 commuters, 50.0%) for females.
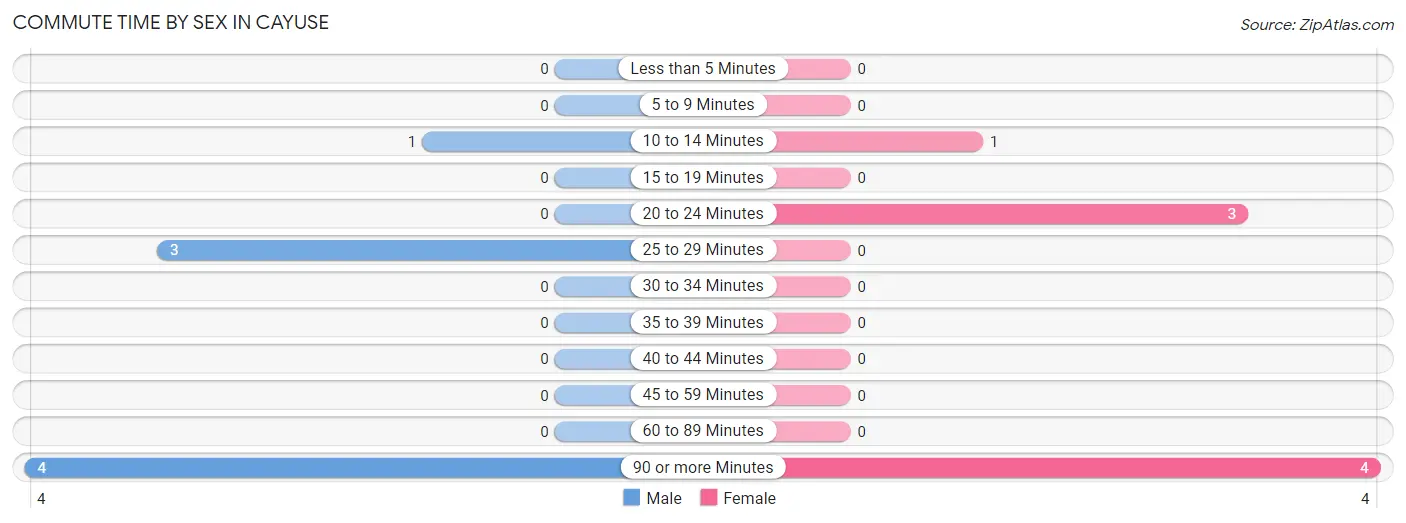
| Commute Time | Male | Female |
| Less than 5 Minutes | 0 (0.0%) | 0 (0.0%) |
| 5 to 9 Minutes | 0 (0.0%) | 0 (0.0%) |
| 10 to 14 Minutes | 1 (12.5%) | 1 (12.5%) |
| 15 to 19 Minutes | 0 (0.0%) | 0 (0.0%) |
| 20 to 24 Minutes | 0 (0.0%) | 3 (37.5%) |
| 25 to 29 Minutes | 3 (37.5%) | 0 (0.0%) |
| 30 to 34 Minutes | 0 (0.0%) | 0 (0.0%) |
| 35 to 39 Minutes | 0 (0.0%) | 0 (0.0%) |
| 40 to 44 Minutes | 0 (0.0%) | 0 (0.0%) |
| 45 to 59 Minutes | 0 (0.0%) | 0 (0.0%) |
| 60 to 89 Minutes | 0 (0.0%) | 0 (0.0%) |
| 90 or more Minutes | 4 (50.0%) | 4 (50.0%) |
Time of Departure to Work by Sex in Cayuse
The most frequent times of departure to work in Cayuse are 5:00 AM to 5:29 AM (4, 50.0%) for males and 6:00 AM to 6:29 AM (4, 50.0%) for females.
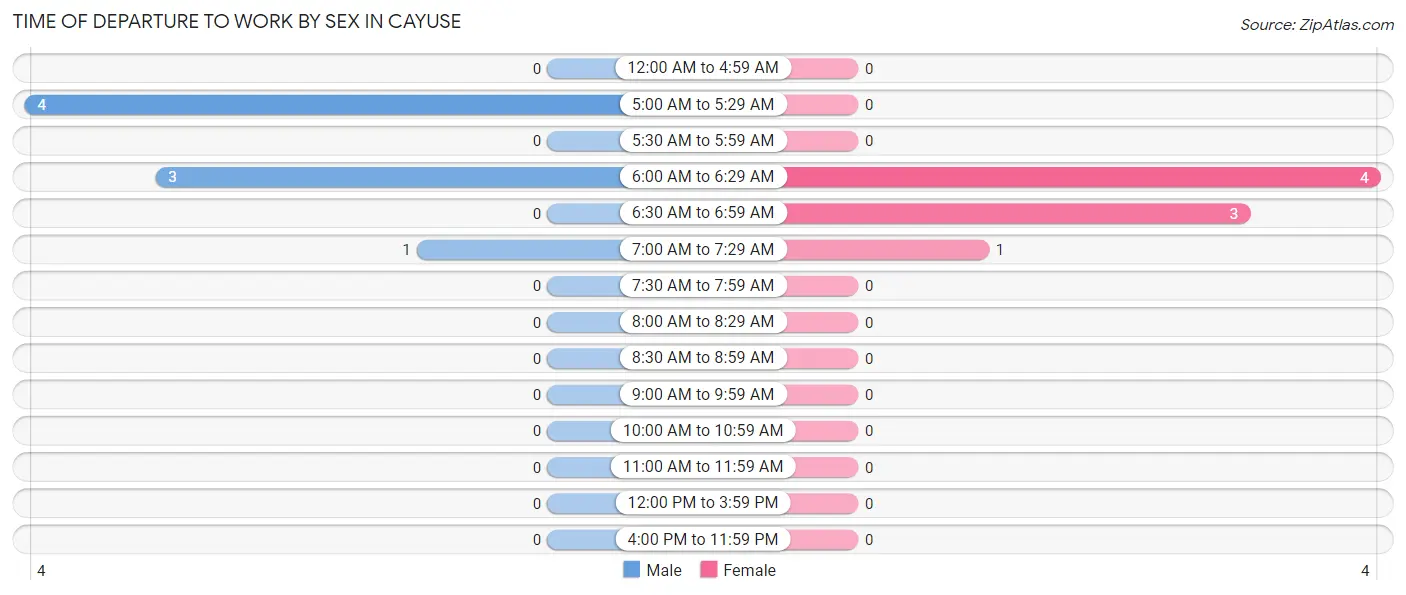
| Time of Departure | Male | Female |
| 12:00 AM to 4:59 AM | 0 (0.0%) | 0 (0.0%) |
| 5:00 AM to 5:29 AM | 4 (50.0%) | 0 (0.0%) |
| 5:30 AM to 5:59 AM | 0 (0.0%) | 0 (0.0%) |
| 6:00 AM to 6:29 AM | 3 (37.5%) | 4 (50.0%) |
| 6:30 AM to 6:59 AM | 0 (0.0%) | 3 (37.5%) |
| 7:00 AM to 7:29 AM | 1 (12.5%) | 1 (12.5%) |
| 7:30 AM to 7:59 AM | 0 (0.0%) | 0 (0.0%) |
| 8:00 AM to 8:29 AM | 0 (0.0%) | 0 (0.0%) |
| 8:30 AM to 8:59 AM | 0 (0.0%) | 0 (0.0%) |
| 9:00 AM to 9:59 AM | 0 (0.0%) | 0 (0.0%) |
| 10:00 AM to 10:59 AM | 0 (0.0%) | 0 (0.0%) |
| 11:00 AM to 11:59 AM | 0 (0.0%) | 0 (0.0%) |
| 12:00 PM to 3:59 PM | 0 (0.0%) | 0 (0.0%) |
| 4:00 PM to 11:59 PM | 0 (0.0%) | 0 (0.0%) |
| Total | 8 (100.0%) | 8 (100.0%) |
Housing Occupancy in Cayuse
Occupancy by Ownership in Cayuse
Of the total 19 dwellings in Cayuse, owner-occupied units account for 16 (84.2%), while renter-occupied units make up 3 (15.8%).
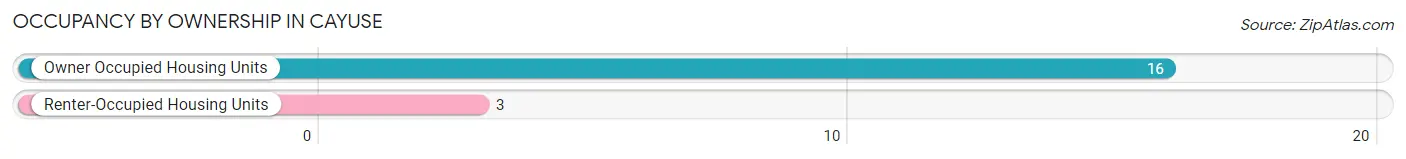
| Occupancy | # Housing Units | % Housing Units |
| Owner Occupied Housing Units | 16 | 84.2% |
| Renter-Occupied Housing Units | 3 | 15.8% |
| Total Occupied Housing Units | 19 | 100.0% |
Occupancy by Household Size in Cayuse
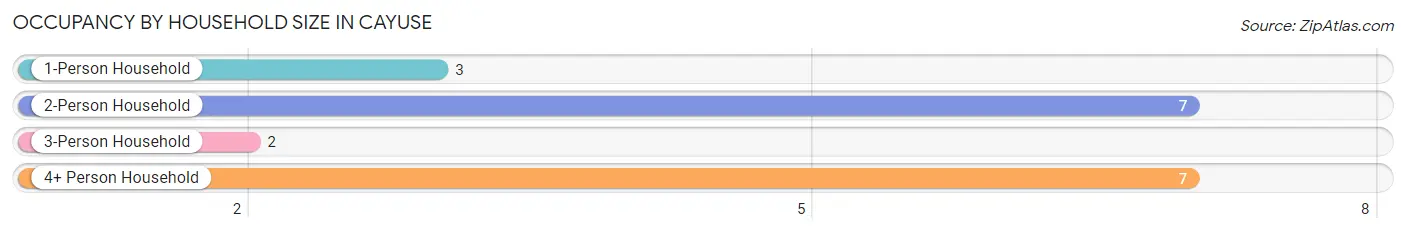
| Household Size | # Housing Units | % Housing Units |
| 1-Person Household | 3 | 15.8% |
| 2-Person Household | 7 | 36.8% |
| 3-Person Household | 2 | 10.5% |
| 4+ Person Household | 7 | 36.8% |
| Total Housing Units | 19 | 100.0% |
Occupancy by Ownership by Household Size in Cayuse
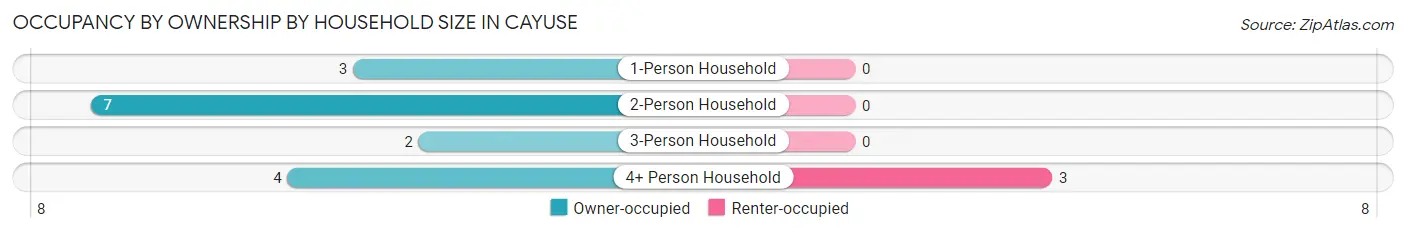
| Household Size | Owner-occupied | Renter-occupied |
| 1-Person Household | 3 (100.0%) | 0 (0.0%) |
| 2-Person Household | 7 (100.0%) | 0 (0.0%) |
| 3-Person Household | 2 (100.0%) | 0 (0.0%) |
| 4+ Person Household | 4 (57.1%) | 3 (42.9%) |
| Total Housing Units | 16 (84.2%) | 3 (15.8%) |
Occupancy by Educational Attainment in Cayuse
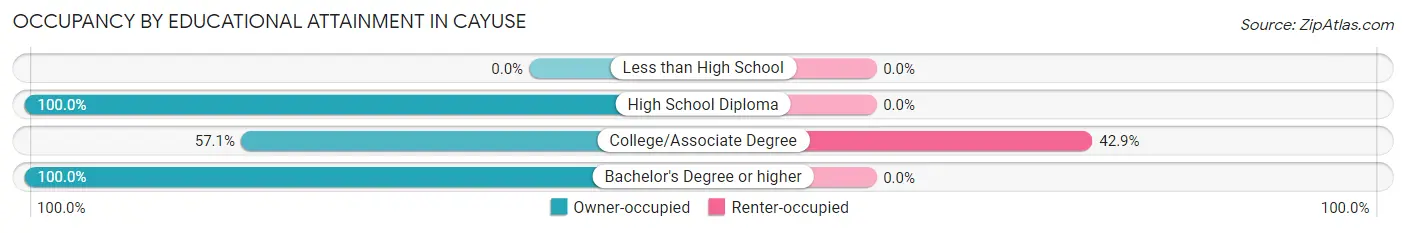
| Household Size | Owner-occupied | Renter-occupied |
| Less than High School | 0 (0.0%) | 0 (0.0%) |
| High School Diploma | 11 (100.0%) | 0 (0.0%) |
| College/Associate Degree | 4 (57.1%) | 3 (42.9%) |
| Bachelor's Degree or higher | 1 (100.0%) | 0 (0.0%) |
Occupancy by Age of Householder in Cayuse
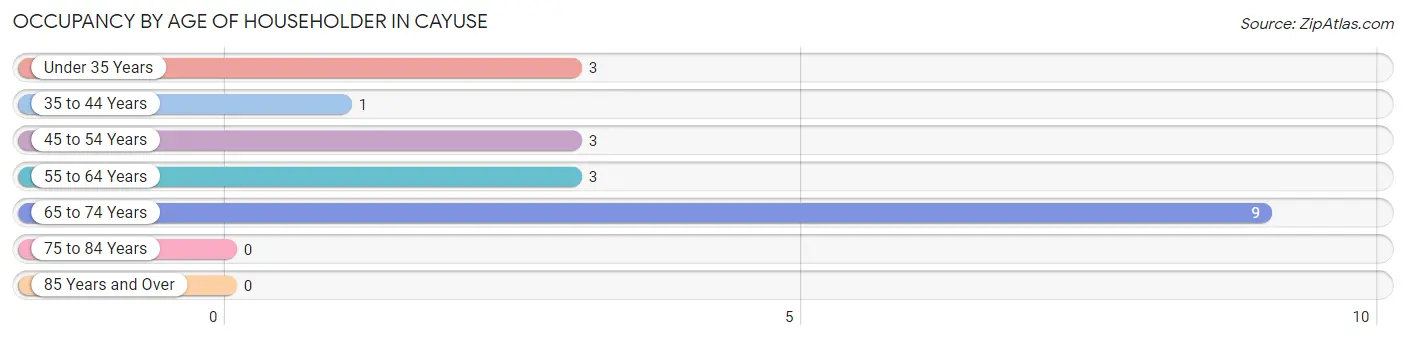
| Age Bracket | # Households | % Households |
| Under 35 Years | 3 | 15.8% |
| 35 to 44 Years | 1 | 5.3% |
| 45 to 54 Years | 3 | 15.8% |
| 55 to 64 Years | 3 | 15.8% |
| 65 to 74 Years | 9 | 47.4% |
| 75 to 84 Years | 0 | 0.0% |
| 85 Years and Over | 0 | 0.0% |
| Total | 19 | 100.0% |
Housing Finances in Cayuse
Median Income by Occupancy in Cayuse
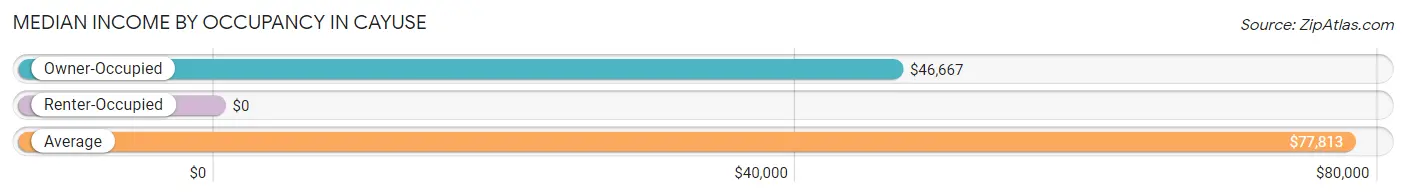
| Occupancy Type | # Households | Median Income |
| Owner-Occupied | 16 (84.2%) | $46,667 |
| Renter-Occupied | 3 (15.8%) | $0 |
| Average | 19 (100.0%) | $77,813 |
Occupancy by Householder Income Bracket in Cayuse
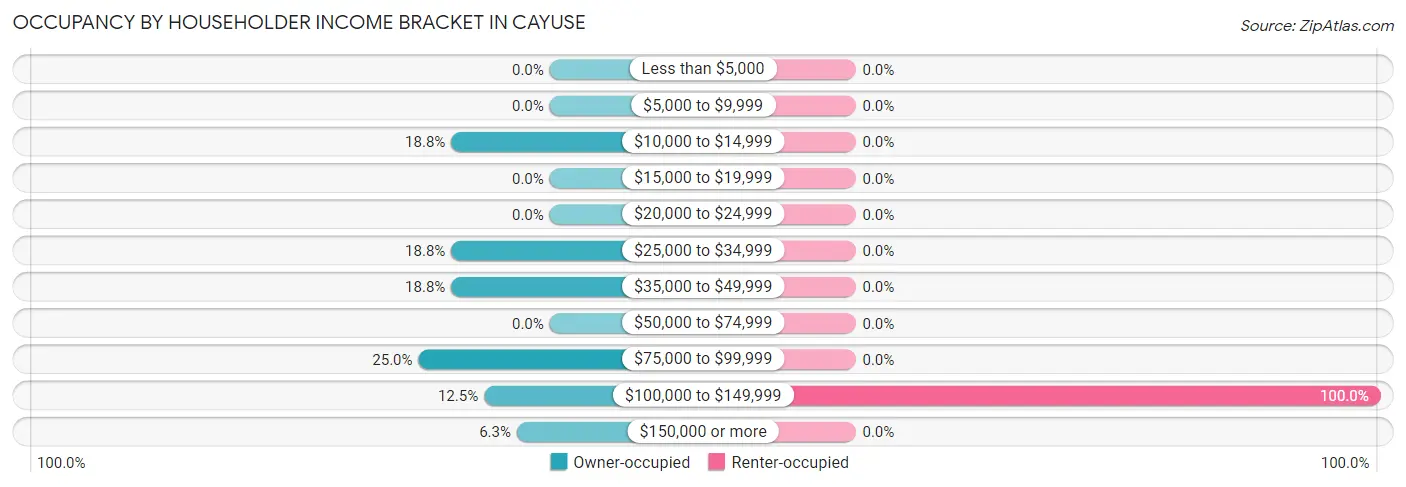
| Income Bracket | Owner-occupied | Renter-occupied |
| Less than $5,000 | 0 (0.0%) | 0 (0.0%) |
| $5,000 to $9,999 | 0 (0.0%) | 0 (0.0%) |
| $10,000 to $14,999 | 3 (18.8%) | 0 (0.0%) |
| $15,000 to $19,999 | 0 (0.0%) | 0 (0.0%) |
| $20,000 to $24,999 | 0 (0.0%) | 0 (0.0%) |
| $25,000 to $34,999 | 3 (18.8%) | 0 (0.0%) |
| $35,000 to $49,999 | 3 (18.8%) | 0 (0.0%) |
| $50,000 to $74,999 | 0 (0.0%) | 0 (0.0%) |
| $75,000 to $99,999 | 4 (25.0%) | 0 (0.0%) |
| $100,000 to $149,999 | 2 (12.5%) | 3 (100.0%) |
| $150,000 or more | 1 (6.2%) | 0 (0.0%) |
| Total | 16 (100.0%) | 3 (100.0%) |
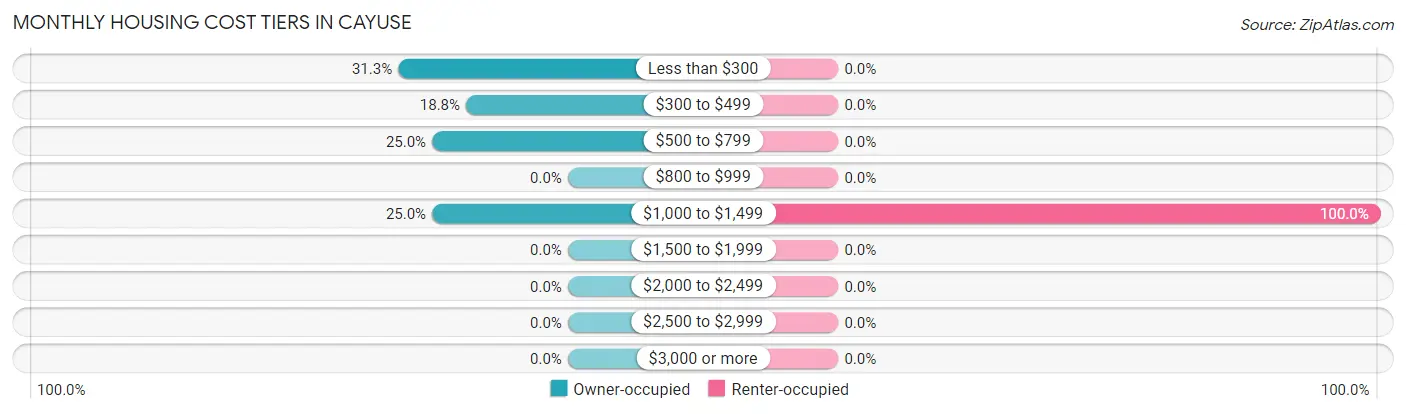
Monthly Housing Cost Tiers in Cayuse
| Monthly Cost | Owner-occupied | Renter-occupied |
| Less than $300 | 5 (31.2%) | 0 (0.0%) |
| $300 to $499 | 3 (18.8%) | 0 (0.0%) |
| $500 to $799 | 4 (25.0%) | 0 (0.0%) |
| $800 to $999 | 0 (0.0%) | 0 (0.0%) |
| $1,000 to $1,499 | 4 (25.0%) | 3 (100.0%) |
| $1,500 to $1,999 | 0 (0.0%) | 0 (0.0%) |
| $2,000 to $2,499 | 0 (0.0%) | 0 (0.0%) |
| $2,500 to $2,999 | 0 (0.0%) | 0 (0.0%) |
| $3,000 or more | 0 (0.0%) | 0 (0.0%) |
| Total | 16 (100.0%) | 3 (100.0%) |
Physical Housing Characteristics in Cayuse
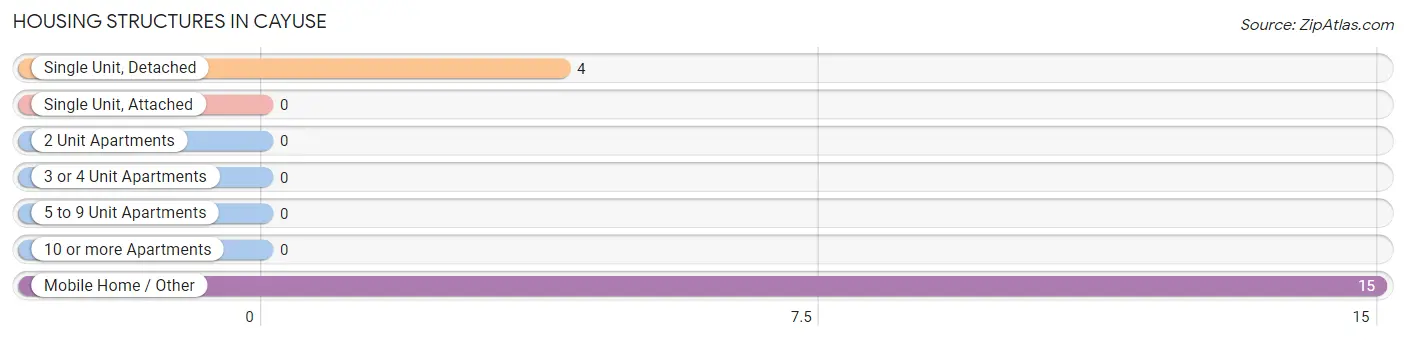
Housing Structures in Cayuse
| Structure Type | # Housing Units | % Housing Units |
| Single Unit, Detached | 4 | 21.0% |
| Single Unit, Attached | 0 | 0.0% |
| 2 Unit Apartments | 0 | 0.0% |
| 3 or 4 Unit Apartments | 0 | 0.0% |
| 5 to 9 Unit Apartments | 0 | 0.0% |
| 10 or more Apartments | 0 | 0.0% |
| Mobile Home / Other | 15 | 78.9% |
| Total | 19 | 100.0% |
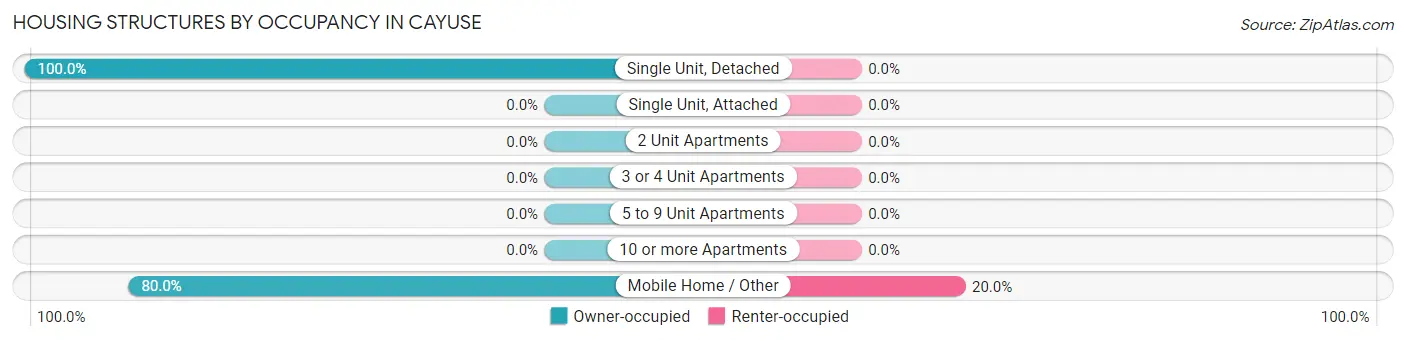
Housing Structures by Occupancy in Cayuse
| Structure Type | Owner-occupied | Renter-occupied |
| Single Unit, Detached | 4 (100.0%) | 0 (0.0%) |
| Single Unit, Attached | 0 (0.0%) | 0 (0.0%) |
| 2 Unit Apartments | 0 (0.0%) | 0 (0.0%) |
| 3 or 4 Unit Apartments | 0 (0.0%) | 0 (0.0%) |
| 5 to 9 Unit Apartments | 0 (0.0%) | 0 (0.0%) |
| 10 or more Apartments | 0 (0.0%) | 0 (0.0%) |
| Mobile Home / Other | 12 (80.0%) | 3 (20.0%) |
| Total | 16 (84.2%) | 3 (15.8%) |
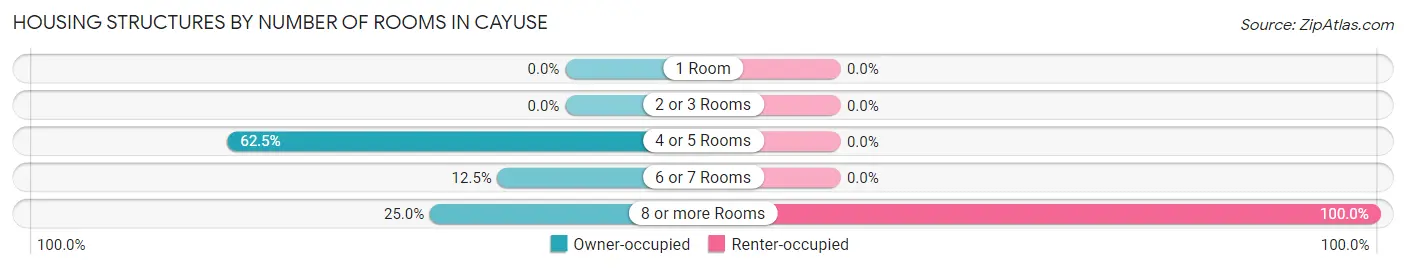
Housing Structures by Number of Rooms in Cayuse
| Number of Rooms | Owner-occupied | Renter-occupied |
| 1 Room | 0 (0.0%) | 0 (0.0%) |
| 2 or 3 Rooms | 0 (0.0%) | 0 (0.0%) |
| 4 or 5 Rooms | 10 (62.5%) | 0 (0.0%) |
| 6 or 7 Rooms | 2 (12.5%) | 0 (0.0%) |
| 8 or more Rooms | 4 (25.0%) | 3 (100.0%) |
| Total | 16 (100.0%) | 3 (100.0%) |
Housing Structure by Heating Type in Cayuse
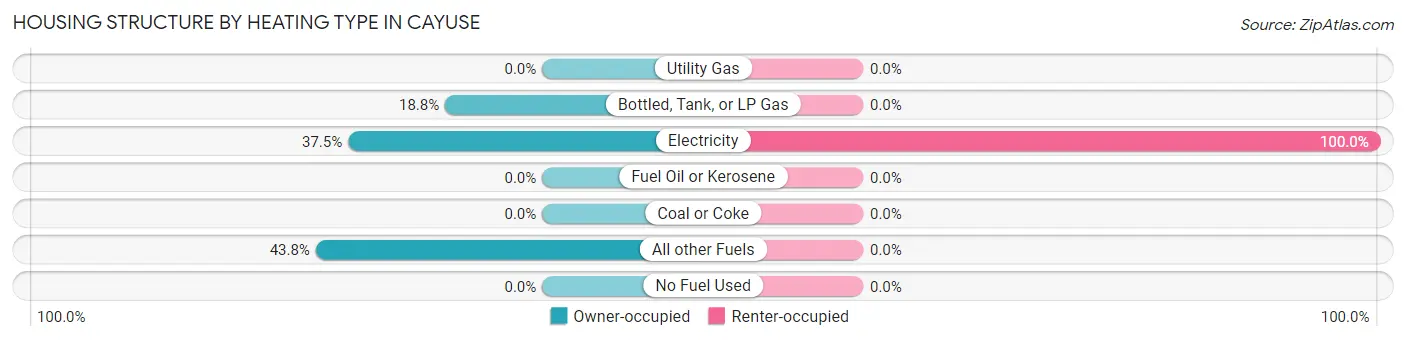
| Heating Type | Owner-occupied | Renter-occupied |
| Utility Gas | 0 (0.0%) | 0 (0.0%) |
| Bottled, Tank, or LP Gas | 3 (18.8%) | 0 (0.0%) |
| Electricity | 6 (37.5%) | 3 (100.0%) |
| Fuel Oil or Kerosene | 0 (0.0%) | 0 (0.0%) |
| Coal or Coke | 0 (0.0%) | 0 (0.0%) |
| All other Fuels | 7 (43.8%) | 0 (0.0%) |
| No Fuel Used | 0 (0.0%) | 0 (0.0%) |
| Total | 16 (100.0%) | 3 (100.0%) |
Household Vehicle Usage in Cayuse
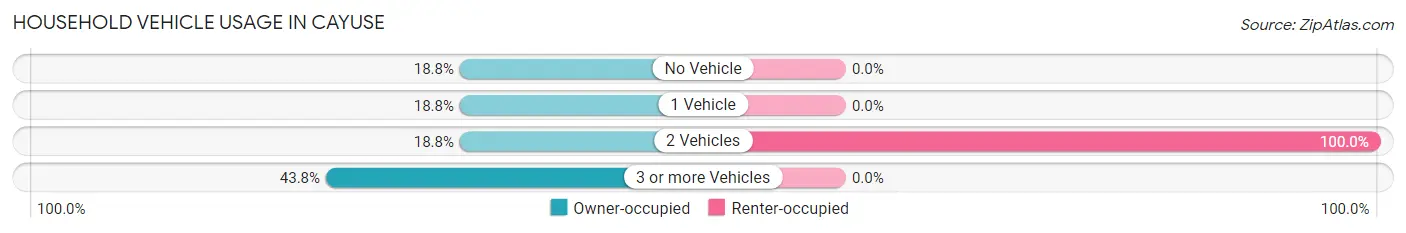
| Vehicles per Household | Owner-occupied | Renter-occupied |
| No Vehicle | 3 (18.8%) | 0 (0.0%) |
| 1 Vehicle | 3 (18.8%) | 0 (0.0%) |
| 2 Vehicles | 3 (18.8%) | 3 (100.0%) |
| 3 or more Vehicles | 7 (43.8%) | 0 (0.0%) |
| Total | 16 (100.0%) | 3 (100.0%) |
Real Estate & Mortgages in Cayuse
Real Estate and Mortgage Overview in Cayuse
| Characteristic | Without Mortgage | With Mortgage |
| Housing Units | 8 | 8 |
| Median Property Value | $141,700 | $0 |
| Median Household Income | $45,833 | $1 |
| Monthly Housing Costs | $283 | $0 |
| Real Estate Taxes | - | - |
Property Value by Mortgage Status in Cayuse
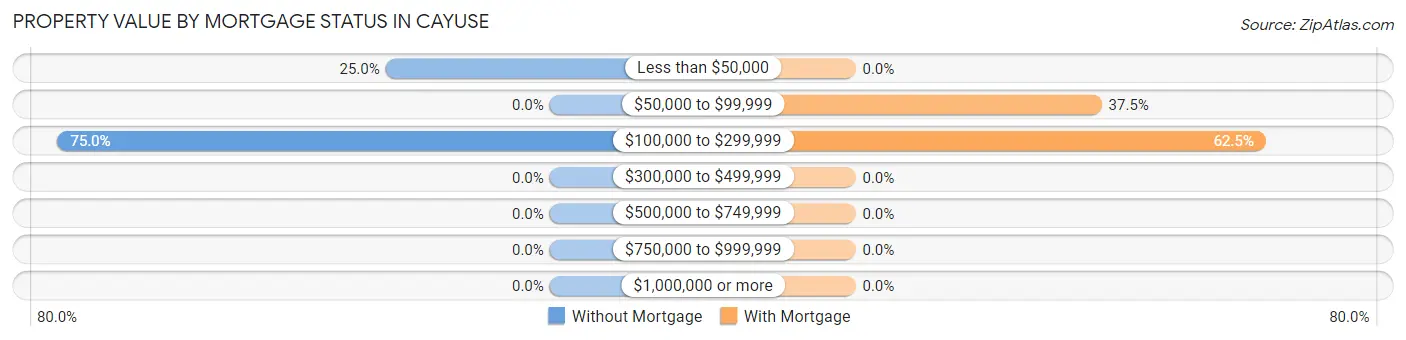
| Property Value | Without Mortgage | With Mortgage |
| Less than $50,000 | 2 (25.0%) | 0 (0.0%) |
| $50,000 to $99,999 | 0 (0.0%) | 3 (37.5%) |
| $100,000 to $299,999 | 6 (75.0%) | 5 (62.5%) |
| $300,000 to $499,999 | 0 (0.0%) | 0 (0.0%) |
| $500,000 to $749,999 | 0 (0.0%) | 0 (0.0%) |
| $750,000 to $999,999 | 0 (0.0%) | 0 (0.0%) |
| $1,000,000 or more | 0 (0.0%) | 0 (0.0%) |
| Total | 8 (100.0%) | 8 (100.0%) |
Household Income by Mortgage Status in Cayuse
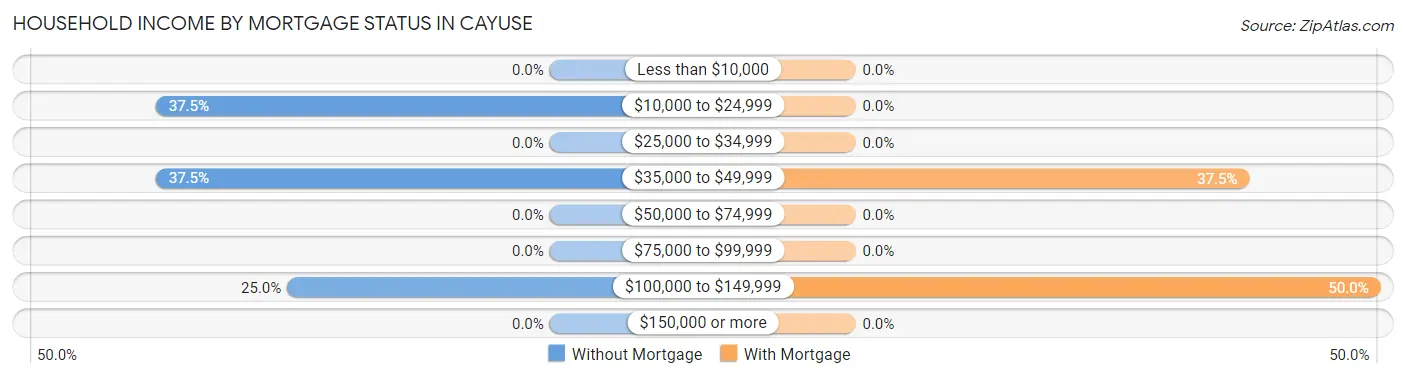
| Household Income | Without Mortgage | With Mortgage |
| Less than $10,000 | 0 (0.0%) | 0 (0.0%) |
| $10,000 to $24,999 | 3 (37.5%) | 0 (0.0%) |
| $25,000 to $34,999 | 0 (0.0%) | 0 (0.0%) |
| $35,000 to $49,999 | 3 (37.5%) | 3 (37.5%) |
| $50,000 to $74,999 | 0 (0.0%) | 0 (0.0%) |
| $75,000 to $99,999 | 0 (0.0%) | 0 (0.0%) |
| $100,000 to $149,999 | 2 (25.0%) | 4 (50.0%) |
| $150,000 or more | 0 (0.0%) | 0 (0.0%) |
| Total | 8 (100.0%) | 8 (100.0%) |
Property Value to Household Income Ratio in Cayuse
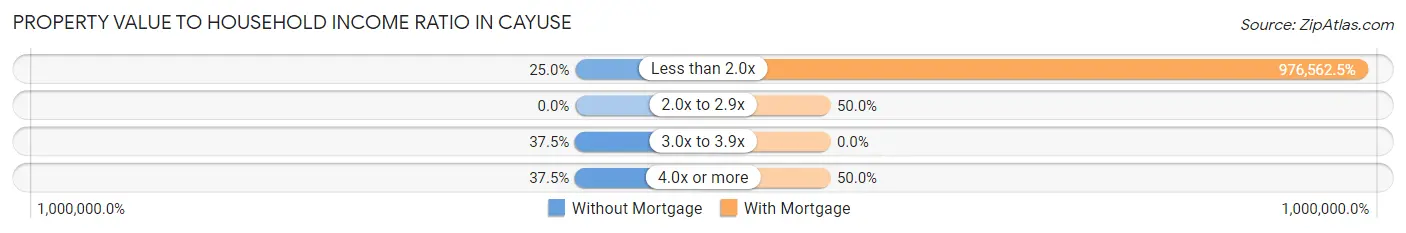
| Value-to-Income Ratio | Without Mortgage | With Mortgage |
| Less than 2.0x | 2 (25.0%) | 78,125 (976,562.5%) |
| 2.0x to 2.9x | 0 (0.0%) | 4 (50.0%) |
| 3.0x to 3.9x | 3 (37.5%) | 0 (0.0%) |
| 4.0x or more | 3 (37.5%) | 4 (50.0%) |
| Total | 8 (100.0%) | 8 (100.0%) |
Real Estate Taxes by Mortgage Status in Cayuse
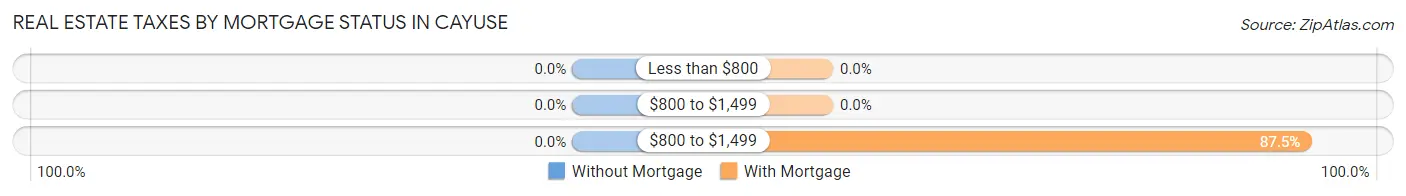
| Property Taxes | Without Mortgage | With Mortgage |
| Less than $800 | 0 (0.0%) | 0 (0.0%) |
| $800 to $1,499 | 0 (0.0%) | 0 (0.0%) |
| $800 to $1,499 | 0 (0.0%) | 7 (87.5%) |
| Total | 8 (100.0%) | 8 (100.0%) |
Health & Disability in Cayuse
Health Insurance Coverage by Age in Cayuse
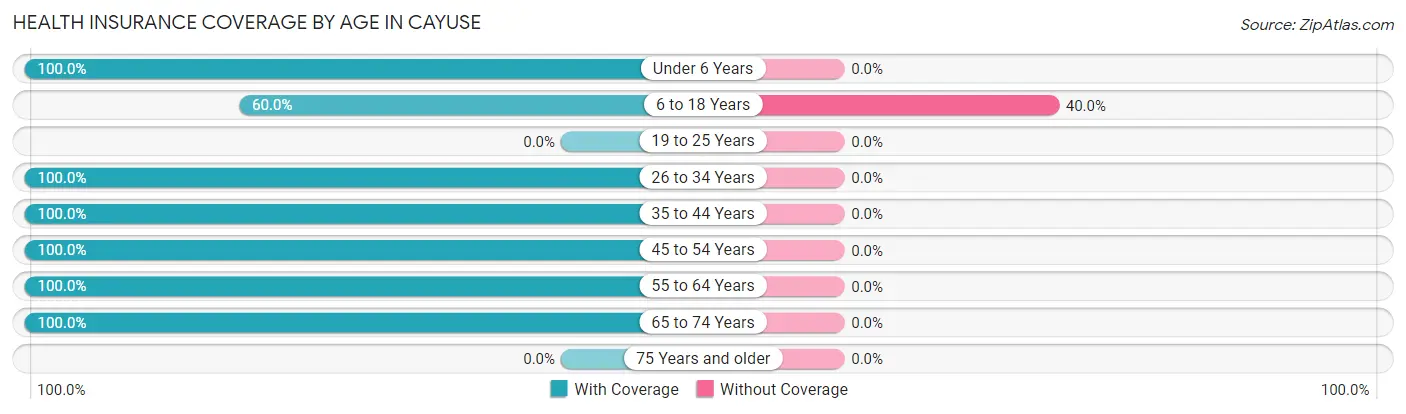
| Age Bracket | With Coverage | Without Coverage |
| Under 6 Years | 4 (100.0%) | 0 (0.0%) |
| 6 to 18 Years | 6 (60.0%) | 4 (40.0%) |
| 19 to 25 Years | 0 (0.0%) | 0 (0.0%) |
| 26 to 34 Years | 13 (100.0%) | 0 (0.0%) |
| 35 to 44 Years | 2 (100.0%) | 0 (0.0%) |
| 45 to 54 Years | 3 (100.0%) | 0 (0.0%) |
| 55 to 64 Years | 6 (100.0%) | 0 (0.0%) |
| 65 to 74 Years | 20 (100.0%) | 0 (0.0%) |
| 75 Years and older | 0 (0.0%) | 0 (0.0%) |
| Total | 54 (93.1%) | 4 (6.9%) |
Health Insurance Coverage by Citizenship Status in Cayuse
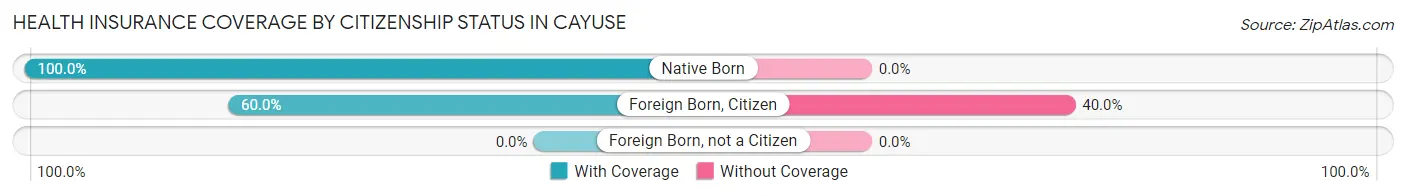
| Citizenship Status | With Coverage | Without Coverage |
| Native Born | 4 (100.0%) | 0 (0.0%) |
| Foreign Born, Citizen | 6 (60.0%) | 4 (40.0%) |
| Foreign Born, not a Citizen | 0 (0.0%) | 0 (0.0%) |
Health Insurance Coverage by Household Income in Cayuse
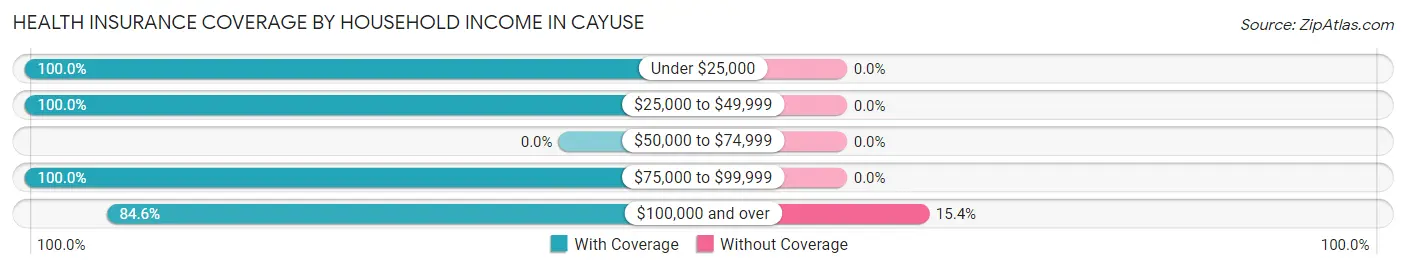
| Household Income | With Coverage | Without Coverage |
| Under $25,000 | 3 (100.0%) | 0 (0.0%) |
| $25,000 to $49,999 | 22 (100.0%) | 0 (0.0%) |
| $50,000 to $74,999 | 0 (0.0%) | 0 (0.0%) |
| $75,000 to $99,999 | 7 (100.0%) | 0 (0.0%) |
| $100,000 and over | 22 (84.6%) | 4 (15.4%) |
Public vs Private Health Insurance Coverage by Age in Cayuse
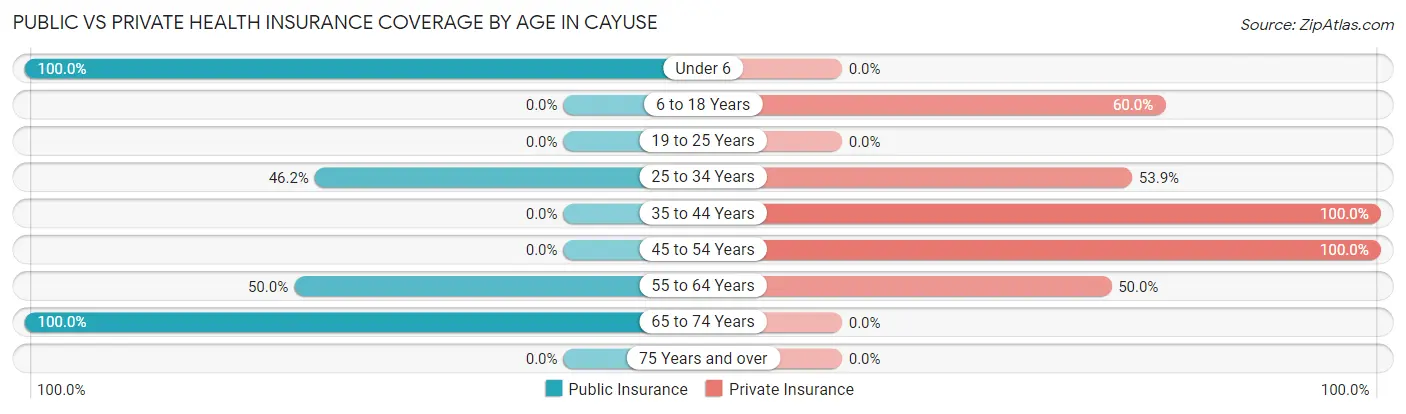
| Age Bracket | Public Insurance | Private Insurance |
| Under 6 | 4 (100.0%) | 0 (0.0%) |
| 6 to 18 Years | 0 (0.0%) | 6 (60.0%) |
| 19 to 25 Years | 0 (0.0%) | 0 (0.0%) |
| 25 to 34 Years | 6 (46.2%) | 7 (53.8%) |
| 35 to 44 Years | 0 (0.0%) | 2 (100.0%) |
| 45 to 54 Years | 0 (0.0%) | 3 (100.0%) |
| 55 to 64 Years | 3 (50.0%) | 3 (50.0%) |
| 65 to 74 Years | 20 (100.0%) | 0 (0.0%) |
| 75 Years and over | 0 (0.0%) | 0 (0.0%) |
| Total | 33 (56.9%) | 21 (36.2%) |
Disability Status by Sex by Age in Cayuse
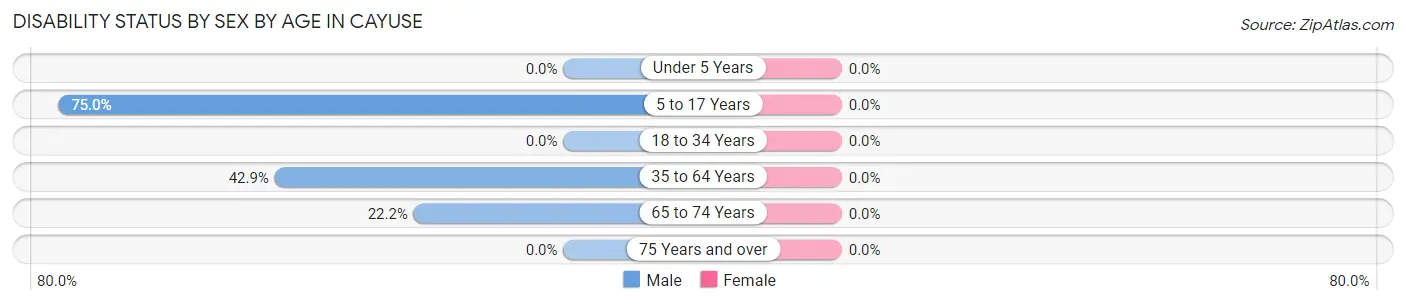
| Age Bracket | Male | Female |
| Under 5 Years | 0 (0.0%) | 0 (0.0%) |
| 5 to 17 Years | 3 (75.0%) | 0 (0.0%) |
| 18 to 34 Years | 0 (0.0%) | 0 (0.0%) |
| 35 to 64 Years | 3 (42.9%) | 0 (0.0%) |
| 65 to 74 Years | 2 (22.2%) | 0 (0.0%) |
| 75 Years and over | 0 (0.0%) | 0 (0.0%) |
Disability Class by Sex by Age in Cayuse
Disability Class: Hearing Difficulty
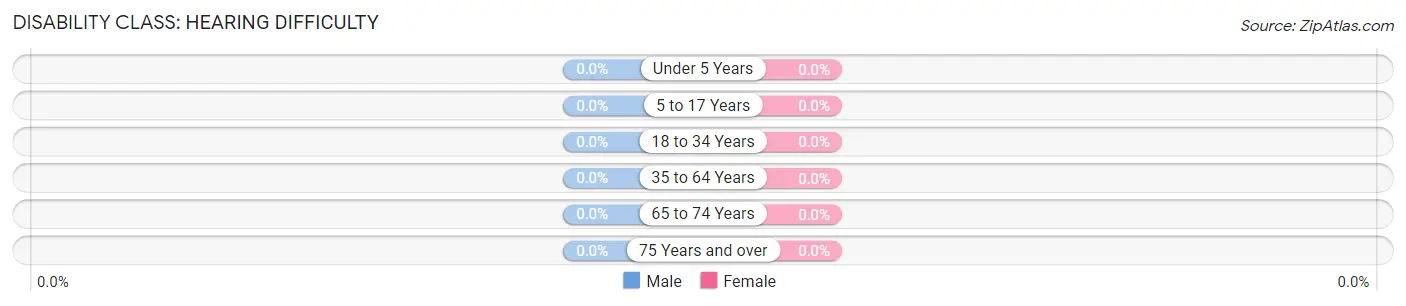
| Age Bracket | Male | Female |
| Under 5 Years | 0 (0.0%) | 0 (0.0%) |
| 5 to 17 Years | 0 (0.0%) | 0 (0.0%) |
| 18 to 34 Years | 0 (0.0%) | 0 (0.0%) |
| 35 to 64 Years | 0 (0.0%) | 0 (0.0%) |
| 65 to 74 Years | 0 (0.0%) | 0 (0.0%) |
| 75 Years and over | 0 (0.0%) | 0 (0.0%) |
Disability Class: Vision Difficulty
| Age Bracket | Male | Female |
| Under 5 Years | 0 (0.0%) | 0 (0.0%) |
| 5 to 17 Years | 0 (0.0%) | 0 (0.0%) |
| 18 to 34 Years | 0 (0.0%) | 0 (0.0%) |
| 35 to 64 Years | 0 (0.0%) | 0 (0.0%) |
| 65 to 74 Years | 0 (0.0%) | 0 (0.0%) |
| 75 Years and over | 0 (0.0%) | 0 (0.0%) |
Disability Class: Cognitive Difficulty
| Age Bracket | Male | Female |
| 5 to 17 Years | 0 (0.0%) | 0 (0.0%) |
| 18 to 34 Years | 0 (0.0%) | 0 (0.0%) |
| 35 to 64 Years | 0 (0.0%) | 0 (0.0%) |
| 65 to 74 Years | 0 (0.0%) | 0 (0.0%) |
| 75 Years and over | 0 (0.0%) | 0 (0.0%) |
Disability Class: Ambulatory Difficulty
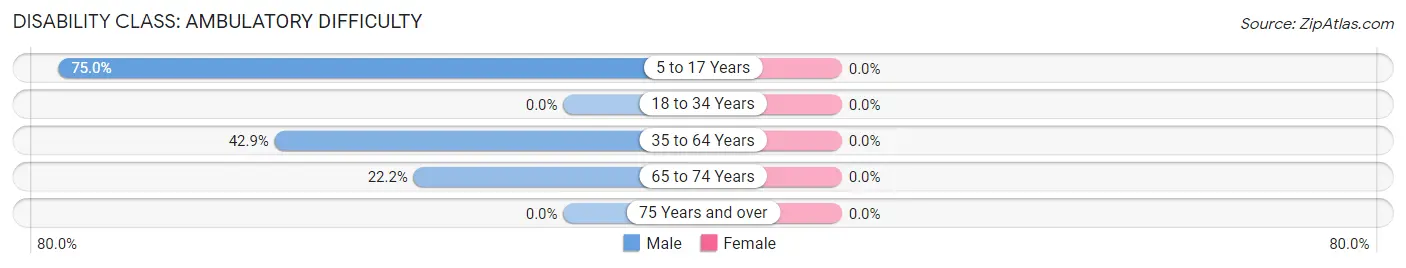
| Age Bracket | Male | Female |
| 5 to 17 Years | 3 (75.0%) | 0 (0.0%) |
| 18 to 34 Years | 0 (0.0%) | 0 (0.0%) |
| 35 to 64 Years | 3 (42.9%) | 0 (0.0%) |
| 65 to 74 Years | 2 (22.2%) | 0 (0.0%) |
| 75 Years and over | 0 (0.0%) | 0 (0.0%) |
Disability Class: Self-Care Difficulty
| Age Bracket | Male | Female |
| 5 to 17 Years | 0 (0.0%) | 0 (0.0%) |
| 18 to 34 Years | 0 (0.0%) | 0 (0.0%) |
| 35 to 64 Years | 0 (0.0%) | 0 (0.0%) |
| 65 to 74 Years | 0 (0.0%) | 0 (0.0%) |
| 75 Years and over | 0 (0.0%) | 0 (0.0%) |
Technology Access in Cayuse
Computing Device Access in Cayuse
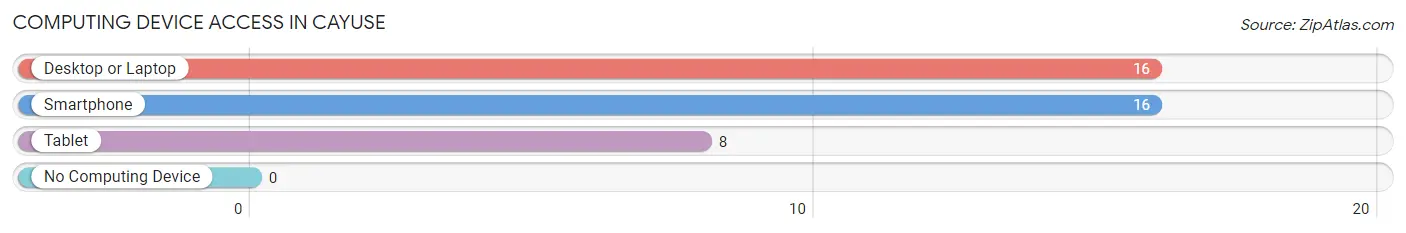
| Device Type | # Households | % Households |
| Desktop or Laptop | 16 | 84.2% |
| Smartphone | 16 | 84.2% |
| Tablet | 8 | 42.1% |
| No Computing Device | 0 | 0.0% |
| Total | 19 | 100.0% |
Internet Access in Cayuse
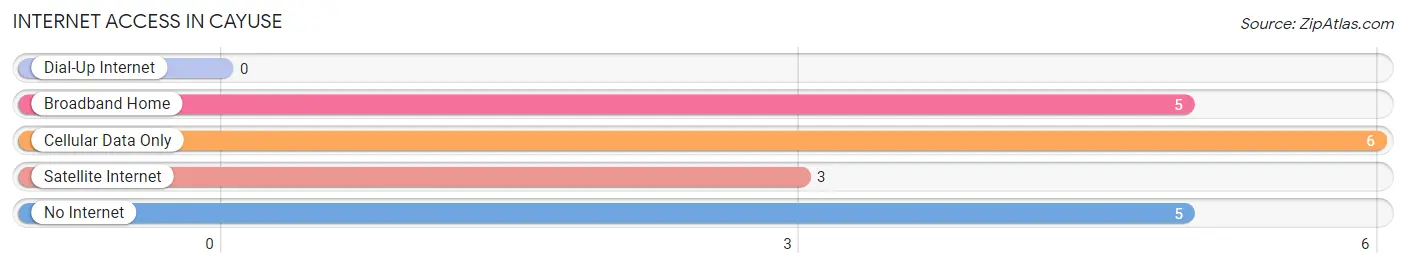
| Internet Type | # Households | % Households |
| Dial-Up Internet | 0 | 0.0% |
| Broadband Home | 5 | 26.3% |
| Cellular Data Only | 6 | 31.6% |
| Satellite Internet | 3 | 15.8% |
| No Internet | 5 | 26.3% |
| Total | 19 | 100.0% |
Cayuse Summary
Cayuse, Oregon is a small unincorporated community located in the foothills of the Blue Mountains in Umatilla County, Oregon. The town is situated along the Umatilla River, approximately 10 miles east of Pendleton. The population of Cayuse was estimated to be around 200 people in 2020.
History
The area that is now Cayuse was originally inhabited by the Cayuse Indians, a tribe of the Umatilla people. The first white settlers arrived in the area in the late 1800s, and the town was officially established in 1883. The town was named after the Cayuse Indians, and the name was chosen by the first postmaster, William H. Smith.
The town grew slowly over the years, and by the early 1900s, it had become a popular stop for travelers on the Oregon Trail. The town was also home to a number of businesses, including a hotel, a general store, a blacksmith shop, and a saloon.
In the early 1900s, the town was also home to a number of Chinese immigrants who had come to the area to work in the local mines. The Chinese immigrants were an important part of the town’s economy, and they helped to build the town’s infrastructure.
Geography
Cayuse is located in the foothills of the Blue Mountains in Umatilla County, Oregon. The town is situated along the Umatilla River, approximately 10 miles east of Pendleton. The town is surrounded by rolling hills and open fields, and the area is known for its scenic beauty.
The climate in Cayuse is semi-arid, with hot summers and cold winters. The average annual temperature is around 50 degrees Fahrenheit, and the average annual precipitation is around 12 inches.
Economy
The economy of Cayuse is largely based on agriculture and tourism. The town is home to a number of farms, and the surrounding area is known for its production of wheat, barley, and hay. The town is also home to a number of tourist attractions, including the Umatilla National Forest and the Umatilla River.
The town is also home to a number of businesses, including a general store, a hotel, and a number of restaurants. The town is also home to a number of small manufacturing businesses, including a woodworking shop and a metal fabrication shop.
Demographics
The population of Cayuse was estimated to be around 200 people in 2020. The town is predominantly white, with a small Hispanic population. The median household income in the town is around $35,000, and the median home value is around $150,000.
The town is served by the Umatilla County School District, and the town is home to a number of churches, including the First Baptist Church of Cayuse. The town is also home to a number of parks and recreational areas, including the Umatilla National Forest and the Umatilla River.
Conclusion
Cayuse, Oregon is a small unincorporated community located in the foothills of the Blue Mountains in Umatilla County, Oregon. The town is situated along the Umatilla River, approximately 10 miles east of Pendleton. The population of Cayuse was estimated to be around 200 people in 2020. The town is predominantly white, with a small Hispanic population. The economy of Cayuse is largely based on agriculture and tourism, and the town is home to a number of businesses, including a general store, a hotel, and a number of restaurants. The town is also home to a number of tourist attractions, including the Umatilla National Forest and the Umatilla River.
Common Questions
What is Per Capita Income in Cayuse?
Per Capita income in Cayuse is $25,928.
What is the Median Family Income in Cayuse?
Median Family Income in Cayuse is $78,750.
What is the Median Household income in Cayuse?
Median Household Income in Cayuse is $77,813.
What is Income or Wage Gap in Cayuse?
Income or Wage Gap in Cayuse is 3.4%.
Women in Cayuse earn 96.6 cents for every dollar earned by a man.
What is Inequality or Gini Index in Cayuse?
Inequality or Gini Index in Cayuse is 0.37.
What is the Total Population of Cayuse?
Total Population of Cayuse is 58.
What is the Total Male Population of Cayuse?
Total Male Population of Cayuse is 23.
What is the Total Female Population of Cayuse?
Total Female Population of Cayuse is 35.
What is the Ratio of Males per 100 Females in Cayuse?
There are 65.71 Males per 100 Females in Cayuse.
What is the Ratio of Females per 100 Males in Cayuse?
There are 152.17 Females per 100 Males in Cayuse.
What is the Median Population Age in Cayuse?
Median Population Age in Cayuse is 44.0 Years.
What is the Average Family Size in Cayuse
Average Family Size in Cayuse is 3.4 People.
What is the Average Household Size in Cayuse
Average Household Size in Cayuse is 3.0 People.
How Large is the Labor Force in Cayuse?
There are 19 People in the Labor Forcein in Cayuse.
What is the Percentage of People in the Labor Force in Cayuse?
41.3% of People are in the Labor Force in Cayuse.