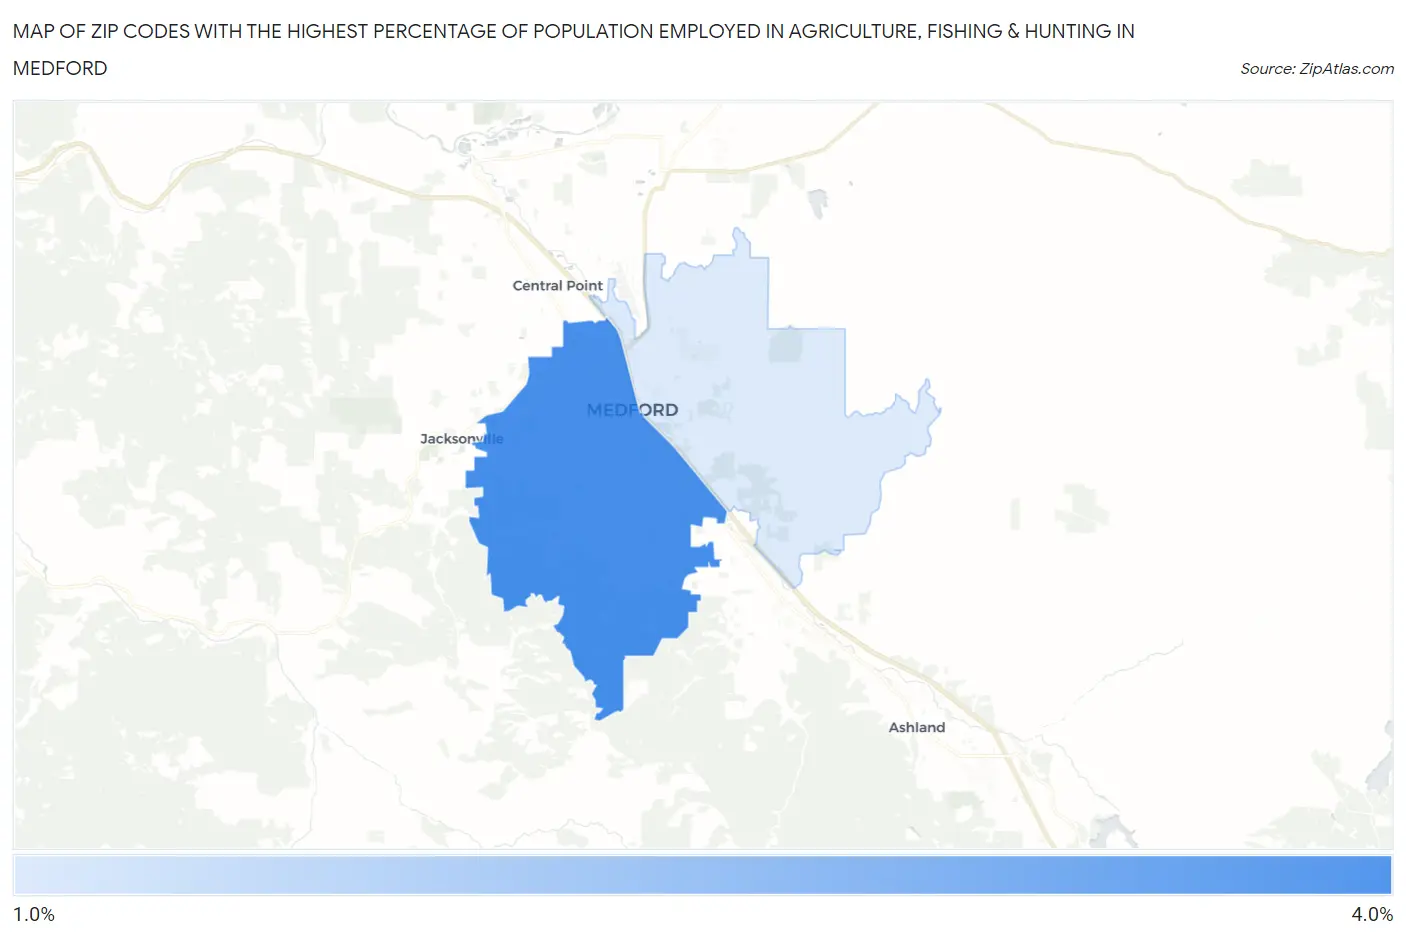
Zip Codes with the Highest Percentage of Population Employed in Agriculture, Fishing & Hunting in Medford, OR
RELATED REPORTS & OPTIONS
Agriculture, Fishing & Hunting
Medford
Compare Zip Codes
Map of Zip Codes with the Highest Percentage of Population Employed in Agriculture, Fishing & Hunting in Medford
1.5%
3.8%
Zip Codes with the Highest Percentage of Population Employed in Agriculture, Fishing & Hunting in Medford, OR
| Zip Code | % Employed | vs State | vs National | |
| 1. | 97501 | 3.8% | 2.7%(+1.07)#219 | 1.2%(+2.60)#9,303 |
| 2. | 97504 | 1.5% | 2.7%(-1.26)#303 | 1.2%(+0.270)#14,406 |
1
Common Questions
What are the Top Zip Codes with the Highest Percentage of Population Employed in Agriculture, Fishing & Hunting in Medford, OR?
Top Zip Codes with the Highest Percentage of Population Employed in Agriculture, Fishing & Hunting in Medford, OR are:
What zip code has the Highest Percentage of Population Employed in Agriculture, Fishing & Hunting in Medford, OR?
97501 has the Highest Percentage of Population Employed in Agriculture, Fishing & Hunting in Medford, OR with 3.8%.
What is the Percentage of Population Employed in Agriculture, Fishing & Hunting in Medford, OR?
Percentage of Population Employed in Agriculture, Fishing & Hunting in Medford is 2.7%.
What is the Percentage of Population Employed in Agriculture, Fishing & Hunting in Oregon?
Percentage of Population Employed in Agriculture, Fishing & Hunting in Oregon is 2.7%.
What is the Percentage of Population Employed in Agriculture, Fishing & Hunting in the United States?
Percentage of Population Employed in Agriculture, Fishing & Hunting in the United States is 1.2%.