Zip Codes with the Highest Percentage of Population Employed in Agriculture, Fishing & Hunting in Beaverton, OR
RELATED REPORTS & OPTIONS
Agriculture, Fishing & Hunting
Beaverton
Compare Zip Codes
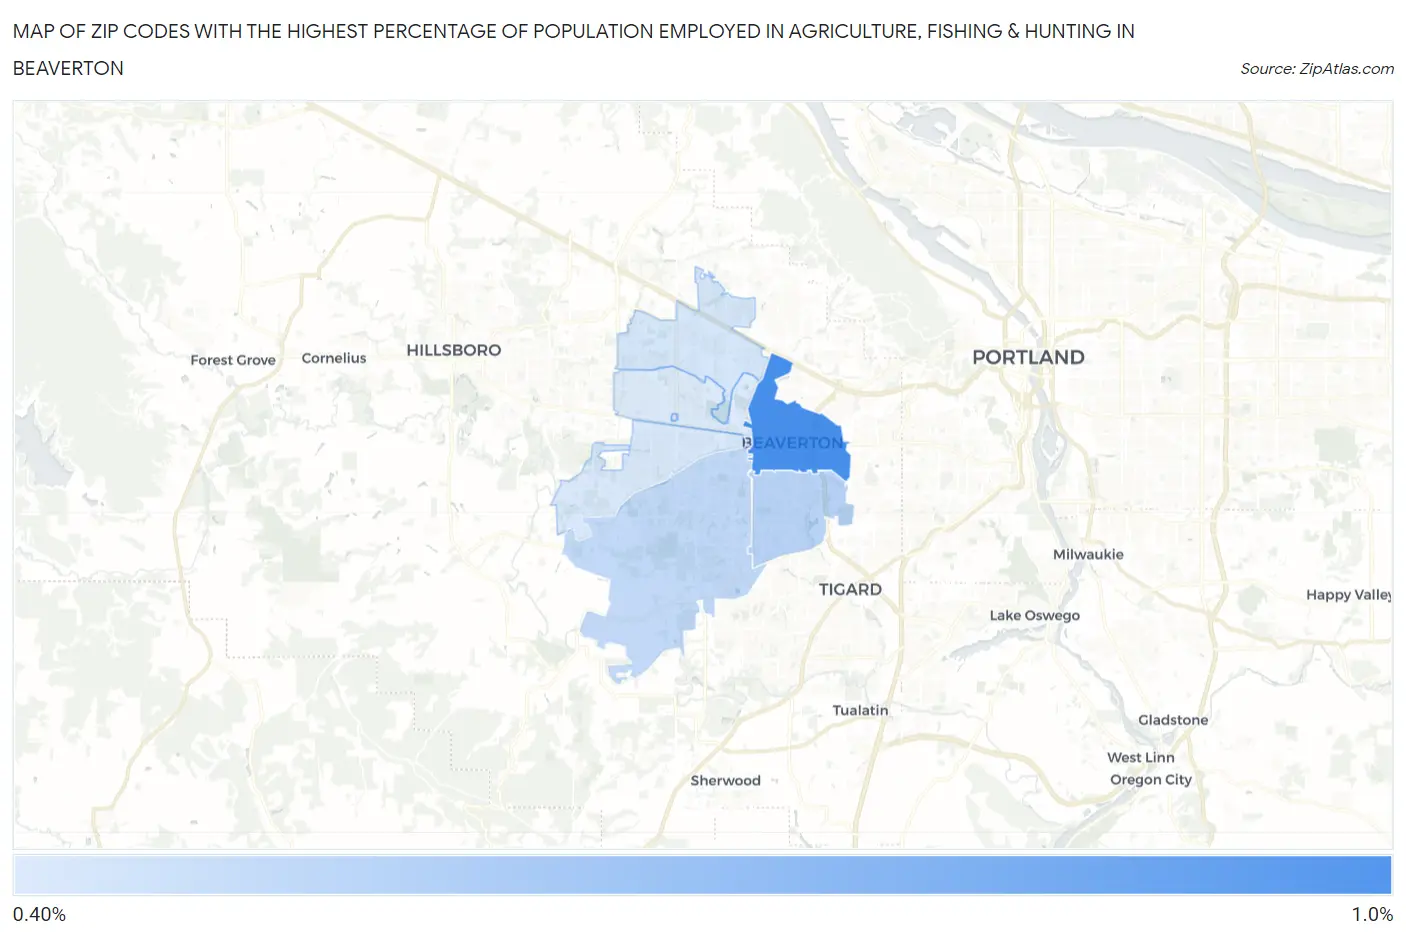
Map of Zip Codes with the Highest Percentage of Population Employed in Agriculture, Fishing & Hunting in Beaverton
0.44%
0.91%
Zip Codes with the Highest Percentage of Population Employed in Agriculture, Fishing & Hunting in Beaverton, OR
| Zip Code | % Employed | vs State | vs National | |
| 1. | 97005 | 0.91% | 2.7%(-1.81)#325 | 1.2%(-0.288)#16,649 |
| 2. | 97008 | 0.56% | 2.7%(-2.16)#346 | 1.2%(-0.640)#18,774 |
| 3. | 97007 | 0.53% | 2.7%(-2.19)#349 | 1.2%(-0.666)#18,983 |
| 4. | 97006 | 0.47% | 2.7%(-2.26)#351 | 1.2%(-0.734)#19,573 |
| 5. | 97078 | 0.46% | 2.7%(-2.27)#352 | 1.2%(-0.744)#19,652 |
| 6. | 97003 | 0.44% | 2.7%(-2.28)#353 | 1.2%(-0.755)#19,749 |
1
Common Questions
What are the Top 5 Zip Codes with the Highest Percentage of Population Employed in Agriculture, Fishing & Hunting in Beaverton, OR?
Top 5 Zip Codes with the Highest Percentage of Population Employed in Agriculture, Fishing & Hunting in Beaverton, OR are:
What zip code has the Highest Percentage of Population Employed in Agriculture, Fishing & Hunting in Beaverton, OR?
97005 has the Highest Percentage of Population Employed in Agriculture, Fishing & Hunting in Beaverton, OR with 0.91%.
What is the Percentage of Population Employed in Agriculture, Fishing & Hunting in Beaverton, OR?
Percentage of Population Employed in Agriculture, Fishing & Hunting in Beaverton is 0.53%.
What is the Percentage of Population Employed in Agriculture, Fishing & Hunting in Oregon?
Percentage of Population Employed in Agriculture, Fishing & Hunting in Oregon is 2.7%.
What is the Percentage of Population Employed in Agriculture, Fishing & Hunting in the United States?
Percentage of Population Employed in Agriculture, Fishing & Hunting in the United States is 1.2%.