Zip Codes with the Highest Percentage of Population with a Degree in Visual and Performing Arts in Missouri
RELATED REPORTS & OPTIONS
Visual and Performing Arts
Missouri
Compare Zip Codes
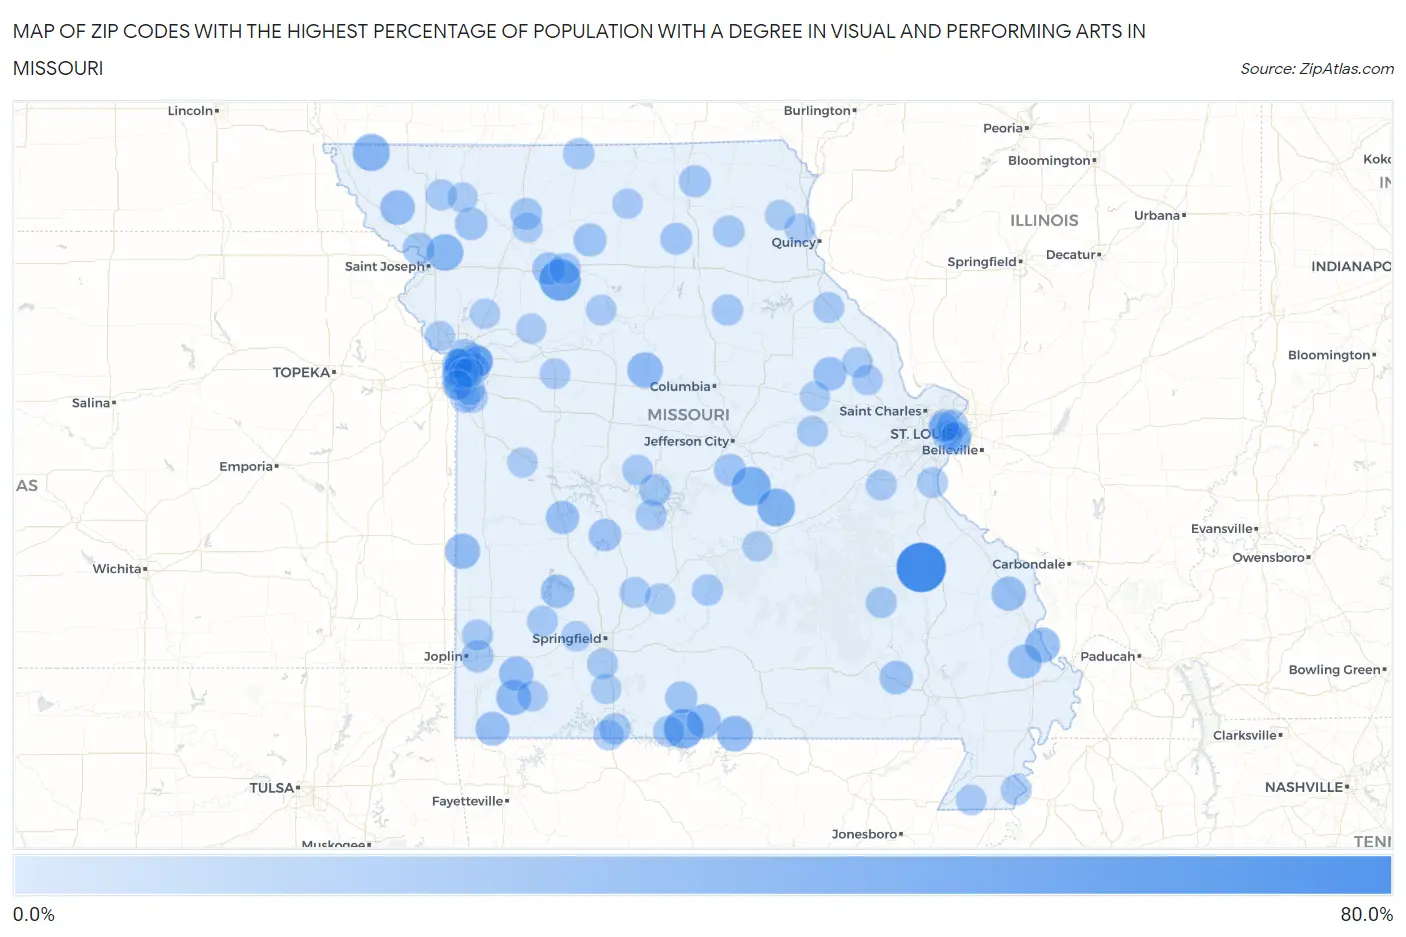
Map of Zip Codes with the Highest Percentage of Population with a Degree in Visual and Performing Arts in Missouri
0.0%
80.0%
Zip Codes with the Highest Percentage of Population with a Degree in Visual and Performing Arts in Missouri
| Zip Code | % Graduates | vs State | vs National | |
| 1. | 63637 | 70.0% | 3.8%(+66.2)#1 | 4.3%(+65.7)#37 |
| 2. | 64656 | 42.9% | 3.8%(+39.1)#2 | 4.3%(+38.6)#115 |
| 3. | 65676 | 37.0% | 3.8%(+33.3)#3 | 4.3%(+32.8)#138 |
| 4. | 65001 | 34.8% | 3.8%(+31.0)#4 | 4.3%(+30.5)#154 |
| 5. | 65580 | 30.4% | 3.8%(+26.6)#5 | 4.3%(+26.1)#215 |
| 6. | 64498 | 28.8% | 3.8%(+25.1)#6 | 4.3%(+24.6)#240 |
| 7. | 64436 | 27.1% | 3.8%(+23.3)#7 | 4.3%(+22.8)#271 |
| 8. | 65609 | 24.3% | 3.8%(+20.6)#8 | 4.3%(+20.1)#330 |
| 9. | 65320 | 23.8% | 3.8%(+20.0)#9 | 4.3%(+19.6)#341 |
| 10. | 64741 | 22.6% | 3.8%(+18.8)#10 | 4.3%(+18.3)#378 |
| 11. | 63742 | 22.2% | 3.8%(+18.5)#11 | 4.3%(+18.0)#391 |
| 12. | 64842 | 22.1% | 3.8%(+18.4)#12 | 4.3%(+17.9)#393 |
| 13. | 64466 | 20.9% | 3.8%(+17.2)#13 | 4.3%(+16.7)#434 |
| 14. | 64054 | 20.0% | 3.8%(+16.2)#14 | 4.3%(+15.7)#472 |
| 15. | 63769 | 19.6% | 3.8%(+15.9)#15 | 4.3%(+15.4)#481 |
| 16. | 65723 | 19.6% | 3.8%(+15.8)#16 | 4.3%(+15.4)#482 |
| 17. | 65655 | 19.5% | 3.8%(+15.7)#17 | 4.3%(+15.3)#488 |
| 18. | 64856 | 18.7% | 3.8%(+14.9)#18 | 4.3%(+14.4)#535 |
| 19. | 63767 | 18.5% | 3.8%(+14.7)#19 | 4.3%(+14.3)#544 |
| 20. | 63937 | 17.2% | 3.8%(+13.4)#20 | 4.3%(+13.0)#629 |
| 21. | 65635 | 16.9% | 3.8%(+13.2)#21 | 4.3%(+12.7)#644 |
| 22. | 63333 | 16.7% | 3.8%(+12.9)#22 | 4.3%(+12.4)#662 |
| 23. | 64776 | 16.4% | 3.8%(+12.6)#23 | 4.3%(+12.1)#677 |
| 24. | 64635 | 15.9% | 3.8%(+12.1)#24 | 4.3%(+11.7)#721 |
| 25. | 64625 | 15.3% | 3.8%(+11.5)#25 | 4.3%(+11.0)#782 |
| 26. | 64124 | 15.1% | 3.8%(+11.3)#26 | 4.3%(+10.8)#805 |
| 27. | 64463 | 14.7% | 3.8%(+10.9)#27 | 4.3%(+10.4)#850 |
| 28. | 65668 | 14.3% | 3.8%(+10.5)#28 | 4.3%(+10.0)#903 |
| 29. | 64126 | 14.2% | 3.8%(+10.4)#29 | 4.3%(+9.97)#929 |
| 30. | 64421 | 13.5% | 3.8%(+9.74)#30 | 4.3%(+9.26)#1,017 |
| 31. | 64841 | 13.2% | 3.8%(+9.44)#31 | 4.3%(+8.96)#1,067 |
| 32. | 65755 | 12.9% | 3.8%(+9.13)#32 | 4.3%(+8.65)#1,124 |
| 33. | 63546 | 12.9% | 3.8%(+9.10)#33 | 4.3%(+8.62)#1,129 |
| 34. | 65076 | 12.7% | 3.8%(+8.94)#34 | 4.3%(+8.46)#1,145 |
| 35. | 63538 | 12.5% | 3.8%(+8.73)#35 | 4.3%(+8.25)#1,196 |
| 36. | 64117 | 12.4% | 3.8%(+8.62)#36 | 4.3%(+8.14)#1,212 |
| 37. | 65037 | 12.2% | 3.8%(+8.47)#37 | 4.3%(+7.99)#1,242 |
| 38. | 64636 | 11.8% | 3.8%(+7.99)#38 | 4.3%(+7.51)#1,335 |
| 39. | 64052 | 11.5% | 3.8%(+7.77)#39 | 4.3%(+7.29)#1,388 |
| 40. | 64110 | 11.5% | 3.8%(+7.76)#40 | 4.3%(+7.28)#1,392 |
| 41. | 64109 | 11.2% | 3.8%(+7.44)#41 | 4.3%(+6.95)#1,468 |
| 42. | 63460 | 11.1% | 3.8%(+7.34)#42 | 4.3%(+6.86)#1,502 |
| 43. | 64664 | 11.1% | 3.8%(+7.34)#43 | 4.3%(+6.86)#1,504 |
| 44. | 65672 | 10.6% | 3.8%(+6.85)#44 | 4.3%(+6.37)#1,648 |
| 45. | 64661 | 10.4% | 3.8%(+6.63)#45 | 4.3%(+6.15)#1,706 |
| 46. | 63133 | 10.3% | 3.8%(+6.51)#46 | 4.3%(+6.03)#1,744 |
| 47. | 65263 | 10.0% | 3.8%(+6.23)#47 | 4.3%(+5.75)#1,827 |
| 48. | 65470 | 10.0% | 3.8%(+6.23)#48 | 4.3%(+5.75)#1,833 |
| 49. | 64434 | 9.9% | 3.8%(+6.09)#49 | 4.3%(+5.61)#1,885 |
| 50. | 65761 | 9.8% | 3.8%(+5.99)#50 | 4.3%(+5.50)#1,921 |
| 51. | 63118 | 9.5% | 3.8%(+5.73)#51 | 4.3%(+5.25)#2,022 |
| 52. | 65644 | 9.5% | 3.8%(+5.72)#52 | 4.3%(+5.24)#2,025 |
| 53. | 65787 | 9.2% | 3.8%(+5.48)#53 | 4.3%(+5.00)#2,143 |
| 54. | 64830 | 9.2% | 3.8%(+5.44)#54 | 4.3%(+4.96)#2,164 |
| 55. | 64113 | 9.2% | 3.8%(+5.42)#55 | 4.3%(+4.94)#2,172 |
| 56. | 65752 | 9.2% | 3.8%(+5.41)#56 | 4.3%(+4.93)#2,177 |
| 57. | 63654 | 9.1% | 3.8%(+5.32)#57 | 4.3%(+4.84)#2,221 |
| 58. | 64131 | 9.0% | 3.8%(+5.25)#58 | 4.3%(+4.76)#2,257 |
| 59. | 63070 | 8.9% | 3.8%(+5.15)#59 | 4.3%(+4.67)#2,294 |
| 60. | 64050 | 8.9% | 3.8%(+5.12)#60 | 4.3%(+4.63)#2,314 |
| 61. | 63441 | 8.8% | 3.8%(+5.05)#61 | 4.3%(+4.57)#2,341 |
| 62. | 65041 | 8.8% | 3.8%(+5.03)#62 | 4.3%(+4.55)#2,358 |
| 63. | 63830 | 8.8% | 3.8%(+5.01)#63 | 4.3%(+4.53)#2,367 |
| 64. | 63115 | 8.8% | 3.8%(+5.00)#64 | 4.3%(+4.52)#2,373 |
| 65. | 65714 | 8.8% | 3.8%(+5.00)#65 | 4.3%(+4.52)#2,377 |
| 66. | 65632 | 8.5% | 3.8%(+4.68)#66 | 4.3%(+4.20)#2,561 |
| 67. | 63060 | 8.4% | 3.8%(+4.65)#67 | 4.3%(+4.17)#2,587 |
| 68. | 64111 | 8.4% | 3.8%(+4.61)#68 | 4.3%(+4.13)#2,607 |
| 69. | 63377 | 8.3% | 3.8%(+4.56)#69 | 4.3%(+4.08)#2,630 |
| 70. | 63139 | 8.3% | 3.8%(+4.50)#70 | 4.3%(+4.02)#2,676 |
| 71. | 65739 | 8.2% | 3.8%(+4.43)#71 | 4.3%(+3.95)#2,718 |
| 72. | 65734 | 8.2% | 3.8%(+4.38)#72 | 4.3%(+3.90)#2,748 |
| 73. | 64037 | 8.1% | 3.8%(+4.35)#73 | 4.3%(+3.87)#2,768 |
| 74. | 63855 | 8.1% | 3.8%(+4.34)#74 | 4.3%(+3.86)#2,775 |
| 75. | 63448 | 8.1% | 3.8%(+4.30)#75 | 4.3%(+3.82)#2,793 |
| 76. | 65078 | 8.0% | 3.8%(+4.26)#76 | 4.3%(+3.78)#2,820 |
| 77. | 64623 | 7.9% | 3.8%(+4.12)#77 | 4.3%(+3.64)#2,931 |
| 78. | 63379 | 7.8% | 3.8%(+4.04)#78 | 4.3%(+3.56)#2,982 |
| 79. | 64149 | 7.7% | 3.8%(+3.92)#79 | 4.3%(+3.44)#3,073 |
| 80. | 63556 | 7.6% | 3.8%(+3.88)#80 | 4.3%(+3.40)#3,106 |
| 81. | 64030 | 7.6% | 3.8%(+3.85)#81 | 4.3%(+3.37)#3,128 |
| 82. | 65754 | 7.5% | 3.8%(+3.71)#82 | 4.3%(+3.23)#3,224 |
| 83. | 64106 | 7.5% | 3.8%(+3.69)#83 | 4.3%(+3.21)#3,250 |
| 84. | 63104 | 7.4% | 3.8%(+3.68)#84 | 4.3%(+3.20)#3,258 |
| 85. | 64788 | 7.4% | 3.8%(+3.64)#85 | 4.3%(+3.16)#3,286 |
| 86. | 65612 | 7.4% | 3.8%(+3.59)#86 | 4.3%(+3.11)#3,318 |
| 87. | 63452 | 7.4% | 3.8%(+3.58)#87 | 4.3%(+3.10)#3,329 |
| 88. | 64134 | 7.3% | 3.8%(+3.52)#88 | 4.3%(+3.04)#3,379 |
| 89. | 64085 | 7.3% | 3.8%(+3.49)#89 | 4.3%(+3.01)#3,421 |
| 90. | 64153 | 7.1% | 3.8%(+3.33)#90 | 4.3%(+2.85)#3,552 |
| 91. | 64105 | 7.1% | 3.8%(+3.32)#91 | 4.3%(+2.84)#3,571 |
| 92. | 64130 | 7.0% | 3.8%(+3.24)#92 | 4.3%(+2.76)#3,654 |
| 93. | 65550 | 7.0% | 3.8%(+3.24)#93 | 4.3%(+2.75)#3,658 |
| 94. | 64129 | 7.0% | 3.8%(+3.21)#94 | 4.3%(+2.72)#3,684 |
| 95. | 64647 | 7.0% | 3.8%(+3.21)#95 | 4.3%(+2.72)#3,687 |
| 96. | 64489 | 7.0% | 3.8%(+3.19)#96 | 4.3%(+2.71)#3,701 |
| 97. | 63130 | 6.9% | 3.8%(+3.14)#97 | 4.3%(+2.66)#3,747 |
| 98. | 63363 | 6.9% | 3.8%(+3.09)#98 | 4.3%(+2.61)#3,802 |
| 99. | 64114 | 6.9% | 3.8%(+3.09)#99 | 4.3%(+2.60)#3,808 |
| 100. | 64048 | 6.8% | 3.8%(+3.00)#100 | 4.3%(+2.52)#3,904 |
Common Questions
What are the Top 10 Zip Codes with the Highest Percentage of Population with a Degree in Visual and Performing Arts in Missouri?
Top 10 Zip Codes with the Highest Percentage of Population with a Degree in Visual and Performing Arts in Missouri are:
What zip code has the Highest Percentage of Population with a Degree in Visual and Performing Arts in Missouri?
63637 has the Highest Percentage of Population with a Degree in Visual and Performing Arts in Missouri with 70.0%.
What is the Percentage of Population with a Degree in Visual and Performing Arts in the State of Missouri?
Percentage of Population with a Degree in Visual and Performing Arts in Missouri is 3.8%.
What is the Percentage of Population with a Degree in Visual and Performing Arts in the United States?
Percentage of Population with a Degree in Visual and Performing Arts in the United States is 4.3%.