Zip Codes with the Highest Percentage of Population with a Degree in Visual and Performing Arts in Florissant, MO
RELATED REPORTS & OPTIONS
Visual and Performing Arts
Florissant
Compare Zip Codes
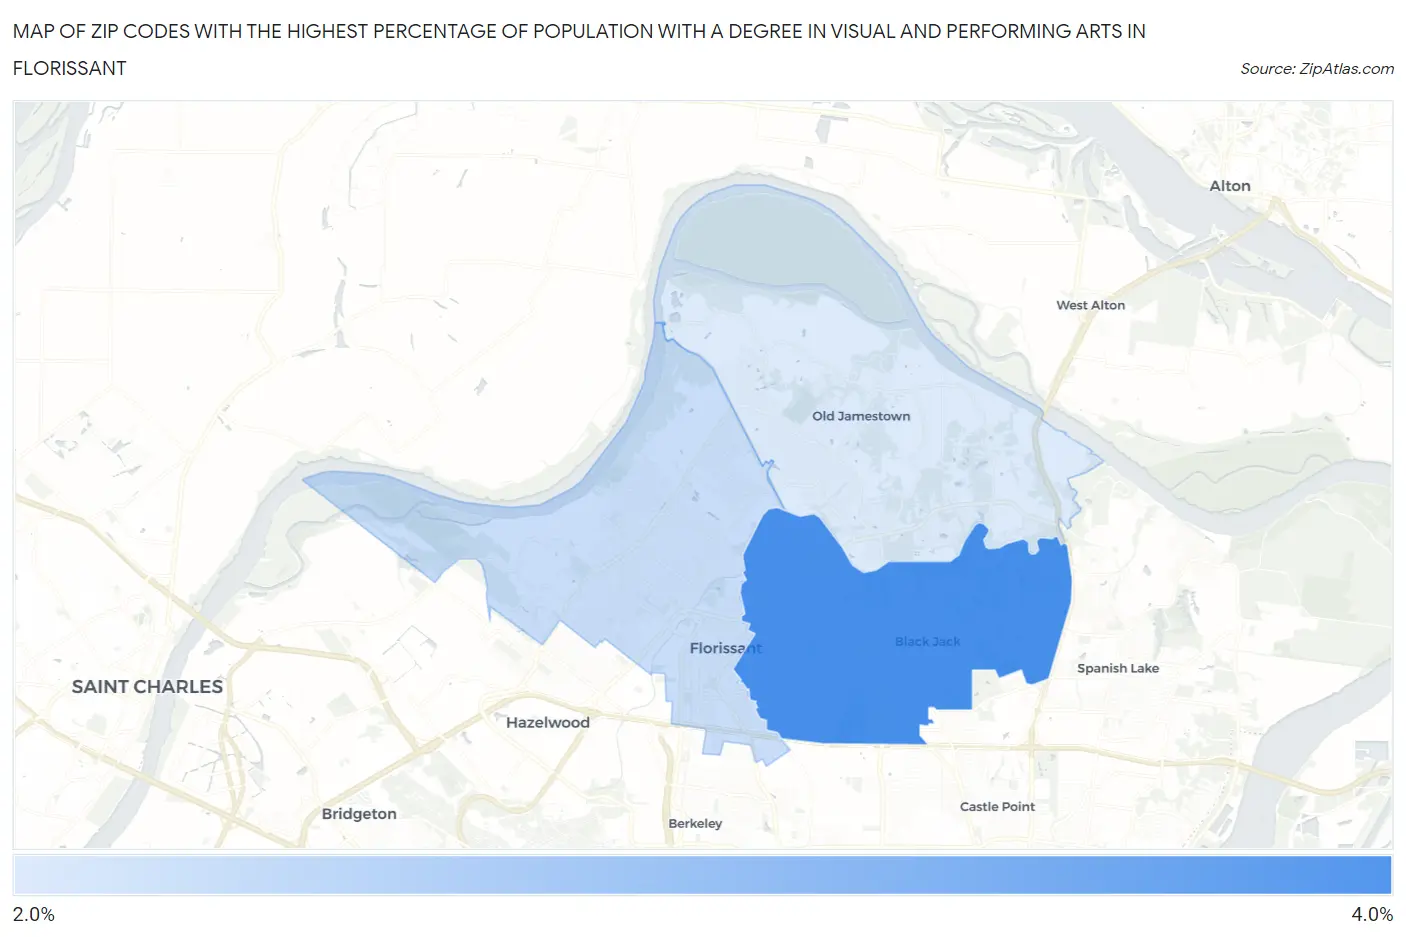
Map of Zip Codes with the Highest Percentage of Population with a Degree in Visual and Performing Arts in Florissant
2.1%
3.9%
Zip Codes with the Highest Percentage of Population with a Degree in Visual and Performing Arts in Florissant, MO
| Zip Code | % Graduates | vs State | vs National | |
| 1. | 63033 | 3.9% | 3.8%(+0.130)#237 | 4.3%(-0.351)#9,573 |
| 2. | 63031 | 2.4% | 3.8%(-1.40)#368 | 4.3%(-1.88)#15,092 |
| 3. | 63034 | 2.1% | 3.8%(-1.63)#389 | 4.3%(-2.11)#15,912 |
1
Common Questions
What are the Top Zip Codes with the Highest Percentage of Population with a Degree in Visual and Performing Arts in Florissant, MO?
Top Zip Codes with the Highest Percentage of Population with a Degree in Visual and Performing Arts in Florissant, MO are:
What zip code has the Highest Percentage of Population with a Degree in Visual and Performing Arts in Florissant, MO?
63033 has the Highest Percentage of Population with a Degree in Visual and Performing Arts in Florissant, MO with 3.9%.
What is the Percentage of Population with a Degree in Visual and Performing Arts in Florissant, MO?
Percentage of Population with a Degree in Visual and Performing Arts in Florissant is 3.0%.
What is the Percentage of Population with a Degree in Visual and Performing Arts in Missouri?
Percentage of Population with a Degree in Visual and Performing Arts in Missouri is 3.8%.
What is the Percentage of Population with a Degree in Visual and Performing Arts in the United States?
Percentage of Population with a Degree in Visual and Performing Arts in the United States is 4.3%.