Leadwood, MO Map & Demographics
Leadwood Map
Leadwood Overview
$18,602
PER CAPITA INCOME
$65,682
AVG FAMILY INCOME
$45,000
AVG HOUSEHOLD INCOME
32.3%
WAGE / INCOME GAP [ % ]
67.7¢/ $1
WAGE / INCOME GAP [ $ ]
$9,144
FAMILY INCOME DEFICIT
0.45
INEQUALITY / GINI INDEX
1,475
TOTAL POPULATION
583
MALE POPULATION
892
FEMALE POPULATION
65.36
MALES / 100 FEMALES
153.00
FEMALES / 100 MALES
34.1
MEDIAN AGE
3.3
AVG FAMILY SIZE
3.0
AVG HOUSEHOLD SIZE
571
LABOR FORCE [ PEOPLE ]
50.8%
PERCENT IN LABOR FORCE
6.8%
UNEMPLOYMENT RATE
Leadwood Zip Codes
Leadwood Area Codes
Income in Leadwood
Income Overview in Leadwood
Per Capita Income in Leadwood is $18,602, while median incomes of families and households are $65,682 and $45,000 respectively.
| Characteristic | Number | Measure |
| Per Capita Income | 1,475 | $18,602 |
| Median Family Income | 338 | $65,682 |
| Mean Family Income | 338 | $69,699 |
| Median Household Income | 500 | $45,000 |
| Mean Household Income | 500 | $56,781 |
| Income Deficit | 338 | $9,144 |
| Wage / Income Gap (%) | 1,475 | 32.32% |
| Wage / Income Gap ($) | 1,475 | 67.68¢ per $1 |
| Gini / Inequality Index | 1,475 | 0.45 |
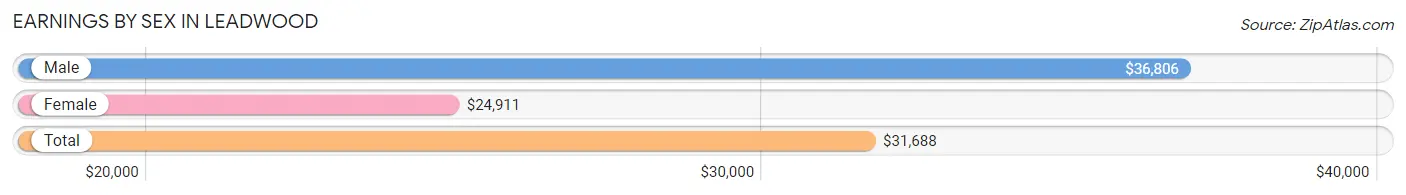
Earnings by Sex in Leadwood
Average Earnings in Leadwood are $31,688, $36,806 for men and $24,911 for women, a difference of 32.3%.
| Sex | Number | Average Earnings |
| Male | 326 (56.3%) | $36,806 |
| Female | 253 (43.7%) | $24,911 |
| Total | 579 (100.0%) | $31,688 |
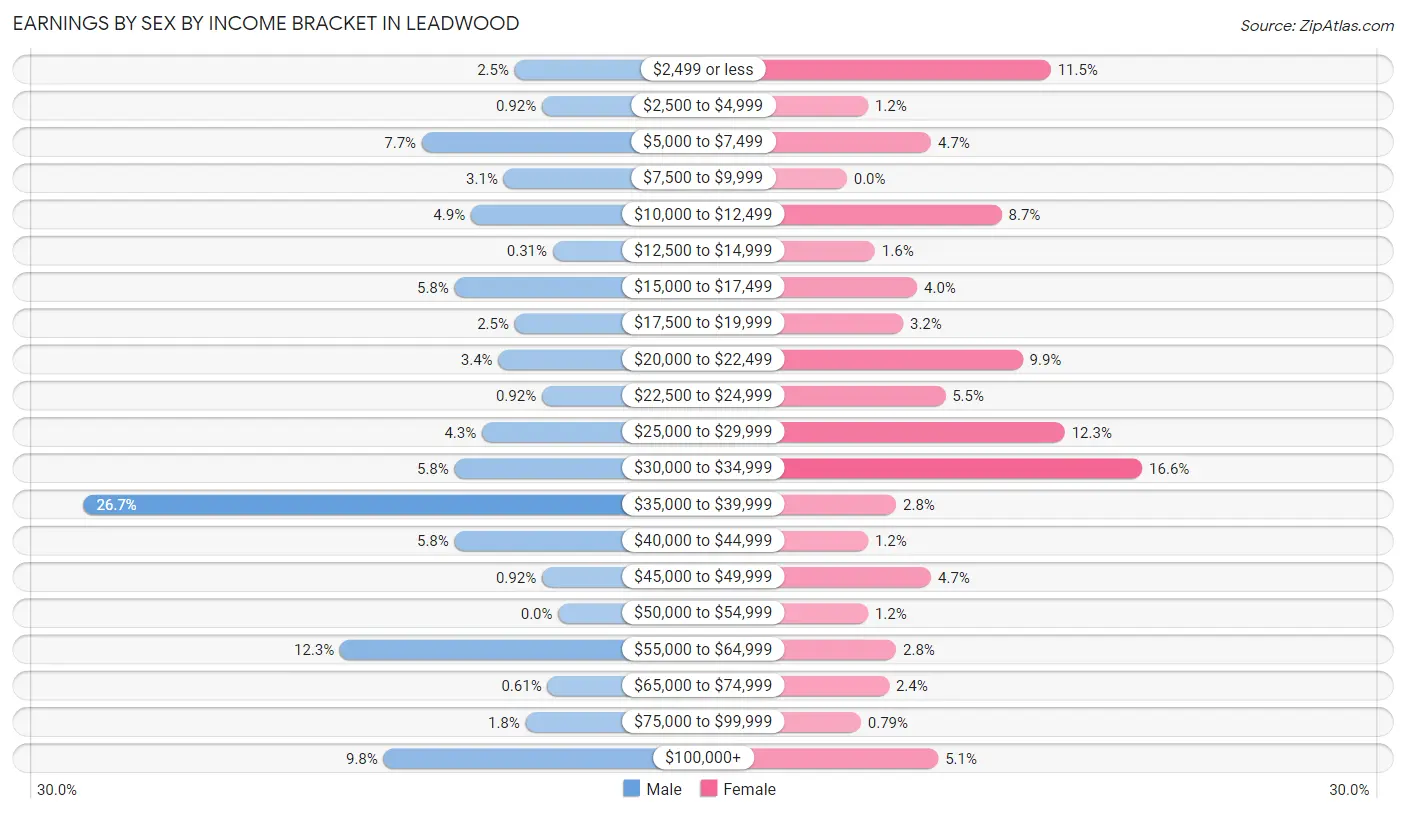
Earnings by Sex by Income Bracket in Leadwood
The most common earnings brackets in Leadwood are $35,000 to $39,999 for men (87 | 26.7%) and $30,000 to $34,999 for women (42 | 16.6%).
| Income | Male | Female |
| $2,499 or less | 8 (2.5%) | 29 (11.5%) |
| $2,500 to $4,999 | 3 (0.9%) | 3 (1.2%) |
| $5,000 to $7,499 | 25 (7.7%) | 12 (4.7%) |
| $7,500 to $9,999 | 10 (3.1%) | 0 (0.0%) |
| $10,000 to $12,499 | 16 (4.9%) | 22 (8.7%) |
| $12,500 to $14,999 | 1 (0.3%) | 4 (1.6%) |
| $15,000 to $17,499 | 19 (5.8%) | 10 (4.0%) |
| $17,500 to $19,999 | 8 (2.5%) | 8 (3.2%) |
| $20,000 to $22,499 | 11 (3.4%) | 25 (9.9%) |
| $22,500 to $24,999 | 3 (0.9%) | 14 (5.5%) |
| $25,000 to $29,999 | 14 (4.3%) | 31 (12.2%) |
| $30,000 to $34,999 | 19 (5.8%) | 42 (16.6%) |
| $35,000 to $39,999 | 87 (26.7%) | 7 (2.8%) |
| $40,000 to $44,999 | 19 (5.8%) | 3 (1.2%) |
| $45,000 to $49,999 | 3 (0.9%) | 12 (4.7%) |
| $50,000 to $54,999 | 0 (0.0%) | 3 (1.2%) |
| $55,000 to $64,999 | 40 (12.3%) | 7 (2.8%) |
| $65,000 to $74,999 | 2 (0.6%) | 6 (2.4%) |
| $75,000 to $99,999 | 6 (1.8%) | 2 (0.8%) |
| $100,000+ | 32 (9.8%) | 13 (5.1%) |
| Total | 326 (100.0%) | 253 (100.0%) |
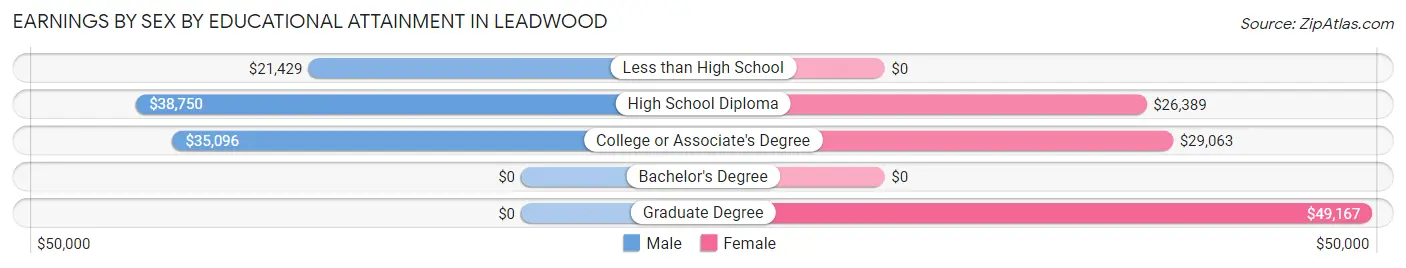
Earnings by Sex by Educational Attainment in Leadwood
Average earnings in Leadwood are $36,250 for men and $26,447 for women, a difference of 27.0%. Men with an educational attainment of high school diploma enjoy the highest average annual earnings of $38,750, while those with less than high school education earn the least with $21,429. Women with an educational attainment of graduate degree earn the most with the average annual earnings of $49,167, while those with high school diploma education have the smallest earnings of $26,389.
| Educational Attainment | Male Income | Female Income |
| Less than High School | $21,429 | $0 |
| High School Diploma | $38,750 | $26,389 |
| College or Associate's Degree | $35,096 | $29,063 |
| Bachelor's Degree | - | - |
| Graduate Degree | - | - |
| Total | $36,250 | $26,447 |
Family Income in Leadwood
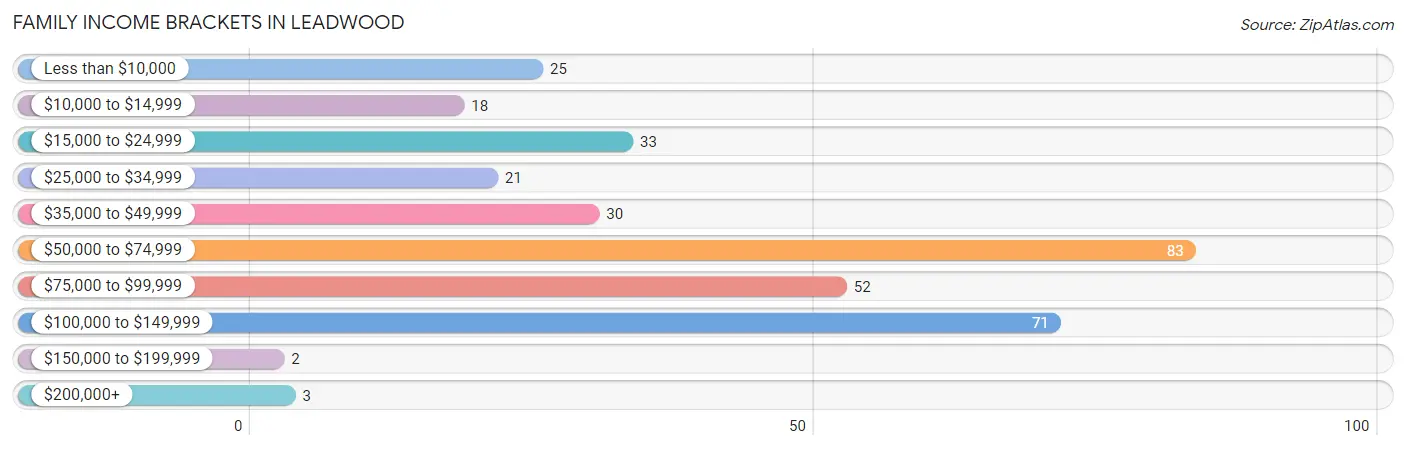
Family Income Brackets in Leadwood
According to the Leadwood family income data, there are 83 families falling into the $50,000 to $74,999 income range, which is the most common income bracket and makes up 24.6% of all families. Conversely, the $150,000 to $199,999 income bracket is the least frequent group with only 2 families (0.6%) belonging to this category.
| Income Bracket | # Families | % Families |
| Less than $10,000 | 25 | 7.4% |
| $10,000 to $14,999 | 18 | 5.3% |
| $15,000 to $24,999 | 33 | 9.8% |
| $25,000 to $34,999 | 21 | 6.2% |
| $35,000 to $49,999 | 30 | 8.9% |
| $50,000 to $74,999 | 83 | 24.6% |
| $75,000 to $99,999 | 52 | 15.4% |
| $100,000 to $149,999 | 71 | 21.0% |
| $150,000 to $199,999 | 2 | 0.6% |
| $200,000+ | 3 | 0.9% |
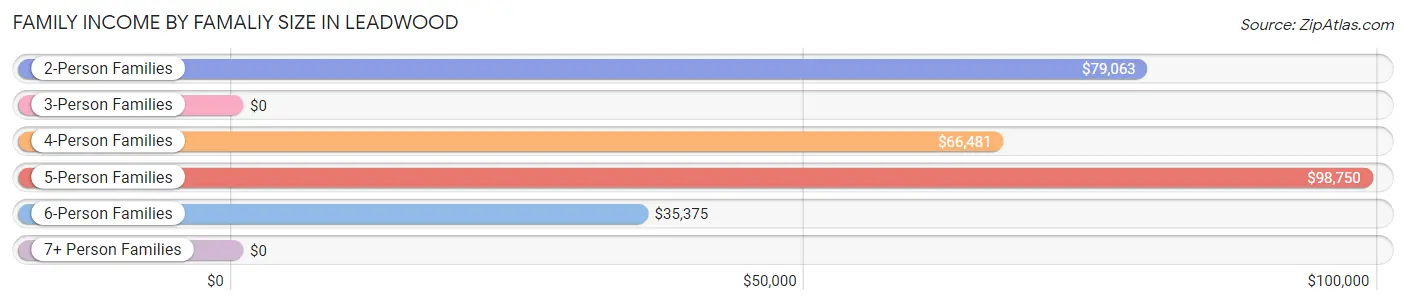
Family Income by Famaliy Size in Leadwood
5-person families (15 | 4.4%) account for the highest median family income in Leadwood with $98,750 per family, while 2-person families (159 | 47.0%) have the highest median income of $39,532 per family member.
| Income Bracket | # Families | Median Income |
| 2-Person Families | 159 (47.0%) | $79,063 |
| 3-Person Families | 89 (26.3%) | $0 |
| 4-Person Families | 46 (13.6%) | $66,481 |
| 5-Person Families | 15 (4.4%) | $98,750 |
| 6-Person Families | 17 (5.0%) | $35,375 |
| 7+ Person Families | 12 (3.5%) | $0 |
| Total | 338 (100.0%) | $65,682 |
Family Income by Number of Earners in Leadwood
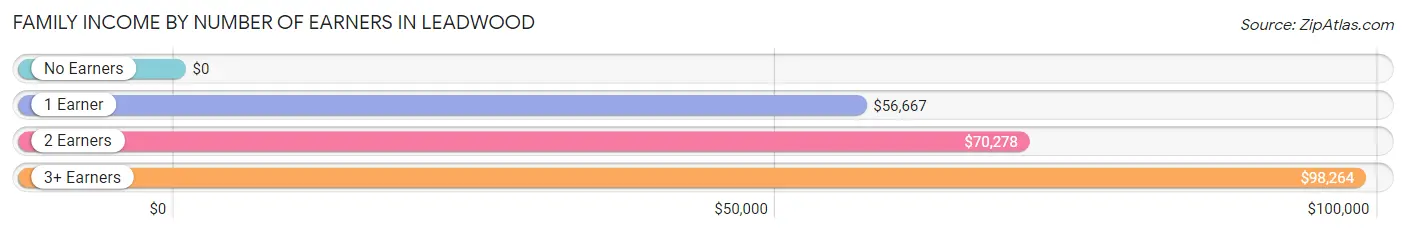
| Number of Earners | # Families | Median Income |
| No Earners | 31 (9.2%) | $0 |
| 1 Earner | 194 (57.4%) | $56,667 |
| 2 Earners | 72 (21.3%) | $70,278 |
| 3+ Earners | 41 (12.1%) | $98,264 |
| Total | 338 (100.0%) | $65,682 |
Household Income in Leadwood
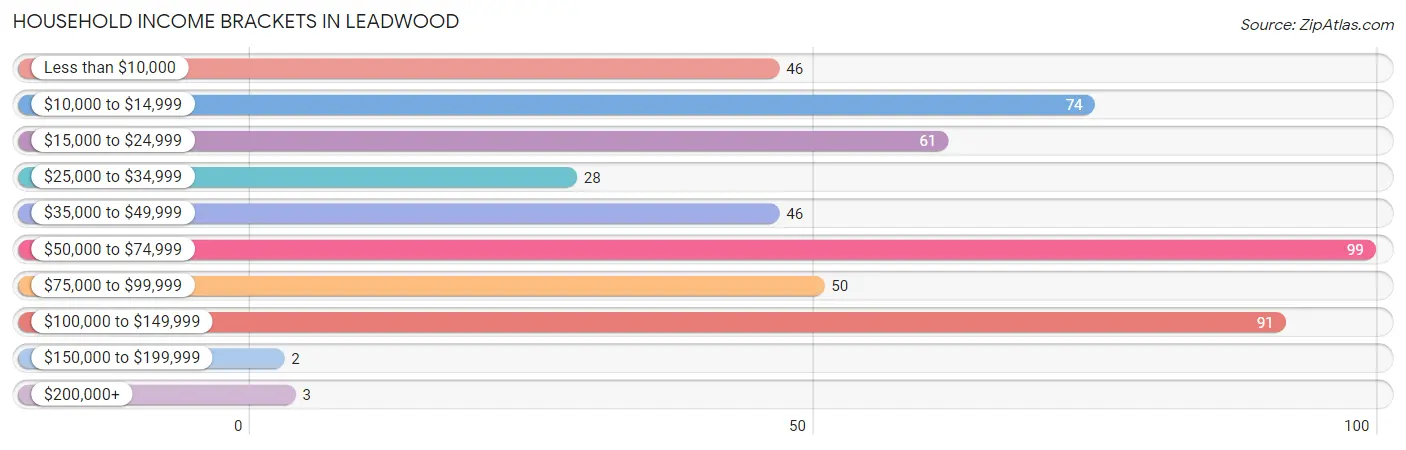
Household Income Brackets in Leadwood
With 99 households falling in the category, the $50,000 to $74,999 income range is the most frequent in Leadwood, accounting for 19.8% of all households. In contrast, only 2 households (0.4%) fall into the $150,000 to $199,999 income bracket, making it the least populous group.
| Income Bracket | # Households | % Households |
| Less than $10,000 | 46 | 9.2% |
| $10,000 to $14,999 | 74 | 14.8% |
| $15,000 to $24,999 | 61 | 12.2% |
| $25,000 to $34,999 | 28 | 5.6% |
| $35,000 to $49,999 | 46 | 9.2% |
| $50,000 to $74,999 | 99 | 19.8% |
| $75,000 to $99,999 | 50 | 10.0% |
| $100,000 to $149,999 | 91 | 18.2% |
| $150,000 to $199,999 | 2 | 0.4% |
| $200,000+ | 3 | 0.6% |
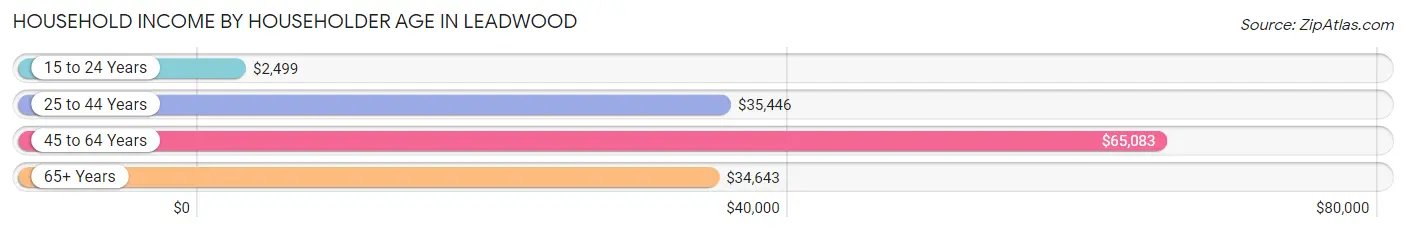
Household Income by Householder Age in Leadwood
The median household income in Leadwood is $45,000, with the highest median household income of $65,083 found in the 45 to 64 years age bracket for the primary householder. A total of 236 households (47.2%) fall into this category. Meanwhile, the 15 to 24 years age bracket for the primary householder has the lowest median household income of $2,499, with 7 households (1.4%) in this group.
| Income Bracket | # Households | Median Income |
| 15 to 24 Years | 7 (1.4%) | $2,499 |
| 25 to 44 Years | 161 (32.2%) | $35,446 |
| 45 to 64 Years | 236 (47.2%) | $65,083 |
| 65+ Years | 96 (19.2%) | $34,643 |
| Total | 500 (100.0%) | $45,000 |
Poverty in Leadwood
Income Below Poverty by Sex and Age in Leadwood
With 30.3% poverty level for males and 40.8% for females among the residents of Leadwood, 16 and 17 year old males and 6 to 11 year old females are the most vulnerable to poverty, with 15 males (88.2%) and 52 females (74.3%) in their respective age groups living below the poverty level.
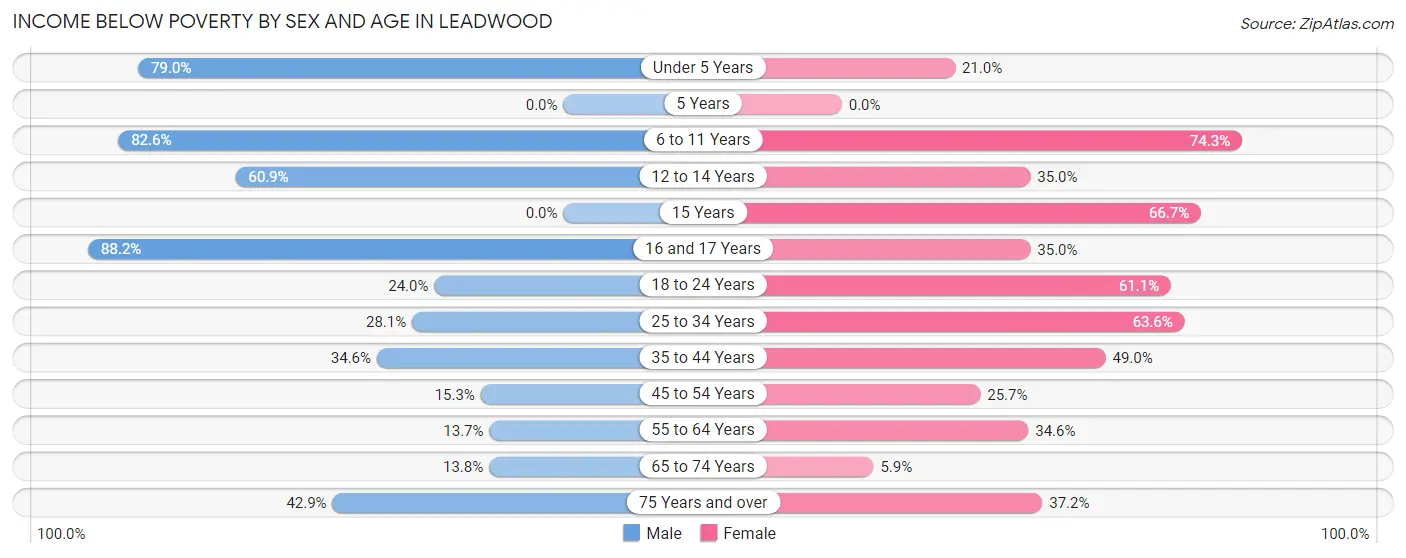
| Age Bracket | Male | Female |
| Under 5 Years | 15 (78.9%) | 25 (21.0%) |
| 5 Years | 0 (0.0%) | 0 (0.0%) |
| 6 to 11 Years | 19 (82.6%) | 52 (74.3%) |
| 12 to 14 Years | 28 (60.9%) | 7 (35.0%) |
| 15 Years | 0 (0.0%) | 6 (66.7%) |
| 16 and 17 Years | 15 (88.2%) | 7 (35.0%) |
| 18 to 24 Years | 23 (24.0%) | 77 (61.1%) |
| 25 to 34 Years | 25 (28.1%) | 42 (63.6%) |
| 35 to 44 Years | 9 (34.6%) | 47 (49.0%) |
| 45 to 54 Years | 25 (15.3%) | 36 (25.7%) |
| 55 to 64 Years | 7 (13.7%) | 36 (34.6%) |
| 65 to 74 Years | 4 (13.8%) | 3 (5.9%) |
| 75 Years and over | 3 (42.9%) | 16 (37.2%) |
| Total | 173 (30.3%) | 354 (40.8%) |
Income Above Poverty by Sex and Age in Leadwood
According to the poverty statistics in Leadwood, males aged 15 years and females aged 5 years are the age groups that are most secure financially, with 100.0% of males and 100.0% of females in these age groups living above the poverty line.
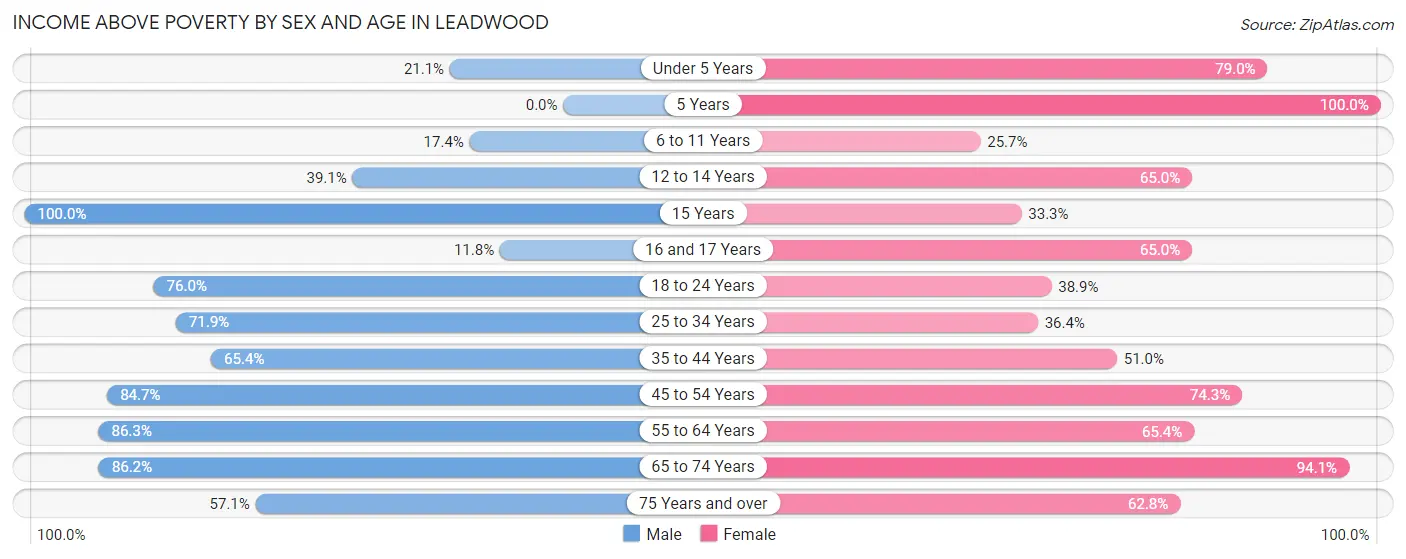
| Age Bracket | Male | Female |
| Under 5 Years | 4 (21.0%) | 94 (79.0%) |
| 5 Years | 0 (0.0%) | 3 (100.0%) |
| 6 to 11 Years | 4 (17.4%) | 18 (25.7%) |
| 12 to 14 Years | 18 (39.1%) | 13 (65.0%) |
| 15 Years | 4 (100.0%) | 3 (33.3%) |
| 16 and 17 Years | 2 (11.8%) | 13 (65.0%) |
| 18 to 24 Years | 73 (76.0%) | 49 (38.9%) |
| 25 to 34 Years | 64 (71.9%) | 24 (36.4%) |
| 35 to 44 Years | 17 (65.4%) | 49 (51.0%) |
| 45 to 54 Years | 138 (84.7%) | 104 (74.3%) |
| 55 to 64 Years | 44 (86.3%) | 68 (65.4%) |
| 65 to 74 Years | 25 (86.2%) | 48 (94.1%) |
| 75 Years and over | 4 (57.1%) | 27 (62.8%) |
| Total | 397 (69.7%) | 513 (59.2%) |
Income Below Poverty Among Married-Couple Families in Leadwood
The poverty statistics for married-couple families in Leadwood show that 11.9% or 26 of the total 218 families live below the poverty line. Families with 3 or 4 children have the highest poverty rate of 53.1%, comprising of 17 families. On the other hand, families with no children have the lowest poverty rate of 2.5%, which includes 3 families.
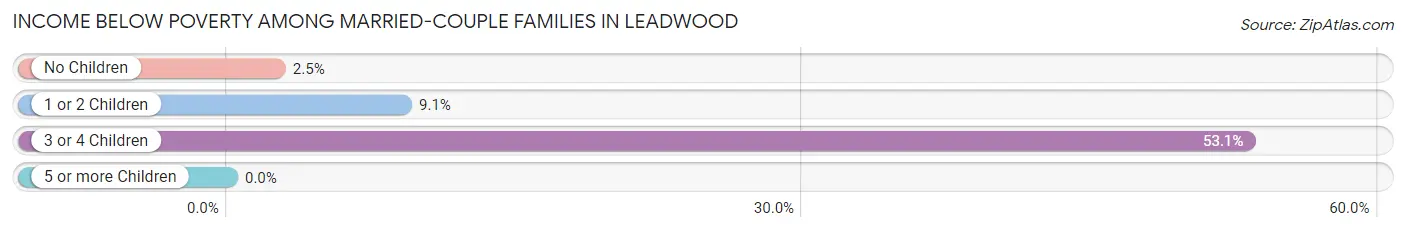
| Children | Above Poverty | Below Poverty |
| No Children | 117 (97.5%) | 3 (2.5%) |
| 1 or 2 Children | 60 (90.9%) | 6 (9.1%) |
| 3 or 4 Children | 15 (46.9%) | 17 (53.1%) |
| 5 or more Children | 0 (0.0%) | 0 (0.0%) |
| Total | 192 (88.1%) | 26 (11.9%) |
Income Below Poverty Among Single-Parent Households in Leadwood
According to the poverty data in Leadwood, 34.4% or 11 single-father households and 58.0% or 51 single-mother households are living below the poverty line. Among single-father households, those with 1 or 2 children have the highest poverty rate, with 11 households (78.6%) experiencing poverty. Likewise, among single-mother households, those with 1 or 2 children have the highest poverty rate, with 51 households (92.7%) falling below the poverty line.
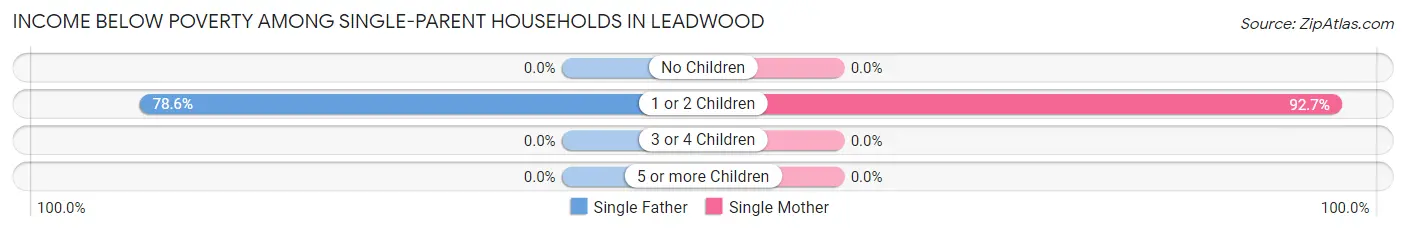
| Children | Single Father | Single Mother |
| No Children | 0 (0.0%) | 0 (0.0%) |
| 1 or 2 Children | 11 (78.6%) | 51 (92.7%) |
| 3 or 4 Children | 0 (0.0%) | 0 (0.0%) |
| 5 or more Children | 0 (0.0%) | 0 (0.0%) |
| Total | 11 (34.4%) | 51 (58.0%) |
Income Below Poverty Among Married-Couple vs Single-Parent Households in Leadwood
The poverty data for Leadwood shows that 26 of the married-couple family households (11.9%) and 62 of the single-parent households (51.7%) are living below the poverty level. Within the married-couple family households, those with 3 or 4 children have the highest poverty rate, with 17 households (53.1%) falling below the poverty line. Among the single-parent households, those with 1 or 2 children have the highest poverty rate, with 62 household (89.9%) living below poverty.
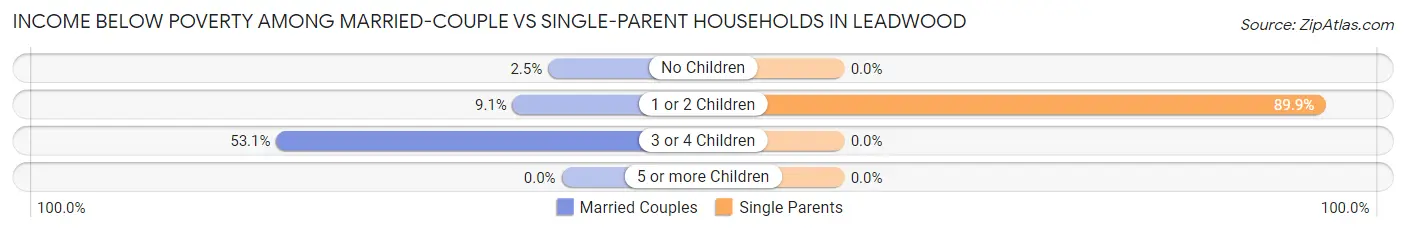
| Children | Married-Couple Families | Single-Parent Households |
| No Children | 3 (2.5%) | 0 (0.0%) |
| 1 or 2 Children | 6 (9.1%) | 62 (89.9%) |
| 3 or 4 Children | 17 (53.1%) | 0 (0.0%) |
| 5 or more Children | 0 (0.0%) | 0 (0.0%) |
| Total | 26 (11.9%) | 62 (51.7%) |
Race in Leadwood
The most populous races in Leadwood are White / Caucasian (1,436 | 97.4%), Two or more Races (33 | 2.2%), and Asian (6 | 0.4%).
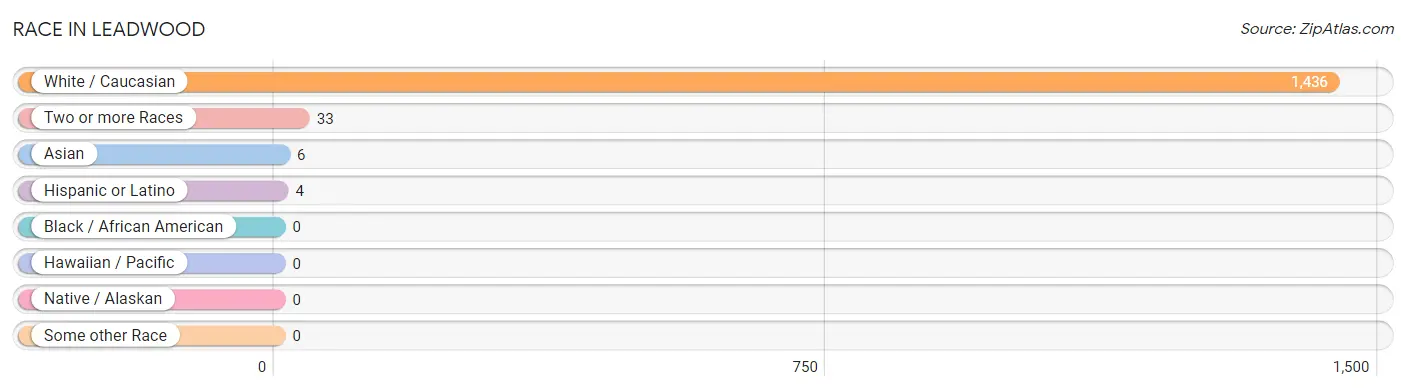
| Race | # Population | % Population |
| Asian | 6 | 0.4% |
| Black / African American | 0 | 0.0% |
| Hawaiian / Pacific | 0 | 0.0% |
| Hispanic or Latino | 4 | 0.3% |
| Native / Alaskan | 0 | 0.0% |
| White / Caucasian | 1,436 | 97.4% |
| Two or more Races | 33 | 2.2% |
| Some other Race | 0 | 0.0% |
| Total | 1,475 | 100.0% |
Ancestry in Leadwood
The most populous ancestries reported in Leadwood are American (267 | 18.1%), German (234 | 15.9%), Irish (189 | 12.8%), English (117 | 7.9%), and French (43 | 2.9%), together accounting for 57.6% of all Leadwood residents.
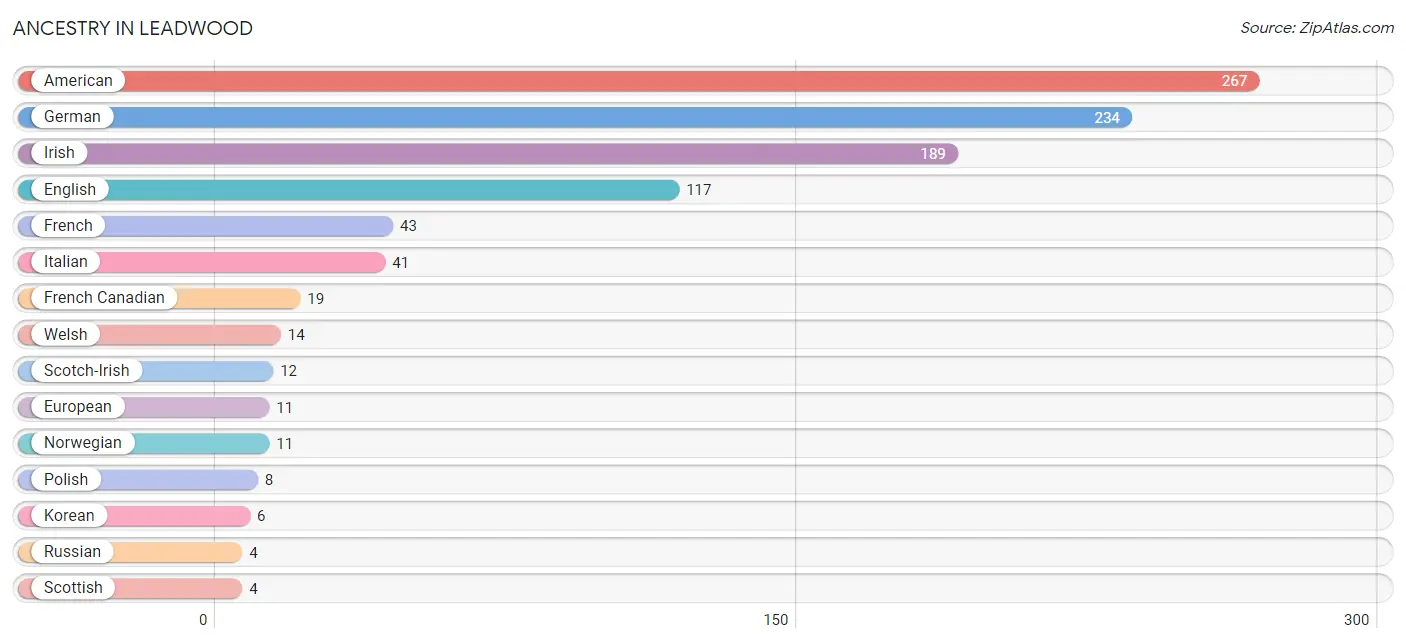
| Ancestry | # Population | % Population |
| American | 267 | 18.1% |
| English | 117 | 7.9% |
| European | 11 | 0.7% |
| French | 43 | 2.9% |
| French Canadian | 19 | 1.3% |
| German | 234 | 15.9% |
| Irish | 189 | 12.8% |
| Italian | 41 | 2.8% |
| Korean | 6 | 0.4% |
| Norwegian | 11 | 0.7% |
| Polish | 8 | 0.5% |
| Russian | 4 | 0.3% |
| Scotch-Irish | 12 | 0.8% |
| Scottish | 4 | 0.3% |
| Spaniard | 4 | 0.3% |
| Welsh | 14 | 0.9% | View All 16 Rows |
Immigrants in Leadwood
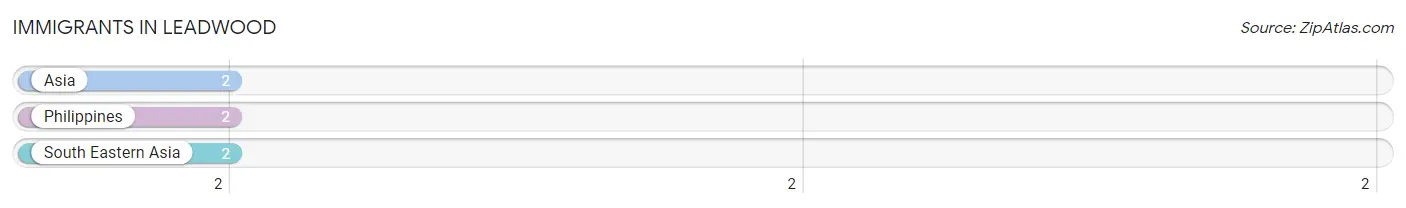
The most numerous immigrant groups reported in Leadwood came from Asia (2 | 0.1%), Philippines (2 | 0.1%), and South Eastern Asia (2 | 0.1%), together accounting for 0.4% of all Leadwood residents.
| Immigration Origin | # Population | % Population |
| Asia | 2 | 0.1% |
| Philippines | 2 | 0.1% |
| South Eastern Asia | 2 | 0.1% | View All 3 Rows |
Sex and Age in Leadwood
Sex and Age in Leadwood
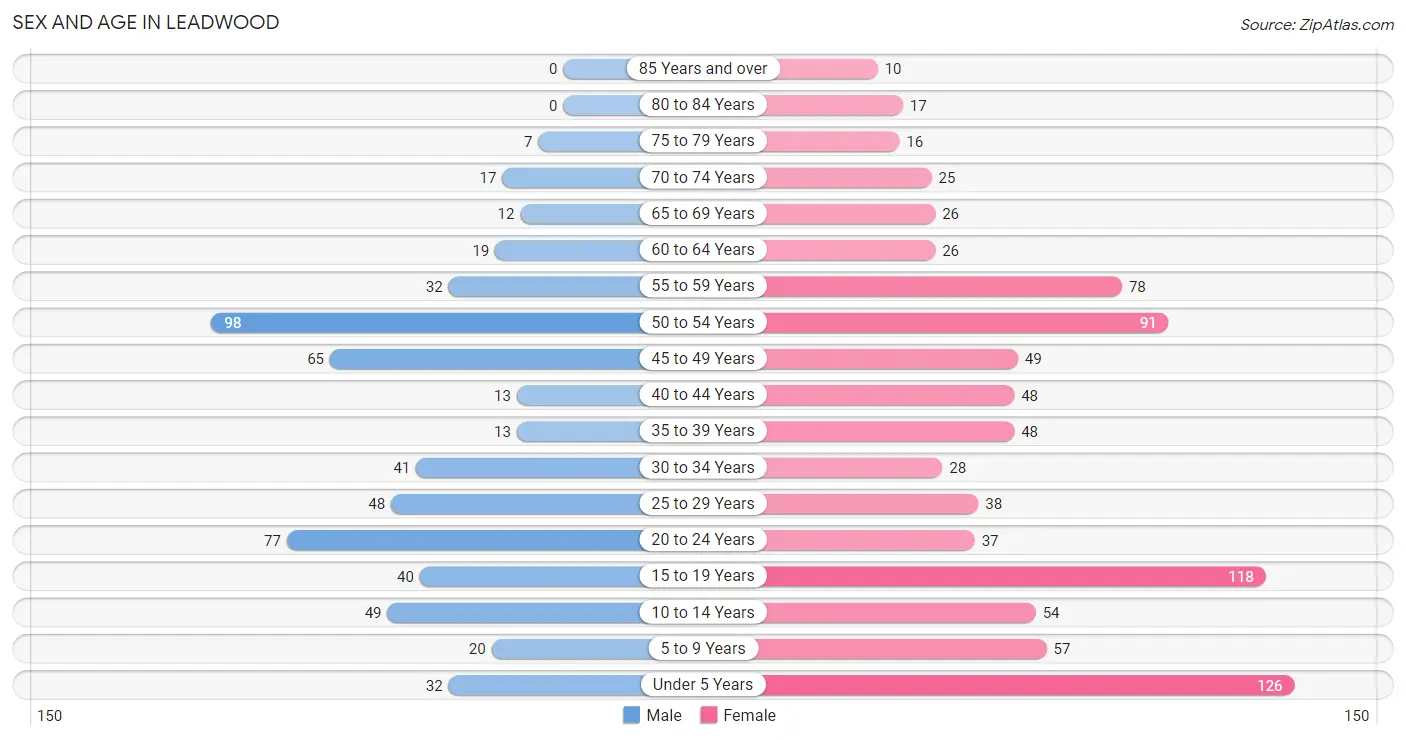
The most populous age groups in Leadwood are 50 to 54 Years (98 | 16.8%) for men and Under 5 Years (126 | 14.1%) for women.
| Age Bracket | Male | Female |
| Under 5 Years | 32 (5.5%) | 126 (14.1%) |
| 5 to 9 Years | 20 (3.4%) | 57 (6.4%) |
| 10 to 14 Years | 49 (8.4%) | 54 (6.0%) |
| 15 to 19 Years | 40 (6.9%) | 118 (13.2%) |
| 20 to 24 Years | 77 (13.2%) | 37 (4.2%) |
| 25 to 29 Years | 48 (8.2%) | 38 (4.3%) |
| 30 to 34 Years | 41 (7.0%) | 28 (3.1%) |
| 35 to 39 Years | 13 (2.2%) | 48 (5.4%) |
| 40 to 44 Years | 13 (2.2%) | 48 (5.4%) |
| 45 to 49 Years | 65 (11.2%) | 49 (5.5%) |
| 50 to 54 Years | 98 (16.8%) | 91 (10.2%) |
| 55 to 59 Years | 32 (5.5%) | 78 (8.7%) |
| 60 to 64 Years | 19 (3.3%) | 26 (2.9%) |
| 65 to 69 Years | 12 (2.1%) | 26 (2.9%) |
| 70 to 74 Years | 17 (2.9%) | 25 (2.8%) |
| 75 to 79 Years | 7 (1.2%) | 16 (1.8%) |
| 80 to 84 Years | 0 (0.0%) | 17 (1.9%) |
| 85 Years and over | 0 (0.0%) | 10 (1.1%) |
| Total | 583 (100.0%) | 892 (100.0%) |
Families and Households in Leadwood
Median Family Size in Leadwood
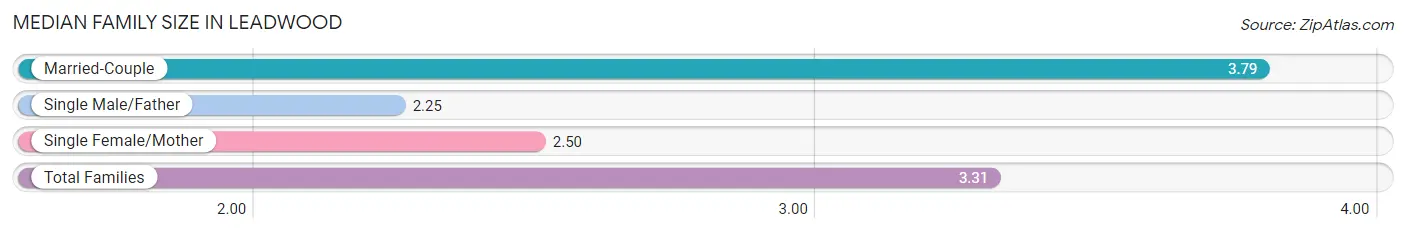
The median family size in Leadwood is 3.31 persons per family, with married-couple families (218 | 64.5%) accounting for the largest median family size of 3.79 persons per family. On the other hand, single male/father families (32 | 9.5%) represent the smallest median family size with 2.25 persons per family.
| Family Type | # Families | Family Size |
| Married-Couple | 218 (64.5%) | 3.79 |
| Single Male/Father | 32 (9.5%) | 2.25 |
| Single Female/Mother | 88 (26.0%) | 2.50 |
| Total Families | 338 (100.0%) | 3.31 |
Median Household Size in Leadwood
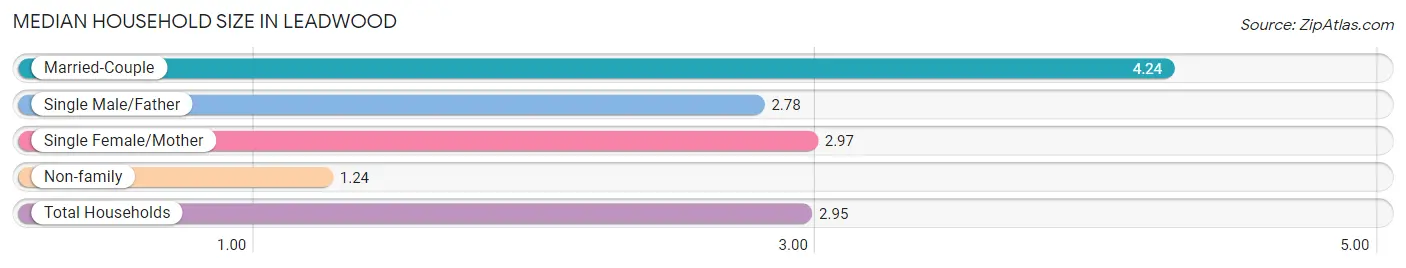
The median household size in Leadwood is 2.95 persons per household, with married-couple households (218 | 43.6%) accounting for the largest median household size of 4.24 persons per household. non-family households (162 | 32.4%) represent the smallest median household size with 1.24 persons per household.
| Household Type | # Households | Household Size |
| Married-Couple | 218 (43.6%) | 4.24 |
| Single Male/Father | 32 (6.4%) | 2.78 |
| Single Female/Mother | 88 (17.6%) | 2.97 |
| Non-family | 162 (32.4%) | 1.24 |
| Total Households | 500 (100.0%) | 2.95 |
Household Size by Marriage Status in Leadwood
Out of a total of 500 households in Leadwood, 338 (67.6%) are family households, while 162 (32.4%) are nonfamily households. The most numerous type of family households are 2-person households, comprising 136, and the most common type of nonfamily households are 1-person households, comprising 139.
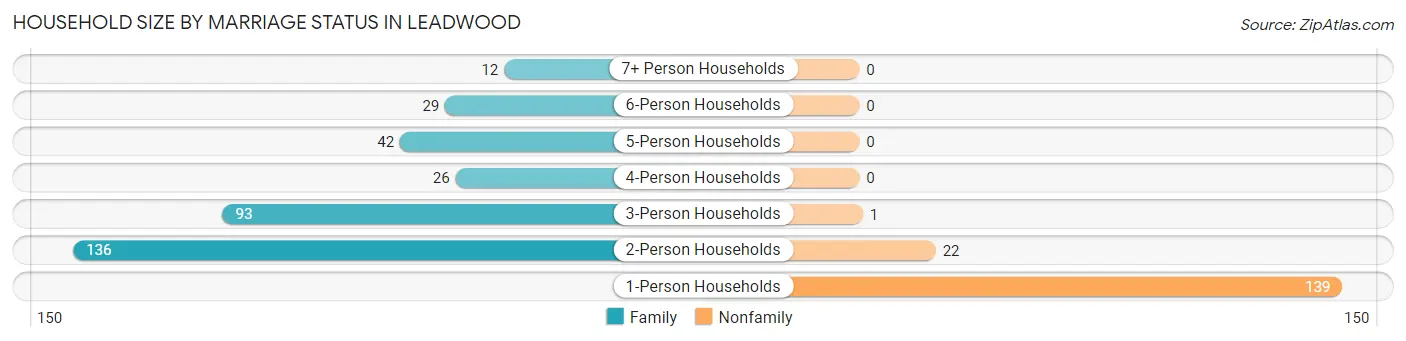
| Household Size | Family Households | Nonfamily Households |
| 1-Person Households | - | 139 (27.8%) |
| 2-Person Households | 136 (27.2%) | 22 (4.4%) |
| 3-Person Households | 93 (18.6%) | 1 (0.2%) |
| 4-Person Households | 26 (5.2%) | 0 (0.0%) |
| 5-Person Households | 42 (8.4%) | 0 (0.0%) |
| 6-Person Households | 29 (5.8%) | 0 (0.0%) |
| 7+ Person Households | 12 (2.4%) | 0 (0.0%) |
| Total | 338 (67.6%) | 162 (32.4%) |
Female Fertility in Leadwood
Fertility by Age in Leadwood
Average fertility rate in Leadwood is 265.0 births per 1,000 women. Women in the age bracket of 15 to 19 years have the highest fertility rate with 644.0 births per 1,000 women. Women in the age bracket of 15 to 19 years acount for 76.8% of all women with births.
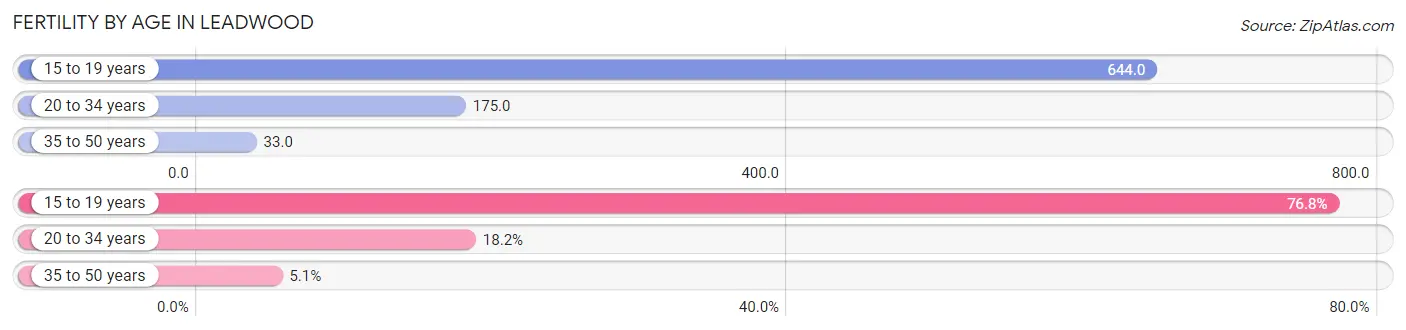
| Age Bracket | Women with Births | Births / 1,000 Women |
| 15 to 19 years | 76 (76.8%) | 644.0 |
| 20 to 34 years | 18 (18.2%) | 175.0 |
| 35 to 50 years | 5 (5.1%) | 33.0 |
| Total | 99 (100.0%) | 265.0 |
Fertility by Age by Marriage Status in Leadwood
9.1% of women with births (99) in Leadwood are married. The highest percentage of unmarried women with births falls into 15 to 19 years age bracket with 100.0% of them unmarried at the time of birth, while the lowest percentage of unmarried women with births belong to 35 to 50 years age bracket with 0.0% of them unmarried.
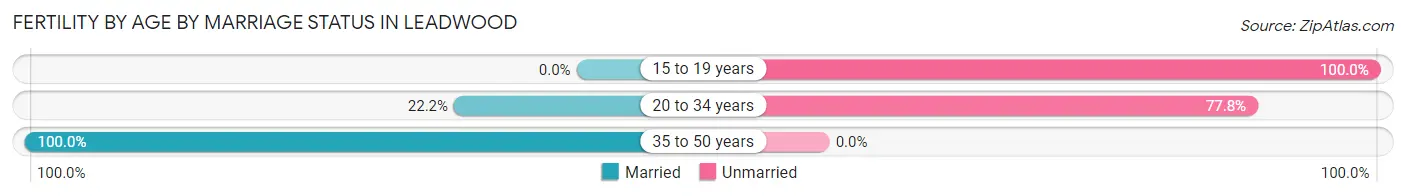
| Age Bracket | Married | Unmarried |
| 15 to 19 years | 0 (0.0%) | 76 (100.0%) |
| 20 to 34 years | 4 (22.2%) | 14 (77.8%) |
| 35 to 50 years | 5 (100.0%) | 0 (0.0%) |
| Total | 9 (9.1%) | 90 (90.9%) |
Fertility by Education in Leadwood
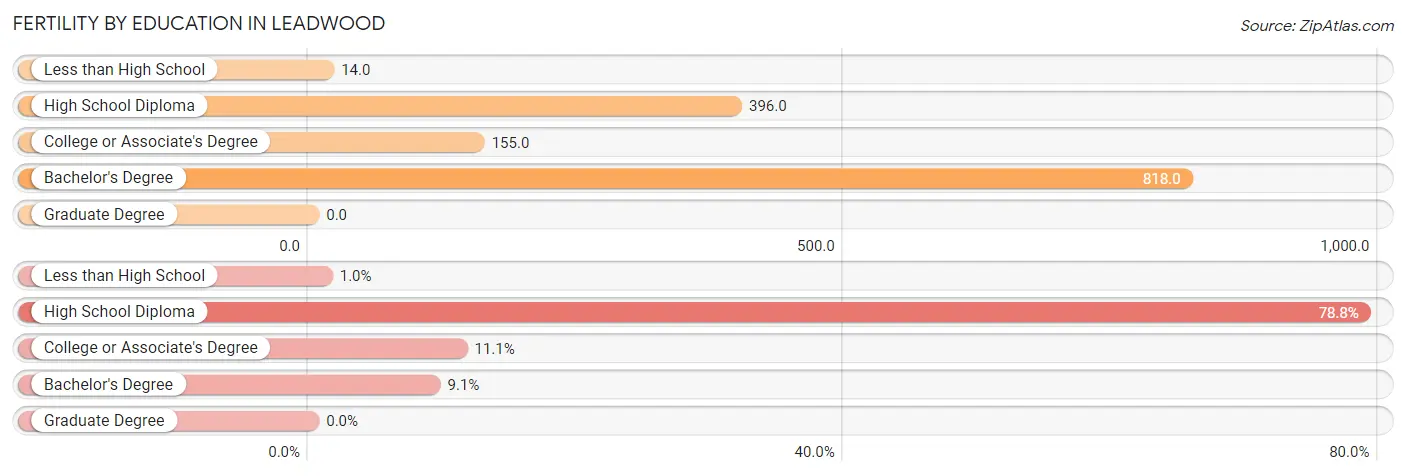
| Educational Attainment | Women with Births | Births / 1,000 Women |
| Less than High School | 1 (1.0%) | 14.0 |
| High School Diploma | 78 (78.8%) | 396.0 |
| College or Associate's Degree | 11 (11.1%) | 155.0 |
| Bachelor's Degree | 9 (9.1%) | 818.0 |
| Graduate Degree | 0 (0.0%) | 0.0 |
| Total | 99 (100.0%) | 265.0 |
Fertility by Education by Marriage Status in Leadwood
90.9% of women with births in Leadwood are unmarried. Women with the educational attainment of bachelor's degree are most likely to be married with 100.0% of them married at childbirth, while women with the educational attainment of less than high school are least likely to be married with 100.0% of them unmarried at childbirth.
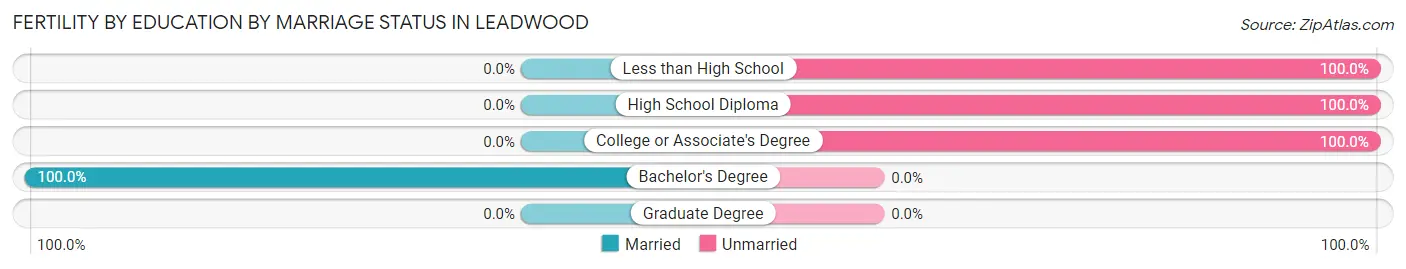
| Educational Attainment | Married | Unmarried |
| Less than High School | 0 (0.0%) | 1 (100.0%) |
| High School Diploma | 0 (0.0%) | 78 (100.0%) |
| College or Associate's Degree | 0 (0.0%) | 11 (100.0%) |
| Bachelor's Degree | 9 (100.0%) | 0 (0.0%) |
| Graduate Degree | 0 (0.0%) | 0 (0.0%) |
| Total | 9 (9.1%) | 90 (90.9%) |
Employment Characteristics in Leadwood
Employment by Class of Employer in Leadwood
Among the 519 employed individuals in Leadwood, private company employees (348 | 67.0%), state government employees (66 | 12.7%), and not-for-profit organizations (43 | 8.3%) make up the most common classes of employment.
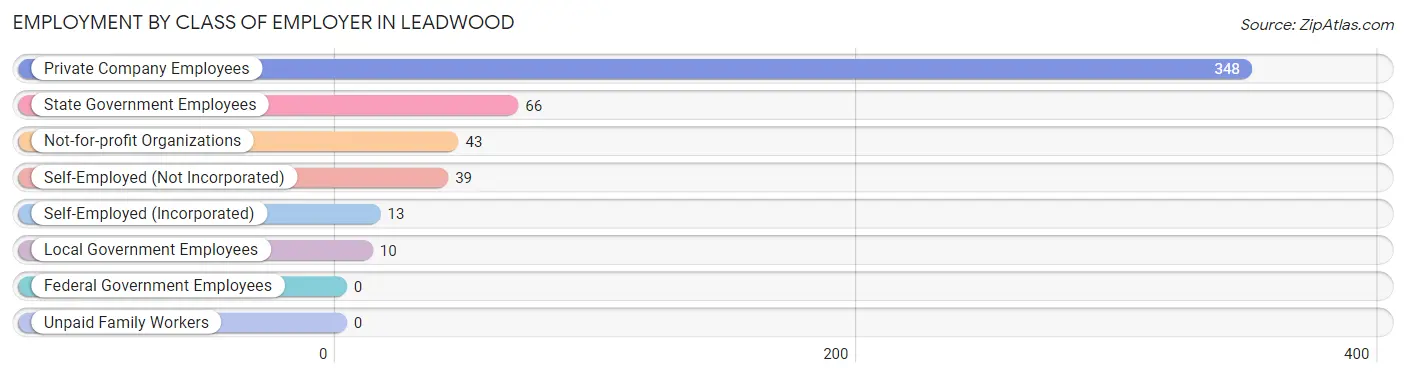
| Employer Class | # Employees | % Employees |
| Private Company Employees | 348 | 67.0% |
| Self-Employed (Incorporated) | 13 | 2.5% |
| Self-Employed (Not Incorporated) | 39 | 7.5% |
| Not-for-profit Organizations | 43 | 8.3% |
| Local Government Employees | 10 | 1.9% |
| State Government Employees | 66 | 12.7% |
| Federal Government Employees | 0 | 0.0% |
| Unpaid Family Workers | 0 | 0.0% |
| Total | 519 | 100.0% |
Employment Status by Age in Leadwood
According to the labor force statistics for Leadwood, out of the total population over 16 years of age (1,124), 50.8% or 571 individuals are in the labor force, with 6.8% or 39 of them unemployed. The age group with the highest labor force participation rate is 30 to 34 years, with 91.3% or 63 individuals in the labor force. Within the labor force, the 35 to 44 years age range has the highest percentage of unemployed individuals, with 15.7% or 13 of them being unemployed.
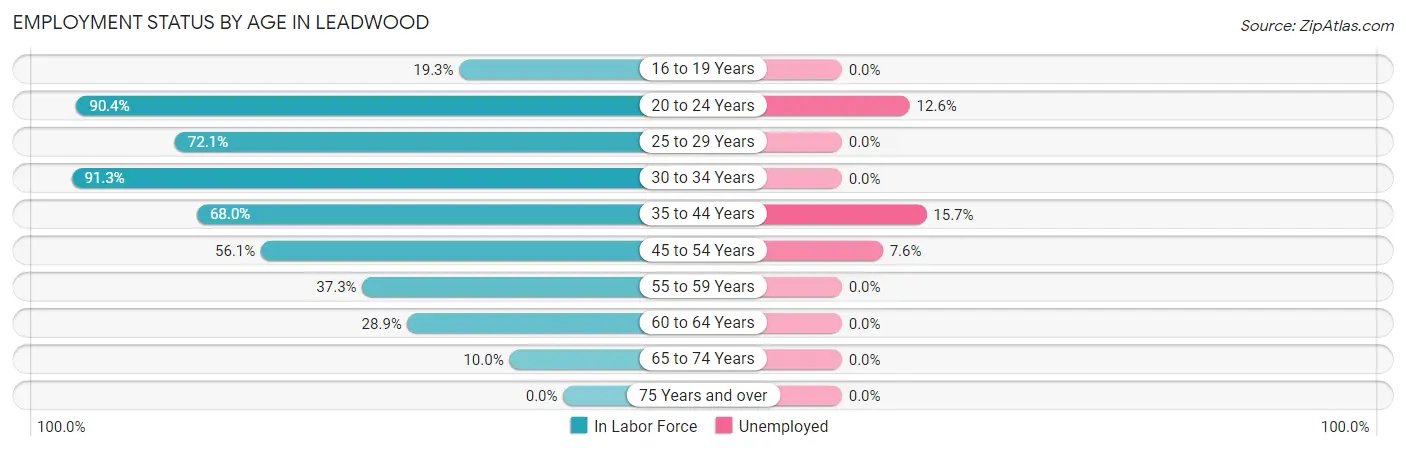
| Age Bracket | In Labor Force | Unemployed |
| 16 to 19 Years | 28 (19.3%) | 0 (0.0%) |
| 20 to 24 Years | 103 (90.4%) | 13 (12.6%) |
| 25 to 29 Years | 62 (72.1%) | 0 (0.0%) |
| 30 to 34 Years | 63 (91.3%) | 0 (0.0%) |
| 35 to 44 Years | 83 (68.0%) | 13 (15.7%) |
| 45 to 54 Years | 170 (56.1%) | 13 (7.6%) |
| 55 to 59 Years | 41 (37.3%) | 0 (0.0%) |
| 60 to 64 Years | 13 (28.9%) | 0 (0.0%) |
| 65 to 74 Years | 8 (10.0%) | 0 (0.0%) |
| 75 Years and over | 0 (0.0%) | 0 (0.0%) |
| Total | 571 (50.8%) | 39 (6.8%) |
Employment Status by Educational Attainment in Leadwood
According to labor force statistics for Leadwood, 58.8% of individuals (432) out of the total population between 25 and 64 years of age (735) are in the labor force, with 6.0% or 26 of them being unemployed. The group with the highest labor force participation rate are those with the educational attainment of college / associate degree, with 75.1% or 151 individuals in the labor force. Within the labor force, individuals with less than high school education have the highest percentage of unemployment, with 21.7% or 13 of them being unemployed.
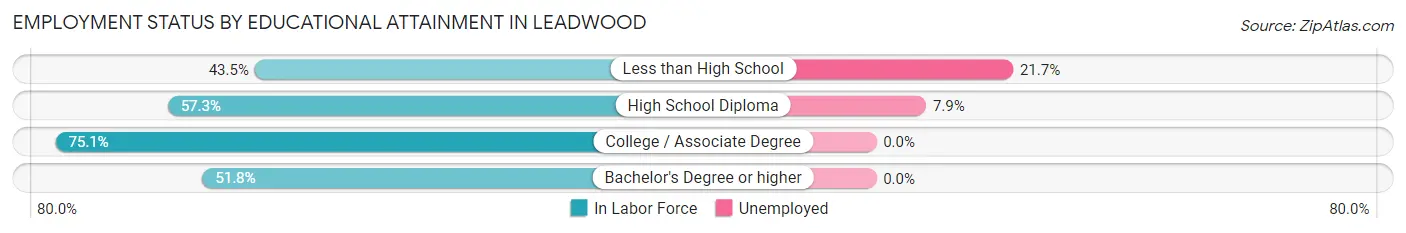
| Educational Attainment | In Labor Force | Unemployed |
| Less than High School | 60 (43.5%) | 30 (21.7%) |
| High School Diploma | 164 (57.3%) | 23 (7.9%) |
| College / Associate Degree | 151 (75.1%) | 0 (0.0%) |
| Bachelor's Degree or higher | 57 (51.8%) | 0 (0.0%) |
| Total | 432 (58.8%) | 44 (6.0%) |
Employment Occupations by Sex in Leadwood
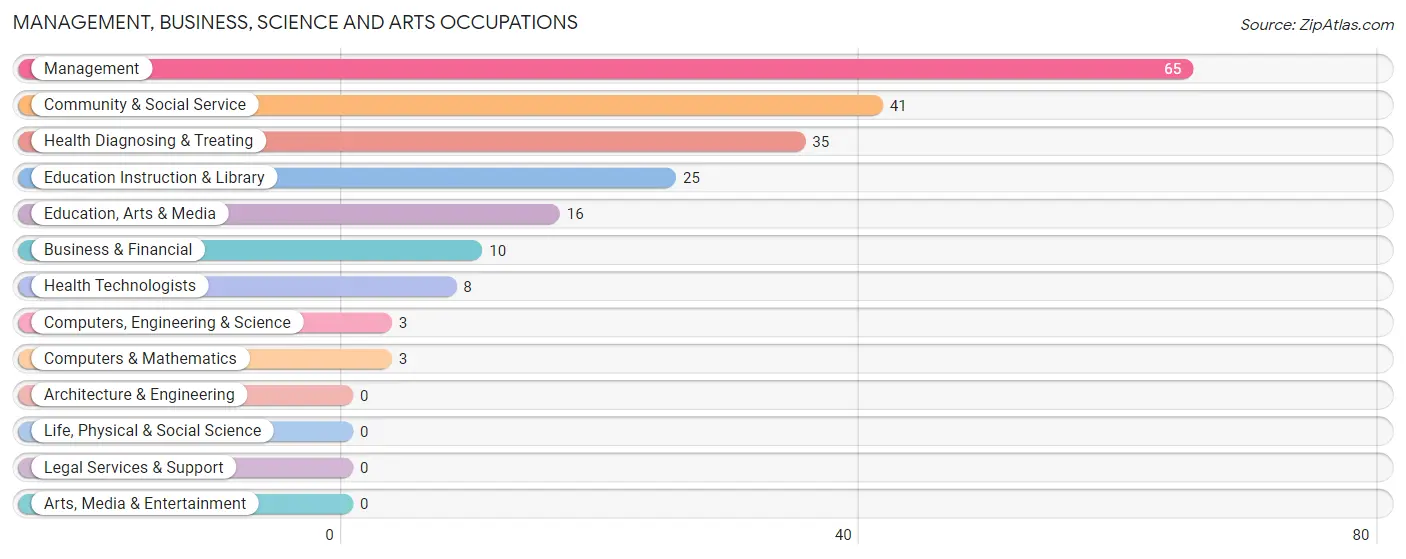
Management, Business, Science and Arts Occupations
The most common Management, Business, Science and Arts occupations in Leadwood are Management (65 | 12.2%), Community & Social Service (41 | 7.7%), Health Diagnosing & Treating (35 | 6.6%), Education Instruction & Library (25 | 4.7%), and Education, Arts & Media (16 | 3.0%).
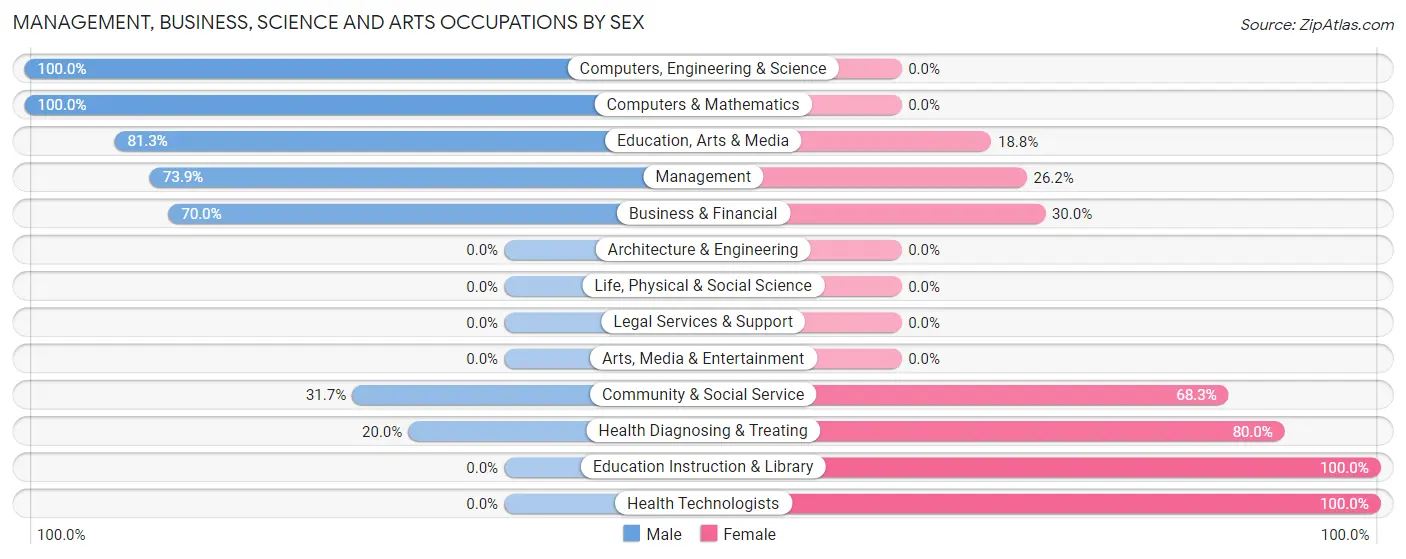
Management, Business, Science and Arts Occupations by Sex
Within the Management, Business, Science and Arts occupations in Leadwood, the most male-oriented occupations are Computers, Engineering & Science (100.0%), Computers & Mathematics (100.0%), and Education, Arts & Media (81.2%), while the most female-oriented occupations are Education Instruction & Library (100.0%), Health Technologists (100.0%), and Health Diagnosing & Treating (80.0%).
| Occupation | Male | Female |
| Management | 48 (73.9%) | 17 (26.2%) |
| Business & Financial | 7 (70.0%) | 3 (30.0%) |
| Computers, Engineering & Science | 3 (100.0%) | 0 (0.0%) |
| Computers & Mathematics | 3 (100.0%) | 0 (0.0%) |
| Architecture & Engineering | 0 (0.0%) | 0 (0.0%) |
| Life, Physical & Social Science | 0 (0.0%) | 0 (0.0%) |
| Community & Social Service | 13 (31.7%) | 28 (68.3%) |
| Education, Arts & Media | 13 (81.2%) | 3 (18.8%) |
| Legal Services & Support | 0 (0.0%) | 0 (0.0%) |
| Education Instruction & Library | 0 (0.0%) | 25 (100.0%) |
| Arts, Media & Entertainment | 0 (0.0%) | 0 (0.0%) |
| Health Diagnosing & Treating | 7 (20.0%) | 28 (80.0%) |
| Health Technologists | 0 (0.0%) | 8 (100.0%) |
| Total (Category) | 78 (50.6%) | 76 (49.3%) |
| Total (Overall) | 314 (59.0%) | 218 (41.0%) |
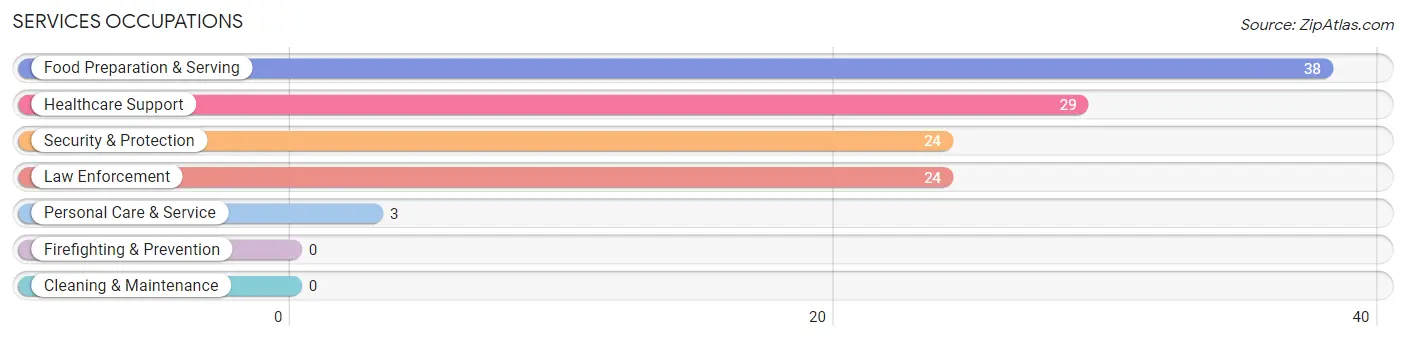
Services Occupations
The most common Services occupations in Leadwood are Food Preparation & Serving (38 | 7.1%), Healthcare Support (29 | 5.4%), Security & Protection (24 | 4.5%), Law Enforcement (24 | 4.5%), and Personal Care & Service (3 | 0.6%).
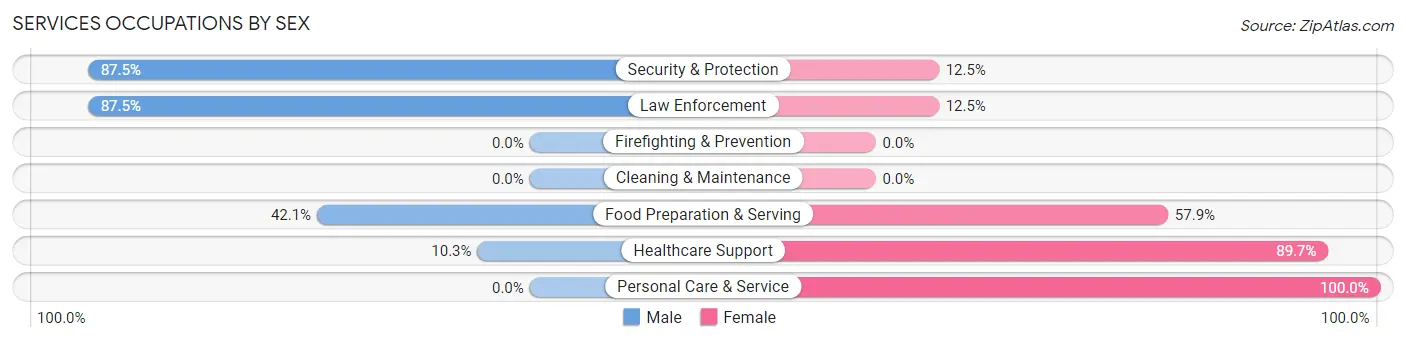
Services Occupations by Sex
Within the Services occupations in Leadwood, the most male-oriented occupations are Security & Protection (87.5%), Law Enforcement (87.5%), and Food Preparation & Serving (42.1%), while the most female-oriented occupations are Personal Care & Service (100.0%), Healthcare Support (89.7%), and Food Preparation & Serving (57.9%).
| Occupation | Male | Female |
| Healthcare Support | 3 (10.3%) | 26 (89.7%) |
| Security & Protection | 21 (87.5%) | 3 (12.5%) |
| Firefighting & Prevention | 0 (0.0%) | 0 (0.0%) |
| Law Enforcement | 21 (87.5%) | 3 (12.5%) |
| Food Preparation & Serving | 16 (42.1%) | 22 (57.9%) |
| Cleaning & Maintenance | 0 (0.0%) | 0 (0.0%) |
| Personal Care & Service | 0 (0.0%) | 3 (100.0%) |
| Total (Category) | 40 (42.5%) | 54 (57.5%) |
| Total (Overall) | 314 (59.0%) | 218 (41.0%) |
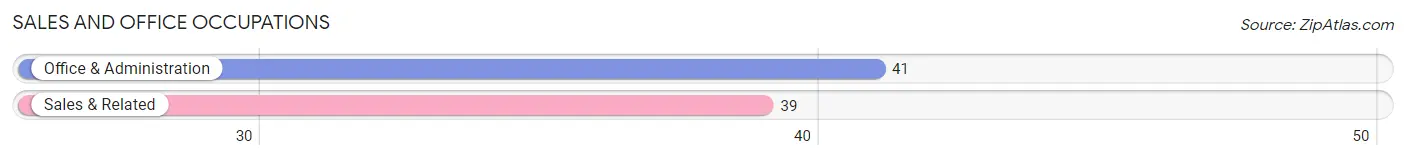
Sales and Office Occupations
The most common Sales and Office occupations in Leadwood are Office & Administration (41 | 7.7%), and Sales & Related (39 | 7.3%).
Sales and Office Occupations by Sex
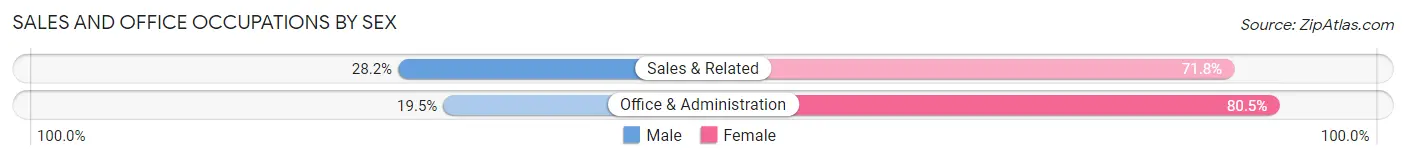
| Occupation | Male | Female |
| Sales & Related | 11 (28.2%) | 28 (71.8%) |
| Office & Administration | 8 (19.5%) | 33 (80.5%) |
| Total (Category) | 19 (23.7%) | 61 (76.2%) |
| Total (Overall) | 314 (59.0%) | 218 (41.0%) |
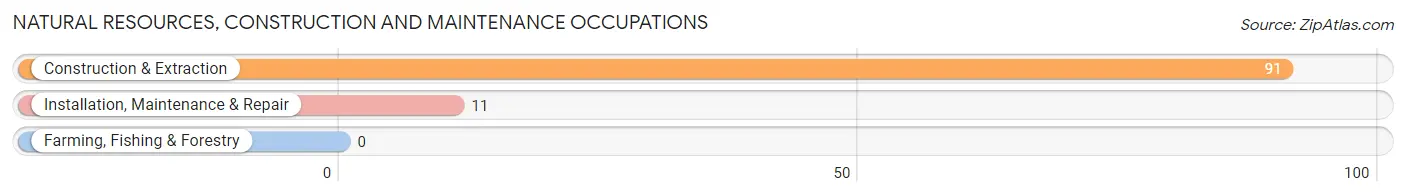
Natural Resources, Construction and Maintenance Occupations
The most common Natural Resources, Construction and Maintenance occupations in Leadwood are Construction & Extraction (91 | 17.1%), and Installation, Maintenance & Repair (11 | 2.1%).
Natural Resources, Construction and Maintenance Occupations by Sex
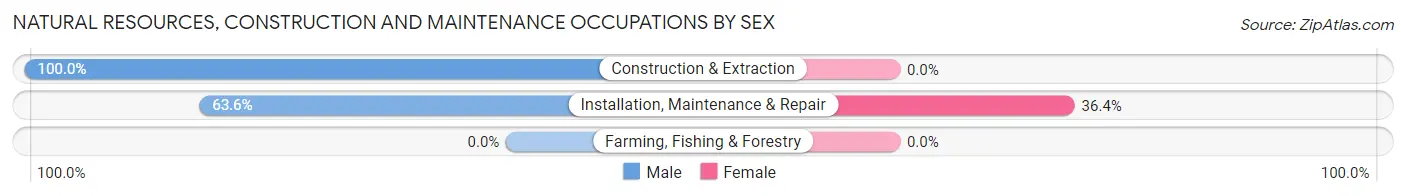
| Occupation | Male | Female |
| Farming, Fishing & Forestry | 0 (0.0%) | 0 (0.0%) |
| Construction & Extraction | 91 (100.0%) | 0 (0.0%) |
| Installation, Maintenance & Repair | 7 (63.6%) | 4 (36.4%) |
| Total (Category) | 98 (96.1%) | 4 (3.9%) |
| Total (Overall) | 314 (59.0%) | 218 (41.0%) |
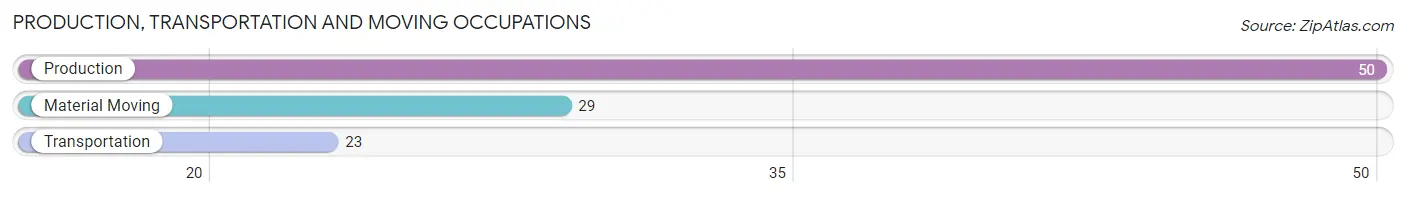
Production, Transportation and Moving Occupations
The most common Production, Transportation and Moving occupations in Leadwood are Production (50 | 9.4%), Material Moving (29 | 5.4%), and Transportation (23 | 4.3%).
Production, Transportation and Moving Occupations by Sex
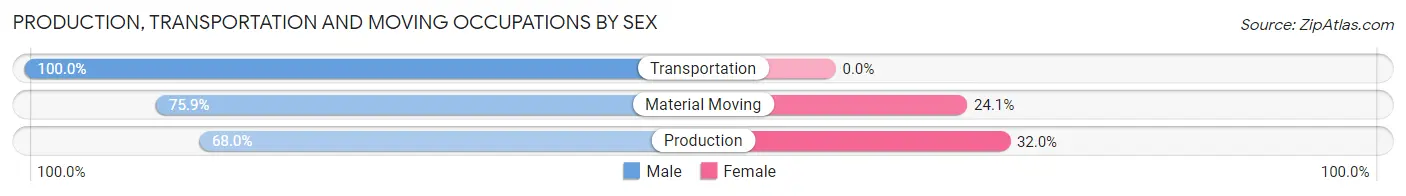
| Occupation | Male | Female |
| Production | 34 (68.0%) | 16 (32.0%) |
| Transportation | 23 (100.0%) | 0 (0.0%) |
| Material Moving | 22 (75.9%) | 7 (24.1%) |
| Total (Category) | 79 (77.4%) | 23 (22.6%) |
| Total (Overall) | 314 (59.0%) | 218 (41.0%) |
Employment Industries by Sex in Leadwood
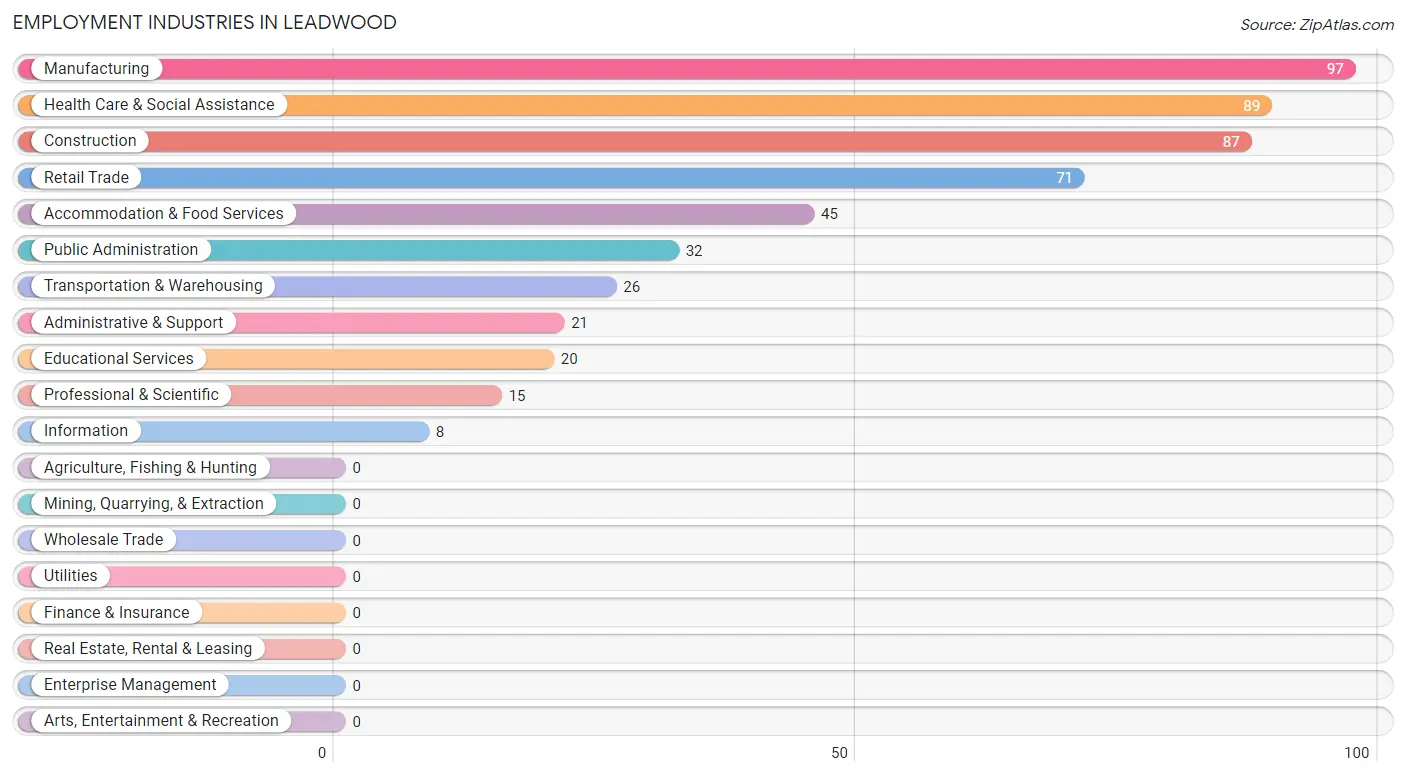
Employment Industries in Leadwood
The major employment industries in Leadwood include Manufacturing (97 | 18.2%), Health Care & Social Assistance (89 | 16.7%), Construction (87 | 16.4%), Retail Trade (71 | 13.4%), and Accommodation & Food Services (45 | 8.5%).
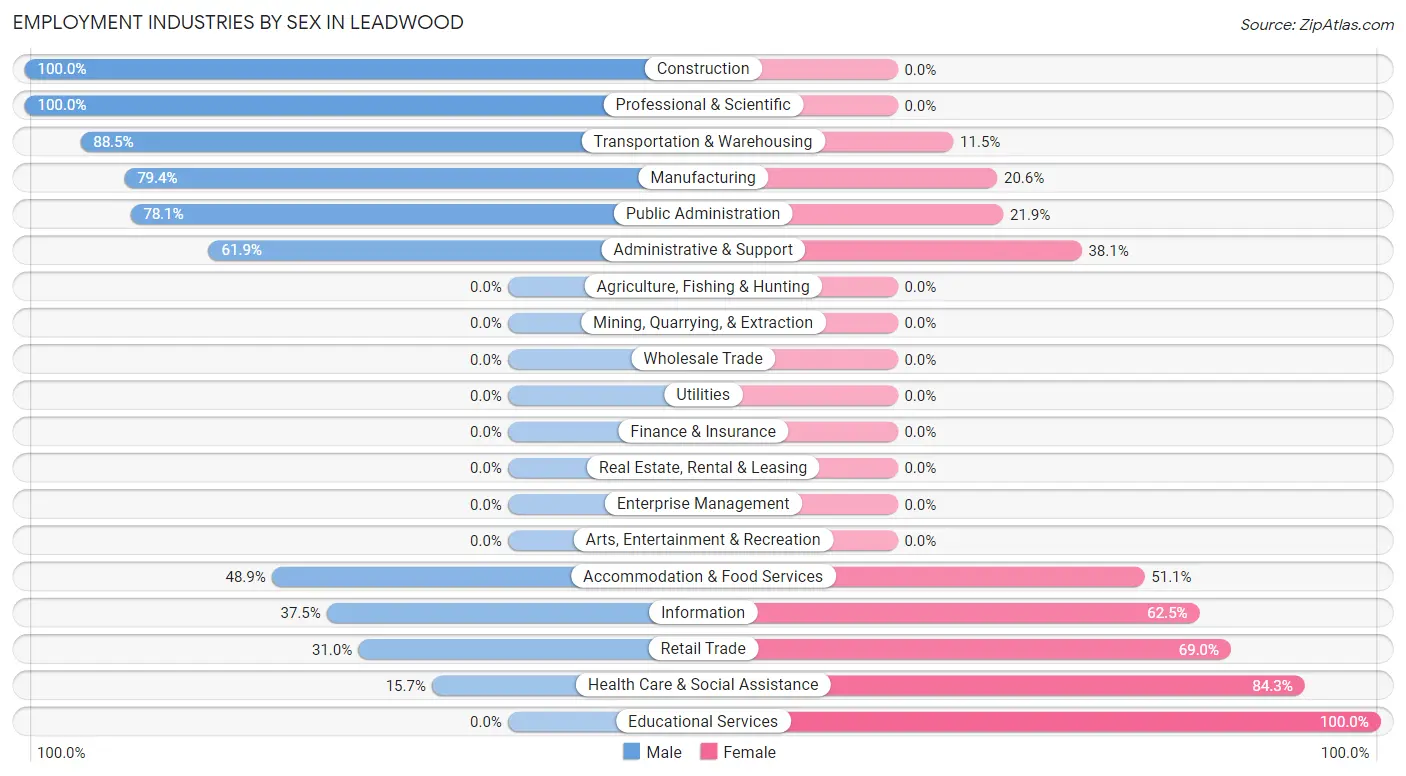
Employment Industries by Sex in Leadwood
The Leadwood industries that see more men than women are Construction (100.0%), Professional & Scientific (100.0%), and Transportation & Warehousing (88.5%), whereas the industries that tend to have a higher number of women are Educational Services (100.0%), Health Care & Social Assistance (84.3%), and Retail Trade (69.0%).
| Industry | Male | Female |
| Agriculture, Fishing & Hunting | 0 (0.0%) | 0 (0.0%) |
| Mining, Quarrying, & Extraction | 0 (0.0%) | 0 (0.0%) |
| Construction | 87 (100.0%) | 0 (0.0%) |
| Manufacturing | 77 (79.4%) | 20 (20.6%) |
| Wholesale Trade | 0 (0.0%) | 0 (0.0%) |
| Retail Trade | 22 (31.0%) | 49 (69.0%) |
| Transportation & Warehousing | 23 (88.5%) | 3 (11.5%) |
| Utilities | 0 (0.0%) | 0 (0.0%) |
| Information | 3 (37.5%) | 5 (62.5%) |
| Finance & Insurance | 0 (0.0%) | 0 (0.0%) |
| Real Estate, Rental & Leasing | 0 (0.0%) | 0 (0.0%) |
| Professional & Scientific | 15 (100.0%) | 0 (0.0%) |
| Enterprise Management | 0 (0.0%) | 0 (0.0%) |
| Administrative & Support | 13 (61.9%) | 8 (38.1%) |
| Educational Services | 0 (0.0%) | 20 (100.0%) |
| Health Care & Social Assistance | 14 (15.7%) | 75 (84.3%) |
| Arts, Entertainment & Recreation | 0 (0.0%) | 0 (0.0%) |
| Accommodation & Food Services | 22 (48.9%) | 23 (51.1%) |
| Public Administration | 25 (78.1%) | 7 (21.9%) |
| Total | 314 (59.0%) | 218 (41.0%) |
Education in Leadwood
School Enrollment in Leadwood
The most common levels of schooling among the 303 students in Leadwood are middle school (90 | 29.7%), high school (80 | 26.4%), and elementary school (59 | 19.5%).
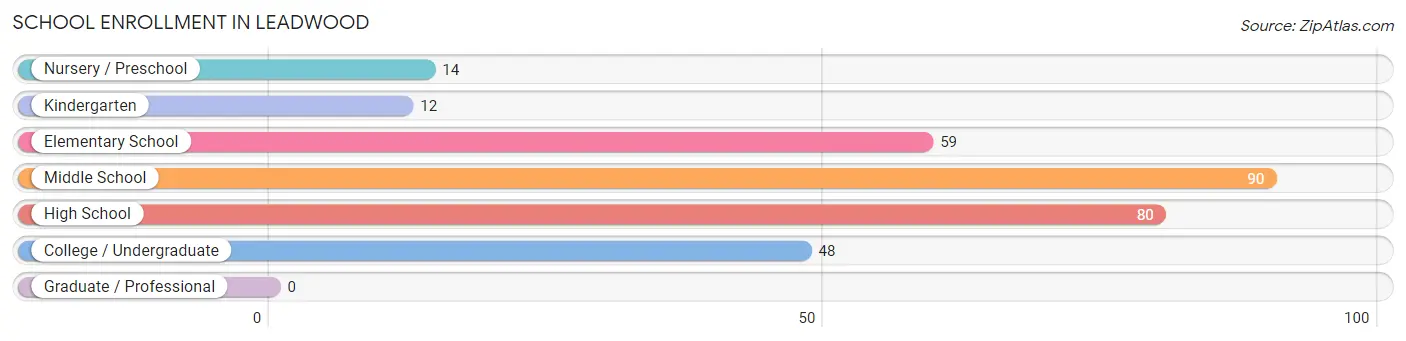
| School Level | # Students | % Students |
| Nursery / Preschool | 14 | 4.6% |
| Kindergarten | 12 | 4.0% |
| Elementary School | 59 | 19.5% |
| Middle School | 90 | 29.7% |
| High School | 80 | 26.4% |
| College / Undergraduate | 48 | 15.8% |
| Graduate / Professional | 0 | 0.0% |
| Total | 303 | 100.0% |
School Enrollment by Age by Funding Source in Leadwood
Out of a total of 303 students who are enrolled in schools in Leadwood, 23 (7.6%) attend a private institution, while the remaining 280 (92.4%) are enrolled in public schools. The age group of 20 to 24 year olds has the highest likelihood of being enrolled in private schools, with 15 (45.5% in the age bracket) enrolled. Conversely, the age group of 3 to 4 year olds has the lowest likelihood of being enrolled in a private school, with 14 (100.0% in the age bracket) attending a public institution.
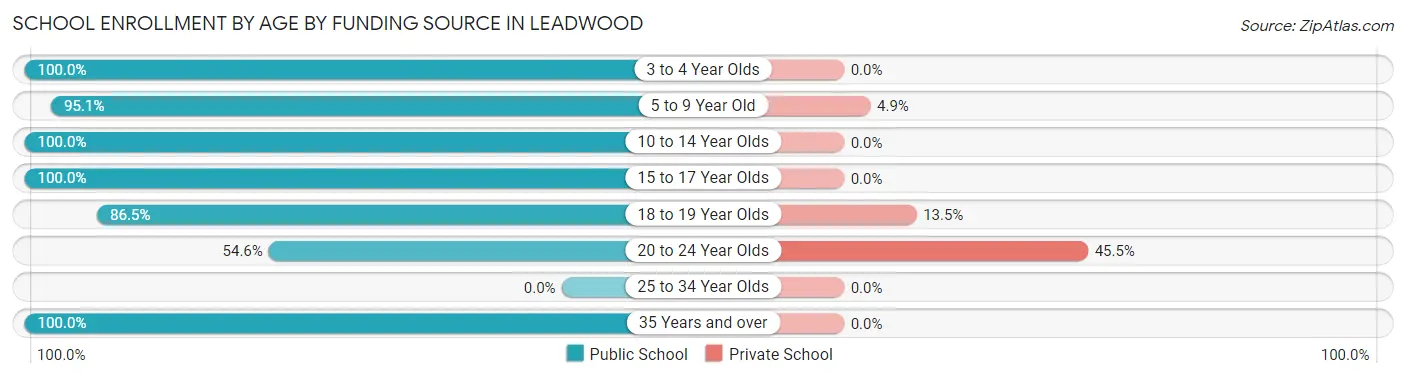
| Age Bracket | Public School | Private School |
| 3 to 4 Year Olds | 14 (100.0%) | 0 (0.0%) |
| 5 to 9 Year Old | 58 (95.1%) | 3 (4.9%) |
| 10 to 14 Year Olds | 103 (100.0%) | 0 (0.0%) |
| 15 to 17 Year Olds | 50 (100.0%) | 0 (0.0%) |
| 18 to 19 Year Olds | 32 (86.5%) | 5 (13.5%) |
| 20 to 24 Year Olds | 18 (54.5%) | 15 (45.5%) |
| 25 to 34 Year Olds | 0 (0.0%) | 0 (0.0%) |
| 35 Years and over | 5 (100.0%) | 0 (0.0%) |
| Total | 280 (92.4%) | 23 (7.6%) |
Educational Attainment by Field of Study in Leadwood
Business (77 | 65.2%), science & technology (14 | 11.9%), education (11 | 9.3%), psychology (9 | 7.6%), and computers & mathematics (4 | 3.4%) are the most common fields of study among 118 individuals in Leadwood who have obtained a bachelor's degree or higher.
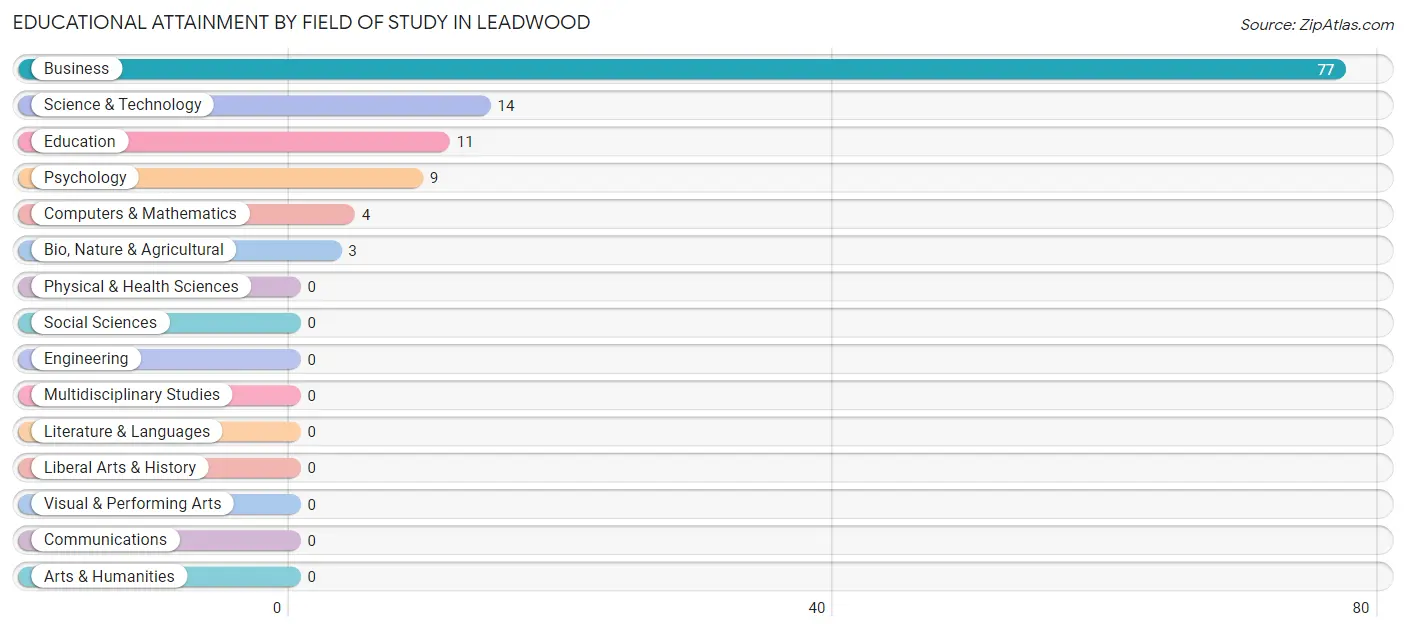
| Field of Study | # Graduates | % Graduates |
| Computers & Mathematics | 4 | 3.4% |
| Bio, Nature & Agricultural | 3 | 2.5% |
| Physical & Health Sciences | 0 | 0.0% |
| Psychology | 9 | 7.6% |
| Social Sciences | 0 | 0.0% |
| Engineering | 0 | 0.0% |
| Multidisciplinary Studies | 0 | 0.0% |
| Science & Technology | 14 | 11.9% |
| Business | 77 | 65.2% |
| Education | 11 | 9.3% |
| Literature & Languages | 0 | 0.0% |
| Liberal Arts & History | 0 | 0.0% |
| Visual & Performing Arts | 0 | 0.0% |
| Communications | 0 | 0.0% |
| Arts & Humanities | 0 | 0.0% |
| Total | 118 | 100.0% |
Transportation & Commute in Leadwood
Vehicle Availability by Sex in Leadwood
The most prevalent vehicle ownership categories in Leadwood are males with 2 vehicles (116, accounting for 37.8%) and females with 2 vehicles (60, making up 54.7%).
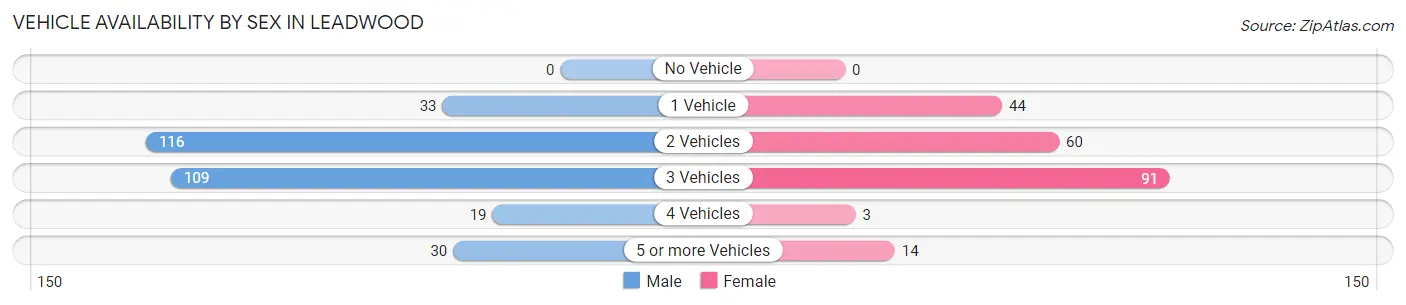
| Vehicles Available | Male | Female |
| No Vehicle | 0 (0.0%) | 0 (0.0%) |
| 1 Vehicle | 33 (10.7%) | 44 (20.7%) |
| 2 Vehicles | 116 (37.8%) | 60 (28.3%) |
| 3 Vehicles | 109 (35.5%) | 91 (42.9%) |
| 4 Vehicles | 19 (6.2%) | 3 (1.4%) |
| 5 or more Vehicles | 30 (9.8%) | 14 (6.6%) |
| Total | 307 (100.0%) | 212 (100.0%) |
Commute Time in Leadwood
The most frequently occuring commute durations in Leadwood are 20 to 24 minutes (97 commuters, 19.3%), 60 to 89 minutes (85 commuters, 16.9%), and 5 to 9 minutes (60 commuters, 11.9%).
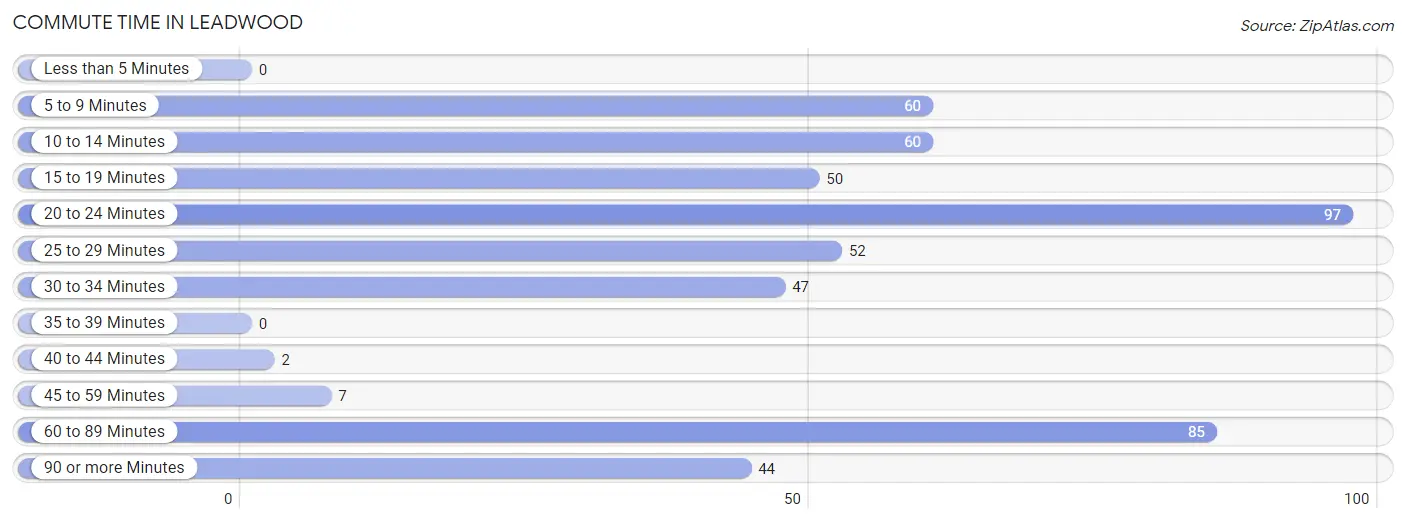
| Commute Time | # Commuters | % Commuters |
| Less than 5 Minutes | 0 | 0.0% |
| 5 to 9 Minutes | 60 | 11.9% |
| 10 to 14 Minutes | 60 | 11.9% |
| 15 to 19 Minutes | 50 | 9.9% |
| 20 to 24 Minutes | 97 | 19.3% |
| 25 to 29 Minutes | 52 | 10.3% |
| 30 to 34 Minutes | 47 | 9.3% |
| 35 to 39 Minutes | 0 | 0.0% |
| 40 to 44 Minutes | 2 | 0.4% |
| 45 to 59 Minutes | 7 | 1.4% |
| 60 to 89 Minutes | 85 | 16.9% |
| 90 or more Minutes | 44 | 8.7% |
Commute Time by Sex in Leadwood
The most common commute times in Leadwood are 60 to 89 minutes (81 commuters, 27.7%) for males and 20 to 24 minutes (61 commuters, 28.8%) for females.
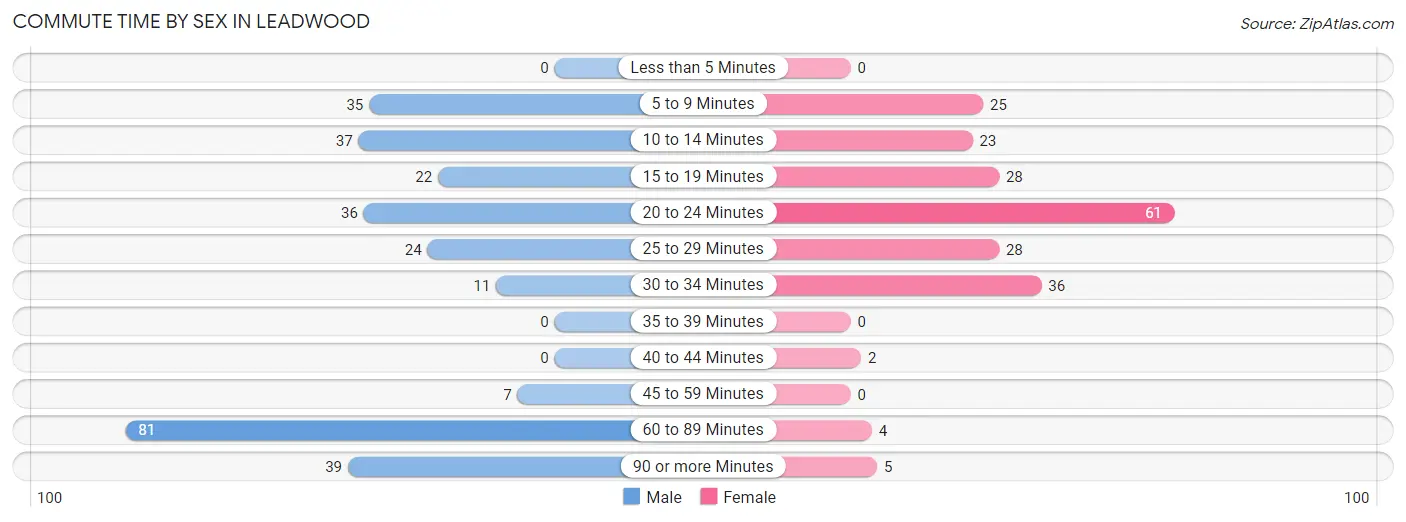
| Commute Time | Male | Female |
| Less than 5 Minutes | 0 (0.0%) | 0 (0.0%) |
| 5 to 9 Minutes | 35 (12.0%) | 25 (11.8%) |
| 10 to 14 Minutes | 37 (12.7%) | 23 (10.8%) |
| 15 to 19 Minutes | 22 (7.5%) | 28 (13.2%) |
| 20 to 24 Minutes | 36 (12.3%) | 61 (28.8%) |
| 25 to 29 Minutes | 24 (8.2%) | 28 (13.2%) |
| 30 to 34 Minutes | 11 (3.8%) | 36 (17.0%) |
| 35 to 39 Minutes | 0 (0.0%) | 0 (0.0%) |
| 40 to 44 Minutes | 0 (0.0%) | 2 (0.9%) |
| 45 to 59 Minutes | 7 (2.4%) | 0 (0.0%) |
| 60 to 89 Minutes | 81 (27.7%) | 4 (1.9%) |
| 90 or more Minutes | 39 (13.4%) | 5 (2.4%) |
Time of Departure to Work by Sex in Leadwood
The most frequent times of departure to work in Leadwood are 12:00 AM to 4:59 AM (95, 32.5%) for males and 12:00 AM to 4:59 AM (52, 24.5%) for females.
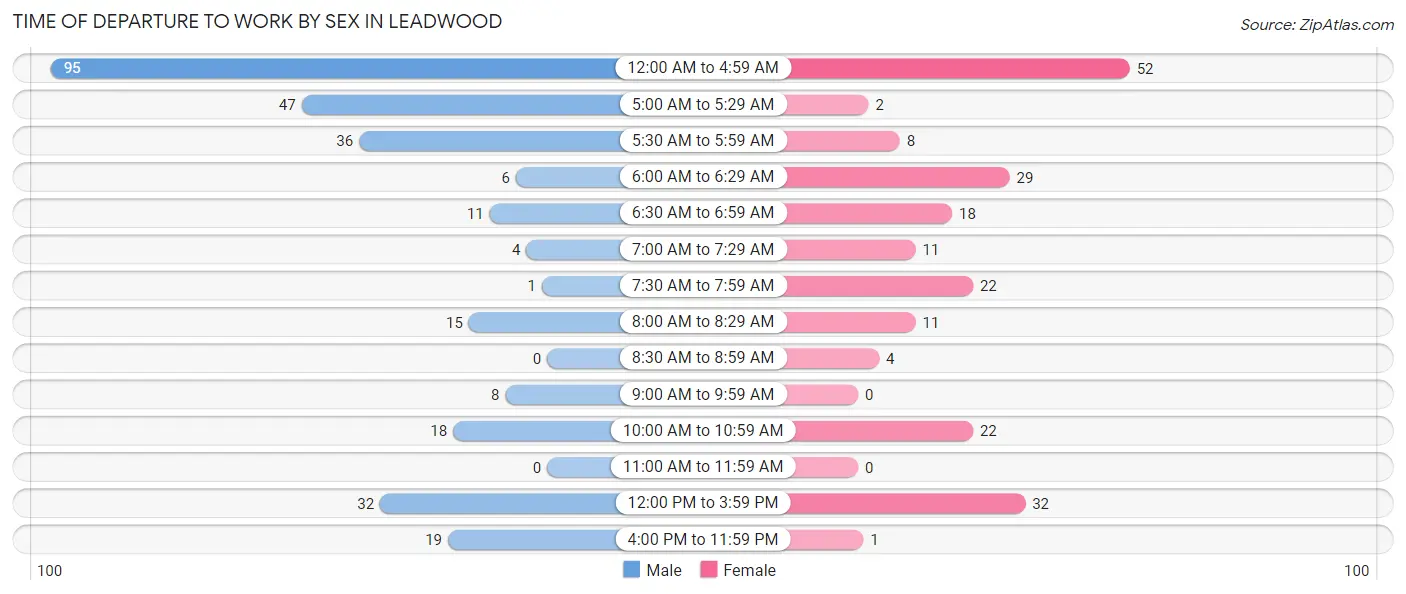
| Time of Departure | Male | Female |
| 12:00 AM to 4:59 AM | 95 (32.5%) | 52 (24.5%) |
| 5:00 AM to 5:29 AM | 47 (16.1%) | 2 (0.9%) |
| 5:30 AM to 5:59 AM | 36 (12.3%) | 8 (3.8%) |
| 6:00 AM to 6:29 AM | 6 (2.1%) | 29 (13.7%) |
| 6:30 AM to 6:59 AM | 11 (3.8%) | 18 (8.5%) |
| 7:00 AM to 7:29 AM | 4 (1.4%) | 11 (5.2%) |
| 7:30 AM to 7:59 AM | 1 (0.3%) | 22 (10.4%) |
| 8:00 AM to 8:29 AM | 15 (5.1%) | 11 (5.2%) |
| 8:30 AM to 8:59 AM | 0 (0.0%) | 4 (1.9%) |
| 9:00 AM to 9:59 AM | 8 (2.7%) | 0 (0.0%) |
| 10:00 AM to 10:59 AM | 18 (6.2%) | 22 (10.4%) |
| 11:00 AM to 11:59 AM | 0 (0.0%) | 0 (0.0%) |
| 12:00 PM to 3:59 PM | 32 (11.0%) | 32 (15.1%) |
| 4:00 PM to 11:59 PM | 19 (6.5%) | 1 (0.5%) |
| Total | 292 (100.0%) | 212 (100.0%) |
Housing Occupancy in Leadwood
Occupancy by Ownership in Leadwood
Of the total 500 dwellings in Leadwood, owner-occupied units account for 338 (67.6%), while renter-occupied units make up 162 (32.4%).
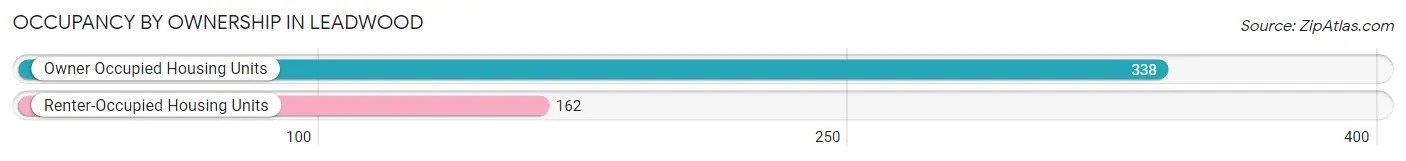
| Occupancy | # Housing Units | % Housing Units |
| Owner Occupied Housing Units | 338 | 67.6% |
| Renter-Occupied Housing Units | 162 | 32.4% |
| Total Occupied Housing Units | 500 | 100.0% |
Occupancy by Household Size in Leadwood
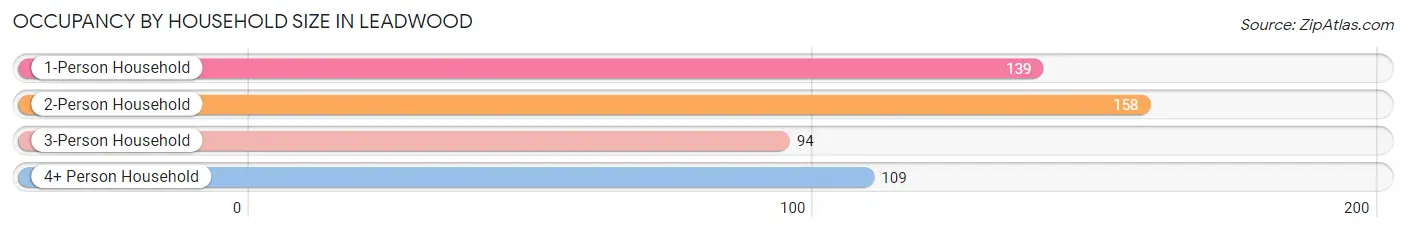
| Household Size | # Housing Units | % Housing Units |
| 1-Person Household | 139 | 27.8% |
| 2-Person Household | 158 | 31.6% |
| 3-Person Household | 94 | 18.8% |
| 4+ Person Household | 109 | 21.8% |
| Total Housing Units | 500 | 100.0% |
Occupancy by Ownership by Household Size in Leadwood
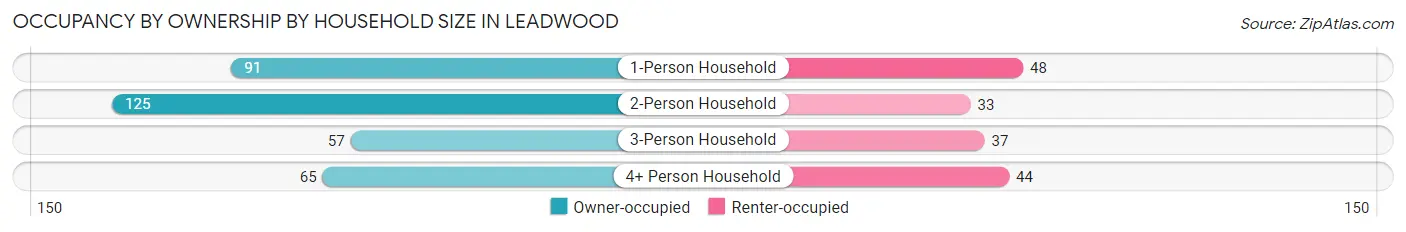
| Household Size | Owner-occupied | Renter-occupied |
| 1-Person Household | 91 (65.5%) | 48 (34.5%) |
| 2-Person Household | 125 (79.1%) | 33 (20.9%) |
| 3-Person Household | 57 (60.6%) | 37 (39.4%) |
| 4+ Person Household | 65 (59.6%) | 44 (40.4%) |
| Total Housing Units | 338 (67.6%) | 162 (32.4%) |
Occupancy by Educational Attainment in Leadwood
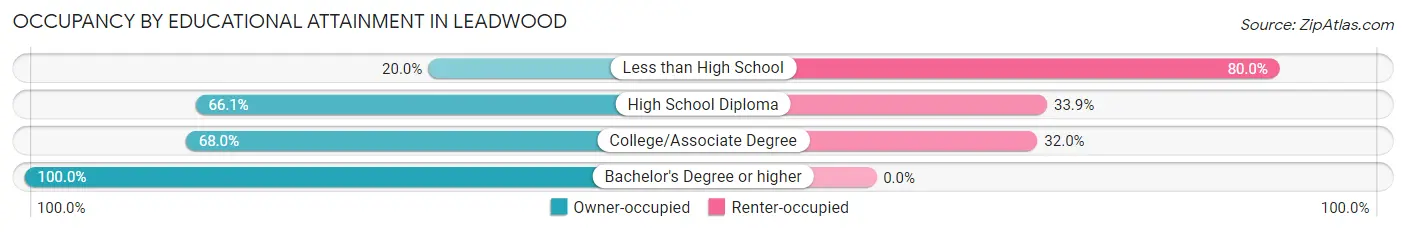
| Household Size | Owner-occupied | Renter-occupied |
| Less than High School | 8 (20.0%) | 32 (80.0%) |
| High School Diploma | 162 (66.1%) | 83 (33.9%) |
| College/Associate Degree | 100 (68.0%) | 47 (32.0%) |
| Bachelor's Degree or higher | 68 (100.0%) | 0 (0.0%) |
Occupancy by Age of Householder in Leadwood
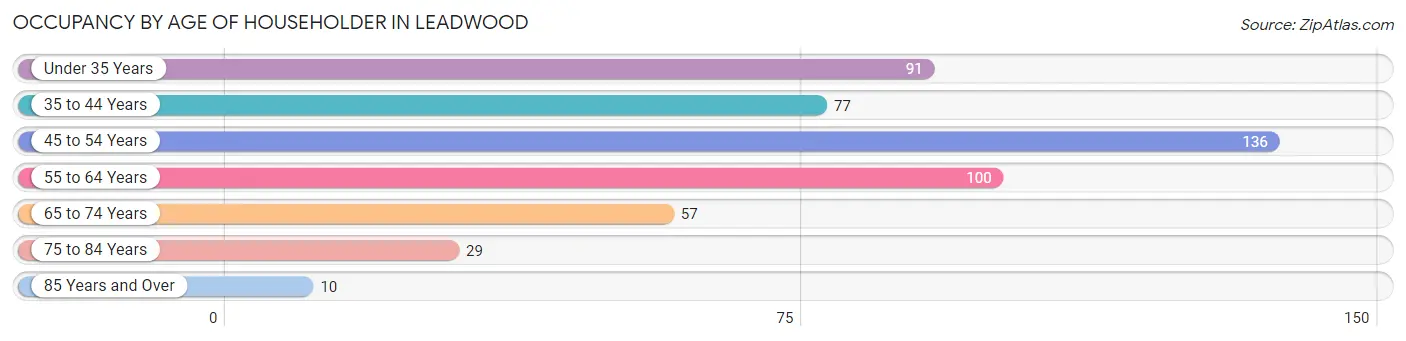
| Age Bracket | # Households | % Households |
| Under 35 Years | 91 | 18.2% |
| 35 to 44 Years | 77 | 15.4% |
| 45 to 54 Years | 136 | 27.2% |
| 55 to 64 Years | 100 | 20.0% |
| 65 to 74 Years | 57 | 11.4% |
| 75 to 84 Years | 29 | 5.8% |
| 85 Years and Over | 10 | 2.0% |
| Total | 500 | 100.0% |
Housing Finances in Leadwood
Median Income by Occupancy in Leadwood
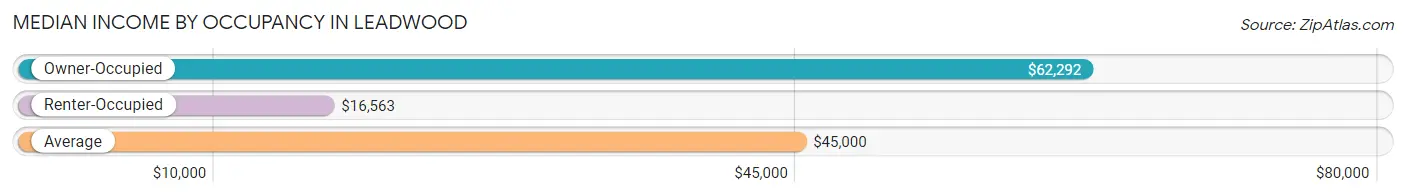
| Occupancy Type | # Households | Median Income |
| Owner-Occupied | 338 (67.6%) | $62,292 |
| Renter-Occupied | 162 (32.4%) | $16,563 |
| Average | 500 (100.0%) | $45,000 |
Occupancy by Householder Income Bracket in Leadwood
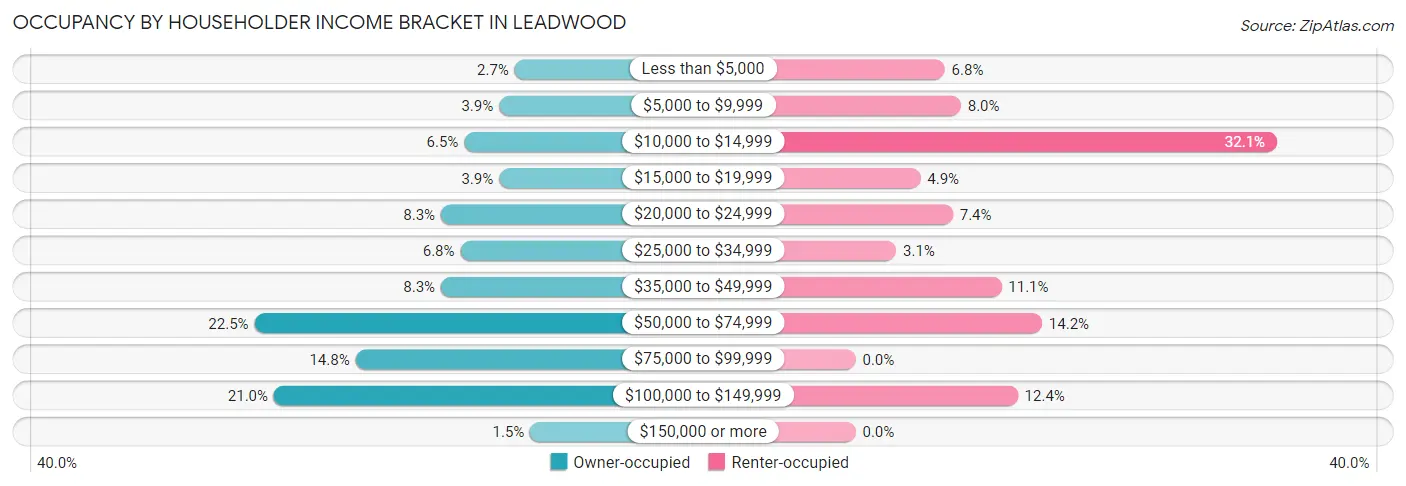
| Income Bracket | Owner-occupied | Renter-occupied |
| Less than $5,000 | 9 (2.7%) | 11 (6.8%) |
| $5,000 to $9,999 | 13 (3.8%) | 13 (8.0%) |
| $10,000 to $14,999 | 22 (6.5%) | 52 (32.1%) |
| $15,000 to $19,999 | 13 (3.8%) | 8 (4.9%) |
| $20,000 to $24,999 | 28 (8.3%) | 12 (7.4%) |
| $25,000 to $34,999 | 23 (6.8%) | 5 (3.1%) |
| $35,000 to $49,999 | 28 (8.3%) | 18 (11.1%) |
| $50,000 to $74,999 | 76 (22.5%) | 23 (14.2%) |
| $75,000 to $99,999 | 50 (14.8%) | 0 (0.0%) |
| $100,000 to $149,999 | 71 (21.0%) | 20 (12.3%) |
| $150,000 or more | 5 (1.5%) | 0 (0.0%) |
| Total | 338 (100.0%) | 162 (100.0%) |
Monthly Housing Cost Tiers in Leadwood
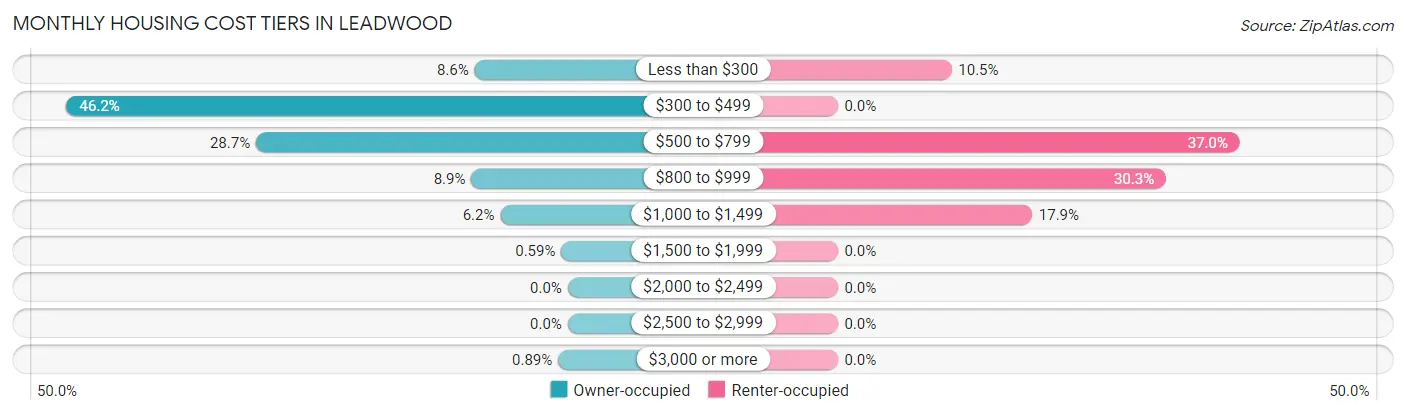
| Monthly Cost | Owner-occupied | Renter-occupied |
| Less than $300 | 29 (8.6%) | 17 (10.5%) |
| $300 to $499 | 156 (46.2%) | 0 (0.0%) |
| $500 to $799 | 97 (28.7%) | 60 (37.0%) |
| $800 to $999 | 30 (8.9%) | 49 (30.2%) |
| $1,000 to $1,499 | 21 (6.2%) | 29 (17.9%) |
| $1,500 to $1,999 | 2 (0.6%) | 0 (0.0%) |
| $2,000 to $2,499 | 0 (0.0%) | 0 (0.0%) |
| $2,500 to $2,999 | 0 (0.0%) | 0 (0.0%) |
| $3,000 or more | 3 (0.9%) | 0 (0.0%) |
| Total | 338 (100.0%) | 162 (100.0%) |
Physical Housing Characteristics in Leadwood
Housing Structures in Leadwood
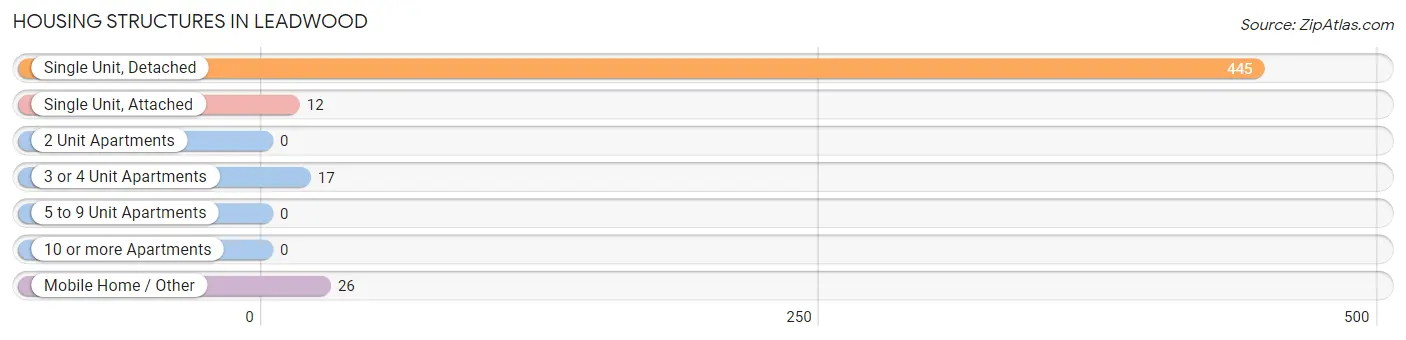
| Structure Type | # Housing Units | % Housing Units |
| Single Unit, Detached | 445 | 89.0% |
| Single Unit, Attached | 12 | 2.4% |
| 2 Unit Apartments | 0 | 0.0% |
| 3 or 4 Unit Apartments | 17 | 3.4% |
| 5 to 9 Unit Apartments | 0 | 0.0% |
| 10 or more Apartments | 0 | 0.0% |
| Mobile Home / Other | 26 | 5.2% |
| Total | 500 | 100.0% |
Housing Structures by Occupancy in Leadwood
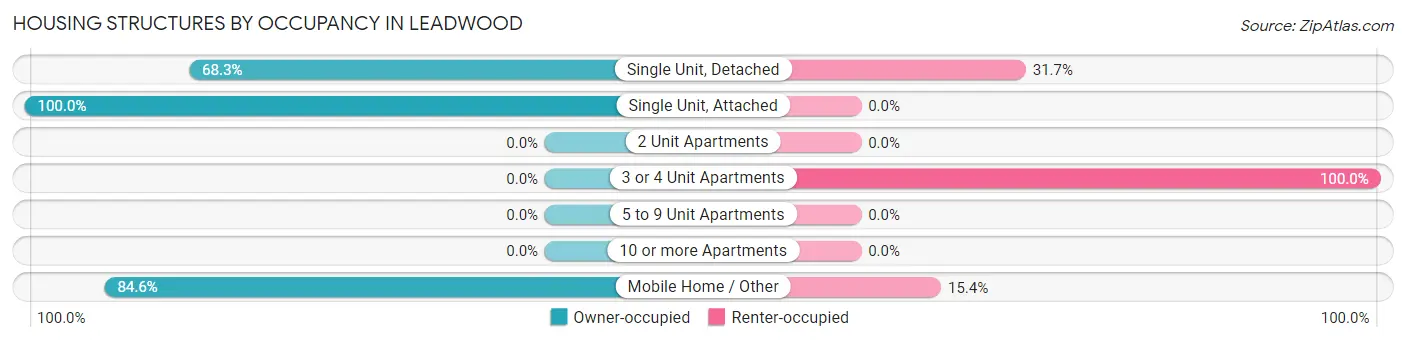
| Structure Type | Owner-occupied | Renter-occupied |
| Single Unit, Detached | 304 (68.3%) | 141 (31.7%) |
| Single Unit, Attached | 12 (100.0%) | 0 (0.0%) |
| 2 Unit Apartments | 0 (0.0%) | 0 (0.0%) |
| 3 or 4 Unit Apartments | 0 (0.0%) | 17 (100.0%) |
| 5 to 9 Unit Apartments | 0 (0.0%) | 0 (0.0%) |
| 10 or more Apartments | 0 (0.0%) | 0 (0.0%) |
| Mobile Home / Other | 22 (84.6%) | 4 (15.4%) |
| Total | 338 (67.6%) | 162 (32.4%) |
Housing Structures by Number of Rooms in Leadwood
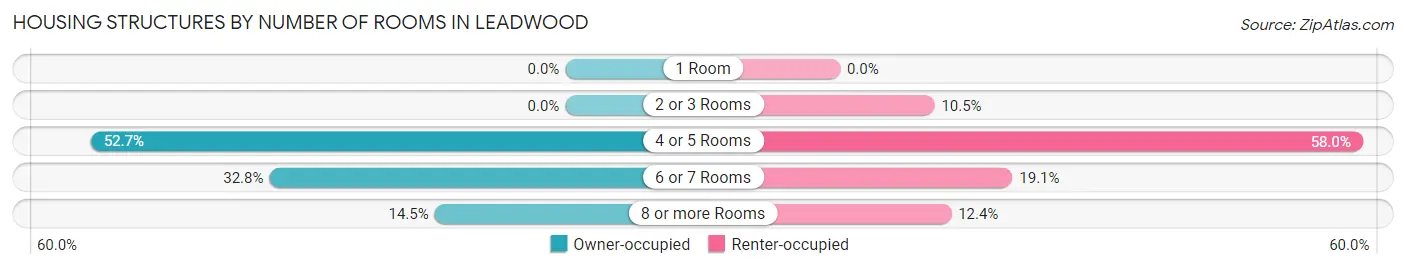
| Number of Rooms | Owner-occupied | Renter-occupied |
| 1 Room | 0 (0.0%) | 0 (0.0%) |
| 2 or 3 Rooms | 0 (0.0%) | 17 (10.5%) |
| 4 or 5 Rooms | 178 (52.7%) | 94 (58.0%) |
| 6 or 7 Rooms | 111 (32.8%) | 31 (19.1%) |
| 8 or more Rooms | 49 (14.5%) | 20 (12.3%) |
| Total | 338 (100.0%) | 162 (100.0%) |
Housing Structure by Heating Type in Leadwood
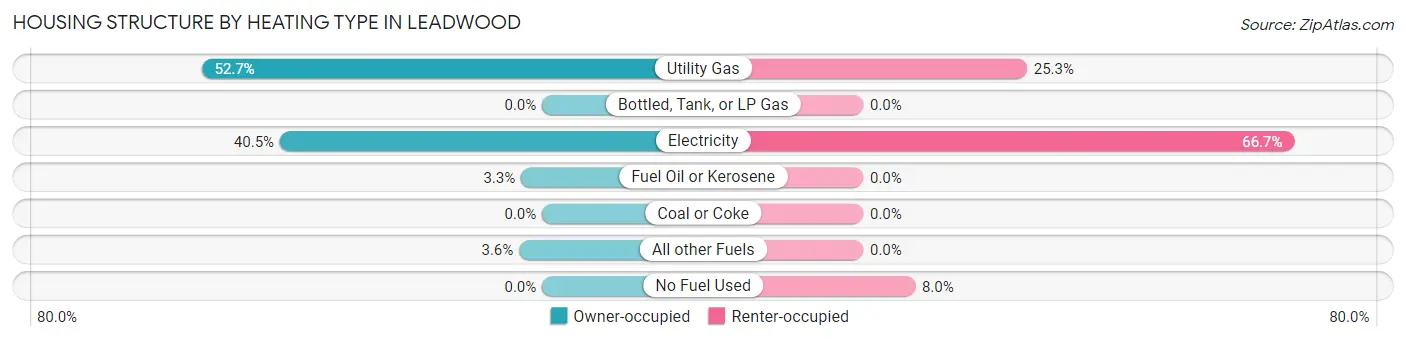
| Heating Type | Owner-occupied | Renter-occupied |
| Utility Gas | 178 (52.7%) | 41 (25.3%) |
| Bottled, Tank, or LP Gas | 0 (0.0%) | 0 (0.0%) |
| Electricity | 137 (40.5%) | 108 (66.7%) |
| Fuel Oil or Kerosene | 11 (3.3%) | 0 (0.0%) |
| Coal or Coke | 0 (0.0%) | 0 (0.0%) |
| All other Fuels | 12 (3.5%) | 0 (0.0%) |
| No Fuel Used | 0 (0.0%) | 13 (8.0%) |
| Total | 338 (100.0%) | 162 (100.0%) |
Household Vehicle Usage in Leadwood
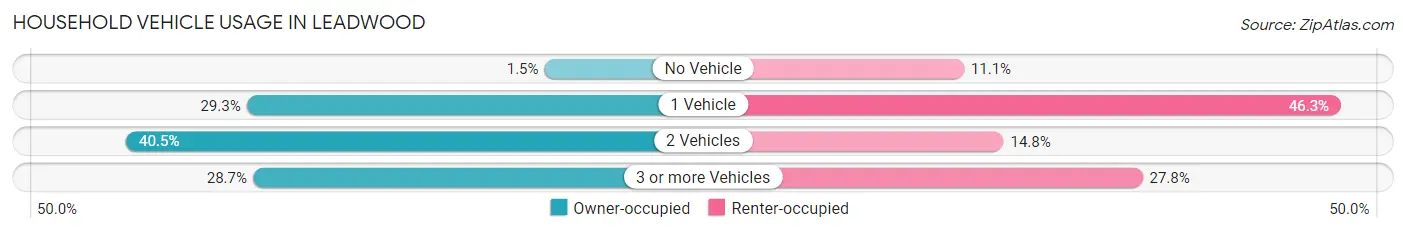
| Vehicles per Household | Owner-occupied | Renter-occupied |
| No Vehicle | 5 (1.5%) | 18 (11.1%) |
| 1 Vehicle | 99 (29.3%) | 75 (46.3%) |
| 2 Vehicles | 137 (40.5%) | 24 (14.8%) |
| 3 or more Vehicles | 97 (28.7%) | 45 (27.8%) |
| Total | 338 (100.0%) | 162 (100.0%) |
Real Estate & Mortgages in Leadwood
Real Estate and Mortgage Overview in Leadwood
| Characteristic | Without Mortgage | With Mortgage |
| Housing Units | 225 | 113 |
| Median Property Value | $60,200 | $51,500 |
| Median Household Income | $65,046 | $2 |
| Monthly Housing Costs | $427 | $0 |
| Real Estate Taxes | $581 | $8 |
Property Value by Mortgage Status in Leadwood
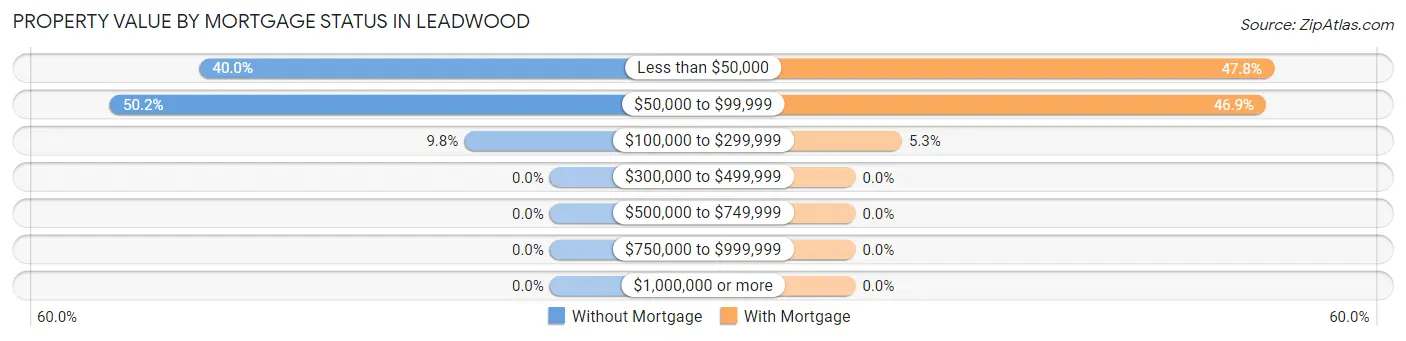
| Property Value | Without Mortgage | With Mortgage |
| Less than $50,000 | 90 (40.0%) | 54 (47.8%) |
| $50,000 to $99,999 | 113 (50.2%) | 53 (46.9%) |
| $100,000 to $299,999 | 22 (9.8%) | 6 (5.3%) |
| $300,000 to $499,999 | 0 (0.0%) | 0 (0.0%) |
| $500,000 to $749,999 | 0 (0.0%) | 0 (0.0%) |
| $750,000 to $999,999 | 0 (0.0%) | 0 (0.0%) |
| $1,000,000 or more | 0 (0.0%) | 0 (0.0%) |
| Total | 225 (100.0%) | 113 (100.0%) |
Household Income by Mortgage Status in Leadwood
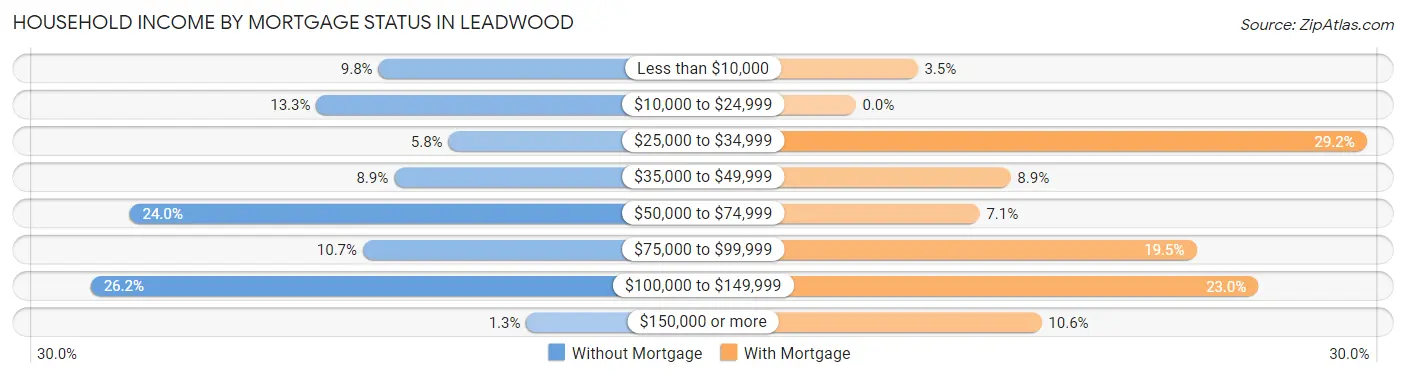
| Household Income | Without Mortgage | With Mortgage |
| Less than $10,000 | 22 (9.8%) | 4 (3.5%) |
| $10,000 to $24,999 | 30 (13.3%) | 0 (0.0%) |
| $25,000 to $34,999 | 13 (5.8%) | 33 (29.2%) |
| $35,000 to $49,999 | 20 (8.9%) | 10 (8.8%) |
| $50,000 to $74,999 | 54 (24.0%) | 8 (7.1%) |
| $75,000 to $99,999 | 24 (10.7%) | 22 (19.5%) |
| $100,000 to $149,999 | 59 (26.2%) | 26 (23.0%) |
| $150,000 or more | 3 (1.3%) | 12 (10.6%) |
| Total | 225 (100.0%) | 113 (100.0%) |
Property Value to Household Income Ratio in Leadwood
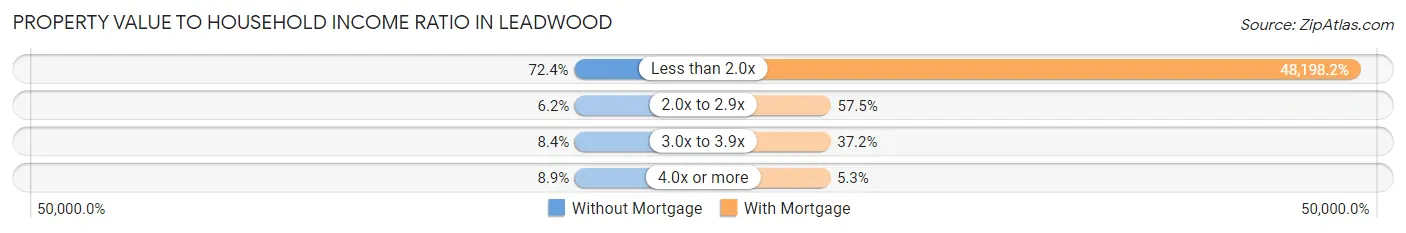
| Value-to-Income Ratio | Without Mortgage | With Mortgage |
| Less than 2.0x | 163 (72.4%) | 54,464 (48,198.2%) |
| 2.0x to 2.9x | 14 (6.2%) | 65 (57.5%) |
| 3.0x to 3.9x | 19 (8.4%) | 42 (37.2%) |
| 4.0x or more | 20 (8.9%) | 6 (5.3%) |
| Total | 225 (100.0%) | 113 (100.0%) |
Real Estate Taxes by Mortgage Status in Leadwood
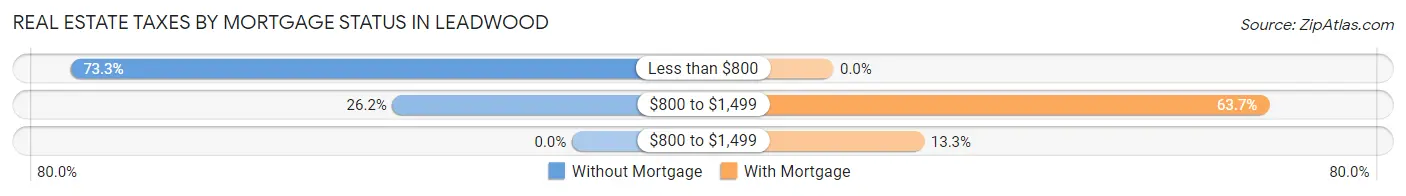
| Property Taxes | Without Mortgage | With Mortgage |
| Less than $800 | 165 (73.3%) | 0 (0.0%) |
| $800 to $1,499 | 59 (26.2%) | 72 (63.7%) |
| $800 to $1,499 | 0 (0.0%) | 15 (13.3%) |
| Total | 225 (100.0%) | 113 (100.0%) |
Health & Disability in Leadwood
Health Insurance Coverage by Age in Leadwood
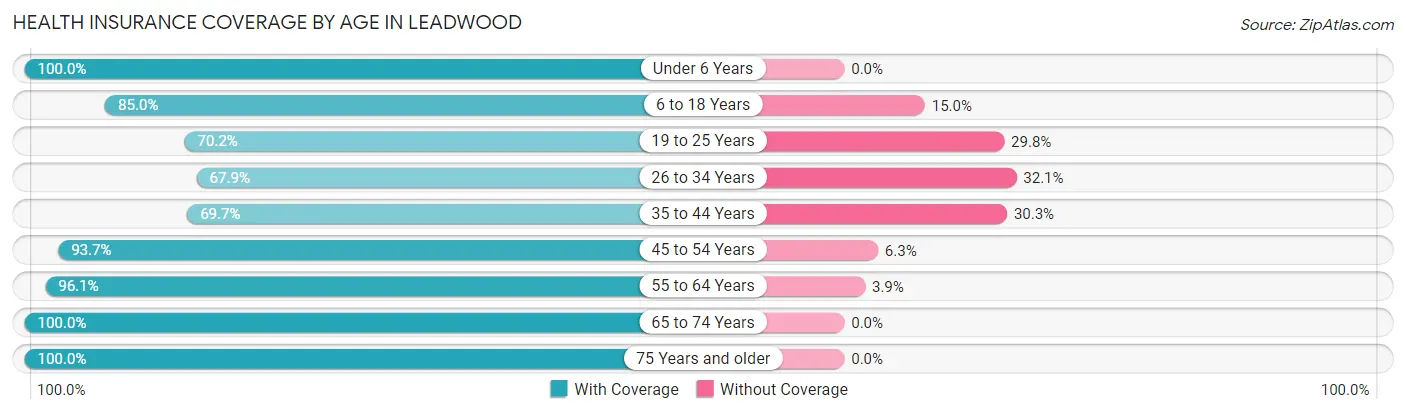
| Age Bracket | With Coverage | Without Coverage |
| Under 6 Years | 170 (100.0%) | 0 (0.0%) |
| 6 to 18 Years | 215 (85.0%) | 38 (15.0%) |
| 19 to 25 Years | 146 (70.2%) | 62 (29.8%) |
| 26 to 34 Years | 91 (67.9%) | 43 (32.1%) |
| 35 to 44 Years | 85 (69.7%) | 37 (30.3%) |
| 45 to 54 Years | 284 (93.7%) | 19 (6.3%) |
| 55 to 64 Years | 149 (96.1%) | 6 (3.9%) |
| 65 to 74 Years | 80 (100.0%) | 0 (0.0%) |
| 75 Years and older | 50 (100.0%) | 0 (0.0%) |
| Total | 1,270 (86.1%) | 205 (13.9%) |
Health Insurance Coverage by Citizenship Status in Leadwood
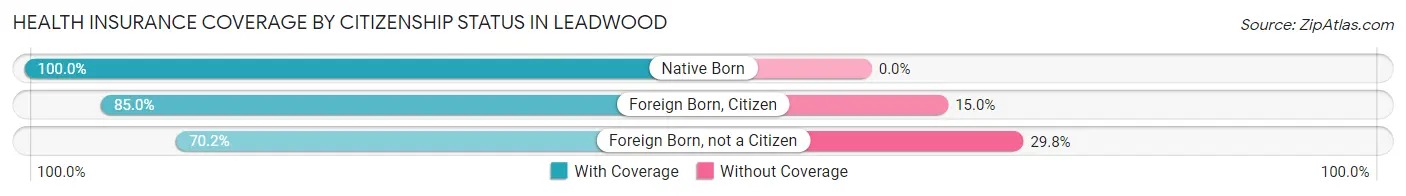
| Citizenship Status | With Coverage | Without Coverage |
| Native Born | 170 (100.0%) | 0 (0.0%) |
| Foreign Born, Citizen | 215 (85.0%) | 38 (15.0%) |
| Foreign Born, not a Citizen | 146 (70.2%) | 62 (29.8%) |
Health Insurance Coverage by Household Income in Leadwood
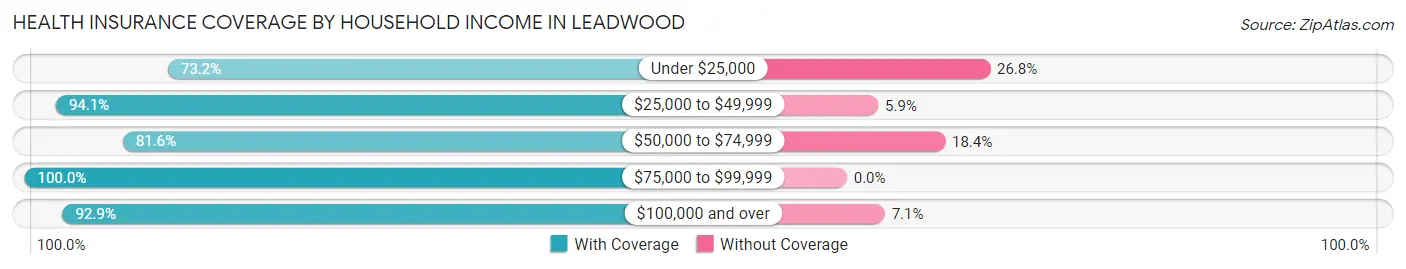
| Household Income | With Coverage | Without Coverage |
| Under $25,000 | 240 (73.2%) | 88 (26.8%) |
| $25,000 to $49,999 | 224 (94.1%) | 14 (5.9%) |
| $50,000 to $74,999 | 350 (81.6%) | 79 (18.4%) |
| $75,000 to $99,999 | 142 (100.0%) | 0 (0.0%) |
| $100,000 and over | 314 (92.9%) | 24 (7.1%) |
Public vs Private Health Insurance Coverage by Age in Leadwood
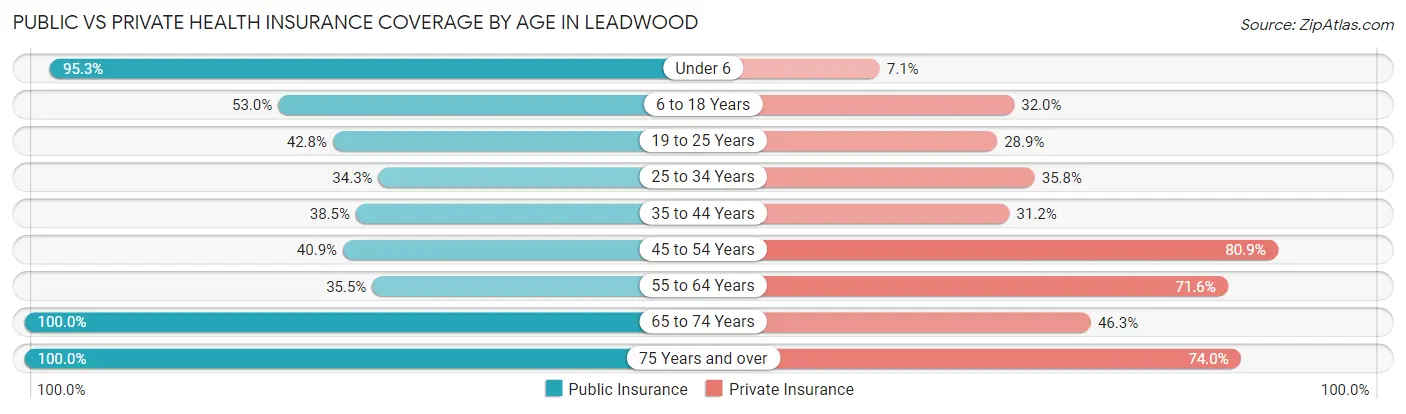
| Age Bracket | Public Insurance | Private Insurance |
| Under 6 | 162 (95.3%) | 12 (7.1%) |
| 6 to 18 Years | 134 (53.0%) | 81 (32.0%) |
| 19 to 25 Years | 89 (42.8%) | 60 (28.8%) |
| 25 to 34 Years | 46 (34.3%) | 48 (35.8%) |
| 35 to 44 Years | 47 (38.5%) | 38 (31.1%) |
| 45 to 54 Years | 124 (40.9%) | 245 (80.9%) |
| 55 to 64 Years | 55 (35.5%) | 111 (71.6%) |
| 65 to 74 Years | 80 (100.0%) | 37 (46.3%) |
| 75 Years and over | 50 (100.0%) | 37 (74.0%) |
| Total | 787 (53.4%) | 669 (45.4%) |
Disability Status by Sex by Age in Leadwood
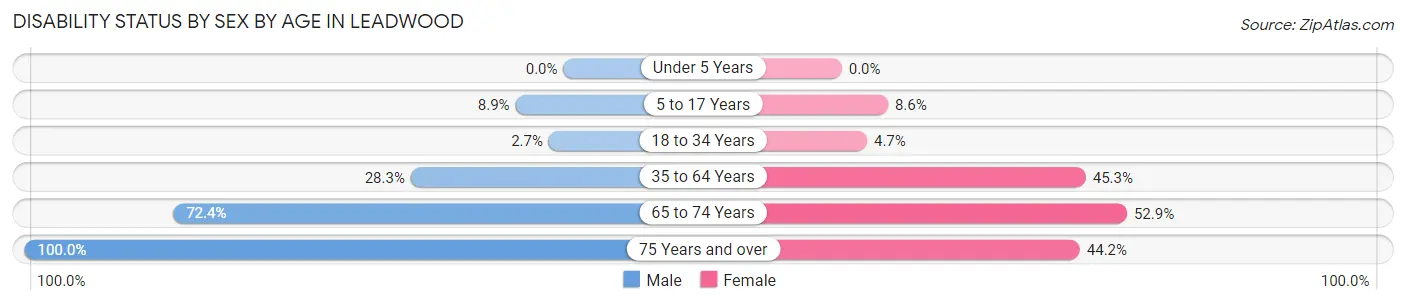
| Age Bracket | Male | Female |
| Under 5 Years | 0 (0.0%) | 0 (0.0%) |
| 5 to 17 Years | 8 (8.9%) | 12 (8.6%) |
| 18 to 34 Years | 5 (2.7%) | 9 (4.7%) |
| 35 to 64 Years | 68 (28.3%) | 154 (45.3%) |
| 65 to 74 Years | 21 (72.4%) | 27 (52.9%) |
| 75 Years and over | 7 (100.0%) | 19 (44.2%) |
Disability Class by Sex by Age in Leadwood
Disability Class: Hearing Difficulty
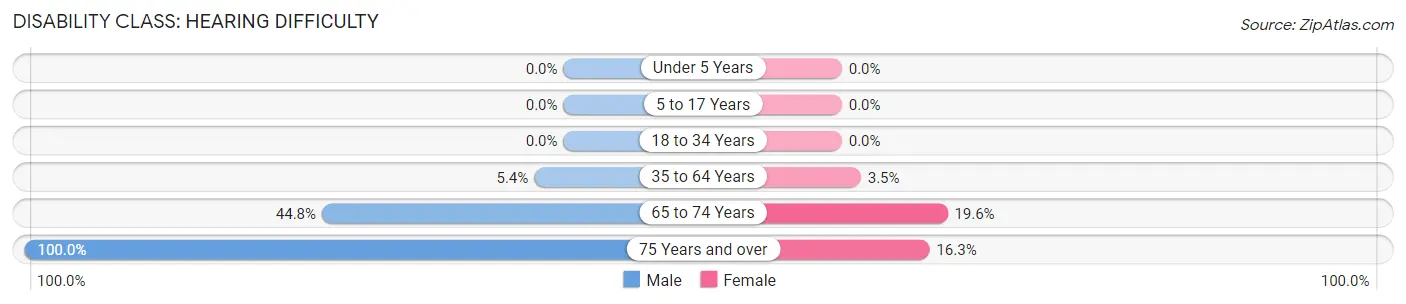
| Age Bracket | Male | Female |
| Under 5 Years | 0 (0.0%) | 0 (0.0%) |
| 5 to 17 Years | 0 (0.0%) | 0 (0.0%) |
| 18 to 34 Years | 0 (0.0%) | 0 (0.0%) |
| 35 to 64 Years | 13 (5.4%) | 12 (3.5%) |
| 65 to 74 Years | 13 (44.8%) | 10 (19.6%) |
| 75 Years and over | 7 (100.0%) | 7 (16.3%) |
Disability Class: Vision Difficulty
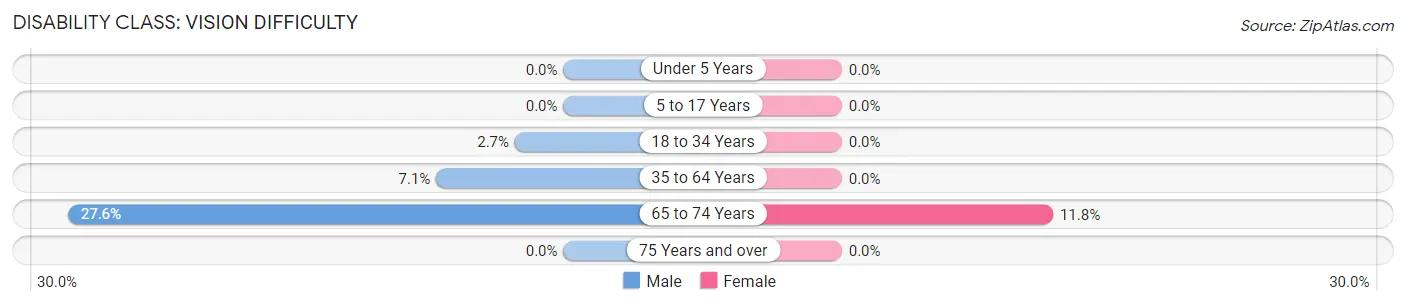
| Age Bracket | Male | Female |
| Under 5 Years | 0 (0.0%) | 0 (0.0%) |
| 5 to 17 Years | 0 (0.0%) | 0 (0.0%) |
| 18 to 34 Years | 5 (2.7%) | 0 (0.0%) |
| 35 to 64 Years | 17 (7.1%) | 0 (0.0%) |
| 65 to 74 Years | 8 (27.6%) | 6 (11.8%) |
| 75 Years and over | 0 (0.0%) | 0 (0.0%) |
Disability Class: Cognitive Difficulty
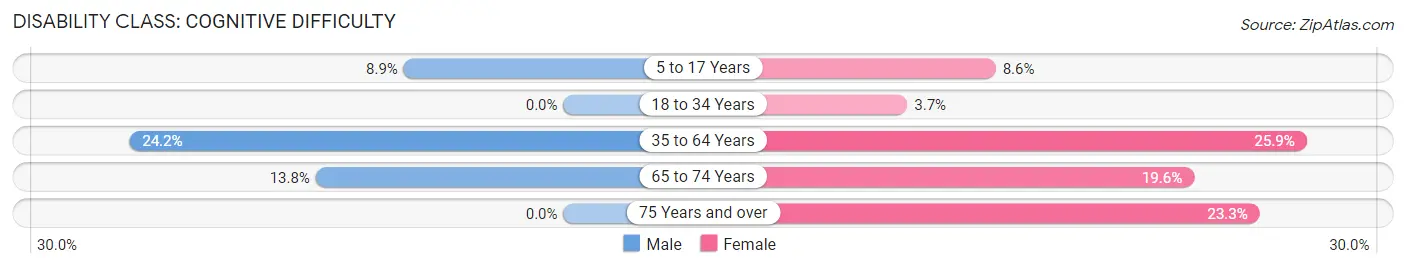
| Age Bracket | Male | Female |
| 5 to 17 Years | 8 (8.9%) | 12 (8.6%) |
| 18 to 34 Years | 0 (0.0%) | 7 (3.6%) |
| 35 to 64 Years | 58 (24.2%) | 88 (25.9%) |
| 65 to 74 Years | 4 (13.8%) | 10 (19.6%) |
| 75 Years and over | 0 (0.0%) | 10 (23.3%) |
Disability Class: Ambulatory Difficulty
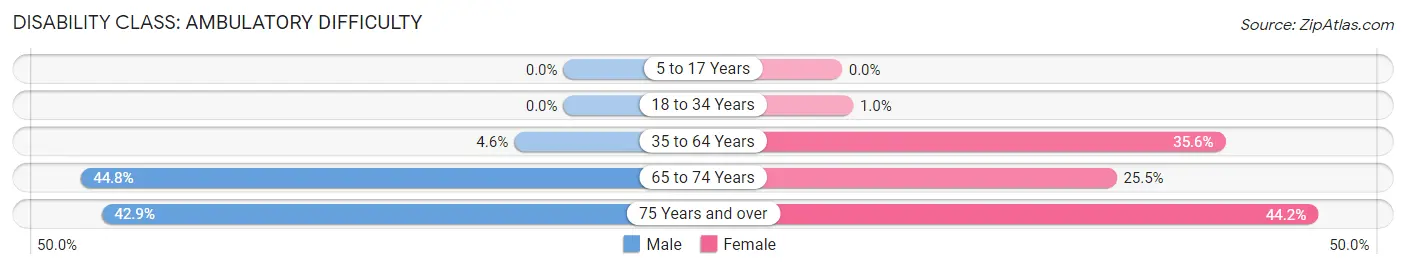
| Age Bracket | Male | Female |
| 5 to 17 Years | 0 (0.0%) | 0 (0.0%) |
| 18 to 34 Years | 0 (0.0%) | 2 (1.0%) |
| 35 to 64 Years | 11 (4.6%) | 121 (35.6%) |
| 65 to 74 Years | 13 (44.8%) | 13 (25.5%) |
| 75 Years and over | 3 (42.9%) | 19 (44.2%) |
Disability Class: Self-Care Difficulty
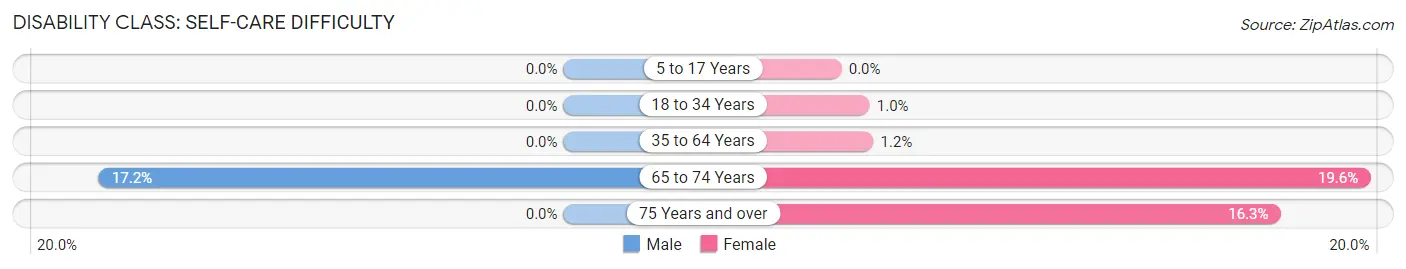
| Age Bracket | Male | Female |
| 5 to 17 Years | 0 (0.0%) | 0 (0.0%) |
| 18 to 34 Years | 0 (0.0%) | 2 (1.0%) |
| 35 to 64 Years | 0 (0.0%) | 4 (1.2%) |
| 65 to 74 Years | 5 (17.2%) | 10 (19.6%) |
| 75 Years and over | 0 (0.0%) | 7 (16.3%) |
Technology Access in Leadwood
Computing Device Access in Leadwood
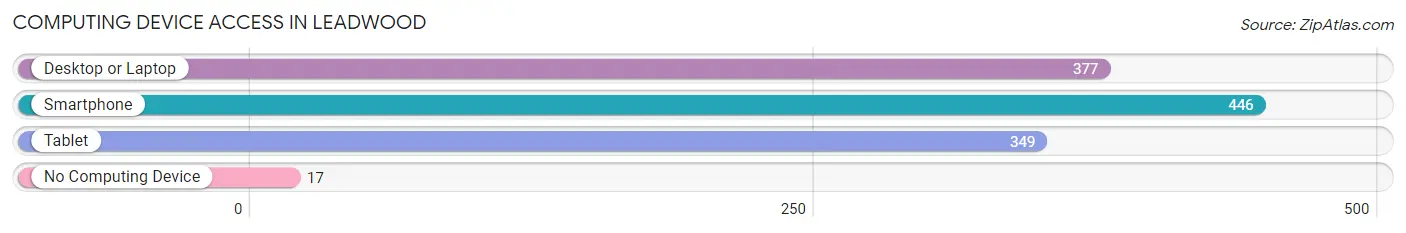
| Device Type | # Households | % Households |
| Desktop or Laptop | 377 | 75.4% |
| Smartphone | 446 | 89.2% |
| Tablet | 349 | 69.8% |
| No Computing Device | 17 | 3.4% |
| Total | 500 | 100.0% |
Internet Access in Leadwood
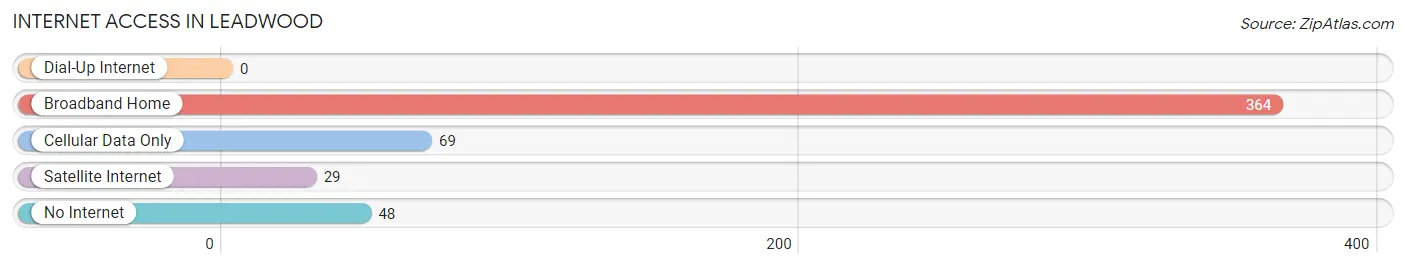
| Internet Type | # Households | % Households |
| Dial-Up Internet | 0 | 0.0% |
| Broadband Home | 364 | 72.8% |
| Cellular Data Only | 69 | 13.8% |
| Satellite Internet | 29 | 5.8% |
| No Internet | 48 | 9.6% |
| Total | 500 | 100.0% |
Leadwood Summary
Introduction
Leadwood is a small city located in St. Francois County, Missouri. It is situated in the southeastern part of the state, about an hour’s drive from St. Louis. The city has a population of 1,717 people, according to the 2010 census. Leadwood is a rural community with a rich history and a strong sense of community.
History
Leadwood was founded in 1883 by a group of miners who were looking for lead ore. The town was named after the lead ore that was found in the area. The miners built a smelter and a post office was established in 1884. The town grew quickly and by the early 1900s, it had a population of over 1,000 people.
The town was a major producer of lead ore until the 1950s, when the mines began to close. The population of Leadwood began to decline and by the 1970s, it had dropped to just over 500 people.
In the 1980s, the town began to experience a resurgence. The population began to grow again and new businesses began to open. Today, Leadwood is a thriving community with a strong sense of community and a vibrant economy.
Geography
Leadwood is located in the southeastern part of Missouri, about an hour’s drive from St. Louis. The city is situated in the Ozark Mountains and is surrounded by rolling hills and forests. The city is located on the banks of the Big River, which flows through the area.
The climate in Leadwood is humid and subtropical, with hot summers and mild winters. The average temperature in the summer is around 80 degrees Fahrenheit and the average temperature in the winter is around 40 degrees Fahrenheit.
Economy
Leadwood’s economy is largely based on agriculture and tourism. The city is home to several farms, which produce a variety of crops, including corn, soybeans, and wheat. The city is also home to several wineries, which produce a variety of wines.
Tourism is also an important part of the economy. The city is home to several attractions, including the Leadwood Historical Museum, the Leadwood Golf Course, and the Leadwood State Park. The city also hosts several festivals throughout the year, including the Leadwood Fall Festival and the Leadwood Christmas Festival.
Demographics
According to the 2010 census, Leadwood has a population of 1,717 people. The population is predominantly white, with a small percentage of African Americans and Hispanics. The median household income is $37,000 and the median age is 40 years old.
Conclusion
Leadwood is a small city located in St. Francois County, Missouri. It is a rural community with a rich history and a strong sense of community. The city’s economy is largely based on agriculture and tourism and the population is predominantly white. Leadwood is a thriving community with a vibrant economy and a strong sense of community.
Common Questions
What is Per Capita Income in Leadwood?
Per Capita income in Leadwood is $18,602.
What is the Median Family Income in Leadwood?
Median Family Income in Leadwood is $65,682.
What is the Median Household income in Leadwood?
Median Household Income in Leadwood is $45,000.
What is Income or Wage Gap in Leadwood?
Income or Wage Gap in Leadwood is 32.3%.
Women in Leadwood earn 67.7 cents for every dollar earned by a man.
What is Family Income Deficit in Leadwood?
Family Income Deficit in Leadwood is $9,144.
Families that are below poverty line in Leadwood earn $9,144 less on average than the poverty threshold level.
What is Inequality or Gini Index in Leadwood?
Inequality or Gini Index in Leadwood is 0.45.
What is the Total Population of Leadwood?
Total Population of Leadwood is 1,475.
What is the Total Male Population of Leadwood?
Total Male Population of Leadwood is 583.
What is the Total Female Population of Leadwood?
Total Female Population of Leadwood is 892.
What is the Ratio of Males per 100 Females in Leadwood?
There are 65.36 Males per 100 Females in Leadwood.
What is the Ratio of Females per 100 Males in Leadwood?
There are 153.00 Females per 100 Males in Leadwood.
What is the Median Population Age in Leadwood?
Median Population Age in Leadwood is 34.1 Years.
What is the Average Family Size in Leadwood
Average Family Size in Leadwood is 3.3 People.
What is the Average Household Size in Leadwood
Average Household Size in Leadwood is 3.0 People.
How Large is the Labor Force in Leadwood?
There are 571 People in the Labor Forcein in Leadwood.
What is the Percentage of People in the Labor Force in Leadwood?
50.8% of People are in the Labor Force in Leadwood.
What is the Unemployment Rate in Leadwood?
Unemployment Rate in Leadwood is 6.8%.