Turkish vs Immigrants from Latvia Wage/Income Gap
COMPARE
Turkish
Immigrants from Latvia
Wage/Income Gap
Wage/Income Gap Comparison
Turks
Immigrants from Latvia
27.7%
WAGE/INCOME GAP
1.0/ 100
METRIC RATING
267th/ 347
METRIC RANK
26.7%
WAGE/INCOME GAP
8.9/ 100
METRIC RATING
220th/ 347
METRIC RANK
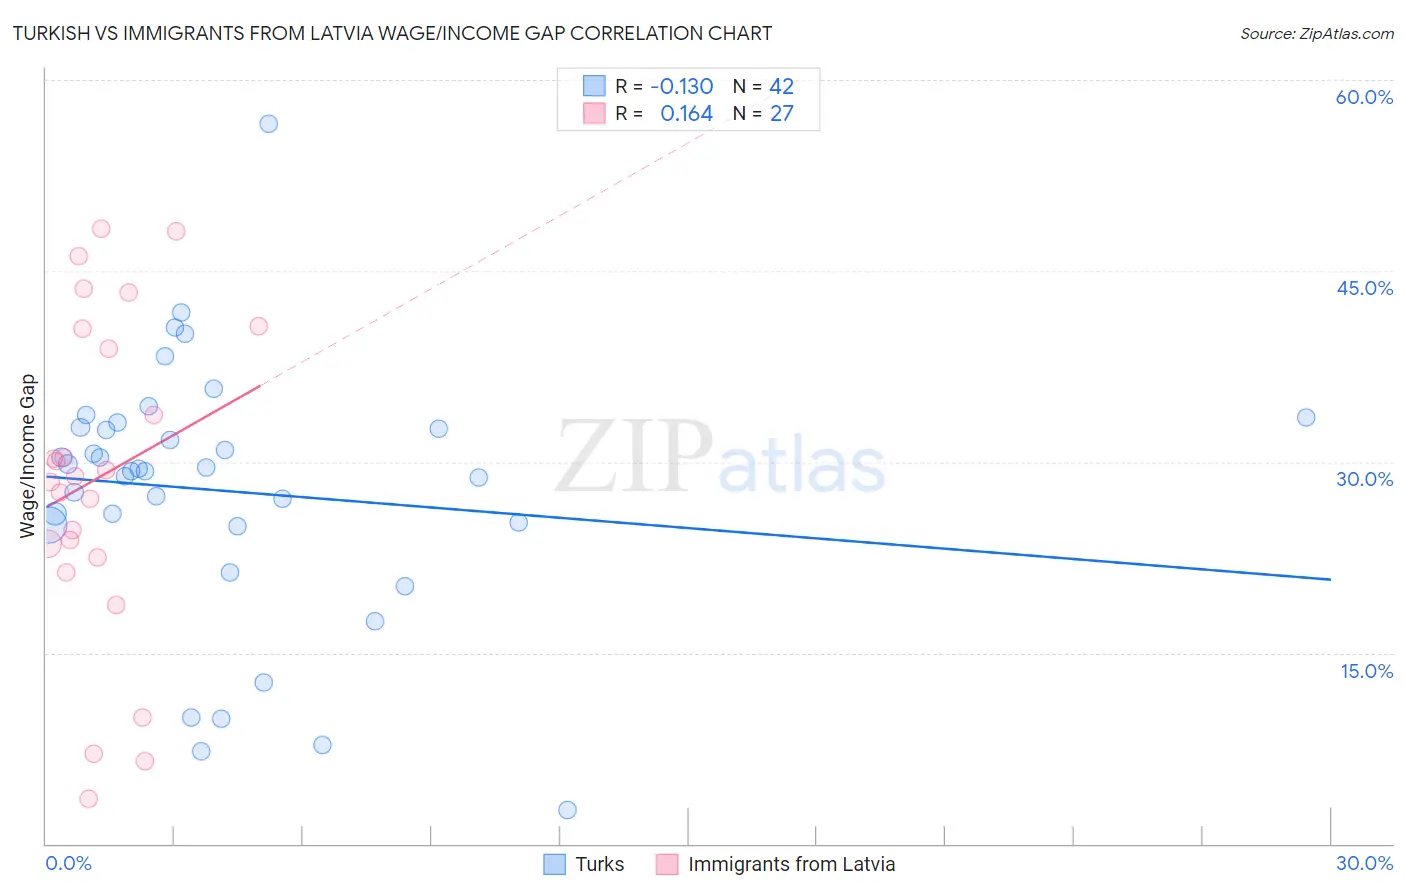
Turkish vs Immigrants from Latvia Wage/Income Gap Correlation Chart
The statistical analysis conducted on geographies consisting of 271,781,198 people shows a poor negative correlation between the proportion of Turks and wage/income gap percentage in the United States with a correlation coefficient (R) of -0.130 and weighted average of 27.7%. Similarly, the statistical analysis conducted on geographies consisting of 113,720,883 people shows a poor positive correlation between the proportion of Immigrants from Latvia and wage/income gap percentage in the United States with a correlation coefficient (R) of 0.164 and weighted average of 26.7%, a difference of 3.5%.
Wage/Income Gap Correlation Summary
| Measurement | Turkish | Immigrants from Latvia |
| Minimum | 2.6% | 3.5% |
| Maximum | 56.6% | 48.4% |
| Range | 54.0% | 44.8% |
| Mean | 27.7% | 28.8% |
| Median | 29.3% | 28.9% |
| Interquartile 25% (IQ1) | 25.1% | 22.5% |
| Interquartile 75% (IQ3) | 32.7% | 40.4% |
| Interquartile Range (IQR) | 7.6% | 18.0% |
| Standard Deviation (Sample) | 10.3% | 12.6% |
| Standard Deviation (Population) | 10.2% | 12.4% |
Similar Demographics by Wage/Income Gap
Demographics Similar to Turks by Wage/Income Gap
In terms of wage/income gap, the demographic groups most similar to Turks are Immigrants from Switzerland (27.7%, a difference of 0.020%), Serbian (27.7%, a difference of 0.020%), Hmong (27.7%, a difference of 0.020%), New Zealander (27.7%, a difference of 0.080%), and Potawatomi (27.7%, a difference of 0.090%).
| Demographics | Rating | Rank | Wage/Income Gap |
| Tongans | 1.7 /100 | #260 | Tragic 27.5% |
| Immigrants | Germany | 1.5 /100 | #261 | Tragic 27.5% |
| Immigrants | Lebanon | 1.5 /100 | #262 | Tragic 27.5% |
| Syrians | 1.4 /100 | #263 | Tragic 27.6% |
| Immigrants | Switzerland | 1.0 /100 | #264 | Tragic 27.7% |
| Serbians | 1.0 /100 | #265 | Tragic 27.7% |
| Hmong | 1.0 /100 | #266 | Tragic 27.7% |
| Turks | 1.0 /100 | #267 | Tragic 27.7% |
| New Zealanders | 1.0 /100 | #268 | Tragic 27.7% |
| Potawatomi | 0.9 /100 | #269 | Tragic 27.7% |
| Immigrants | Western Europe | 0.9 /100 | #270 | Tragic 27.8% |
| Ute | 0.8 /100 | #271 | Tragic 27.8% |
| Immigrants | Korea | 0.8 /100 | #272 | Tragic 27.8% |
| Bulgarians | 0.7 /100 | #273 | Tragic 27.8% |
| Americans | 0.7 /100 | #274 | Tragic 27.8% |
Demographics Similar to Immigrants from Latvia by Wage/Income Gap
In terms of wage/income gap, the demographic groups most similar to Immigrants from Latvia are Immigrants from Poland (26.7%, a difference of 0.010%), Immigrants from Saudi Arabia (26.7%, a difference of 0.040%), Brazilian (26.7%, a difference of 0.070%), Immigrants from Spain (26.8%, a difference of 0.070%), and Bolivian (26.8%, a difference of 0.11%).
| Demographics | Rating | Rank | Wage/Income Gap |
| Immigrants | Iraq | 10.3 /100 | #213 | Poor 26.7% |
| Immigrants | China | 10.3 /100 | #214 | Poor 26.7% |
| Yugoslavians | 9.7 /100 | #215 | Tragic 26.7% |
| Immigrants | Portugal | 9.5 /100 | #216 | Tragic 26.7% |
| Brazilians | 9.2 /100 | #217 | Tragic 26.7% |
| Immigrants | Saudi Arabia | 9.1 /100 | #218 | Tragic 26.7% |
| Immigrants | Poland | 8.9 /100 | #219 | Tragic 26.7% |
| Immigrants | Latvia | 8.9 /100 | #220 | Tragic 26.7% |
| Immigrants | Spain | 8.5 /100 | #221 | Tragic 26.8% |
| Bolivians | 8.3 /100 | #222 | Tragic 26.8% |
| Jordanians | 8.0 /100 | #223 | Tragic 26.8% |
| Immigrants | Argentina | 7.2 /100 | #224 | Tragic 26.8% |
| Immigrants | Ireland | 6.5 /100 | #225 | Tragic 26.9% |
| Asians | 5.9 /100 | #226 | Tragic 26.9% |
| Spaniards | 5.6 /100 | #227 | Tragic 27.0% |