Turkish vs Immigrants from Eastern Asia Wage/Income Gap
COMPARE
Turkish
Immigrants from Eastern Asia
Wage/Income Gap
Wage/Income Gap Comparison
Turks
Immigrants from Eastern Asia
27.7%
WAGE/INCOME GAP
1.0/ 100
METRIC RATING
267th/ 347
METRIC RANK
27.1%
WAGE/INCOME GAP
4.4/ 100
METRIC RATING
237th/ 347
METRIC RANK
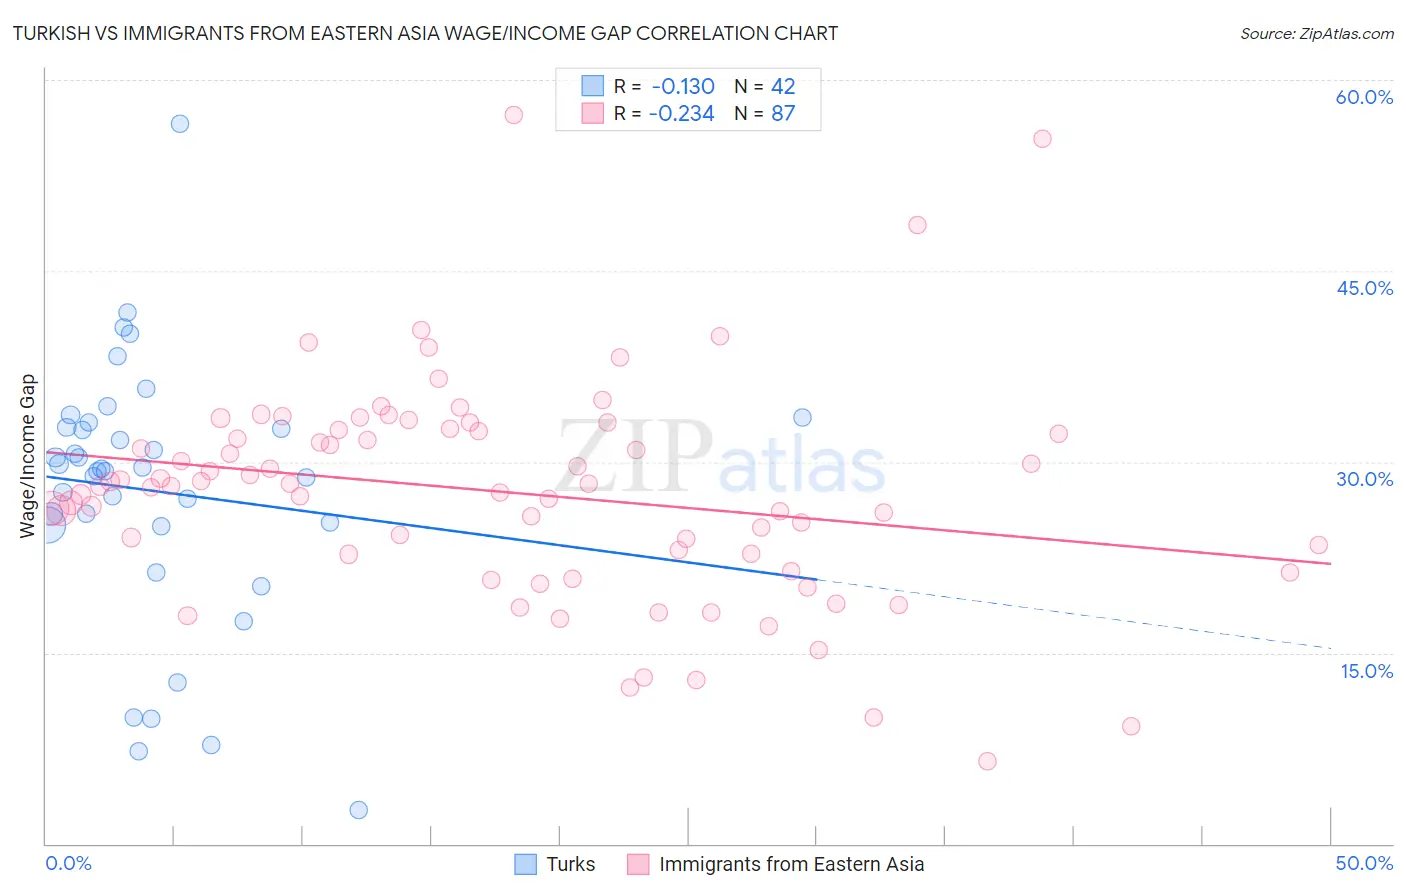
Turkish vs Immigrants from Eastern Asia Wage/Income Gap Correlation Chart
The statistical analysis conducted on geographies consisting of 271,781,198 people shows a poor negative correlation between the proportion of Turks and wage/income gap percentage in the United States with a correlation coefficient (R) of -0.130 and weighted average of 27.7%. Similarly, the statistical analysis conducted on geographies consisting of 499,229,662 people shows a weak negative correlation between the proportion of Immigrants from Eastern Asia and wage/income gap percentage in the United States with a correlation coefficient (R) of -0.234 and weighted average of 27.1%, a difference of 2.3%.
Wage/Income Gap Correlation Summary
| Measurement | Turkish | Immigrants from Eastern Asia |
| Minimum | 2.6% | 6.5% |
| Maximum | 56.6% | 57.3% |
| Range | 54.0% | 50.8% |
| Mean | 27.7% | 27.6% |
| Median | 29.3% | 28.1% |
| Interquartile 25% (IQ1) | 25.1% | 22.7% |
| Interquartile 75% (IQ3) | 32.7% | 32.5% |
| Interquartile Range (IQR) | 7.6% | 9.8% |
| Standard Deviation (Sample) | 10.3% | 8.7% |
| Standard Deviation (Population) | 10.2% | 8.7% |
Similar Demographics by Wage/Income Gap
Demographics Similar to Turks by Wage/Income Gap
In terms of wage/income gap, the demographic groups most similar to Turks are Immigrants from Switzerland (27.7%, a difference of 0.020%), Serbian (27.7%, a difference of 0.020%), Hmong (27.7%, a difference of 0.020%), New Zealander (27.7%, a difference of 0.080%), and Potawatomi (27.7%, a difference of 0.090%).
| Demographics | Rating | Rank | Wage/Income Gap |
| Tongans | 1.7 /100 | #260 | Tragic 27.5% |
| Immigrants | Germany | 1.5 /100 | #261 | Tragic 27.5% |
| Immigrants | Lebanon | 1.5 /100 | #262 | Tragic 27.5% |
| Syrians | 1.4 /100 | #263 | Tragic 27.6% |
| Immigrants | Switzerland | 1.0 /100 | #264 | Tragic 27.7% |
| Serbians | 1.0 /100 | #265 | Tragic 27.7% |
| Hmong | 1.0 /100 | #266 | Tragic 27.7% |
| Turks | 1.0 /100 | #267 | Tragic 27.7% |
| New Zealanders | 1.0 /100 | #268 | Tragic 27.7% |
| Potawatomi | 0.9 /100 | #269 | Tragic 27.7% |
| Immigrants | Western Europe | 0.9 /100 | #270 | Tragic 27.8% |
| Ute | 0.8 /100 | #271 | Tragic 27.8% |
| Immigrants | Korea | 0.8 /100 | #272 | Tragic 27.8% |
| Bulgarians | 0.7 /100 | #273 | Tragic 27.8% |
| Americans | 0.7 /100 | #274 | Tragic 27.8% |
Demographics Similar to Immigrants from Eastern Asia by Wage/Income Gap
In terms of wage/income gap, the demographic groups most similar to Immigrants from Eastern Asia are Osage (27.1%, a difference of 0.0%), Estonian (27.1%, a difference of 0.030%), Immigrants from Romania (27.0%, a difference of 0.15%), Immigrants from Hungary (27.0%, a difference of 0.16%), and Immigrants from Pakistan (27.0%, a difference of 0.18%).
| Demographics | Rating | Rank | Wage/Income Gap |
| Ottawa | 5.3 /100 | #230 | Tragic 27.0% |
| Bhutanese | 5.3 /100 | #231 | Tragic 27.0% |
| Argentineans | 5.2 /100 | #232 | Tragic 27.0% |
| Immigrants | Brazil | 5.0 /100 | #233 | Tragic 27.0% |
| Immigrants | Pakistan | 4.9 /100 | #234 | Tragic 27.0% |
| Immigrants | Hungary | 4.8 /100 | #235 | Tragic 27.0% |
| Immigrants | Romania | 4.8 /100 | #236 | Tragic 27.0% |
| Immigrants | Eastern Asia | 4.4 /100 | #237 | Tragic 27.1% |
| Osage | 4.4 /100 | #238 | Tragic 27.1% |
| Estonians | 4.3 /100 | #239 | Tragic 27.1% |
| Immigrants | Europe | 3.8 /100 | #240 | Tragic 27.1% |
| Creek | 3.8 /100 | #241 | Tragic 27.1% |
| Immigrants | Sri Lanka | 3.7 /100 | #242 | Tragic 27.1% |
| Spanish | 3.6 /100 | #243 | Tragic 27.1% |
| Chickasaw | 3.5 /100 | #244 | Tragic 27.2% |