Iroquois vs Cheyenne Wage/Income Gap
COMPARE
Iroquois
Cheyenne
Wage/Income Gap
Wage/Income Gap Comparison
Iroquois
Cheyenne
25.1%
WAGE/INCOME GAP
83.9/ 100
METRIC RATING
148th/ 347
METRIC RANK
23.3%
WAGE/INCOME GAP
99.7/ 100
METRIC RATING
86th/ 347
METRIC RANK
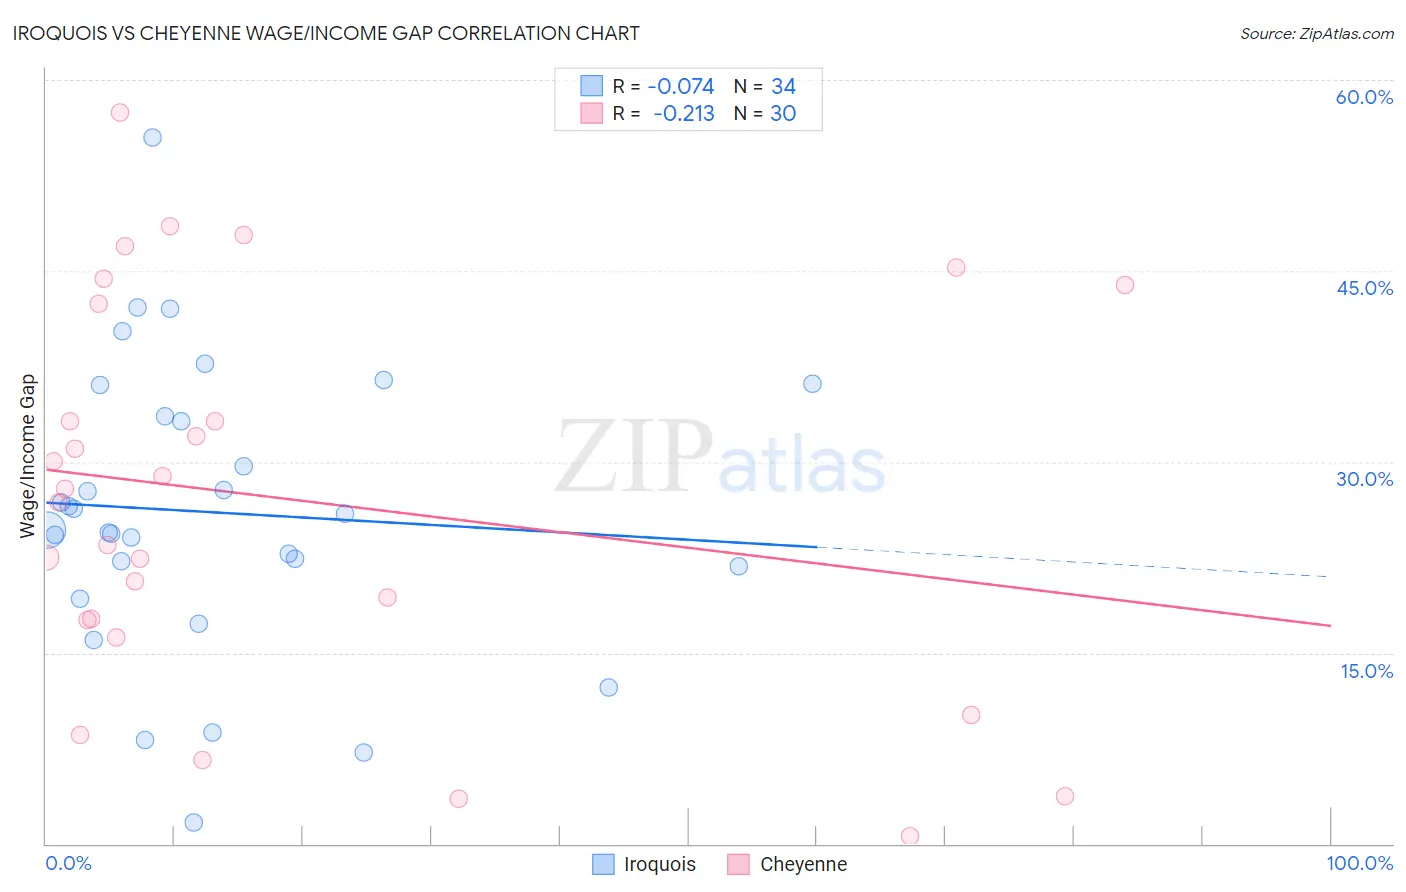
Iroquois vs Cheyenne Wage/Income Gap Correlation Chart
The statistical analysis conducted on geographies consisting of 207,171,754 people shows a slight negative correlation between the proportion of Iroquois and wage/income gap percentage in the United States with a correlation coefficient (R) of -0.074 and weighted average of 25.1%. Similarly, the statistical analysis conducted on geographies consisting of 80,669,985 people shows a weak negative correlation between the proportion of Cheyenne and wage/income gap percentage in the United States with a correlation coefficient (R) of -0.213 and weighted average of 23.3%, a difference of 7.5%.
Wage/Income Gap Correlation Summary
| Measurement | Iroquois | Cheyenne |
| Minimum | 1.6% | 0.62% |
| Maximum | 55.5% | 57.5% |
| Range | 53.9% | 56.8% |
| Mean | 26.0% | 27.1% |
| Median | 25.3% | 27.3% |
| Interquartile 25% (IQ1) | 21.8% | 17.6% |
| Interquartile 75% (IQ3) | 33.6% | 42.4% |
| Interquartile Range (IQR) | 11.8% | 24.8% |
| Standard Deviation (Sample) | 11.3% | 15.3% |
| Standard Deviation (Population) | 11.1% | 15.0% |
Similar Demographics by Wage/Income Gap
Demographics Similar to Iroquois by Wage/Income Gap
In terms of wage/income gap, the demographic groups most similar to Iroquois are Malaysian (25.0%, a difference of 0.14%), Immigrants from Peru (25.1%, a difference of 0.15%), Comanche (25.0%, a difference of 0.16%), South American (25.0%, a difference of 0.16%), and Immigrants (25.1%, a difference of 0.19%).
| Demographics | Rating | Rank | Wage/Income Gap |
| Hawaiians | 89.3 /100 | #141 | Excellent 24.9% |
| Afghans | 88.1 /100 | #142 | Excellent 24.9% |
| Immigrants | Uganda | 88.0 /100 | #143 | Excellent 24.9% |
| Chippewa | 86.9 /100 | #144 | Excellent 25.0% |
| Comanche | 85.2 /100 | #145 | Excellent 25.0% |
| South Americans | 85.2 /100 | #146 | Excellent 25.0% |
| Malaysians | 84.9 /100 | #147 | Excellent 25.0% |
| Iroquois | 83.9 /100 | #148 | Excellent 25.1% |
| Immigrants | Peru | 82.6 /100 | #149 | Excellent 25.1% |
| Immigrants | Immigrants | 82.3 /100 | #150 | Excellent 25.1% |
| Taiwanese | 81.6 /100 | #151 | Excellent 25.1% |
| Uruguayans | 81.3 /100 | #152 | Excellent 25.2% |
| Blackfeet | 78.1 /100 | #153 | Good 25.2% |
| Immigrants | Northern Africa | 78.1 /100 | #154 | Good 25.2% |
| Immigrants | Vietnam | 77.7 /100 | #155 | Good 25.2% |
Demographics Similar to Cheyenne by Wage/Income Gap
In terms of wage/income gap, the demographic groups most similar to Cheyenne are Yuman (23.3%, a difference of 0.050%), Immigrants from Cambodia (23.3%, a difference of 0.20%), Cuban (23.3%, a difference of 0.26%), Immigrants from Panama (23.4%, a difference of 0.37%), and Marshallese (23.4%, a difference of 0.46%).
| Demographics | Rating | Rank | Wage/Income Gap |
| Immigrants | Nicaragua | 99.9 /100 | #79 | Exceptional 23.0% |
| Salvadorans | 99.9 /100 | #80 | Exceptional 23.0% |
| Bermudans | 99.8 /100 | #81 | Exceptional 23.1% |
| Central Americans | 99.8 /100 | #82 | Exceptional 23.1% |
| Immigrants | Africa | 99.8 /100 | #83 | Exceptional 23.2% |
| Cubans | 99.7 /100 | #84 | Exceptional 23.3% |
| Immigrants | Cambodia | 99.7 /100 | #85 | Exceptional 23.3% |
| Cheyenne | 99.7 /100 | #86 | Exceptional 23.3% |
| Yuman | 99.7 /100 | #87 | Exceptional 23.3% |
| Immigrants | Panama | 99.6 /100 | #88 | Exceptional 23.4% |
| Marshallese | 99.6 /100 | #89 | Exceptional 23.4% |
| Nicaraguans | 99.6 /100 | #90 | Exceptional 23.4% |
| Arapaho | 99.6 /100 | #91 | Exceptional 23.5% |
| Immigrants | Honduras | 99.5 /100 | #92 | Exceptional 23.5% |
| Immigrants | Cabo Verde | 99.5 /100 | #93 | Exceptional 23.6% |