Iroquois vs German Russian Wage/Income Gap
COMPARE
Iroquois
German Russian
Wage/Income Gap
Wage/Income Gap Comparison
Iroquois
German Russians
25.1%
WAGE/INCOME GAP
83.9/ 100
METRIC RATING
148th/ 347
METRIC RANK
24.6%
WAGE/INCOME GAP
93.7/ 100
METRIC RATING
127th/ 347
METRIC RANK
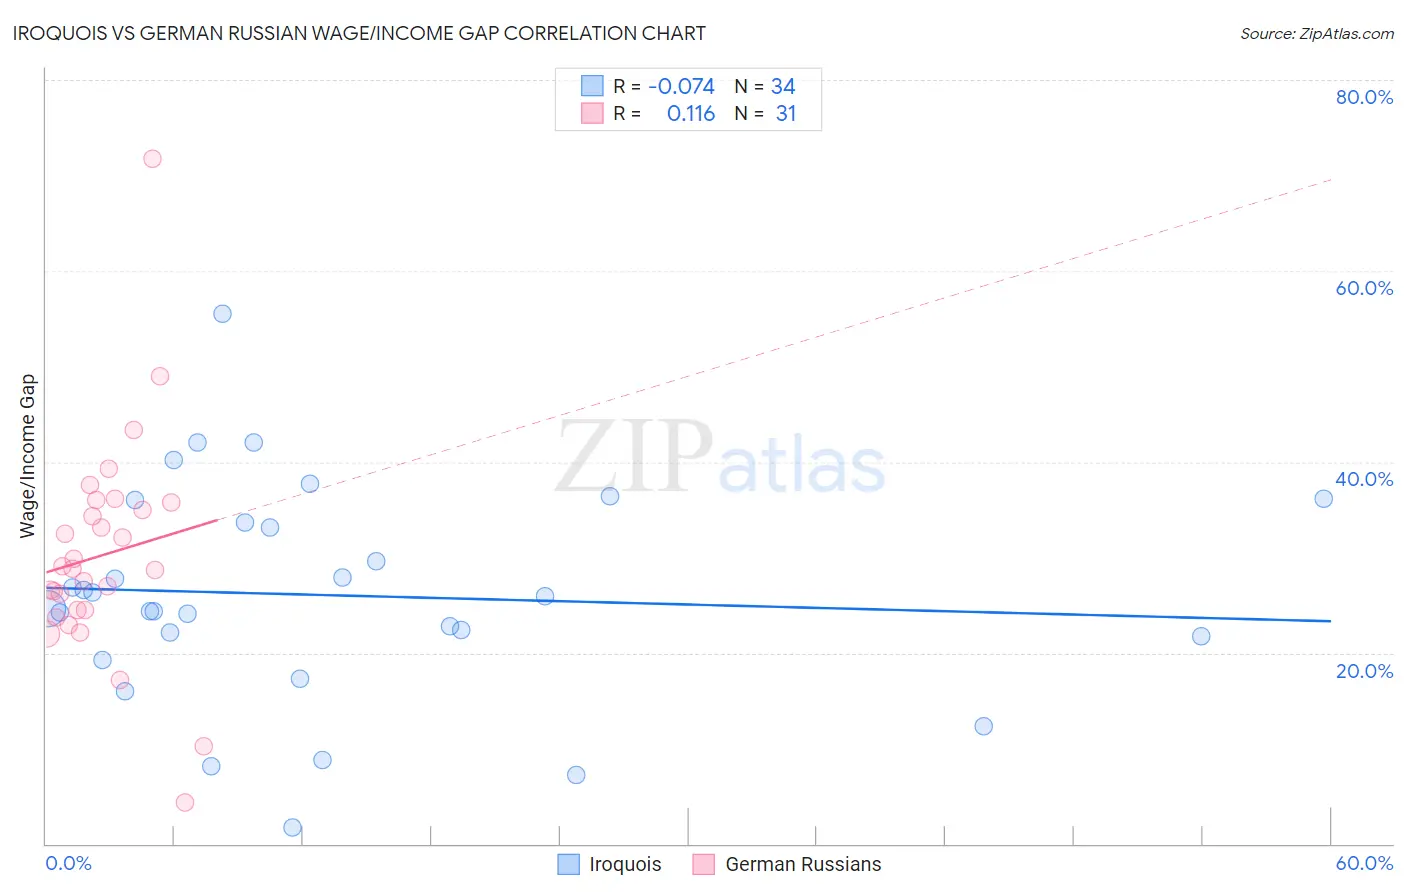
Iroquois vs German Russian Wage/Income Gap Correlation Chart
The statistical analysis conducted on geographies consisting of 207,171,754 people shows a slight negative correlation between the proportion of Iroquois and wage/income gap percentage in the United States with a correlation coefficient (R) of -0.074 and weighted average of 25.1%. Similarly, the statistical analysis conducted on geographies consisting of 96,446,629 people shows a poor positive correlation between the proportion of German Russians and wage/income gap percentage in the United States with a correlation coefficient (R) of 0.116 and weighted average of 24.6%, a difference of 1.8%.
Wage/Income Gap Correlation Summary
| Measurement | Iroquois | German Russian |
| Minimum | 1.6% | 4.3% |
| Maximum | 55.5% | 71.8% |
| Range | 53.9% | 67.5% |
| Mean | 26.0% | 30.2% |
| Median | 25.3% | 28.8% |
| Interquartile 25% (IQ1) | 21.8% | 24.4% |
| Interquartile 75% (IQ3) | 33.6% | 35.8% |
| Interquartile Range (IQR) | 11.8% | 11.3% |
| Standard Deviation (Sample) | 11.3% | 11.8% |
| Standard Deviation (Population) | 11.1% | 11.6% |
Similar Demographics by Wage/Income Gap
Demographics Similar to Iroquois by Wage/Income Gap
In terms of wage/income gap, the demographic groups most similar to Iroquois are Malaysian (25.0%, a difference of 0.14%), Immigrants from Peru (25.1%, a difference of 0.15%), Comanche (25.0%, a difference of 0.16%), South American (25.0%, a difference of 0.16%), and Immigrants (25.1%, a difference of 0.19%).
| Demographics | Rating | Rank | Wage/Income Gap |
| Hawaiians | 89.3 /100 | #141 | Excellent 24.9% |
| Afghans | 88.1 /100 | #142 | Excellent 24.9% |
| Immigrants | Uganda | 88.0 /100 | #143 | Excellent 24.9% |
| Chippewa | 86.9 /100 | #144 | Excellent 25.0% |
| Comanche | 85.2 /100 | #145 | Excellent 25.0% |
| South Americans | 85.2 /100 | #146 | Excellent 25.0% |
| Malaysians | 84.9 /100 | #147 | Excellent 25.0% |
| Iroquois | 83.9 /100 | #148 | Excellent 25.1% |
| Immigrants | Peru | 82.6 /100 | #149 | Excellent 25.1% |
| Immigrants | Immigrants | 82.3 /100 | #150 | Excellent 25.1% |
| Taiwanese | 81.6 /100 | #151 | Excellent 25.1% |
| Uruguayans | 81.3 /100 | #152 | Excellent 25.2% |
| Blackfeet | 78.1 /100 | #153 | Good 25.2% |
| Immigrants | Northern Africa | 78.1 /100 | #154 | Good 25.2% |
| Immigrants | Vietnam | 77.7 /100 | #155 | Good 25.2% |
Demographics Similar to German Russians by Wage/Income Gap
In terms of wage/income gap, the demographic groups most similar to German Russians are Immigrants from Uruguay (24.6%, a difference of 0.010%), Spanish American (24.6%, a difference of 0.020%), Immigrants from South America (24.6%, a difference of 0.050%), Immigrants from Central America (24.6%, a difference of 0.070%), and Yup'ik (24.7%, a difference of 0.12%).
| Demographics | Rating | Rank | Wage/Income Gap |
| Cree | 95.6 /100 | #120 | Exceptional 24.5% |
| Immigrants | Thailand | 94.9 /100 | #121 | Exceptional 24.5% |
| Apache | 94.8 /100 | #122 | Exceptional 24.5% |
| Natives/Alaskans | 94.6 /100 | #123 | Exceptional 24.6% |
| Immigrants | South America | 93.9 /100 | #124 | Exceptional 24.6% |
| Spanish Americans | 93.8 /100 | #125 | Exceptional 24.6% |
| Immigrants | Uruguay | 93.8 /100 | #126 | Exceptional 24.6% |
| German Russians | 93.7 /100 | #127 | Exceptional 24.6% |
| Immigrants | Central America | 93.5 /100 | #128 | Exceptional 24.6% |
| Yup'ik | 93.3 /100 | #129 | Exceptional 24.7% |
| Alsatians | 93.2 /100 | #130 | Exceptional 24.7% |
| Immigrants | Philippines | 93.0 /100 | #131 | Exceptional 24.7% |
| Immigrants | Costa Rica | 92.4 /100 | #132 | Exceptional 24.7% |
| Colombians | 92.4 /100 | #133 | Exceptional 24.7% |
| Mexican American Indians | 92.2 /100 | #134 | Exceptional 24.7% |