Iroquois vs South American Wage/Income Gap
COMPARE
Iroquois
South American
Wage/Income Gap
Wage/Income Gap Comparison
Iroquois
South Americans
25.1%
WAGE/INCOME GAP
83.9/ 100
METRIC RATING
148th/ 347
METRIC RANK
25.0%
WAGE/INCOME GAP
85.2/ 100
METRIC RATING
146th/ 347
METRIC RANK
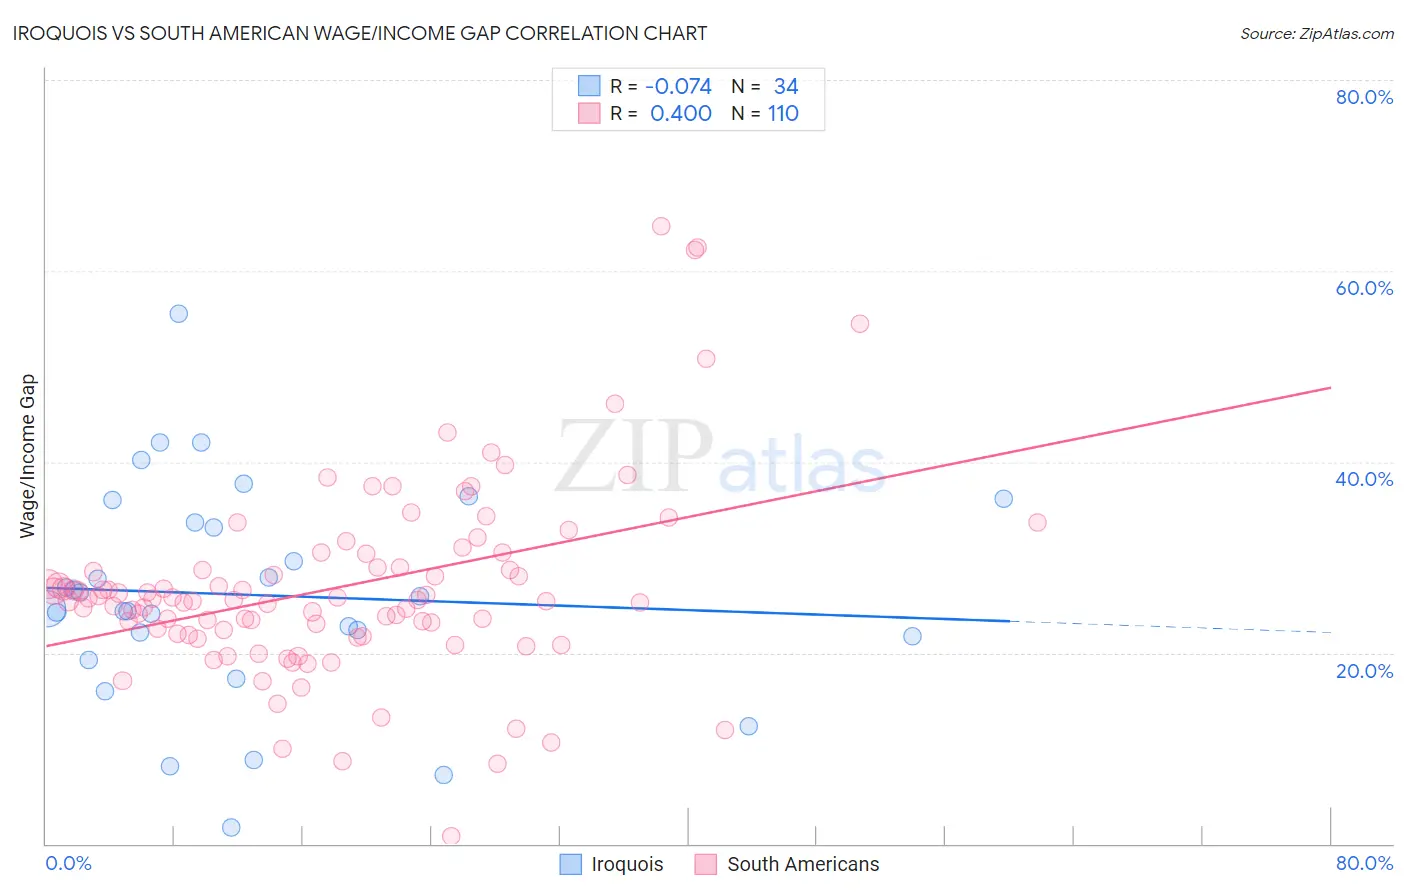
Iroquois vs South American Wage/Income Gap Correlation Chart
The statistical analysis conducted on geographies consisting of 207,171,754 people shows a slight negative correlation between the proportion of Iroquois and wage/income gap percentage in the United States with a correlation coefficient (R) of -0.074 and weighted average of 25.1%. Similarly, the statistical analysis conducted on geographies consisting of 493,539,614 people shows a mild positive correlation between the proportion of South Americans and wage/income gap percentage in the United States with a correlation coefficient (R) of 0.400 and weighted average of 25.0%, a difference of 0.16%.
Wage/Income Gap Correlation Summary
| Measurement | Iroquois | South American |
| Minimum | 1.6% | 0.78% |
| Maximum | 55.5% | 64.7% |
| Range | 53.9% | 63.9% |
| Mean | 26.0% | 26.9% |
| Median | 25.3% | 25.5% |
| Interquartile 25% (IQ1) | 21.8% | 22.0% |
| Interquartile 75% (IQ3) | 33.6% | 29.0% |
| Interquartile Range (IQR) | 11.8% | 7.0% |
| Standard Deviation (Sample) | 11.3% | 10.2% |
| Standard Deviation (Population) | 11.1% | 10.1% |
Demographics Similar to Iroquois and South Americans by Wage/Income Gap
In terms of wage/income gap, the demographic groups most similar to Iroquois are Malaysian (25.0%, a difference of 0.14%), Immigrants from Peru (25.1%, a difference of 0.15%), Comanche (25.0%, a difference of 0.16%), Immigrants (25.1%, a difference of 0.19%), and Taiwanese (25.1%, a difference of 0.27%). Similarly, the demographic groups most similar to South Americans are Comanche (25.0%, a difference of 0.0%), Malaysian (25.0%, a difference of 0.030%), Chippewa (25.0%, a difference of 0.24%), Immigrants from Peru (25.1%, a difference of 0.31%), and Immigrants (25.1%, a difference of 0.35%).
| Demographics | Rating | Rank | Wage/Income Gap |
| Immigrants | South Eastern Asia | 90.9 /100 | #137 | Exceptional 24.8% |
| Immigrants | Bosnia and Herzegovina | 90.1 /100 | #138 | Exceptional 24.8% |
| Hispanics or Latinos | 89.5 /100 | #139 | Excellent 24.9% |
| Immigrants | Nepal | 89.3 /100 | #140 | Excellent 24.9% |
| Hawaiians | 89.3 /100 | #141 | Excellent 24.9% |
| Afghans | 88.1 /100 | #142 | Excellent 24.9% |
| Immigrants | Uganda | 88.0 /100 | #143 | Excellent 24.9% |
| Chippewa | 86.9 /100 | #144 | Excellent 25.0% |
| Comanche | 85.2 /100 | #145 | Excellent 25.0% |
| South Americans | 85.2 /100 | #146 | Excellent 25.0% |
| Malaysians | 84.9 /100 | #147 | Excellent 25.0% |
| Iroquois | 83.9 /100 | #148 | Excellent 25.1% |
| Immigrants | Peru | 82.6 /100 | #149 | Excellent 25.1% |
| Immigrants | Immigrants | 82.3 /100 | #150 | Excellent 25.1% |
| Taiwanese | 81.6 /100 | #151 | Excellent 25.1% |
| Uruguayans | 81.3 /100 | #152 | Excellent 25.2% |
| Blackfeet | 78.1 /100 | #153 | Good 25.2% |
| Immigrants | Northern Africa | 78.1 /100 | #154 | Good 25.2% |
| Immigrants | Vietnam | 77.7 /100 | #155 | Good 25.2% |
| Immigrants | Mexico | 76.4 /100 | #156 | Good 25.3% |
| Costa Ricans | 75.8 /100 | #157 | Good 25.3% |