Costa Rican GED/Equivalency

COMPARE

Costa Rican
Race
Ancestry
AfghanAfricanAlaska NativeAlaskan AthabascanAlbanianAleutAlsatianAmericanApacheArabArapahoArgentineanArmenianAssyrian/Chaldean/SyriacAustralianAustrianBahamianBangladeshiBarbadianBasqueBelgianBelizeanBermudanBhutaneseBlackfeetBolivianBrazilianBritishBritish West IndianBulgarianBurmeseCajunCambodianCanadianCape VerdeanCarpatho RusynCelticCentral AmericanCentral American IndianCherokeeCheyenneChickasawChileanChineseChippewaChoctawColombianColvilleComancheCosta RicanCreeCreekCroatianCrowCubanCypriotCzechCzechoslovakianDanishDelawareDominicanDutchDutch West IndianEastern EuropeanEcuadorianEgyptianEnglishEstonianEthiopianEuropeanFijianFilipinoFinnishFrenchFrench American IndianFrench CanadianGermanGerman RussianGhanaianGreekGuamanian/ChamorroGuatemalanGuyaneseHaitianHmongHonduranHopiHoumaHungarianIcelanderIndian (Asian)IndonesianInupiatIranianIraqiIrishIroquoisIsraeliItalianJamaicanJapaneseJordanianKenyanKiowaKoreanLaotianLatvianLebaneseLiberianLithuanianLumbeeLuxembourgerMacedonianMalaysianMalteseMarshalleseMenomineeMexicanMexican American IndianMongolianMoroccanNative HawaiianNavajoNepaleseNew ZealanderNicaraguanNigerianNorthern EuropeanNorwegianOkinawanOsageOttawaPaiutePakistaniPalestinianPanamanianParaguayanPennsylvania GermanPeruvianPimaPolishPortuguesePotawatomiPuebloPuerto RicanPuget Sound SalishRomanianRussianSalvadoranSamoanScandinavianScotch-IrishScottishSeminoleSenegaleseSerbianShoshoneSierra LeoneanSiouxSlavicSlovakSloveneSomaliSouth AfricanSouth AmericanSouth American IndianSoviet UnionSpaniardSpanishSpanish AmericanSpanish American IndianSri LankanSubsaharan AfricanSudaneseSwedishSwissSyrianTaiwaneseThaiTlingit-HaidaTohono O'OdhamTonganTrinidadian and TobagonianTsimshianTurkishU.S. Virgin IslanderUgandanUkrainianUruguayanUteVenezuelanVietnameseWelshWest IndianYakamaYaquiYugoslavianYumanYup'ikZimbabwean
Immigration
NonimmigrantsImmigrantsAfghanistanAfricaAlbaniaArgentinaArmeniaAsiaAustraliaAustriaBahamasBangladeshBarbadosBelarusBelgiumBelizeBoliviaBosnia and HerzegovinaBrazilBulgariaBurma/MyanmarCabo VerdeCambodiaCameroonCanadaCaribbeanCentral AmericaChileChinaColombiaCongoCosta RicaCroatiaCubaCzechoslovakiaDenmarkDominicaDominican RepublicEastern AfricaEastern AsiaEastern EuropeEcuadorEgyptEl SalvadorEnglandEritreaEthiopiaEuropeFijiFranceGermanyGhanaGreeceGrenadaGuatemalaGuyanaHaitiHondurasHong KongHungaryIndiaIndonesiaIranIraqIrelandIsraelItalyJamaicaJapanJordanKazakhstanKenyaKoreaKuwaitLaosLatin AmericaLatviaLebanonLiberiaLithuaniaMalaysiaMexicoMicronesiaMiddle AfricaMoldovaMoroccoNepalNetherlandsNicaraguaNigeriaNorth AmericaNorth MacedoniaNorthern AfricaNorthern EuropeNorwayOceaniaPakistanPanamaPeruPhilippinesPolandPortugalRomaniaRussiaSaudi ArabiaScotlandSenegalSerbiaSierra LeoneSingaporeSomaliaSouth AfricaSouth AmericaSouth Central AsiaSouth Eastern AsiaSouthern EuropeSpainSri LankaSt. Vincent and the GrenadinesSudanSwedenSwitzerlandSyriaTaiwanThailandTrinidad and TobagoTurkeyUgandaUkraineUruguayUzbekistanVenezuelaVietnamWest IndiesWestern AfricaWestern AsiaWestern EuropeYemenZaireZimbabweAzores
Select to Compare
Race
Ancestry
AfghanAfricanAlaska NativeAlaskan AthabascanAlbanianAleutAlsatianAmericanApacheArabArapahoArgentineanArmenianAssyrian/Chaldean/SyriacAustralianAustrianBahamianBangladeshiBarbadianBasqueBelgianBelizeanBermudanBhutaneseBlackfeetBolivianBrazilianBritishBritish West IndianBulgarianBurmeseCajunCambodianCanadianCape VerdeanCarpatho RusynCelticCentral AmericanCentral American IndianCherokeeCheyenneChickasawChileanChineseChippewaChoctawColombianColvilleComancheCreeCreekCroatianCrowCubanCypriotCzechCzechoslovakianDanishDelawareDominicanDutchDutch West IndianEastern EuropeanEcuadorianEgyptianEnglishEstonianEthiopianEuropeanFijianFilipinoFinnishFrenchFrench American IndianFrench CanadianGermanGerman RussianGhanaianGreekGuamanian/ChamorroGuatemalanGuyaneseHaitianHmongHonduranHopiHoumaHungarianIcelanderIndian (Asian)IndonesianInupiatIranianIraqiIrishIroquoisIsraeliItalianJamaicanJapaneseJordanianKenyanKiowaKoreanLaotianLatvianLebaneseLiberianLithuanianLumbeeLuxembourgerMacedonianMalaysianMalteseMarshalleseMenomineeMexicanMexican American IndianMongolianMoroccanNative HawaiianNavajoNepaleseNew ZealanderNicaraguanNigerianNorthern EuropeanNorwegianOkinawanOsageOttawaPaiutePakistaniPalestinianPanamanianParaguayanPennsylvania GermanPeruvianPimaPolishPortuguesePotawatomiPuebloPuerto RicanPuget Sound SalishRomanianRussianSalvadoranSamoanScandinavianScotch-IrishScottishSeminoleSenegaleseSerbianShoshoneSierra LeoneanSiouxSlavicSlovakSloveneSomaliSouth AfricanSouth AmericanSouth American IndianSoviet UnionSpaniardSpanishSpanish AmericanSpanish American IndianSri LankanSubsaharan AfricanSudaneseSwedishSwissSyrianTaiwaneseThaiTlingit-HaidaTohono O'OdhamTonganTrinidadian and TobagonianTsimshianTurkishU.S. Virgin IslanderUgandanUkrainianUruguayanUteVenezuelanVietnameseWelshWest IndianYakamaYaquiYugoslavianYumanYup'ikZimbabwean
Immigration
NonimmigrantsImmigrantsAfghanistanAfricaAlbaniaArgentinaArmeniaAsiaAustraliaAustriaBahamasBangladeshBarbadosBelarusBelgiumBelizeBoliviaBosnia and HerzegovinaBrazilBulgariaBurma/MyanmarCabo VerdeCambodiaCameroonCanadaCaribbeanCentral AmericaChileChinaColombiaCongoCosta RicaCroatiaCubaCzechoslovakiaDenmarkDominicaDominican RepublicEastern AfricaEastern AsiaEastern EuropeEcuadorEgyptEl SalvadorEnglandEritreaEthiopiaEuropeFijiFranceGermanyGhanaGreeceGrenadaGuatemalaGuyanaHaitiHondurasHong KongHungaryIndiaIndonesiaIranIraqIrelandIsraelItalyJamaicaJapanJordanKazakhstanKenyaKoreaKuwaitLaosLatin AmericaLatviaLebanonLiberiaLithuaniaMalaysiaMexicoMicronesiaMiddle AfricaMoldovaMoroccoNepalNetherlandsNicaraguaNigeriaNorth AmericaNorth MacedoniaNorthern AfricaNorthern EuropeNorwayOceaniaPakistanPanamaPeruPhilippinesPolandPortugalRomaniaRussiaSaudi ArabiaScotlandSenegalSerbiaSierra LeoneSingaporeSomaliaSouth AfricaSouth AmericaSouth Central AsiaSouth Eastern AsiaSouthern EuropeSpainSri LankaSt. Vincent and the GrenadinesSudanSwedenSwitzerlandSyriaTaiwanThailandTrinidad and TobagoTurkeyUgandaUkraineUruguayUzbekistanVenezuelaVietnamWest IndiesWestern AfricaWestern AsiaWestern EuropeYemenZaireZimbabweAzores
GED/Equivalency
Income
Poverty
Unemployment
Labor Participation
Family Structure
Vehicle Availability
Education Level
Disability

Costa Rican GED/Equivalency
Fair

85.2%
GED/EQUIVALENCY
20.4/ 100
METRIC RATING
197th/ 347
METRIC RANK

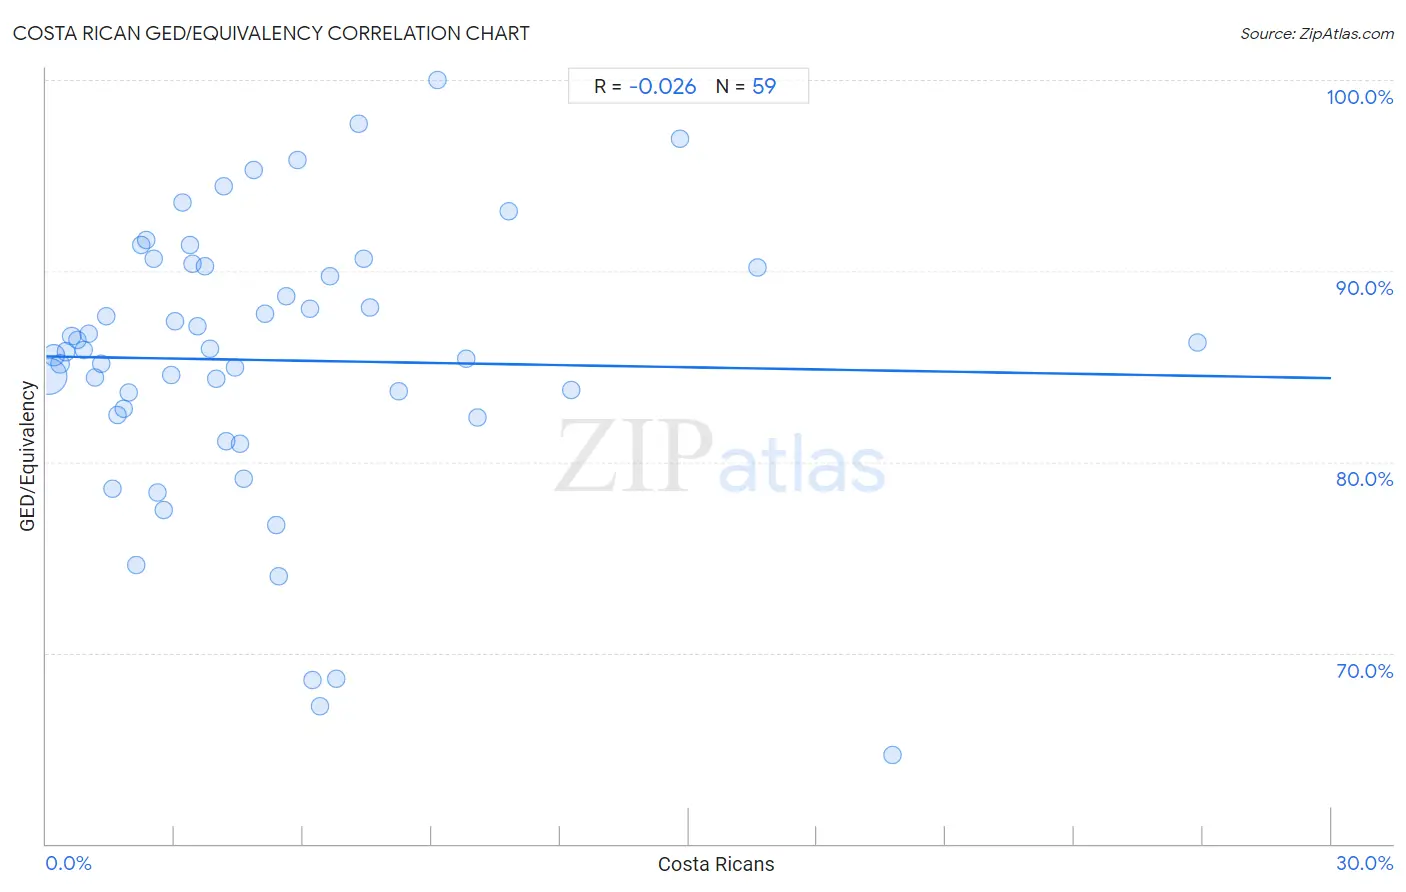
Costa Rican GED/Equivalency Correlation Chart

The statistical analysis conducted on geographies consisting of 253,601,897 people shows no correlation between the proportion of Costa Ricans and percentage of population with at least ged/equivalency education in the United States with a correlation coefficient (R) of -0.026 and weighted average of 85.2%. On average, for every 1% (one percent) increase in Costa Ricans within a typical geography, there is a decrease of 0.038% in percentage of population with at least ged/equivalency education.
Costa Rican GED/Equivalency
It is essential to understand that the correlation between the percentage of Costa Ricans and percentage of population with at least ged/equivalency education does not imply a direct cause-and-effect relationship. It remains uncertain whether the presence of Costa Ricans influences an upward or downward trend in the level of percentage of population with at least ged/equivalency education within an area, or if Costa Ricans simply ended up residing in those areas with higher or lower levels of percentage of population with at least ged/equivalency education due to other factors.

Demographics Similar to Costa Ricans by GED/Equivalency

In terms of ged/equivalency, the demographic groups most similar to Costa Ricans are Puget Sound Salish (85.2%, a difference of 0.010%), Chippewa (85.2%, a difference of 0.010%), Tongan (85.2%, a difference of 0.010%), Delaware (85.2%, a difference of 0.060%), and South American Indian (85.2%, a difference of 0.070%).
DemographicsRating | RankGED/Equivalency
Alaskan Athabascans
27.5
/100
|
#190
Fair
85.3%
South American Indians
22.8
/100
|
#191
Fair
85.2%
Nonimmigrants
22.7
/100
|
#192
Fair
85.2%
Delaware
22.2
/100
|
#193
Fair
85.2%
Puget Sound Salish
20.8
/100
|
#194
Fair
85.2%
Chippewa
20.8
/100
|
#195
Fair
85.2%
Tongans
20.7
/100
|
#196
Fair
85.2%
Costa Ricans
20.4
/100
|
#197
Fair
85.2%
Immigrants from Africa
17.5
/100
|
#198
Poor
85.1%
Somalis
16.4
/100
|
#199
Poor
85.0%
Uruguayans
16.0
/100
|
#200
Poor
85.0%
Portuguese
15.9
/100
|
#201
Poor
85.0%
Cree
15.9
/100
|
#202
Poor
85.0%
Panamanians
15.3
/100
|
#203
Poor
85.0%
Hawaiians
15.2
/100
|
#204
Poor
85.0%

Costa Rican GED/Equivalency Correlation Summary

MeasurementCosta Rican DataGED/Equivalency Data
Minimum0.054%64.7%
Maximum26.9%100.0%
Range26.8%35.3%
Mean5.2%85.3%
Median4.0%85.9%
Interquartile 25% (IQ1)1.9%82.5%
Interquartile 75% (IQ3)6.6%90.3%
Interquartile Range (IQR)4.7%7.8%
Standard Deviation (Sample)5.0%7.3%
Standard Deviation (Population)4.9%7.3%

Correlation Details

Costa Rican PercentileSample SizeGED/Equivalency
[
0.0%
-
0.5%
]
0.054%
193,645,78984.5%
[
0.0%
-
0.5%
]
0.19%
35,491,25785.6%
[
0.0%
-
0.5%
]
0.33%
11,355,62985.2%
[
0.0%
-
0.5%
]
0.46%
4,996,05085.8%
[
0.5%
-
1.0%
]
0.59%
2,812,41886.6%
[
0.5%
-
1.0%
]
0.73%
1,719,02386.4%
[
0.5%
-
1.0%
]
0.87%
890,52885.9%
[
1.0%
-
1.5%
]
1.00%
648,58886.7%
[
1.0%
-
1.5%
]
1.13%
353,27284.4%
[
1.0%
-
1.5%
]
1.28%
324,31285.2%
[
1.0%
-
1.5%
]
1.41%
218,56587.6%
[
1.5%
-
2.0%
]
1.55%
140,15778.6%
[
1.5%
-
2.0%
]
1.68%
147,76082.5%
[
1.5%
-
2.0%
]
1.81%
73,54782.8%
[
1.5%
-
2.0%
]
1.93%
202,35583.6%
[
2.0%
-
2.5%
]
2.10%
90,54874.6%
[
2.0%
-
2.5%
]
2.22%
38,32991.3%
[
2.0%
-
2.5%
]
2.33%
35,92491.6%
[
2.5%
-
3.0%
]
2.51%
11,16190.6%
[
2.5%
-
3.0%
]
2.60%
45,76578.4%
[
2.5%
-
3.0%
]
2.74%
30,43877.5%
[
2.5%
-
3.0%
]
2.91%
70,95184.5%
[
3.0%
-
3.5%
]
3.01%
40,32187.3%
[
3.0%
-
3.5%
]
3.19%
8,26693.6%
[
3.0%
-
3.5%
]
3.35%
24,17891.3%
[
3.0%
-
3.5%
]
3.42%
12,64990.4%
[
3.5%
-
4.0%
]
3.53%
1,27387.1%
[
3.5%
-
4.0%
]
3.71%
2,29290.3%
[
3.5%
-
4.0%
]
3.83%
21,50785.9%
[
3.5%
-
4.0%
]
3.96%
30,86684.4%
[
4.0%
-
4.5%
]
4.14%
8,95494.4%
[
4.0%
-
4.5%
]
4.20%
78681.1%
[
4.0%
-
4.5%
]
4.41%
9,78185.0%
[
4.5%
-
5.0%
]
4.52%
9,10581.0%
[
4.5%
-
5.0%
]
4.60%
58779.1%
[
4.5%
-
5.0%
]
4.84%
3,30995.3%
[
5.0%
-
5.5%
]
5.10%
16,60287.8%
[
5.0%
-
5.5%
]
5.36%
61676.7%
[
5.0%
-
5.5%
]
5.42%
27774.0%
[
5.5%
-
6.0%
]
5.60%
1,51988.7%
[
5.5%
-
6.0%
]
5.85%
8,28795.8%
[
6.0%
-
6.5%
]
6.15%
1,59488.0%
[
6.0%
-
6.5%
]
6.22%
5,37368.6%
[
6.0%
-
6.5%
]
6.39%
5,22667.2%
[
6.5%
-
7.0%
]
6.61%
9,67689.7%
[
6.5%
-
7.0%
]
6.78%
91568.7%
[
7.0%
-
7.5%
]
7.29%
39897.7%
[
7.0%
-
7.5%
]
7.41%
29790.7%
[
7.5%
-
8.0%
]
7.55%
15988.1%
[
8.0%
-
8.5%
]
8.24%
14,77883.7%
[
9.0%
-
9.5%
]
9.14%
372100.0%
[
9.5%
-
10.0%
]
9.80%
11,90685.4%
[
10.0%
-
10.5%
]
10.07%
1,13282.4%
[
10.5%
-
11.0%
]
10.81%
65793.1%
[
12.0%
-
12.5%
]
12.24%
9883.8%
[
14.5%
-
15.0%
]
14.80%
4,77196.9%
[
16.5%
-
17.0%
]
16.60%
25390.2%
[
19.5%
-
20.0%
]
19.76%
16764.7%
[
26.5%
-
27.0%
]
26.88%
58486.3%