Costa Rican Self-Care Disability

COMPARE

Costa Rican
Race
Ancestry
AfghanAfricanAlaska NativeAlaskan AthabascanAlbanianAleutAlsatianAmericanApacheArabArapahoArgentineanArmenianAssyrian/Chaldean/SyriacAustralianAustrianBahamianBangladeshiBarbadianBasqueBelgianBelizeanBermudanBhutaneseBlackfeetBolivianBrazilianBritishBritish West IndianBulgarianBurmeseCajunCambodianCanadianCape VerdeanCarpatho RusynCelticCentral AmericanCentral American IndianCherokeeCheyenneChickasawChileanChineseChippewaChoctawColombianColvilleComancheCosta RicanCreeCreekCroatianCrowCubanCypriotCzechCzechoslovakianDanishDelawareDominicanDutchDutch West IndianEastern EuropeanEcuadorianEgyptianEnglishEstonianEthiopianEuropeanFijianFilipinoFinnishFrenchFrench American IndianFrench CanadianGermanGerman RussianGhanaianGreekGuamanian/ChamorroGuatemalanGuyaneseHaitianHmongHonduranHopiHoumaHungarianIcelanderIndian (Asian)IndonesianInupiatIranianIraqiIrishIroquoisIsraeliItalianJamaicanJapaneseJordanianKenyanKiowaKoreanLaotianLatvianLebaneseLiberianLithuanianLumbeeLuxembourgerMacedonianMalaysianMalteseMarshalleseMenomineeMexicanMexican American IndianMongolianMoroccanNative HawaiianNavajoNepaleseNew ZealanderNicaraguanNigerianNorthern EuropeanNorwegianOkinawanOsageOttawaPaiutePakistaniPalestinianPanamanianParaguayanPennsylvania GermanPeruvianPimaPolishPortuguesePotawatomiPuebloPuerto RicanPuget Sound SalishRomanianRussianSalvadoranSamoanScandinavianScotch-IrishScottishSeminoleSenegaleseSerbianShoshoneSierra LeoneanSiouxSlavicSlovakSloveneSomaliSouth AfricanSouth AmericanSouth American IndianSoviet UnionSpaniardSpanishSpanish AmericanSpanish American IndianSri LankanSubsaharan AfricanSudaneseSwedishSwissSyrianTaiwaneseThaiTlingit-HaidaTohono O'OdhamTonganTrinidadian and TobagonianTsimshianTurkishU.S. Virgin IslanderUgandanUkrainianUruguayanUteVenezuelanVietnameseWelshWest IndianYakamaYaquiYugoslavianYumanYup'ikZimbabwean
Immigration
NonimmigrantsImmigrantsAfghanistanAfricaAlbaniaArgentinaArmeniaAsiaAustraliaAustriaBahamasBangladeshBarbadosBelarusBelgiumBelizeBoliviaBosnia and HerzegovinaBrazilBulgariaBurma/MyanmarCabo VerdeCambodiaCameroonCanadaCaribbeanCentral AmericaChileChinaColombiaCongoCosta RicaCroatiaCubaCzechoslovakiaDenmarkDominicaDominican RepublicEastern AfricaEastern AsiaEastern EuropeEcuadorEgyptEl SalvadorEnglandEritreaEthiopiaEuropeFijiFranceGermanyGhanaGreeceGrenadaGuatemalaGuyanaHaitiHondurasHong KongHungaryIndiaIndonesiaIranIraqIrelandIsraelItalyJamaicaJapanJordanKazakhstanKenyaKoreaKuwaitLaosLatin AmericaLatviaLebanonLiberiaLithuaniaMalaysiaMexicoMicronesiaMiddle AfricaMoldovaMoroccoNepalNetherlandsNicaraguaNigeriaNorth AmericaNorth MacedoniaNorthern AfricaNorthern EuropeNorwayOceaniaPakistanPanamaPeruPhilippinesPolandPortugalRomaniaRussiaSaudi ArabiaScotlandSenegalSerbiaSierra LeoneSingaporeSomaliaSouth AfricaSouth AmericaSouth Central AsiaSouth Eastern AsiaSouthern EuropeSpainSri LankaSt. Vincent and the GrenadinesSudanSwedenSwitzerlandSyriaTaiwanThailandTrinidad and TobagoTurkeyUgandaUkraineUruguayUzbekistanVenezuelaVietnamWest IndiesWestern AfricaWestern AsiaWestern EuropeYemenZaireZimbabweAzores
Select to Compare
Race
Ancestry
AfghanAfricanAlaska NativeAlaskan AthabascanAlbanianAleutAlsatianAmericanApacheArabArapahoArgentineanArmenianAssyrian/Chaldean/SyriacAustralianAustrianBahamianBangladeshiBarbadianBasqueBelgianBelizeanBermudanBhutaneseBlackfeetBolivianBrazilianBritishBritish West IndianBulgarianBurmeseCajunCambodianCanadianCape VerdeanCarpatho RusynCelticCentral AmericanCentral American IndianCherokeeCheyenneChickasawChileanChineseChippewaChoctawColombianColvilleComancheCreeCreekCroatianCrowCubanCypriotCzechCzechoslovakianDanishDelawareDominicanDutchDutch West IndianEastern EuropeanEcuadorianEgyptianEnglishEstonianEthiopianEuropeanFijianFilipinoFinnishFrenchFrench American IndianFrench CanadianGermanGerman RussianGhanaianGreekGuamanian/ChamorroGuatemalanGuyaneseHaitianHmongHonduranHopiHoumaHungarianIcelanderIndian (Asian)IndonesianInupiatIranianIraqiIrishIroquoisIsraeliItalianJamaicanJapaneseJordanianKenyanKiowaKoreanLaotianLatvianLebaneseLiberianLithuanianLumbeeLuxembourgerMacedonianMalaysianMalteseMarshalleseMenomineeMexicanMexican American IndianMongolianMoroccanNative HawaiianNavajoNepaleseNew ZealanderNicaraguanNigerianNorthern EuropeanNorwegianOkinawanOsageOttawaPaiutePakistaniPalestinianPanamanianParaguayanPennsylvania GermanPeruvianPimaPolishPortuguesePotawatomiPuebloPuerto RicanPuget Sound SalishRomanianRussianSalvadoranSamoanScandinavianScotch-IrishScottishSeminoleSenegaleseSerbianShoshoneSierra LeoneanSiouxSlavicSlovakSloveneSomaliSouth AfricanSouth AmericanSouth American IndianSoviet UnionSpaniardSpanishSpanish AmericanSpanish American IndianSri LankanSubsaharan AfricanSudaneseSwedishSwissSyrianTaiwaneseThaiTlingit-HaidaTohono O'OdhamTonganTrinidadian and TobagonianTsimshianTurkishU.S. Virgin IslanderUgandanUkrainianUruguayanUteVenezuelanVietnameseWelshWest IndianYakamaYaquiYugoslavianYumanYup'ikZimbabwean
Immigration
NonimmigrantsImmigrantsAfghanistanAfricaAlbaniaArgentinaArmeniaAsiaAustraliaAustriaBahamasBangladeshBarbadosBelarusBelgiumBelizeBoliviaBosnia and HerzegovinaBrazilBulgariaBurma/MyanmarCabo VerdeCambodiaCameroonCanadaCaribbeanCentral AmericaChileChinaColombiaCongoCosta RicaCroatiaCubaCzechoslovakiaDenmarkDominicaDominican RepublicEastern AfricaEastern AsiaEastern EuropeEcuadorEgyptEl SalvadorEnglandEritreaEthiopiaEuropeFijiFranceGermanyGhanaGreeceGrenadaGuatemalaGuyanaHaitiHondurasHong KongHungaryIndiaIndonesiaIranIraqIrelandIsraelItalyJamaicaJapanJordanKazakhstanKenyaKoreaKuwaitLaosLatin AmericaLatviaLebanonLiberiaLithuaniaMalaysiaMexicoMicronesiaMiddle AfricaMoldovaMoroccoNepalNetherlandsNicaraguaNigeriaNorth AmericaNorth MacedoniaNorthern AfricaNorthern EuropeNorwayOceaniaPakistanPanamaPeruPhilippinesPolandPortugalRomaniaRussiaSaudi ArabiaScotlandSenegalSerbiaSierra LeoneSingaporeSomaliaSouth AfricaSouth AmericaSouth Central AsiaSouth Eastern AsiaSouthern EuropeSpainSri LankaSt. Vincent and the GrenadinesSudanSwedenSwitzerlandSyriaTaiwanThailandTrinidad and TobagoTurkeyUgandaUkraineUruguayUzbekistanVenezuelaVietnamWest IndiesWestern AfricaWestern AsiaWestern EuropeYemenZaireZimbabweAzores
Self-Care Disability
Income
Poverty
Unemployment
Labor Participation
Family Structure
Vehicle Availability
Education Level
Disability

Costa Rican Self-Care Disability
Excellent

2.4%
SELF-CARE DISABILITY
80.8/ 100
METRIC RATING
144th/ 347
METRIC RANK

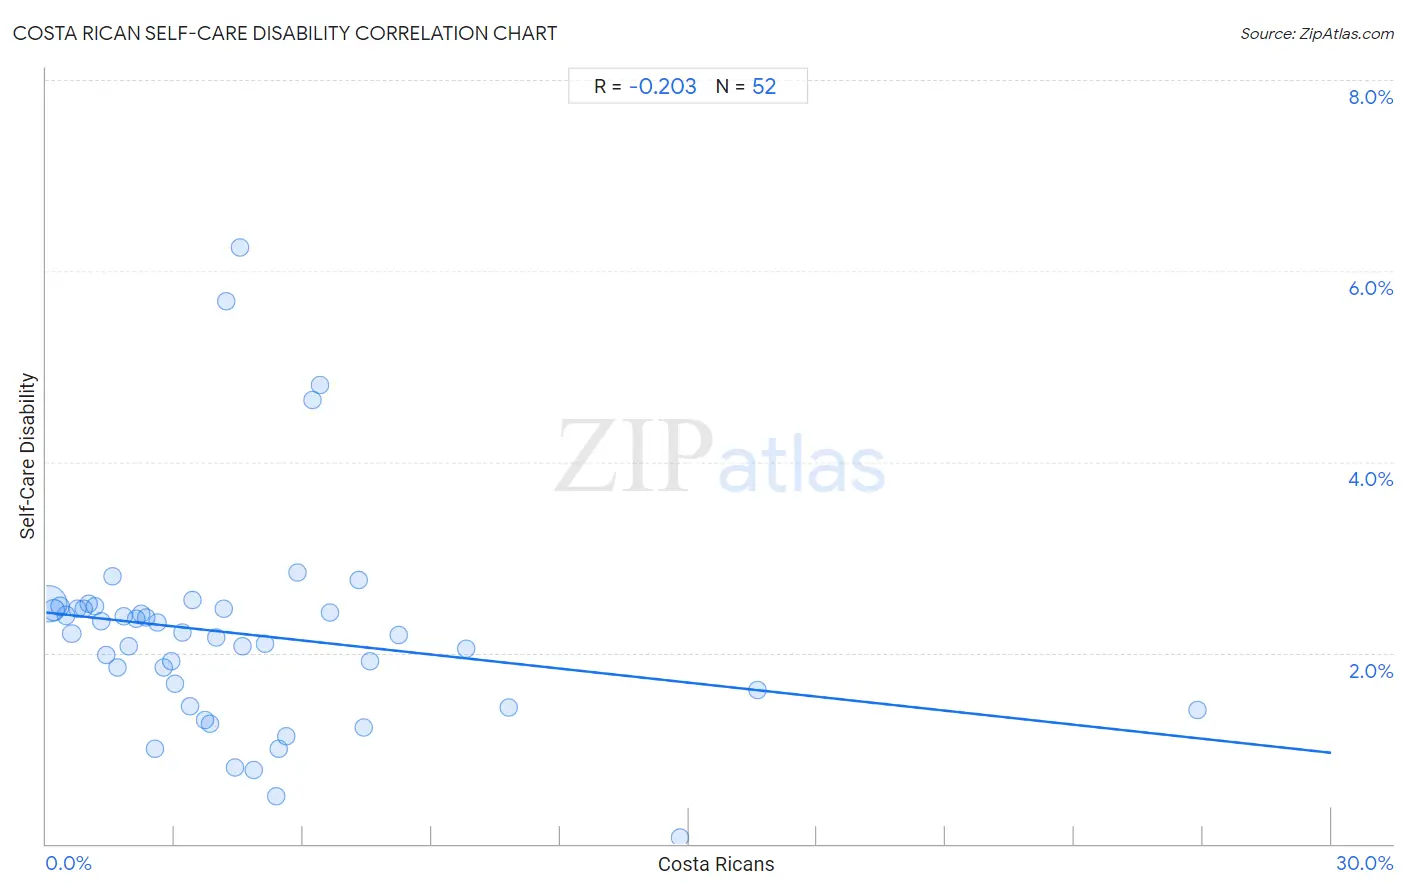
Costa Rican Self-Care Disability Correlation Chart

The statistical analysis conducted on geographies consisting of 253,379,189 people shows a weak negative correlation between the proportion of Costa Ricans and percentage of population with self-care disability in the United States with a correlation coefficient (R) of -0.203 and weighted average of 2.4%. On average, for every 1% (one percent) increase in Costa Ricans within a typical geography, there is a decrease of 0.049% in percentage of population with self-care disability.
Costa Rican Self-Care Disability
It is essential to understand that the correlation between the percentage of Costa Ricans and percentage of population with self-care disability does not imply a direct cause-and-effect relationship. It remains uncertain whether the presence of Costa Ricans influences an upward or downward trend in the level of percentage of population with self-care disability within an area, or if Costa Ricans simply ended up residing in those areas with higher or lower levels of percentage of population with self-care disability due to other factors.

Demographics Similar to Costa Ricans by Self-Care Disability

In terms of self-care disability, the demographic groups most similar to Costa Ricans are German (2.4%, a difference of 0.050%), Israeli (2.4%, a difference of 0.060%), Afghan (2.4%, a difference of 0.12%), Immigrants from Peru (2.4%, a difference of 0.20%), and Dutch (2.4%, a difference of 0.25%).
DemographicsRating | RankSelf-Care Disability
Austrians
87.0
/100
|
#137
Excellent
2.4%
Immigrants from Croatia
86.6
/100
|
#138
Excellent
2.4%
Sri Lankans
86.6
/100
|
#139
Excellent
2.4%
Immigrants from Uruguay
85.4
/100
|
#140
Excellent
2.4%
Alaska Natives
84.5
/100
|
#141
Excellent
2.4%
Immigrants from Peru
83.2
/100
|
#142
Excellent
2.4%
Afghans
82.3
/100
|
#143
Excellent
2.4%
Costa Ricans
80.8
/100
|
#144
Excellent
2.4%
Germans
80.1
/100
|
#145
Excellent
2.4%
Israelis
80.0
/100
|
#146
Good
2.4%
Dutch
77.5
/100
|
#147
Good
2.4%
Romanians
75.8
/100
|
#148
Good
2.4%
Arabs
75.7
/100
|
#149
Good
2.4%
Immigrants from Costa Rica
75.1
/100
|
#150
Good
2.4%
Basques
74.0
/100
|
#151
Good
2.4%

Costa Rican Self-Care Disability Correlation Summary

MeasurementCosta Rican DataSelf-Care Disability Data
Minimum0.054%0.069%
Maximum26.9%6.2%
Range26.8%6.2%
Mean4.6%2.2%
Median3.6%2.2%
Interquartile 25% (IQ1)1.7%1.5%
Interquartile 75% (IQ3)5.7%2.5%
Interquartile Range (IQR)4.0%0.94%
Standard Deviation (Sample)4.6%1.1%
Standard Deviation (Population)4.6%1.1%

Correlation Details

Costa Rican PercentileSample SizeSelf-Care Disability
[
0.0%
-
0.5%
]
0.054%
193,581,4532.5%
[
0.0%
-
0.5%
]
0.19%
35,419,9552.4%
[
0.0%
-
0.5%
]
0.33%
11,330,7212.5%
[
0.0%
-
0.5%
]
0.46%
4,983,1112.4%
[
0.5%
-
1.0%
]
0.59%
2,794,9722.2%
[
0.5%
-
1.0%
]
0.73%
1,716,7272.5%
[
0.5%
-
1.0%
]
0.87%
890,2042.5%
[
1.0%
-
1.5%
]
1.00%
645,7782.5%
[
1.0%
-
1.5%
]
1.13%
353,2722.5%
[
1.0%
-
1.5%
]
1.28%
323,2302.3%
[
1.0%
-
1.5%
]
1.41%
218,5652.0%
[
1.5%
-
2.0%
]
1.55%
140,1572.8%
[
1.5%
-
2.0%
]
1.68%
147,7601.9%
[
1.5%
-
2.0%
]
1.81%
71,6752.4%
[
1.5%
-
2.0%
]
1.93%
202,0402.1%
[
2.0%
-
2.5%
]
2.10%
80,9462.4%
[
2.0%
-
2.5%
]
2.22%
37,0452.4%
[
2.0%
-
2.5%
]
2.33%
33,2932.4%
[
2.5%
-
3.0%
]
2.54%
7,6441.00%
[
2.5%
-
3.0%
]
2.60%
45,7652.3%
[
2.5%
-
3.0%
]
2.74%
30,4381.8%
[
2.5%
-
3.0%
]
2.91%
70,5441.9%
[
3.0%
-
3.5%
]
3.01%
40,3211.7%
[
3.0%
-
3.5%
]
3.19%
8,2662.2%
[
3.0%
-
3.5%
]
3.35%
24,1781.4%
[
3.0%
-
3.5%
]
3.42%
12,6492.6%
[
3.5%
-
4.0%
]
3.71%
2,2921.3%
[
3.5%
-
4.0%
]
3.83%
21,5071.3%
[
3.5%
-
4.0%
]
3.96%
30,8662.2%
[
4.0%
-
4.5%
]
4.14%
8,9542.5%
[
4.0%
-
4.5%
]
4.20%
7865.7%
[
4.0%
-
4.5%
]
4.41%
9,7810.80%
[
4.5%
-
5.0%
]
4.52%
9,1056.2%
[
4.5%
-
5.0%
]
4.59%
5012.1%
[
4.5%
-
5.0%
]
4.84%
3,3090.77%
[
5.0%
-
5.5%
]
5.10%
16,6022.1%
[
5.0%
-
5.5%
]
5.36%
6160.50%
[
5.0%
-
5.5%
]
5.42%
2771.00%
[
5.5%
-
6.0%
]
5.60%
1,5191.1%
[
5.5%
-
6.0%
]
5.85%
8,2872.8%
[
6.0%
-
6.5%
]
6.22%
5,3734.7%
[
6.0%
-
6.5%
]
6.39%
5,2264.8%
[
6.5%
-
7.0%
]
6.61%
9,6762.4%
[
7.0%
-
7.5%
]
7.29%
3982.8%
[
7.0%
-
7.5%
]
7.41%
2971.2%
[
7.5%
-
8.0%
]
7.55%
1591.9%
[
8.0%
-
8.5%
]
8.24%
14,7782.2%
[
9.5%
-
10.0%
]
9.80%
11,9062.0%
[
10.5%
-
11.0%
]
10.81%
6571.4%
[
14.5%
-
15.0%
]
14.80%
4,7710.069%
[
16.5%
-
17.0%
]
16.60%
2531.6%
[
26.5%
-
27.0%
]
26.88%
5841.4%