Costa Rican 3 or more Vehicles in Household
COMPARE
Costa Rican
Select to Compare
3 or more Vehicles in Household
Costa Rican 3 or more Vehicles in Household
20.6%
3+ VEHICLES AVAILABLE
94.6/ 100
METRIC RATING
118th/ 347
METRIC RANK
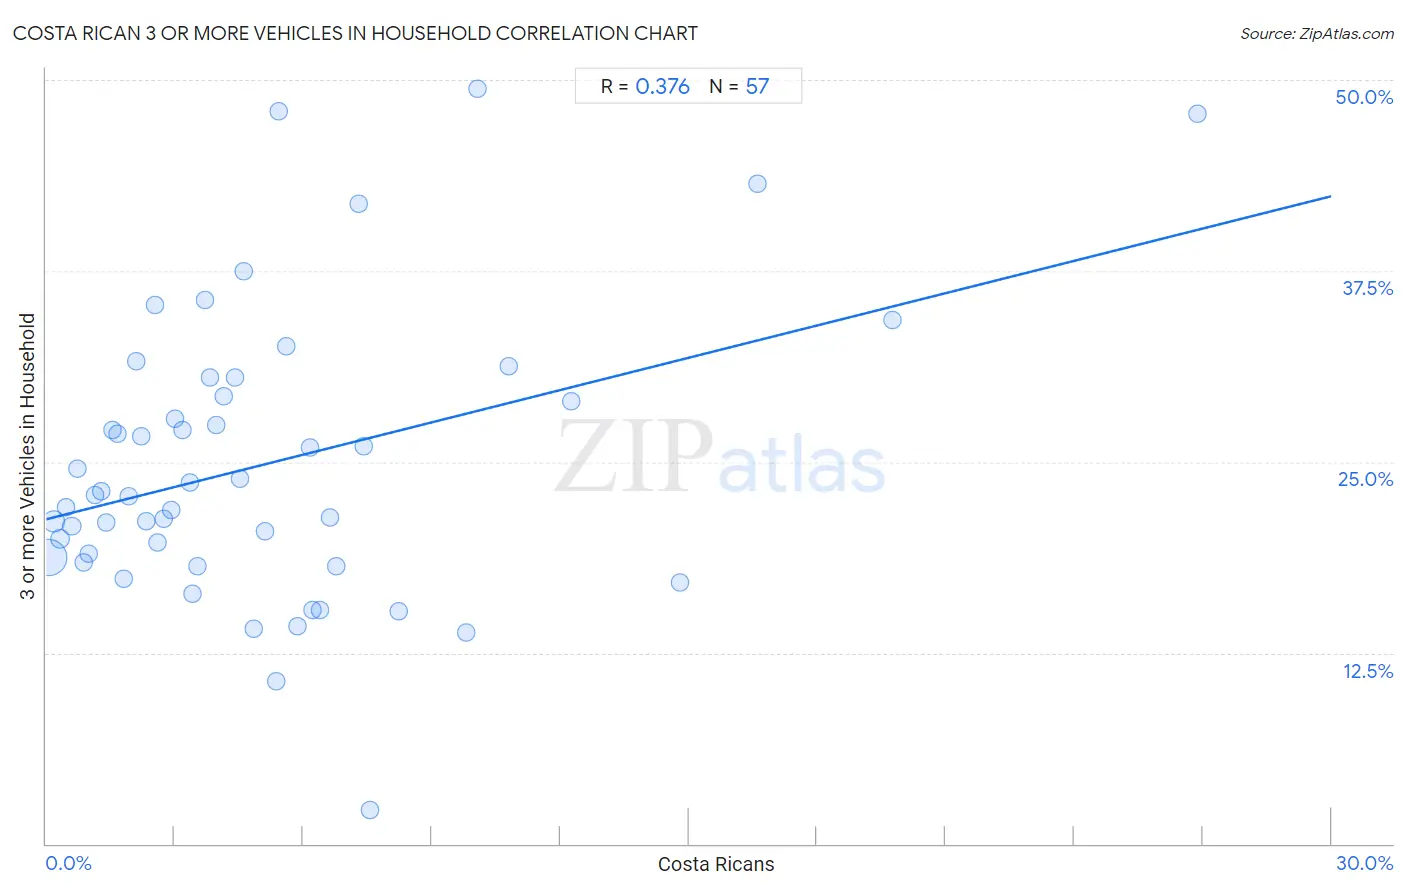
Costa Rican 3 or more Vehicles in Household Correlation Chart
The statistical analysis conducted on geographies consisting of 253,426,253 people shows a mild positive correlation between the proportion of Costa Ricans and percentage of households with 3 or more vehicles available in the United States with a correlation coefficient (R) of 0.376 and weighted average of 20.6%. On average, for every 1% (one percent) increase in Costa Ricans within a typical geography, there is an increase of 0.70% in percentage of households with 3 or more vehicles available.
It is essential to understand that the correlation between the percentage of Costa Ricans and percentage of households with 3 or more vehicles available does not imply a direct cause-and-effect relationship. It remains uncertain whether the presence of Costa Ricans influences an upward or downward trend in the level of percentage of households with 3 or more vehicles available within an area, or if Costa Ricans simply ended up residing in those areas with higher or lower levels of percentage of households with 3 or more vehicles available due to other factors.
Demographics Similar to Costa Ricans by 3 or more Vehicles in Household
In terms of 3 or more vehicles in household, the demographic groups most similar to Costa Ricans are Immigrants from Latin America (20.5%, a difference of 0.040%), Croatian (20.6%, a difference of 0.11%), Italian (20.6%, a difference of 0.13%), French Canadian (20.6%, a difference of 0.16%), and Maltese (20.5%, a difference of 0.23%).
| Demographics | Rating | Rank | 3 or more Vehicles in Household |
| Immigrants from Micronesia | 96.7 /100 | #111 | Exceptional 20.7% |
| Nicaraguans | 96.2 /100 | #112 | Exceptional 20.7% |
| Immigrants from England | 96.2 /100 | #113 | Exceptional 20.7% |
| Burmese | 95.8 /100 | #114 | Exceptional 20.6% |
| French Canadians | 95.0 /100 | #115 | Exceptional 20.6% |
| Italians | 94.9 /100 | #116 | Exceptional 20.6% |
| Croatians | 94.9 /100 | #117 | Exceptional 20.6% |
| Costa Ricans | 94.6 /100 | #118 | Exceptional 20.6% |
| Immigrants from Latin America | 94.5 /100 | #119 | Exceptional 20.5% |
| Maltese | 93.9 /100 | #120 | Exceptional 20.5% |
| Immigrants from Thailand | 93.8 /100 | #121 | Exceptional 20.5% |
| German Russians | 93.7 /100 | #122 | Exceptional 20.5% |
| Immigrants from Korea | 93.7 /100 | #123 | Exceptional 20.5% |
| Central Americans | 93.1 /100 | #124 | Exceptional 20.5% |
| Immigrants from Netherlands | 92.9 /100 | #125 | Exceptional 20.4% |
Costa Rican 3 or more Vehicles in Household Correlation Summary
| Measurement | Costa Rican Data | 3 or more Vehicles in Household Data |
| Minimum | 0.054% | 2.2% |
| Maximum | 26.9% | 49.4% |
| Range | 26.8% | 47.2% |
| Mean | 5.2% | 24.9% |
| Median | 3.8% | 22.9% |
| Interquartile 25% (IQ1) | 1.9% | 18.6% |
| Interquartile 75% (IQ3) | 6.5% | 29.9% |
| Interquartile Range (IQR) | 4.6% | 11.3% |
| Standard Deviation (Sample) | 5.0% | 9.4% |
| Standard Deviation (Population) | 5.0% | 9.3% |
Correlation Details
| Costa Rican Percentile | Sample Size | 3 or more Vehicles in Household |
[ 0.0% - 0.5% ] 0.054% | 193,569,476 | 18.7% |
[ 0.0% - 0.5% ] 0.19% | 35,427,455 | 21.1% |
[ 0.0% - 0.5% ] 0.33% | 11,344,140 | 20.0% |
[ 0.0% - 0.5% ] 0.46% | 4,989,410 | 22.0% |
[ 0.5% - 1.0% ] 0.59% | 2,808,025 | 20.8% |
[ 0.5% - 1.0% ] 0.73% | 1,719,023 | 24.6% |
[ 0.5% - 1.0% ] 0.87% | 888,930 | 18.5% |
[ 1.0% - 1.5% ] 1.00% | 645,778 | 19.0% |
[ 1.0% - 1.5% ] 1.13% | 352,420 | 22.9% |
[ 1.0% - 1.5% ] 1.28% | 323,230 | 23.1% |
[ 1.0% - 1.5% ] 1.41% | 218,565 | 21.0% |
[ 1.5% - 2.0% ] 1.55% | 139,219 | 27.1% |
[ 1.5% - 2.0% ] 1.68% | 147,760 | 26.8% |
[ 1.5% - 2.0% ] 1.81% | 73,547 | 17.3% |
[ 1.5% - 2.0% ] 1.93% | 202,355 | 22.8% |
[ 2.0% - 2.5% ] 2.10% | 90,548 | 31.6% |
[ 2.0% - 2.5% ] 2.22% | 38,329 | 26.6% |
[ 2.0% - 2.5% ] 2.33% | 34,750 | 21.1% |
[ 2.5% - 3.0% ] 2.54% | 7,766 | 35.3% |
[ 2.5% - 3.0% ] 2.60% | 45,765 | 19.7% |
[ 2.5% - 3.0% ] 2.74% | 30,438 | 21.2% |
[ 2.5% - 3.0% ] 2.91% | 70,951 | 21.9% |
[ 3.0% - 3.5% ] 3.01% | 40,321 | 27.9% |
[ 3.0% - 3.5% ] 3.19% | 8,266 | 27.1% |
[ 3.0% - 3.5% ] 3.35% | 24,178 | 23.7% |
[ 3.0% - 3.5% ] 3.42% | 12,649 | 16.4% |
[ 3.5% - 4.0% ] 3.53% | 1,273 | 18.2% |
[ 3.5% - 4.0% ] 3.71% | 2,292 | 35.6% |
[ 3.5% - 4.0% ] 3.83% | 21,507 | 30.5% |
[ 3.5% - 4.0% ] 3.96% | 30,866 | 27.4% |
[ 4.0% - 4.5% ] 4.14% | 8,954 | 29.3% |
[ 4.0% - 4.5% ] 4.41% | 9,781 | 30.5% |
[ 4.5% - 5.0% ] 4.52% | 9,105 | 23.9% |
[ 4.5% - 5.0% ] 4.60% | 587 | 37.5% |
[ 4.5% - 5.0% ] 4.84% | 3,309 | 14.1% |
[ 5.0% - 5.5% ] 5.10% | 16,602 | 20.5% |
[ 5.0% - 5.5% ] 5.36% | 616 | 10.7% |
[ 5.0% - 5.5% ] 5.42% | 277 | 47.9% |
[ 5.5% - 6.0% ] 5.60% | 1,519 | 32.6% |
[ 5.5% - 6.0% ] 5.85% | 8,287 | 14.2% |
[ 6.0% - 6.5% ] 6.15% | 1,594 | 26.0% |
[ 6.0% - 6.5% ] 6.22% | 5,373 | 15.3% |
[ 6.0% - 6.5% ] 6.39% | 5,226 | 15.3% |
[ 6.5% - 7.0% ] 6.61% | 9,676 | 21.4% |
[ 6.5% - 7.0% ] 6.78% | 915 | 18.1% |
[ 7.0% - 7.5% ] 7.29% | 398 | 41.9% |
[ 7.0% - 7.5% ] 7.41% | 297 | 26.0% |
[ 7.5% - 8.0% ] 7.55% | 159 | 2.2% |
[ 8.0% - 8.5% ] 8.24% | 14,778 | 15.2% |
[ 9.5% - 10.0% ] 9.80% | 11,906 | 13.8% |
[ 10.0% - 10.5% ] 10.07% | 1,132 | 49.4% |
[ 10.5% - 11.0% ] 10.81% | 657 | 31.2% |
[ 12.0% - 12.5% ] 12.24% | 98 | 28.9% |
[ 14.5% - 15.0% ] 14.80% | 4,771 | 17.1% |
[ 16.5% - 17.0% ] 16.60% | 253 | 43.2% |
[ 19.5% - 20.0% ] 19.76% | 167 | 34.3% |
[ 26.5% - 27.0% ] 26.88% | 584 | 47.8% |