Burmese vs Immigrants from Czechoslovakia Wage/Income Gap
COMPARE
Burmese
Immigrants from Czechoslovakia
Wage/Income Gap
Wage/Income Gap Comparison
Burmese
Immigrants from Czechoslovakia
28.0%
WAGE/INCOME GAP
0.5/ 100
METRIC RATING
281st/ 347
METRIC RANK
27.3%
WAGE/INCOME GAP
2.7/ 100
METRIC RATING
250th/ 347
METRIC RANK
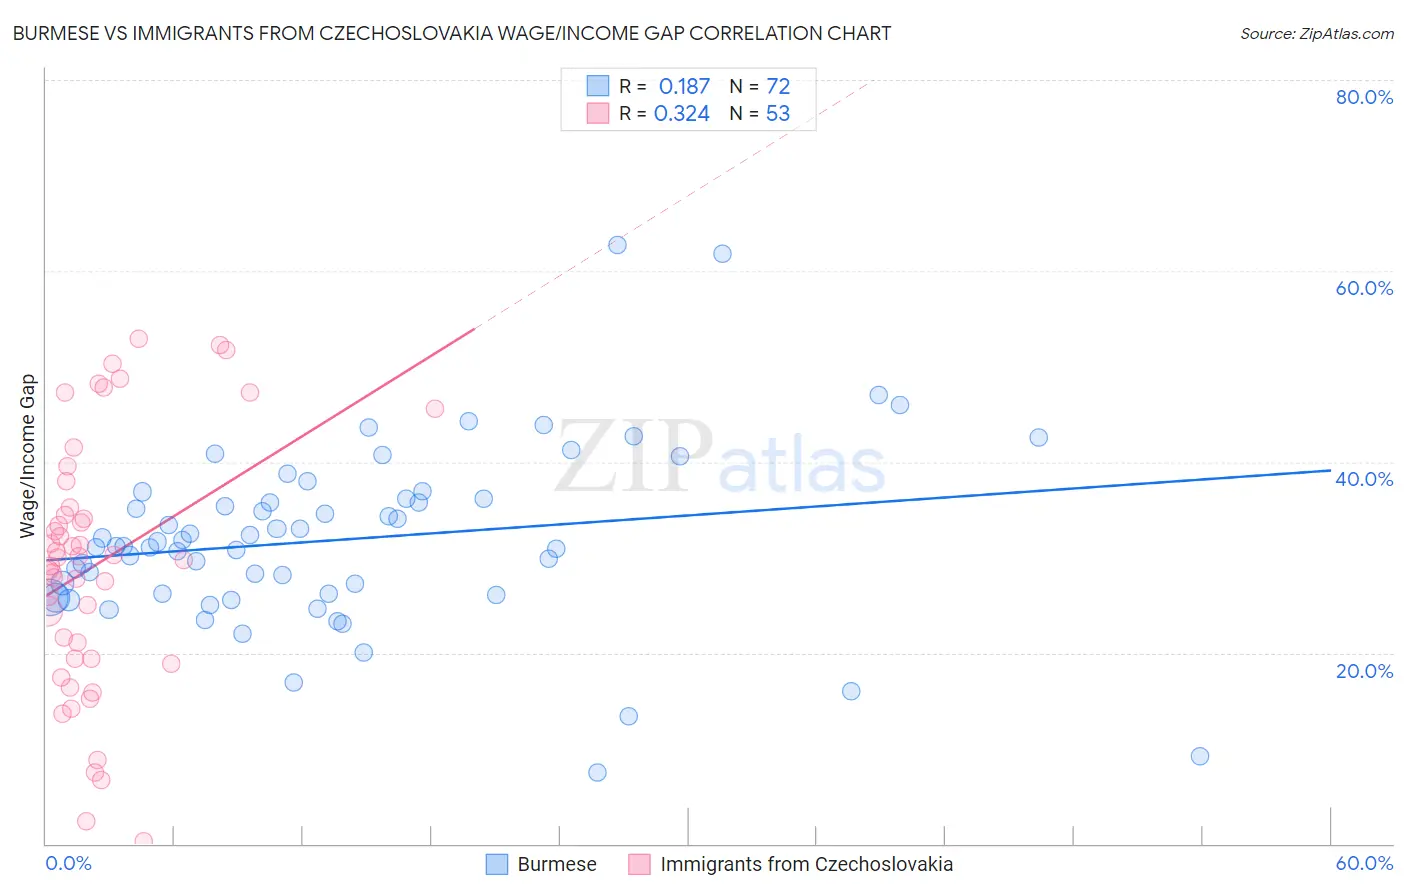
Burmese vs Immigrants from Czechoslovakia Wage/Income Gap Correlation Chart
The statistical analysis conducted on geographies consisting of 464,918,136 people shows a poor positive correlation between the proportion of Burmese and wage/income gap percentage in the United States with a correlation coefficient (R) of 0.187 and weighted average of 28.0%. Similarly, the statistical analysis conducted on geographies consisting of 195,414,700 people shows a mild positive correlation between the proportion of Immigrants from Czechoslovakia and wage/income gap percentage in the United States with a correlation coefficient (R) of 0.324 and weighted average of 27.3%, a difference of 2.7%.
Wage/Income Gap Correlation Summary
| Measurement | Burmese | Immigrants from Czechoslovakia |
| Minimum | 7.4% | 0.26% |
| Maximum | 62.7% | 52.9% |
| Range | 55.3% | 52.6% |
| Mean | 31.9% | 29.3% |
| Median | 31.2% | 30.0% |
| Interquartile 25% (IQ1) | 26.1% | 19.4% |
| Interquartile 75% (IQ3) | 36.1% | 36.6% |
| Interquartile Range (IQR) | 10.0% | 17.2% |
| Standard Deviation (Sample) | 9.5% | 13.3% |
| Standard Deviation (Population) | 9.5% | 13.1% |
Similar Demographics by Wage/Income Gap
Demographics Similar to Burmese by Wage/Income Gap
In terms of wage/income gap, the demographic groups most similar to Burmese are South African (28.0%, a difference of 0.030%), Russian (28.0%, a difference of 0.050%), Romanian (28.0%, a difference of 0.20%), French Canadian (28.1%, a difference of 0.21%), and Immigrants from Sweden (28.1%, a difference of 0.22%).
| Demographics | Rating | Rank | Wage/Income Gap |
| Americans | 0.7 /100 | #274 | Tragic 27.8% |
| Immigrants | Japan | 0.7 /100 | #275 | Tragic 27.9% |
| Lebanese | 0.7 /100 | #276 | Tragic 27.9% |
| Latvians | 0.7 /100 | #277 | Tragic 27.9% |
| Immigrants | England | 0.6 /100 | #278 | Tragic 27.9% |
| Romanians | 0.5 /100 | #279 | Tragic 28.0% |
| Russians | 0.5 /100 | #280 | Tragic 28.0% |
| Burmese | 0.5 /100 | #281 | Tragic 28.0% |
| South Africans | 0.5 /100 | #282 | Tragic 28.0% |
| French Canadians | 0.4 /100 | #283 | Tragic 28.1% |
| Immigrants | Sweden | 0.4 /100 | #284 | Tragic 28.1% |
| Italians | 0.4 /100 | #285 | Tragic 28.1% |
| Immigrants | Austria | 0.4 /100 | #286 | Tragic 28.1% |
| Okinawans | 0.4 /100 | #287 | Tragic 28.1% |
| Choctaw | 0.4 /100 | #288 | Tragic 28.1% |
Demographics Similar to Immigrants from Czechoslovakia by Wage/Income Gap
In terms of wage/income gap, the demographic groups most similar to Immigrants from Czechoslovakia are Cypriot (27.3%, a difference of 0.020%), Carpatho Rusyn (27.3%, a difference of 0.020%), Celtic (27.3%, a difference of 0.030%), Immigrants from Norway (27.3%, a difference of 0.10%), and Ukrainian (27.3%, a difference of 0.16%).
| Demographics | Rating | Rank | Wage/Income Gap |
| Spanish | 3.6 /100 | #243 | Tragic 27.1% |
| Chickasaw | 3.5 /100 | #244 | Tragic 27.2% |
| Immigrants | Azores | 3.5 /100 | #245 | Tragic 27.2% |
| Immigrants | Nonimmigrants | 3.3 /100 | #246 | Tragic 27.2% |
| Celtics | 2.8 /100 | #247 | Tragic 27.3% |
| Cypriots | 2.8 /100 | #248 | Tragic 27.3% |
| Carpatho Rusyns | 2.7 /100 | #249 | Tragic 27.3% |
| Immigrants | Czechoslovakia | 2.7 /100 | #250 | Tragic 27.3% |
| Immigrants | Norway | 2.5 /100 | #251 | Tragic 27.3% |
| Ukrainians | 2.4 /100 | #252 | Tragic 27.3% |
| Portuguese | 2.2 /100 | #253 | Tragic 27.4% |
| Israelis | 2.1 /100 | #254 | Tragic 27.4% |
| Immigrants | France | 2.1 /100 | #255 | Tragic 27.4% |
| Cherokee | 1.9 /100 | #256 | Tragic 27.4% |
| Luxembourgers | 1.9 /100 | #257 | Tragic 27.4% |