Burmese vs Korean Wage/Income Gap
COMPARE
Burmese
Korean
Wage/Income Gap
Wage/Income Gap Comparison
Burmese
Koreans
28.0%
WAGE/INCOME GAP
0.5/ 100
METRIC RATING
281st/ 347
METRIC RANK
25.4%
WAGE/INCOME GAP
68.6/ 100
METRIC RATING
164th/ 347
METRIC RANK
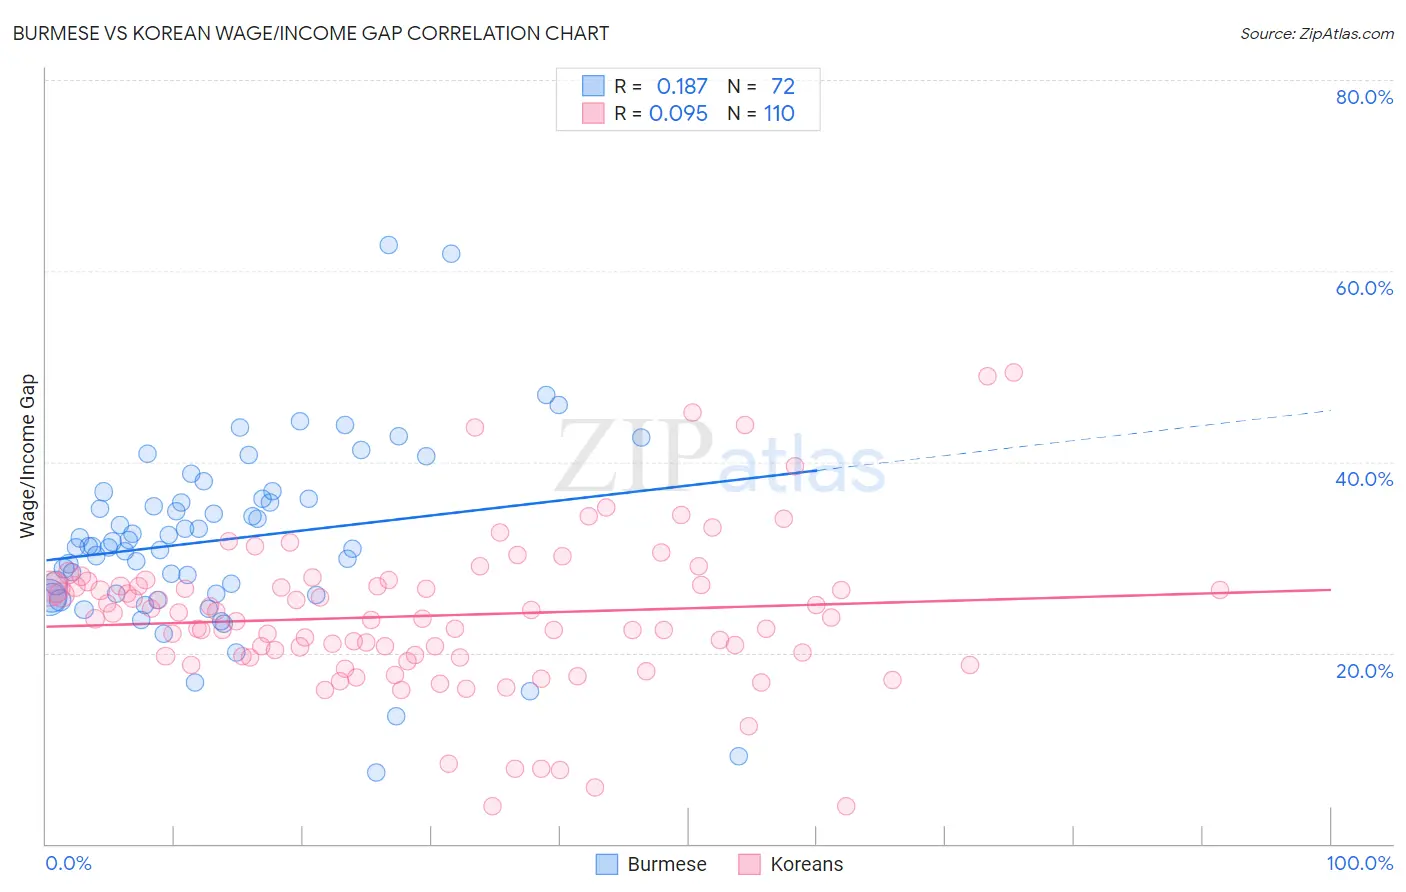
Burmese vs Korean Wage/Income Gap Correlation Chart
The statistical analysis conducted on geographies consisting of 464,918,136 people shows a poor positive correlation between the proportion of Burmese and wage/income gap percentage in the United States with a correlation coefficient (R) of 0.187 and weighted average of 28.0%. Similarly, the statistical analysis conducted on geographies consisting of 510,260,978 people shows a slight positive correlation between the proportion of Koreans and wage/income gap percentage in the United States with a correlation coefficient (R) of 0.095 and weighted average of 25.4%, a difference of 10.1%.
Wage/Income Gap Correlation Summary
| Measurement | Burmese | Korean |
| Minimum | 7.4% | 3.9% |
| Maximum | 62.7% | 49.3% |
| Range | 55.3% | 45.4% |
| Mean | 31.9% | 23.9% |
| Median | 31.2% | 23.6% |
| Interquartile 25% (IQ1) | 26.1% | 19.6% |
| Interquartile 75% (IQ3) | 36.1% | 27.0% |
| Interquartile Range (IQR) | 10.0% | 7.4% |
| Standard Deviation (Sample) | 9.5% | 8.1% |
| Standard Deviation (Population) | 9.5% | 8.1% |
Similar Demographics by Wage/Income Gap
Demographics Similar to Burmese by Wage/Income Gap
In terms of wage/income gap, the demographic groups most similar to Burmese are South African (28.0%, a difference of 0.030%), Russian (28.0%, a difference of 0.050%), Romanian (28.0%, a difference of 0.20%), French Canadian (28.1%, a difference of 0.21%), and Immigrants from Sweden (28.1%, a difference of 0.22%).
| Demographics | Rating | Rank | Wage/Income Gap |
| Americans | 0.7 /100 | #274 | Tragic 27.8% |
| Immigrants | Japan | 0.7 /100 | #275 | Tragic 27.9% |
| Lebanese | 0.7 /100 | #276 | Tragic 27.9% |
| Latvians | 0.7 /100 | #277 | Tragic 27.9% |
| Immigrants | England | 0.6 /100 | #278 | Tragic 27.9% |
| Romanians | 0.5 /100 | #279 | Tragic 28.0% |
| Russians | 0.5 /100 | #280 | Tragic 28.0% |
| Burmese | 0.5 /100 | #281 | Tragic 28.0% |
| South Africans | 0.5 /100 | #282 | Tragic 28.0% |
| French Canadians | 0.4 /100 | #283 | Tragic 28.1% |
| Immigrants | Sweden | 0.4 /100 | #284 | Tragic 28.1% |
| Italians | 0.4 /100 | #285 | Tragic 28.1% |
| Immigrants | Austria | 0.4 /100 | #286 | Tragic 28.1% |
| Okinawans | 0.4 /100 | #287 | Tragic 28.1% |
| Choctaw | 0.4 /100 | #288 | Tragic 28.1% |
Demographics Similar to Koreans by Wage/Income Gap
In terms of wage/income gap, the demographic groups most similar to Koreans are Native Hawaiian (25.4%, a difference of 0.030%), Shoshone (25.4%, a difference of 0.040%), Albanian (25.4%, a difference of 0.060%), French American Indian (25.4%, a difference of 0.32%), and Immigrants from Hong Kong (25.5%, a difference of 0.34%).
| Demographics | Rating | Rank | Wage/Income Gap |
| Costa Ricans | 75.8 /100 | #157 | Good 25.3% |
| Immigrants | Zimbabwe | 73.7 /100 | #158 | Good 25.3% |
| Puget Sound Salish | 73.0 /100 | #159 | Good 25.3% |
| French American Indians | 72.5 /100 | #160 | Good 25.4% |
| Albanians | 69.4 /100 | #161 | Good 25.4% |
| Shoshone | 69.0 /100 | #162 | Good 25.4% |
| Native Hawaiians | 69.0 /100 | #163 | Good 25.4% |
| Koreans | 68.6 /100 | #164 | Good 25.4% |
| Immigrants | Hong Kong | 64.0 /100 | #165 | Good 25.5% |
| Immigrants | Ukraine | 63.8 /100 | #166 | Good 25.5% |
| Paiute | 62.9 /100 | #167 | Good 25.5% |
| Seminole | 62.6 /100 | #168 | Good 25.6% |
| Peruvians | 60.1 /100 | #169 | Good 25.6% |
| Immigrants | Oceania | 57.5 /100 | #170 | Average 25.6% |
| Immigrants | Greece | 56.6 /100 | #171 | Average 25.7% |