Burmese vs Laotian Wage/Income Gap
COMPARE
Burmese
Laotian
Wage/Income Gap
Wage/Income Gap Comparison
Burmese
Laotians
28.0%
WAGE/INCOME GAP
0.5/ 100
METRIC RATING
281st/ 347
METRIC RANK
26.4%
WAGE/INCOME GAP
19.2/ 100
METRIC RATING
202nd/ 347
METRIC RANK
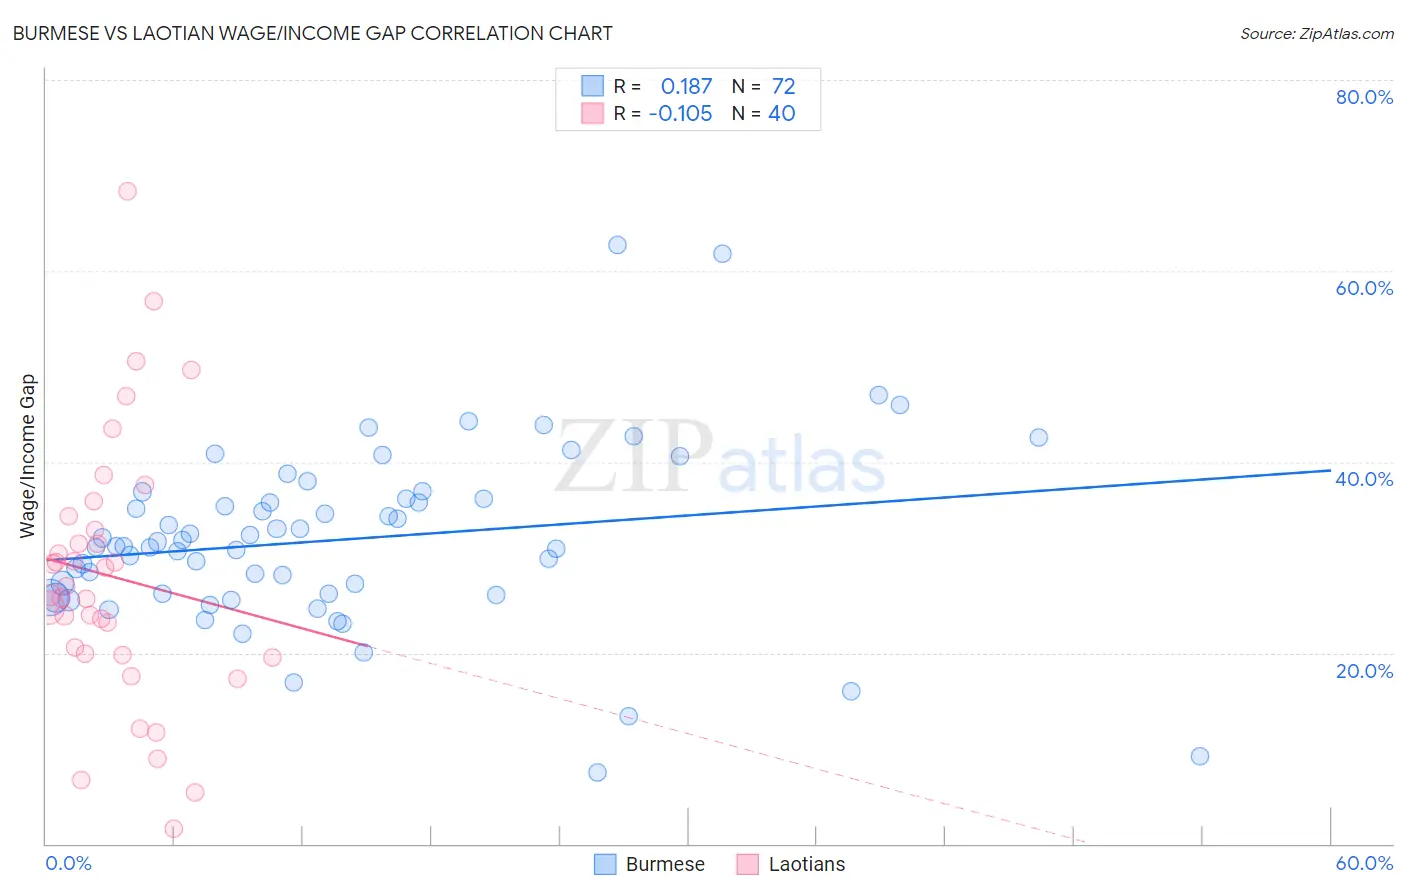
Burmese vs Laotian Wage/Income Gap Correlation Chart
The statistical analysis conducted on geographies consisting of 464,918,136 people shows a poor positive correlation between the proportion of Burmese and wage/income gap percentage in the United States with a correlation coefficient (R) of 0.187 and weighted average of 28.0%. Similarly, the statistical analysis conducted on geographies consisting of 224,802,355 people shows a poor negative correlation between the proportion of Laotians and wage/income gap percentage in the United States with a correlation coefficient (R) of -0.105 and weighted average of 26.4%, a difference of 6.2%.
Wage/Income Gap Correlation Summary
| Measurement | Burmese | Laotian |
| Minimum | 7.4% | 1.6% |
| Maximum | 62.7% | 68.3% |
| Range | 55.3% | 66.8% |
| Mean | 31.9% | 28.0% |
| Median | 31.2% | 26.5% |
| Interquartile 25% (IQ1) | 26.1% | 19.9% |
| Interquartile 75% (IQ3) | 36.1% | 33.6% |
| Interquartile Range (IQR) | 10.0% | 13.7% |
| Standard Deviation (Sample) | 9.5% | 13.9% |
| Standard Deviation (Population) | 9.5% | 13.7% |
Similar Demographics by Wage/Income Gap
Demographics Similar to Burmese by Wage/Income Gap
In terms of wage/income gap, the demographic groups most similar to Burmese are South African (28.0%, a difference of 0.030%), Russian (28.0%, a difference of 0.050%), Romanian (28.0%, a difference of 0.20%), French Canadian (28.1%, a difference of 0.21%), and Immigrants from Sweden (28.1%, a difference of 0.22%).
| Demographics | Rating | Rank | Wage/Income Gap |
| Americans | 0.7 /100 | #274 | Tragic 27.8% |
| Immigrants | Japan | 0.7 /100 | #275 | Tragic 27.9% |
| Lebanese | 0.7 /100 | #276 | Tragic 27.9% |
| Latvians | 0.7 /100 | #277 | Tragic 27.9% |
| Immigrants | England | 0.6 /100 | #278 | Tragic 27.9% |
| Romanians | 0.5 /100 | #279 | Tragic 28.0% |
| Russians | 0.5 /100 | #280 | Tragic 28.0% |
| Burmese | 0.5 /100 | #281 | Tragic 28.0% |
| South Africans | 0.5 /100 | #282 | Tragic 28.0% |
| French Canadians | 0.4 /100 | #283 | Tragic 28.1% |
| Immigrants | Sweden | 0.4 /100 | #284 | Tragic 28.1% |
| Italians | 0.4 /100 | #285 | Tragic 28.1% |
| Immigrants | Austria | 0.4 /100 | #286 | Tragic 28.1% |
| Okinawans | 0.4 /100 | #287 | Tragic 28.1% |
| Choctaw | 0.4 /100 | #288 | Tragic 28.1% |
Demographics Similar to Laotians by Wage/Income Gap
In terms of wage/income gap, the demographic groups most similar to Laotians are Immigrants from Eastern Europe (26.4%, a difference of 0.0%), Immigrants from Syria (26.4%, a difference of 0.010%), Immigrants from Russia (26.4%, a difference of 0.020%), Delaware (26.3%, a difference of 0.17%), and Dutch West Indian (26.3%, a difference of 0.18%).
| Demographics | Rating | Rank | Wage/Income Gap |
| Immigrants | Malaysia | 22.2 /100 | #195 | Fair 26.3% |
| Immigrants | Western Asia | 21.7 /100 | #196 | Fair 26.3% |
| Zimbabweans | 21.6 /100 | #197 | Fair 26.3% |
| Venezuelans | 21.5 /100 | #198 | Fair 26.3% |
| Dutch West Indians | 21.0 /100 | #199 | Fair 26.3% |
| Delaware | 20.9 /100 | #200 | Fair 26.3% |
| Immigrants | Syria | 19.3 /100 | #201 | Poor 26.4% |
| Laotians | 19.2 /100 | #202 | Poor 26.4% |
| Immigrants | Eastern Europe | 19.2 /100 | #203 | Poor 26.4% |
| Immigrants | Russia | 19.0 /100 | #204 | Poor 26.4% |
| Immigrants | Southern Europe | 17.3 /100 | #205 | Poor 26.4% |
| Indians (Asian) | 16.5 /100 | #206 | Poor 26.4% |
| Immigrants | Italy | 15.8 /100 | #207 | Poor 26.5% |
| Egyptians | 12.7 /100 | #208 | Poor 26.6% |
| Immigrants | Kuwait | 12.6 /100 | #209 | Poor 26.6% |