Afghan vs Nicaraguan Wage/Income Gap
COMPARE
Afghan
Nicaraguan
Wage/Income Gap
Wage/Income Gap Comparison
Afghans
Nicaraguans
24.9%
WAGE/INCOME GAP
88.1/ 100
METRIC RATING
142nd/ 347
METRIC RANK
23.4%
WAGE/INCOME GAP
99.6/ 100
METRIC RATING
90th/ 347
METRIC RANK
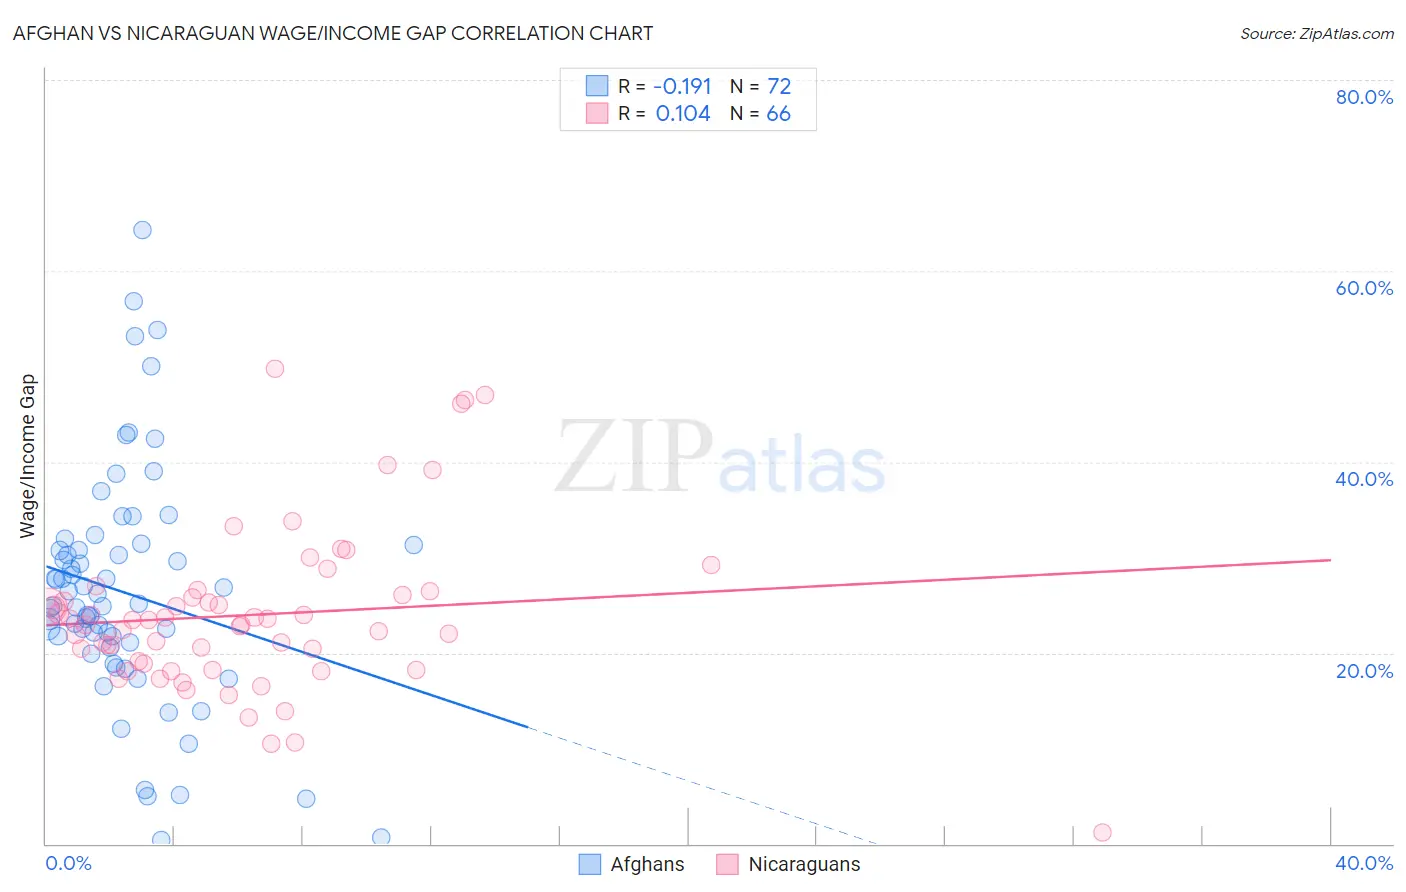
Afghan vs Nicaraguan Wage/Income Gap Correlation Chart
The statistical analysis conducted on geographies consisting of 148,863,238 people shows a poor negative correlation between the proportion of Afghans and wage/income gap percentage in the United States with a correlation coefficient (R) of -0.191 and weighted average of 24.9%. Similarly, the statistical analysis conducted on geographies consisting of 285,636,386 people shows a poor positive correlation between the proportion of Nicaraguans and wage/income gap percentage in the United States with a correlation coefficient (R) of 0.104 and weighted average of 23.4%, a difference of 6.4%.
Wage/Income Gap Correlation Summary
| Measurement | Afghan | Nicaraguan |
| Minimum | 0.35% | 1.2% |
| Maximum | 64.3% | 49.8% |
| Range | 63.9% | 48.6% |
| Mean | 26.3% | 24.0% |
| Median | 25.0% | 23.2% |
| Interquartile 25% (IQ1) | 20.8% | 18.9% |
| Interquartile 75% (IQ3) | 31.1% | 26.0% |
| Interquartile Range (IQR) | 10.3% | 7.1% |
| Standard Deviation (Sample) | 12.3% | 8.6% |
| Standard Deviation (Population) | 12.2% | 8.5% |
Similar Demographics by Wage/Income Gap
Demographics Similar to Afghans by Wage/Income Gap
In terms of wage/income gap, the demographic groups most similar to Afghans are Immigrants from Uganda (24.9%, a difference of 0.020%), Chippewa (25.0%, a difference of 0.19%), Hawaiian (24.9%, a difference of 0.20%), Immigrants from Nepal (24.9%, a difference of 0.21%), and Hispanic or Latino (24.9%, a difference of 0.24%).
| Demographics | Rating | Rank | Wage/Income Gap |
| South American Indians | 92.0 /100 | #135 | Exceptional 24.7% |
| Armenians | 91.3 /100 | #136 | Exceptional 24.8% |
| Immigrants | South Eastern Asia | 90.9 /100 | #137 | Exceptional 24.8% |
| Immigrants | Bosnia and Herzegovina | 90.1 /100 | #138 | Exceptional 24.8% |
| Hispanics or Latinos | 89.5 /100 | #139 | Excellent 24.9% |
| Immigrants | Nepal | 89.3 /100 | #140 | Excellent 24.9% |
| Hawaiians | 89.3 /100 | #141 | Excellent 24.9% |
| Afghans | 88.1 /100 | #142 | Excellent 24.9% |
| Immigrants | Uganda | 88.0 /100 | #143 | Excellent 24.9% |
| Chippewa | 86.9 /100 | #144 | Excellent 25.0% |
| Comanche | 85.2 /100 | #145 | Excellent 25.0% |
| South Americans | 85.2 /100 | #146 | Excellent 25.0% |
| Malaysians | 84.9 /100 | #147 | Excellent 25.0% |
| Iroquois | 83.9 /100 | #148 | Excellent 25.1% |
| Immigrants | Peru | 82.6 /100 | #149 | Excellent 25.1% |
Demographics Similar to Nicaraguans by Wage/Income Gap
In terms of wage/income gap, the demographic groups most similar to Nicaraguans are Marshallese (23.4%, a difference of 0.010%), Immigrants from Panama (23.4%, a difference of 0.10%), Arapaho (23.5%, a difference of 0.14%), Immigrants from Honduras (23.5%, a difference of 0.29%), and Yuman (23.3%, a difference of 0.42%).
| Demographics | Rating | Rank | Wage/Income Gap |
| Immigrants | Africa | 99.8 /100 | #83 | Exceptional 23.2% |
| Cubans | 99.7 /100 | #84 | Exceptional 23.3% |
| Immigrants | Cambodia | 99.7 /100 | #85 | Exceptional 23.3% |
| Cheyenne | 99.7 /100 | #86 | Exceptional 23.3% |
| Yuman | 99.7 /100 | #87 | Exceptional 23.3% |
| Immigrants | Panama | 99.6 /100 | #88 | Exceptional 23.4% |
| Marshallese | 99.6 /100 | #89 | Exceptional 23.4% |
| Nicaraguans | 99.6 /100 | #90 | Exceptional 23.4% |
| Arapaho | 99.6 /100 | #91 | Exceptional 23.5% |
| Immigrants | Honduras | 99.5 /100 | #92 | Exceptional 23.5% |
| Immigrants | Cabo Verde | 99.5 /100 | #93 | Exceptional 23.6% |
| Hondurans | 99.5 /100 | #94 | Exceptional 23.6% |
| Cape Verdeans | 99.4 /100 | #95 | Exceptional 23.6% |
| Kiowa | 99.4 /100 | #96 | Exceptional 23.6% |
| Immigrants | Sudan | 99.4 /100 | #97 | Exceptional 23.6% |