Afghan vs Vietnamese Wage/Income Gap
COMPARE
Afghan
Vietnamese
Wage/Income Gap
Wage/Income Gap Comparison
Afghans
Vietnamese
24.9%
WAGE/INCOME GAP
88.1/ 100
METRIC RATING
142nd/ 347
METRIC RANK
21.0%
WAGE/INCOME GAP
100.0/ 100
METRIC RATING
31st/ 347
METRIC RANK
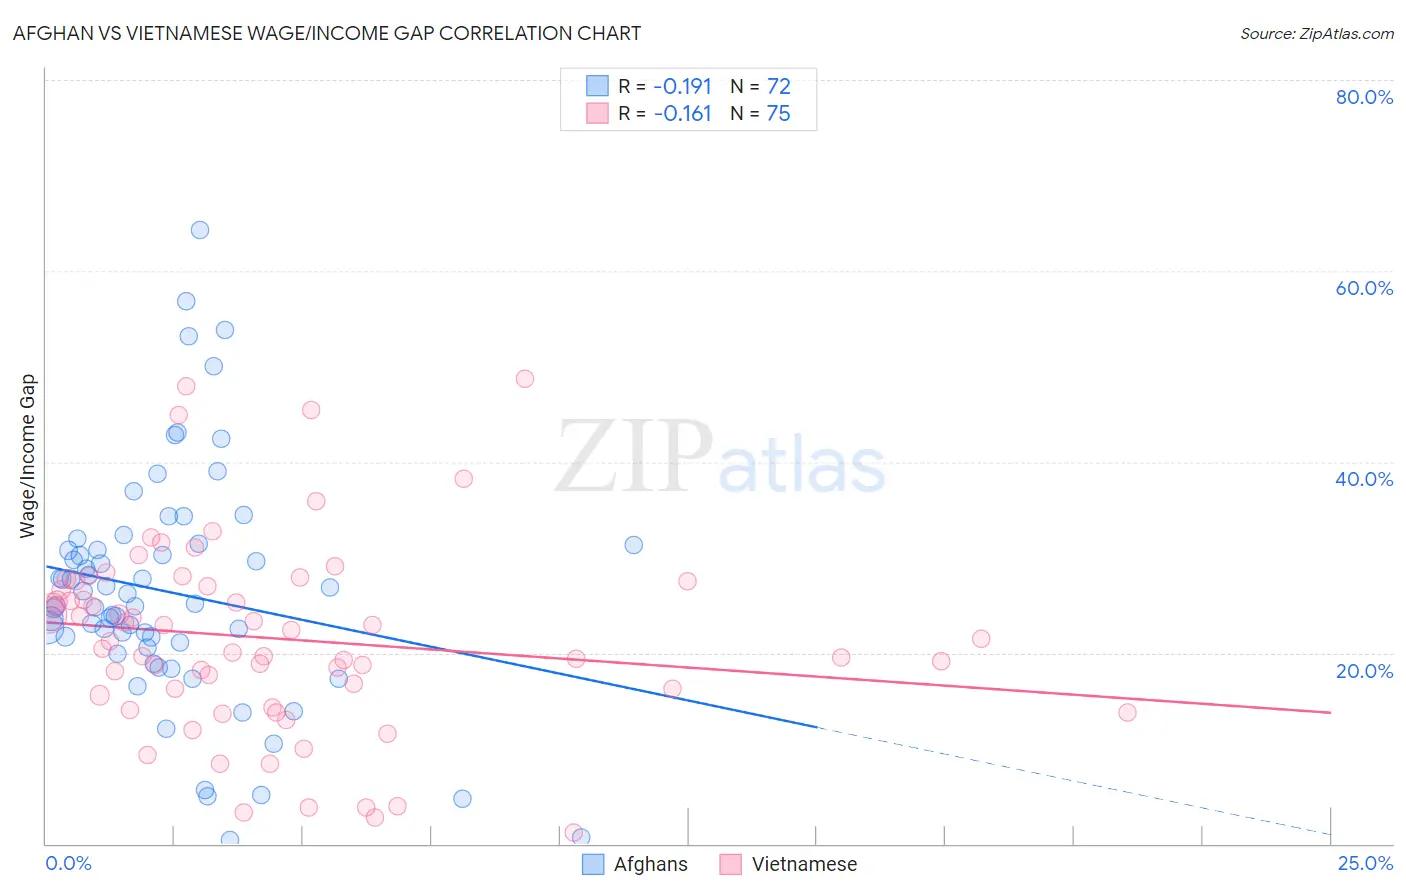
Afghan vs Vietnamese Wage/Income Gap Correlation Chart
The statistical analysis conducted on geographies consisting of 148,863,238 people shows a poor negative correlation between the proportion of Afghans and wage/income gap percentage in the United States with a correlation coefficient (R) of -0.191 and weighted average of 24.9%. Similarly, the statistical analysis conducted on geographies consisting of 170,722,757 people shows a poor negative correlation between the proportion of Vietnamese and wage/income gap percentage in the United States with a correlation coefficient (R) of -0.161 and weighted average of 21.0%, a difference of 18.7%.
Wage/Income Gap Correlation Summary
| Measurement | Afghan | Vietnamese |
| Minimum | 0.35% | 1.1% |
| Maximum | 64.3% | 48.7% |
| Range | 63.9% | 47.5% |
| Mean | 26.3% | 21.5% |
| Median | 25.0% | 21.2% |
| Interquartile 25% (IQ1) | 20.8% | 15.6% |
| Interquartile 75% (IQ3) | 31.1% | 27.5% |
| Interquartile Range (IQR) | 10.3% | 11.9% |
| Standard Deviation (Sample) | 12.3% | 10.1% |
| Standard Deviation (Population) | 12.2% | 10.0% |
Similar Demographics by Wage/Income Gap
Demographics Similar to Afghans by Wage/Income Gap
In terms of wage/income gap, the demographic groups most similar to Afghans are Immigrants from Uganda (24.9%, a difference of 0.020%), Chippewa (25.0%, a difference of 0.19%), Hawaiian (24.9%, a difference of 0.20%), Immigrants from Nepal (24.9%, a difference of 0.21%), and Hispanic or Latino (24.9%, a difference of 0.24%).
| Demographics | Rating | Rank | Wage/Income Gap |
| South American Indians | 92.0 /100 | #135 | Exceptional 24.7% |
| Armenians | 91.3 /100 | #136 | Exceptional 24.8% |
| Immigrants | South Eastern Asia | 90.9 /100 | #137 | Exceptional 24.8% |
| Immigrants | Bosnia and Herzegovina | 90.1 /100 | #138 | Exceptional 24.8% |
| Hispanics or Latinos | 89.5 /100 | #139 | Excellent 24.9% |
| Immigrants | Nepal | 89.3 /100 | #140 | Excellent 24.9% |
| Hawaiians | 89.3 /100 | #141 | Excellent 24.9% |
| Afghans | 88.1 /100 | #142 | Excellent 24.9% |
| Immigrants | Uganda | 88.0 /100 | #143 | Excellent 24.9% |
| Chippewa | 86.9 /100 | #144 | Excellent 25.0% |
| Comanche | 85.2 /100 | #145 | Excellent 25.0% |
| South Americans | 85.2 /100 | #146 | Excellent 25.0% |
| Malaysians | 84.9 /100 | #147 | Excellent 25.0% |
| Iroquois | 83.9 /100 | #148 | Excellent 25.1% |
| Immigrants | Peru | 82.6 /100 | #149 | Excellent 25.1% |
Demographics Similar to Vietnamese by Wage/Income Gap
In terms of wage/income gap, the demographic groups most similar to Vietnamese are Immigrants from Yemen (21.1%, a difference of 0.23%), Immigrants from Bahamas (21.1%, a difference of 0.25%), Immigrants from Bangladesh (20.9%, a difference of 0.28%), Immigrants from Senegal (20.9%, a difference of 0.49%), and Pima (21.1%, a difference of 0.53%).
| Demographics | Rating | Rank | Wage/Income Gap |
| Dominicans | 100.0 /100 | #24 | Exceptional 20.6% |
| Senegalese | 100.0 /100 | #25 | Exceptional 20.7% |
| Pueblo | 100.0 /100 | #26 | Exceptional 20.7% |
| Immigrants | Armenia | 100.0 /100 | #27 | Exceptional 20.7% |
| Inupiat | 100.0 /100 | #28 | Exceptional 20.8% |
| Immigrants | Senegal | 100.0 /100 | #29 | Exceptional 20.9% |
| Immigrants | Bangladesh | 100.0 /100 | #30 | Exceptional 20.9% |
| Vietnamese | 100.0 /100 | #31 | Exceptional 21.0% |
| Immigrants | Yemen | 100.0 /100 | #32 | Exceptional 21.1% |
| Immigrants | Bahamas | 100.0 /100 | #33 | Exceptional 21.1% |
| Pima | 100.0 /100 | #34 | Exceptional 21.1% |
| Somalis | 100.0 /100 | #35 | Exceptional 21.2% |
| Belizeans | 100.0 /100 | #36 | Exceptional 21.2% |
| Immigrants | Somalia | 100.0 /100 | #37 | Exceptional 21.2% |
| Immigrants | Belize | 100.0 /100 | #38 | Exceptional 21.3% |