Zip Codes with the Highest Percentage of Population with a Degree in Liberal Arts and History in Macon, GA
RELATED REPORTS & OPTIONS
Liberal Arts and History
Macon
Compare Zip Codes
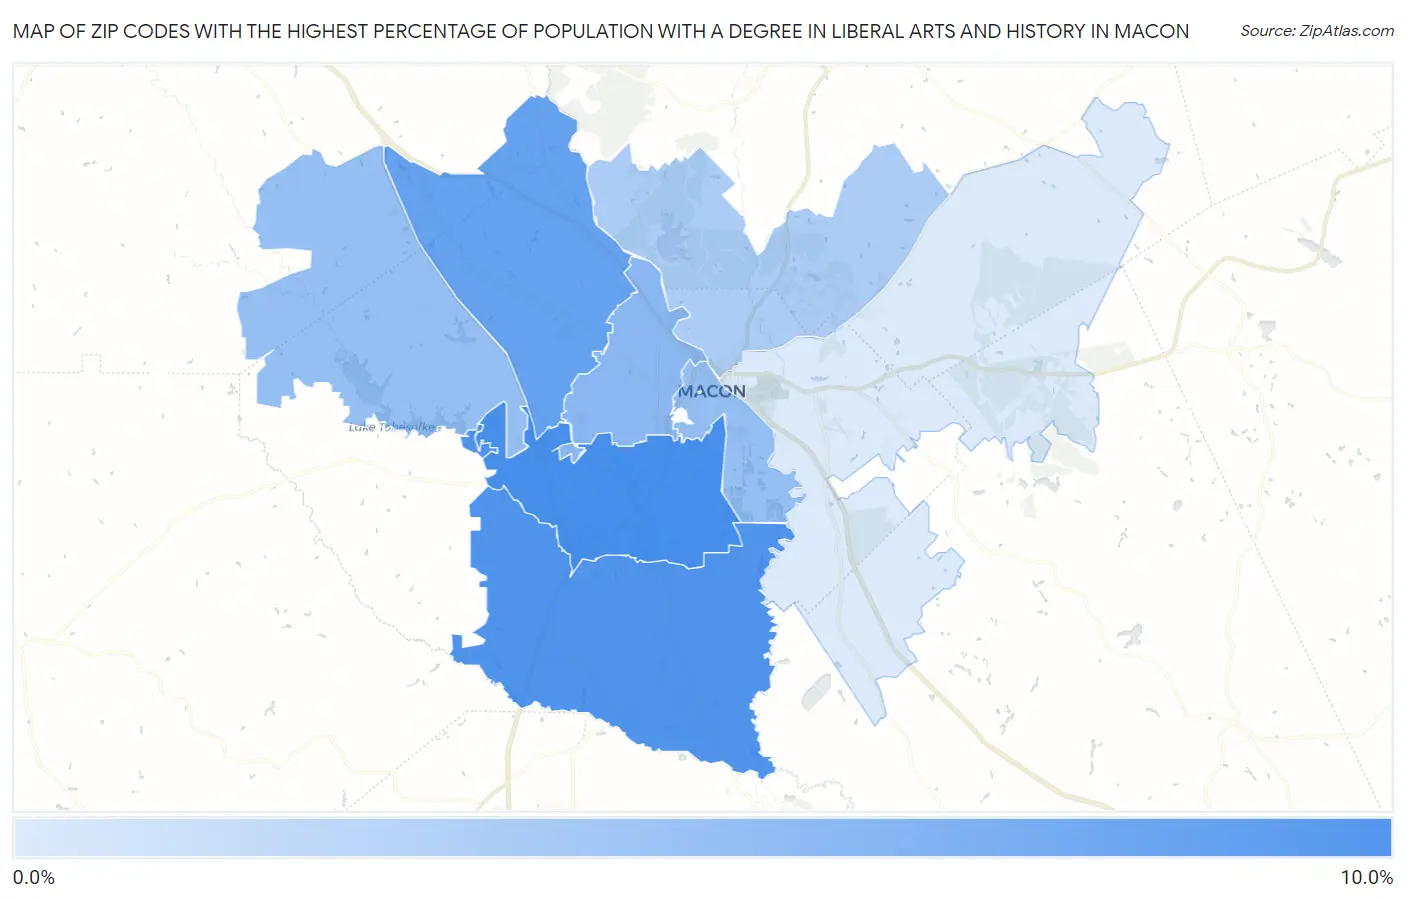
Map of Zip Codes with the Highest Percentage of Population with a Degree in Liberal Arts and History in Macon
1.2%
8.2%
Zip Codes with the Highest Percentage of Population with a Degree in Liberal Arts and History in Macon, GA
| Zip Code | % Graduates | vs State | vs National | |
| 1. | 31206 | 8.2% | 4.1%(+4.08)#90 | 4.9%(+3.33)#4,657 |
| 2. | 31216 | 7.9% | 4.1%(+3.76)#96 | 4.9%(+3.01)#5,059 |
| 3. | 31210 | 6.8% | 4.1%(+2.69)#127 | 4.9%(+1.95)#6,696 |
| 4. | 31204 | 5.1% | 4.1%(+0.932)#217 | 4.9%(+0.185)#11,176 |
| 5. | 31201 | 4.5% | 4.1%(+0.402)#264 | 4.9%(-0.344)#12,892 |
| 6. | 31220 | 4.5% | 4.1%(+0.388)#268 | 4.9%(-0.359)#12,939 |
| 7. | 31211 | 3.4% | 4.1%(-0.717)#376 | 4.9%(-1.46)#16,951 |
| 8. | 31217 | 1.2% | 4.1%(-2.91)#529 | 4.9%(-3.66)#23,012 |
1
Common Questions
What are the Top 5 Zip Codes with the Highest Percentage of Population with a Degree in Liberal Arts and History in Macon, GA?
Top 5 Zip Codes with the Highest Percentage of Population with a Degree in Liberal Arts and History in Macon, GA are:
What zip code has the Highest Percentage of Population with a Degree in Liberal Arts and History in Macon, GA?
31206 has the Highest Percentage of Population with a Degree in Liberal Arts and History in Macon, GA with 8.2%.
What is the Percentage of Population with a Degree in Liberal Arts and History in Georgia?
Percentage of Population with a Degree in Liberal Arts and History in Georgia is 4.1%.
What is the Percentage of Population with a Degree in Liberal Arts and History in the United States?
Percentage of Population with a Degree in Liberal Arts and History in the United States is 4.9%.