Rossville, GA Map & Demographics
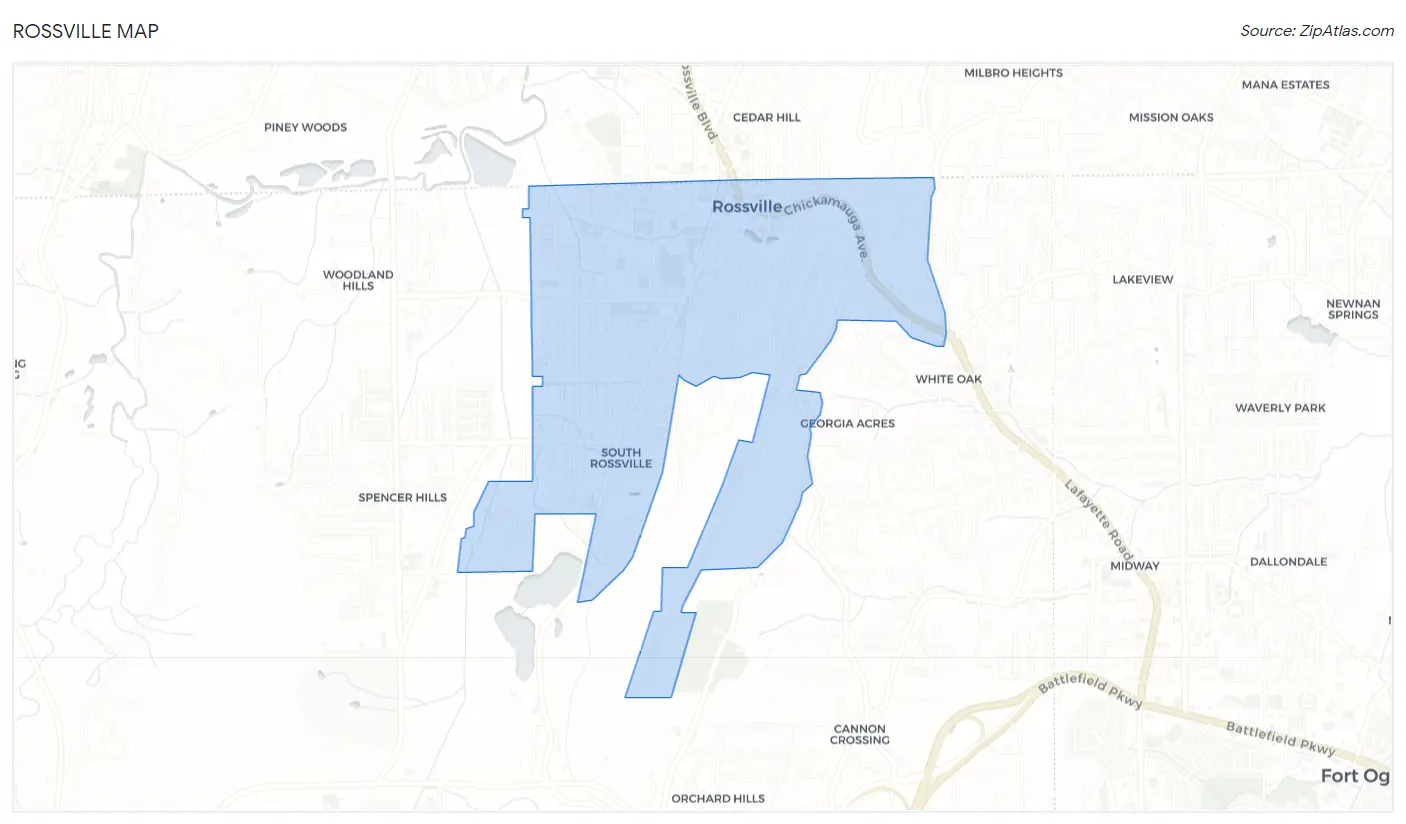
Rossville Map
Rossville Overview
$25,491
PER CAPITA INCOME
$55,903
AVG FAMILY INCOME
$42,845
AVG HOUSEHOLD INCOME
50.5%
WAGE / INCOME GAP [ % ]
49.5¢/ $1
WAGE / INCOME GAP [ $ ]
0.42
INEQUALITY / GINI INDEX
3,982
TOTAL POPULATION
2,119
MALE POPULATION
1,863
FEMALE POPULATION
113.74
MALES / 100 FEMALES
87.92
FEMALES / 100 MALES
42.7
MEDIAN AGE
2.6
AVG FAMILY SIZE
2.3
AVG HOUSEHOLD SIZE
1,942
LABOR FORCE [ PEOPLE ]
59.9%
PERCENT IN LABOR FORCE
5.3%
UNEMPLOYMENT RATE
Rossville Zip Codes
Income in Rossville
Income Overview in Rossville
Per Capita Income in Rossville is $25,491, while median incomes of families and households are $55,903 and $42,845 respectively.
| Characteristic | Number | Measure |
| Per Capita Income | 3,982 | $25,491 |
| Median Family Income | 1,295 | $55,903 |
| Mean Family Income | 1,295 | $59,018 |
| Median Household Income | 1,712 | $42,845 |
| Mean Household Income | 1,712 | $55,183 |
| Income Deficit | 1,295 | $0 |
| Wage / Income Gap (%) | 3,982 | 50.48% |
| Wage / Income Gap ($) | 3,982 | 49.52¢ per $1 |
| Gini / Inequality Index | 3,982 | 0.42 |
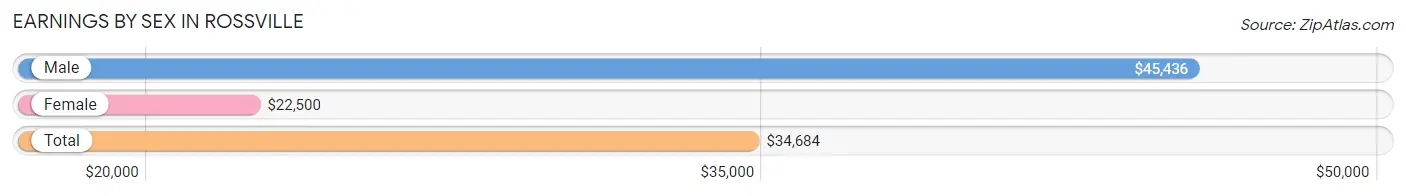
Earnings by Sex in Rossville
Average Earnings in Rossville are $34,684, $45,436 for men and $22,500 for women, a difference of 50.5%.
| Sex | Number | Average Earnings |
| Male | 1,105 (57.6%) | $45,436 |
| Female | 812 (42.4%) | $22,500 |
| Total | 1,917 (100.0%) | $34,684 |
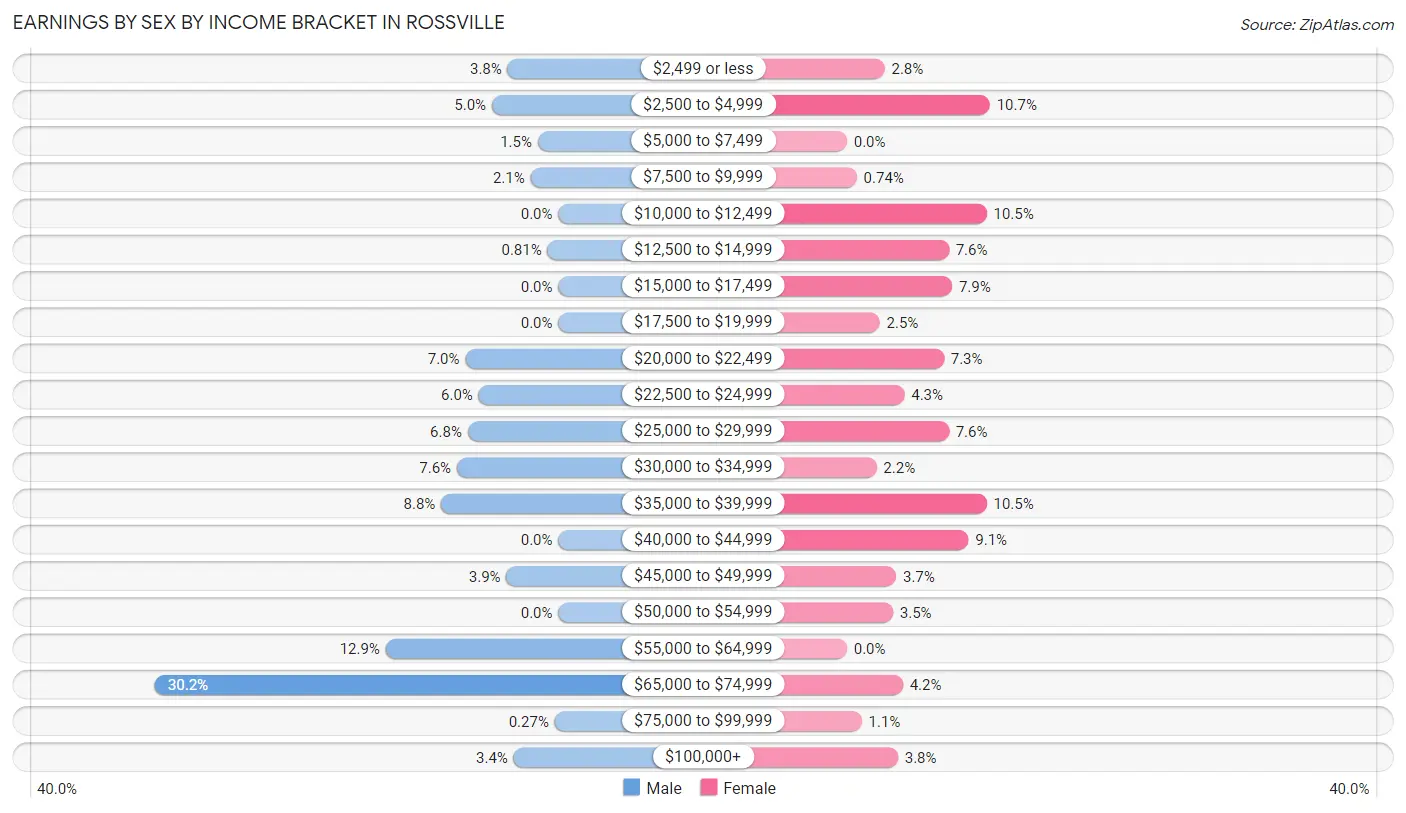
Earnings by Sex by Income Bracket in Rossville
The most common earnings brackets in Rossville are $65,000 to $74,999 for men (334 | 30.2%) and $2,500 to $4,999 for women (87 | 10.7%).
| Income | Male | Female |
| $2,499 or less | 42 (3.8%) | 23 (2.8%) |
| $2,500 to $4,999 | 55 (5.0%) | 87 (10.7%) |
| $5,000 to $7,499 | 17 (1.5%) | 0 (0.0%) |
| $7,500 to $9,999 | 23 (2.1%) | 6 (0.7%) |
| $10,000 to $12,499 | 0 (0.0%) | 85 (10.5%) |
| $12,500 to $14,999 | 9 (0.8%) | 62 (7.6%) |
| $15,000 to $17,499 | 0 (0.0%) | 64 (7.9%) |
| $17,500 to $19,999 | 0 (0.0%) | 20 (2.5%) |
| $20,000 to $22,499 | 77 (7.0%) | 59 (7.3%) |
| $22,500 to $24,999 | 66 (6.0%) | 35 (4.3%) |
| $25,000 to $29,999 | 75 (6.8%) | 62 (7.6%) |
| $30,000 to $34,999 | 84 (7.6%) | 18 (2.2%) |
| $35,000 to $39,999 | 97 (8.8%) | 85 (10.5%) |
| $40,000 to $44,999 | 0 (0.0%) | 74 (9.1%) |
| $45,000 to $49,999 | 43 (3.9%) | 30 (3.7%) |
| $50,000 to $54,999 | 0 (0.0%) | 28 (3.5%) |
| $55,000 to $64,999 | 143 (12.9%) | 0 (0.0%) |
| $65,000 to $74,999 | 334 (30.2%) | 34 (4.2%) |
| $75,000 to $99,999 | 3 (0.3%) | 9 (1.1%) |
| $100,000+ | 37 (3.4%) | 31 (3.8%) |
| Total | 1,105 (100.0%) | 812 (100.0%) |
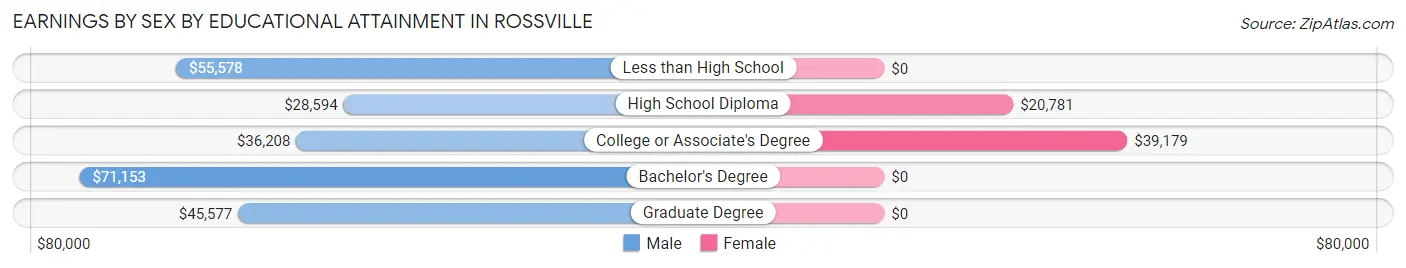
Earnings by Sex by Educational Attainment in Rossville
Average earnings in Rossville are $55,052 for men and $26,071 for women, a difference of 52.6%. Men with an educational attainment of bachelor's degree enjoy the highest average annual earnings of $71,153, while those with high school diploma education earn the least with $28,594. Women with an educational attainment of college or associate's degree earn the most with the average annual earnings of $39,179, while those with high school diploma education have the smallest earnings of $20,781.
| Educational Attainment | Male Income | Female Income |
| Less than High School | $55,578 | $0 |
| High School Diploma | $28,594 | $20,781 |
| College or Associate's Degree | $36,208 | $39,179 |
| Bachelor's Degree | $71,153 | $0 |
| Graduate Degree | $45,577 | $0 |
| Total | $55,052 | $26,071 |
Family Income in Rossville
Family Income Brackets in Rossville
According to the Rossville family income data, there are 566 families falling into the $50,000 to $74,999 income range, which is the most common income bracket and makes up 43.7% of all families. Conversely, the $200,000+ income bracket is the least frequent group with only 10 families (0.8%) belonging to this category.
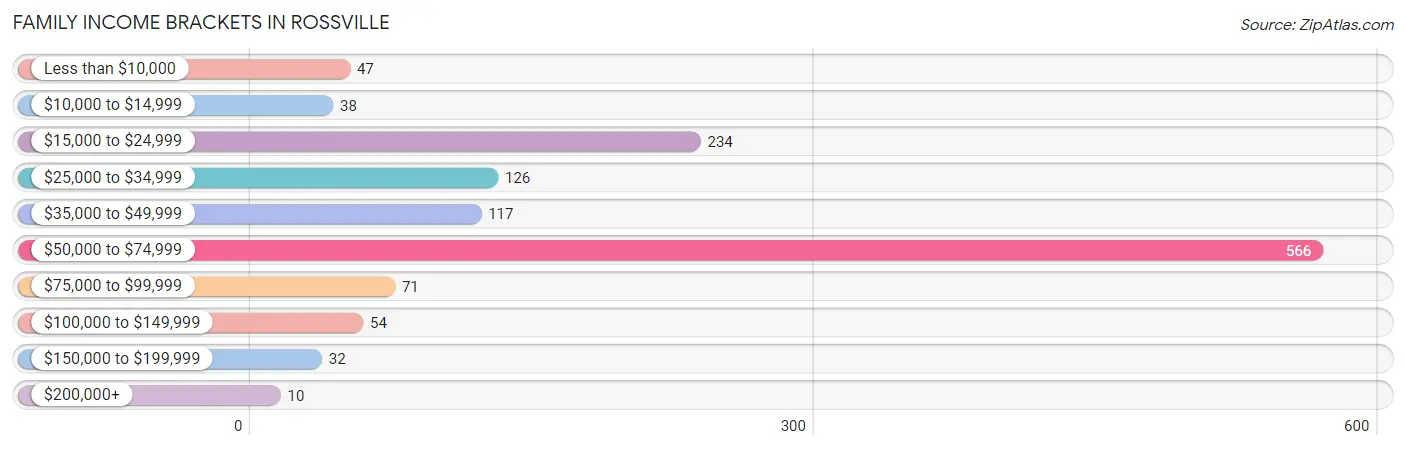
| Income Bracket | # Families | % Families |
| Less than $10,000 | 47 | 3.6% |
| $10,000 to $14,999 | 38 | 2.9% |
| $15,000 to $24,999 | 234 | 18.1% |
| $25,000 to $34,999 | 126 | 9.7% |
| $35,000 to $49,999 | 117 | 9.0% |
| $50,000 to $74,999 | 566 | 43.7% |
| $75,000 to $99,999 | 71 | 5.5% |
| $100,000 to $149,999 | 54 | 4.2% |
| $150,000 to $199,999 | 32 | 2.5% |
| $200,000+ | 10 | 0.8% |
Family Income by Famaliy Size in Rossville
3-person families (338 | 26.1%) account for the highest median family income in Rossville with $56,578 per family, while 2-person families (794 | 61.3%) have the highest median income of $27,059 per family member.
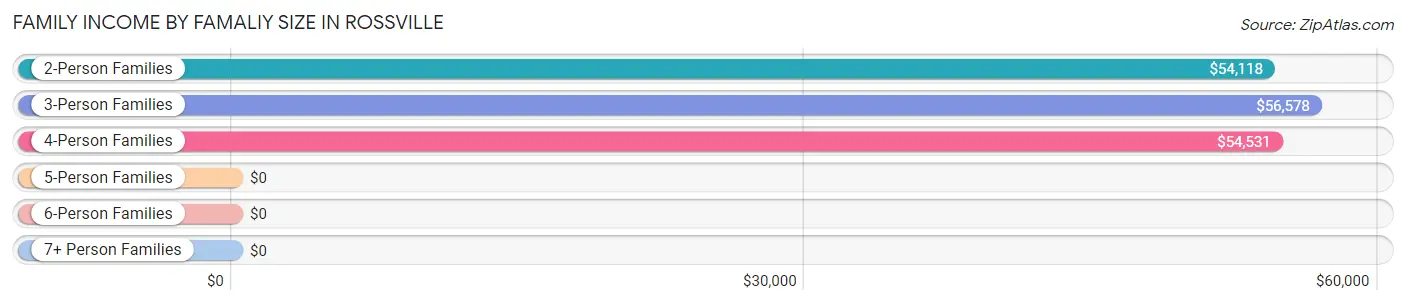
| Income Bracket | # Families | Median Income |
| 2-Person Families | 794 (61.3%) | $54,118 |
| 3-Person Families | 338 (26.1%) | $56,578 |
| 4-Person Families | 139 (10.7%) | $54,531 |
| 5-Person Families | 18 (1.4%) | $0 |
| 6-Person Families | 6 (0.5%) | $0 |
| 7+ Person Families | 0 (0.0%) | $0 |
| Total | 1,295 (100.0%) | $55,903 |
Family Income by Number of Earners in Rossville
The median family income in Rossville is $55,903, with families comprising 3+ earners (107) having the highest median family income of $96,098, while families with no earners (234) have the lowest median family income of $24,515, accounting for 8.3% and 18.1% of families, respectively.
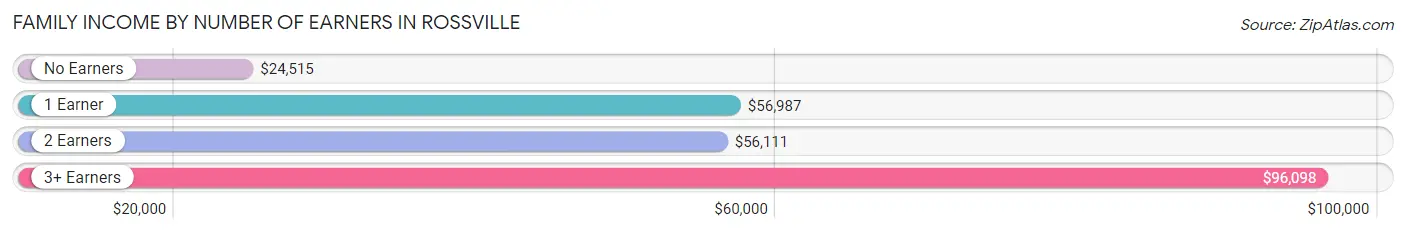
| Number of Earners | # Families | Median Income |
| No Earners | 234 (18.1%) | $24,515 |
| 1 Earner | 764 (59.0%) | $56,987 |
| 2 Earners | 190 (14.7%) | $56,111 |
| 3+ Earners | 107 (8.3%) | $96,098 |
| Total | 1,295 (100.0%) | $55,903 |
Household Income in Rossville
Household Income Brackets in Rossville
With 603 households falling in the category, the $50,000 to $74,999 income range is the most frequent in Rossville, accounting for 35.2% of all households. In contrast, only 14 households (0.8%) fall into the $200,000+ income bracket, making it the least populous group.
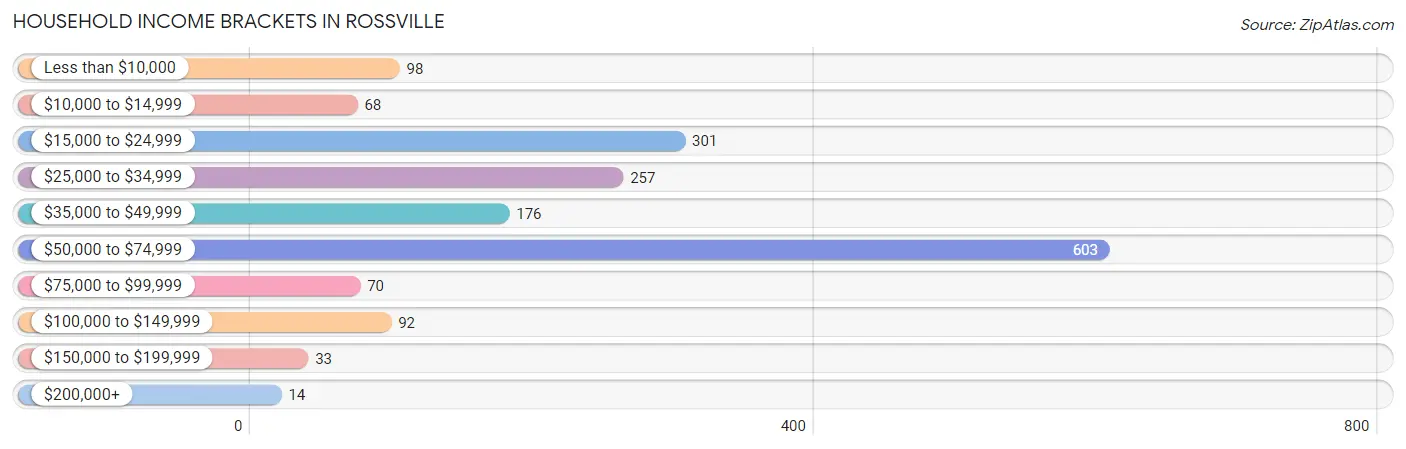
| Income Bracket | # Households | % Households |
| Less than $10,000 | 98 | 5.7% |
| $10,000 to $14,999 | 68 | 4.0% |
| $15,000 to $24,999 | 301 | 17.6% |
| $25,000 to $34,999 | 257 | 15.0% |
| $35,000 to $49,999 | 176 | 10.3% |
| $50,000 to $74,999 | 603 | 35.2% |
| $75,000 to $99,999 | 70 | 4.1% |
| $100,000 to $149,999 | 92 | 5.4% |
| $150,000 to $199,999 | 33 | 1.9% |
| $200,000+ | 14 | 0.8% |
Household Income by Householder Age in Rossville
The median household income in Rossville is $42,845, with the highest median household income of $57,241 found in the 25 to 44 years age bracket for the primary householder. A total of 750 households (43.8%) fall into this category. Meanwhile, the 15 to 24 years age bracket for the primary householder has the lowest median household income of $0, with 39 households (2.3%) in this group.
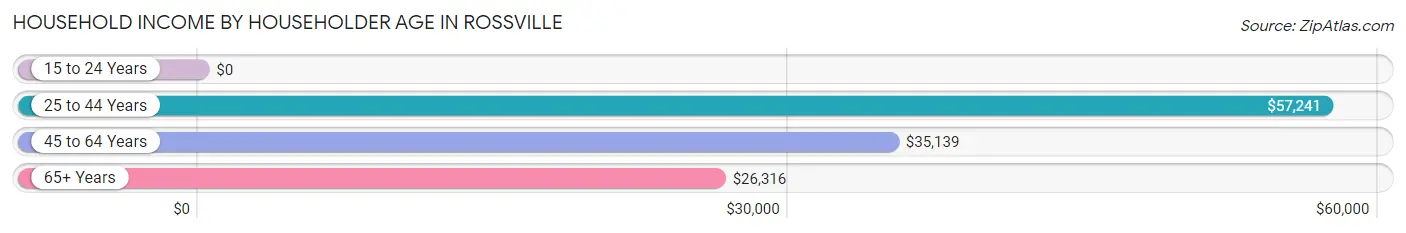
| Income Bracket | # Households | Median Income |
| 15 to 24 Years | 39 (2.3%) | $0 |
| 25 to 44 Years | 750 (43.8%) | $57,241 |
| 45 to 64 Years | 501 (29.3%) | $35,139 |
| 65+ Years | 422 (24.6%) | $26,316 |
| Total | 1,712 (100.0%) | $42,845 |
Poverty in Rossville
Income Below Poverty by Sex and Age in Rossville
With 15.0% poverty level for males and 22.5% for females among the residents of Rossville, 15 year old males and 6 to 11 year old females are the most vulnerable to poverty, with 36 males (100.0%) and 41 females (80.4%) in their respective age groups living below the poverty level.
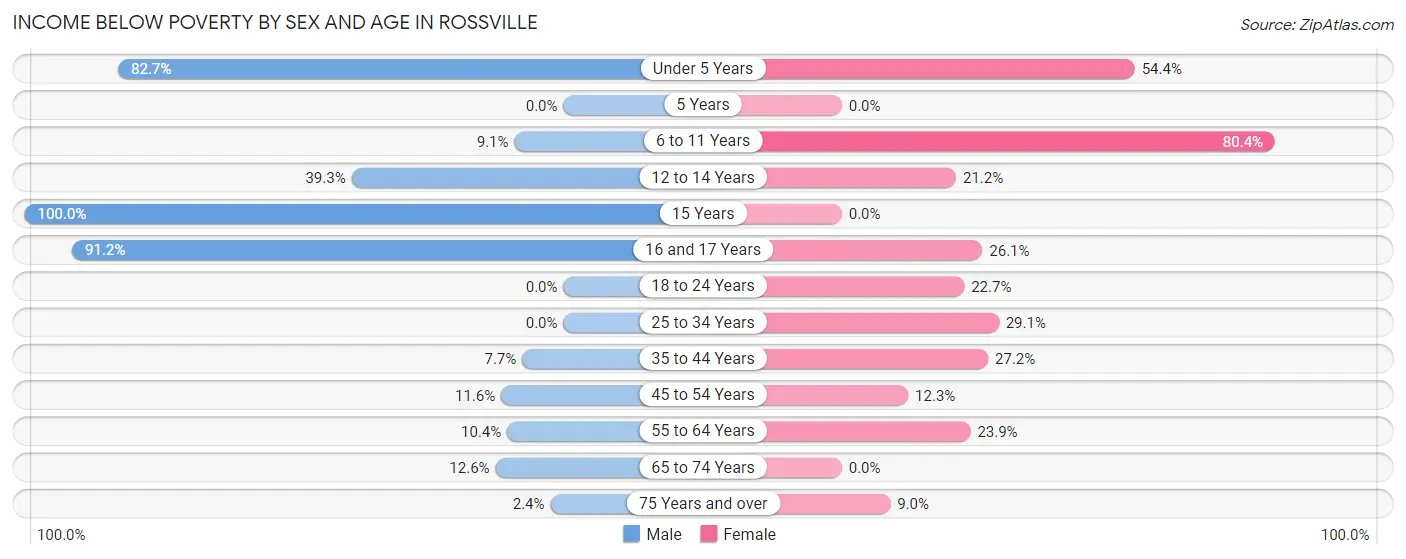
| Age Bracket | Male | Female |
| Under 5 Years | 81 (82.7%) | 56 (54.4%) |
| 5 Years | 0 (0.0%) | 0 (0.0%) |
| 6 to 11 Years | 27 (9.1%) | 41 (80.4%) |
| 12 to 14 Years | 35 (39.3%) | 14 (21.2%) |
| 15 Years | 36 (100.0%) | 0 (0.0%) |
| 16 and 17 Years | 31 (91.2%) | 12 (26.1%) |
| 18 to 24 Years | 0 (0.0%) | 30 (22.7%) |
| 25 to 34 Years | 0 (0.0%) | 60 (29.1%) |
| 35 to 44 Years | 42 (7.7%) | 85 (27.2%) |
| 45 to 54 Years | 25 (11.6%) | 35 (12.3%) |
| 55 to 64 Years | 19 (10.4%) | 48 (23.9%) |
| 65 to 74 Years | 15 (12.6%) | 0 (0.0%) |
| 75 Years and over | 2 (2.4%) | 23 (9.0%) |
| Total | 313 (15.0%) | 404 (22.5%) |
Income Above Poverty by Sex and Age in Rossville
According to the poverty statistics in Rossville, males aged 18 to 24 years and females aged 65 to 74 years are the age groups that are most secure financially, with 100.0% of males and 100.0% of females in these age groups living above the poverty line.
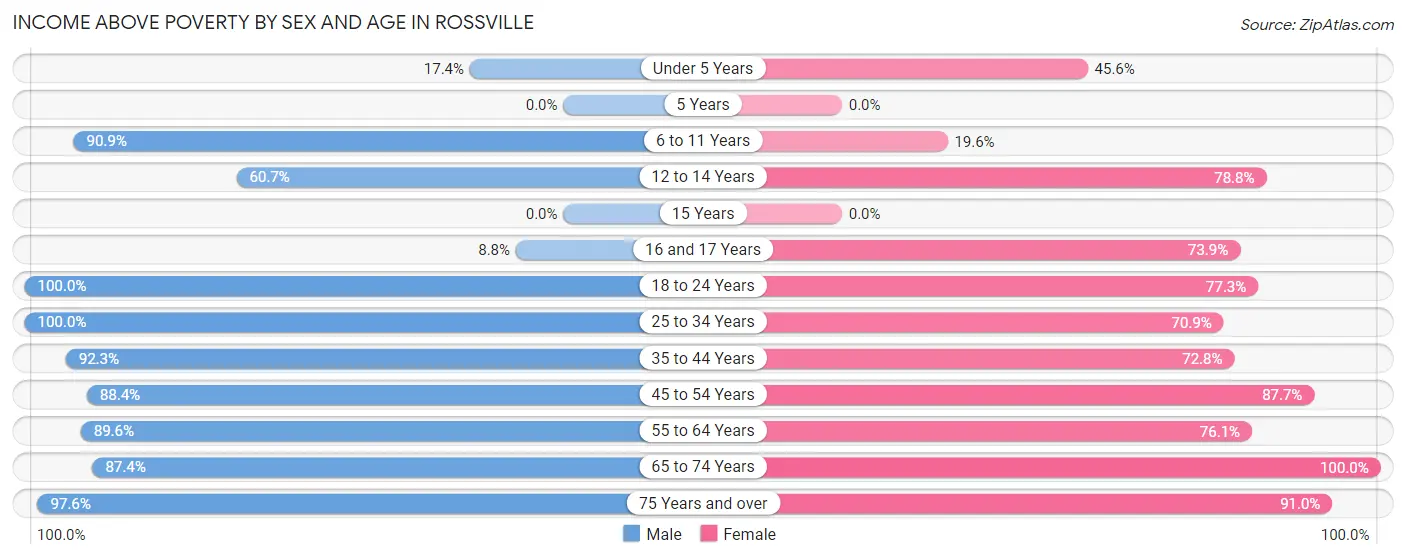
| Age Bracket | Male | Female |
| Under 5 Years | 17 (17.3%) | 47 (45.6%) |
| 5 Years | 0 (0.0%) | 0 (0.0%) |
| 6 to 11 Years | 270 (90.9%) | 10 (19.6%) |
| 12 to 14 Years | 54 (60.7%) | 52 (78.8%) |
| 15 Years | 0 (0.0%) | 0 (0.0%) |
| 16 and 17 Years | 3 (8.8%) | 34 (73.9%) |
| 18 to 24 Years | 213 (100.0%) | 102 (77.3%) |
| 25 to 34 Years | 176 (100.0%) | 146 (70.9%) |
| 35 to 44 Years | 506 (92.3%) | 228 (72.8%) |
| 45 to 54 Years | 191 (88.4%) | 249 (87.7%) |
| 55 to 64 Years | 163 (89.6%) | 153 (76.1%) |
| 65 to 74 Years | 104 (87.4%) | 135 (100.0%) |
| 75 Years and over | 81 (97.6%) | 233 (91.0%) |
| Total | 1,778 (85.0%) | 1,389 (77.5%) |
Income Below Poverty Among Married-Couple Families in Rossville
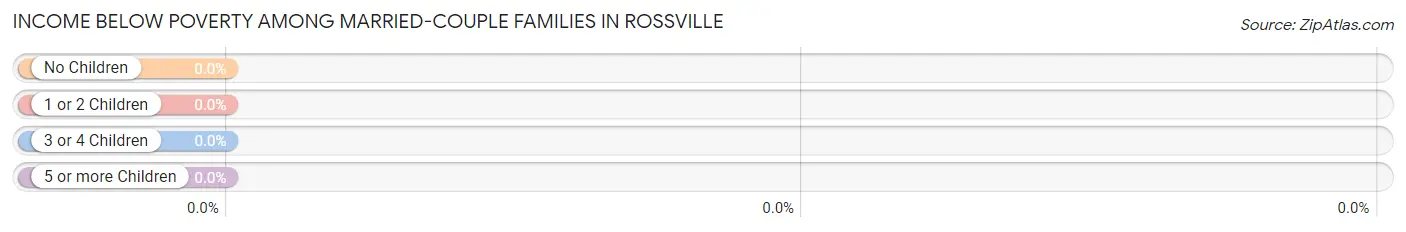
| Children | Above Poverty | Below Poverty |
| No Children | 457 (100.0%) | 0 (0.0%) |
| 1 or 2 Children | 49 (100.0%) | 0 (0.0%) |
| 3 or 4 Children | 0 (0.0%) | 0 (0.0%) |
| 5 or more Children | 0 (0.0%) | 0 (0.0%) |
| Total | 506 (100.0%) | 0 (0.0%) |
Income Below Poverty Among Single-Parent Households in Rossville
According to the poverty data in Rossville, 3.9% or 14 single-father households and 47.4% or 202 single-mother households are living below the poverty line. Among single-father households, those with 1 or 2 children have the highest poverty rate, with 14 households (4.2%) experiencing poverty. Likewise, among single-mother households, those with 3 or 4 children have the highest poverty rate, with 37 households (67.3%) falling below the poverty line.
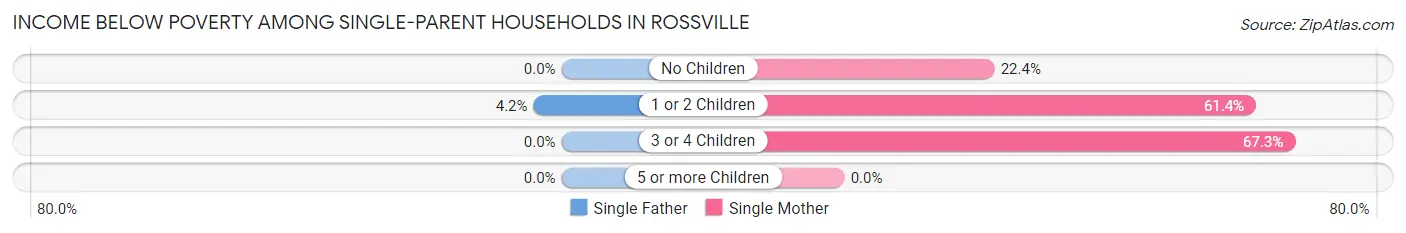
| Children | Single Father | Single Mother |
| No Children | 0 (0.0%) | 36 (22.4%) |
| 1 or 2 Children | 14 (4.2%) | 129 (61.4%) |
| 3 or 4 Children | 0 (0.0%) | 37 (67.3%) |
| 5 or more Children | 0 (0.0%) | 0 (0.0%) |
| Total | 14 (3.9%) | 202 (47.4%) |
Income Below Poverty Among Married-Couple vs Single-Parent Households in Rossville
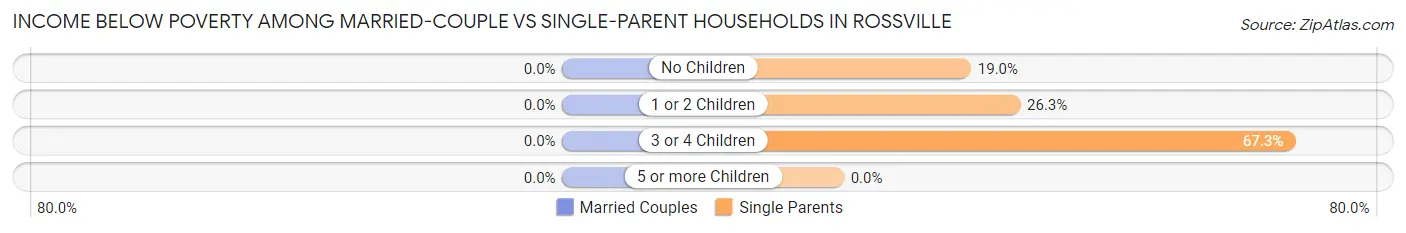
| Children | Married-Couple Families | Single-Parent Households |
| No Children | 0 (0.0%) | 36 (19.0%) |
| 1 or 2 Children | 0 (0.0%) | 143 (26.3%) |
| 3 or 4 Children | 0 (0.0%) | 37 (67.3%) |
| 5 or more Children | 0 (0.0%) | 0 (0.0%) |
| Total | 0 (0.0%) | 216 (27.4%) |
Race in Rossville
The most populous races in Rossville are White / Caucasian (3,278 | 82.3%), Black / African American (344 | 8.6%), and Two or more Races (225 | 5.7%).
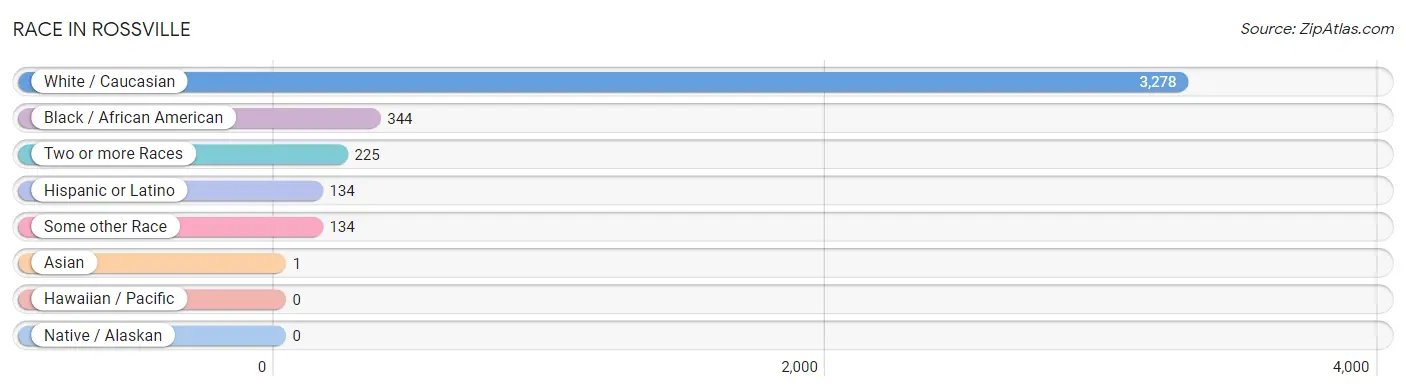
| Race | # Population | % Population |
| Asian | 1 | 0.0% |
| Black / African American | 344 | 8.6% |
| Hawaiian / Pacific | 0 | 0.0% |
| Hispanic or Latino | 134 | 3.4% |
| Native / Alaskan | 0 | 0.0% |
| White / Caucasian | 3,278 | 82.3% |
| Two or more Races | 225 | 5.7% |
| Some other Race | 134 | 3.4% |
| Total | 3,982 | 100.0% |
Ancestry in Rossville
The most populous ancestries reported in Rossville are American (795 | 20.0%), English (546 | 13.7%), German (264 | 6.6%), Irish (242 | 6.1%), and Mexican (134 | 3.4%), together accounting for 49.8% of all Rossville residents.
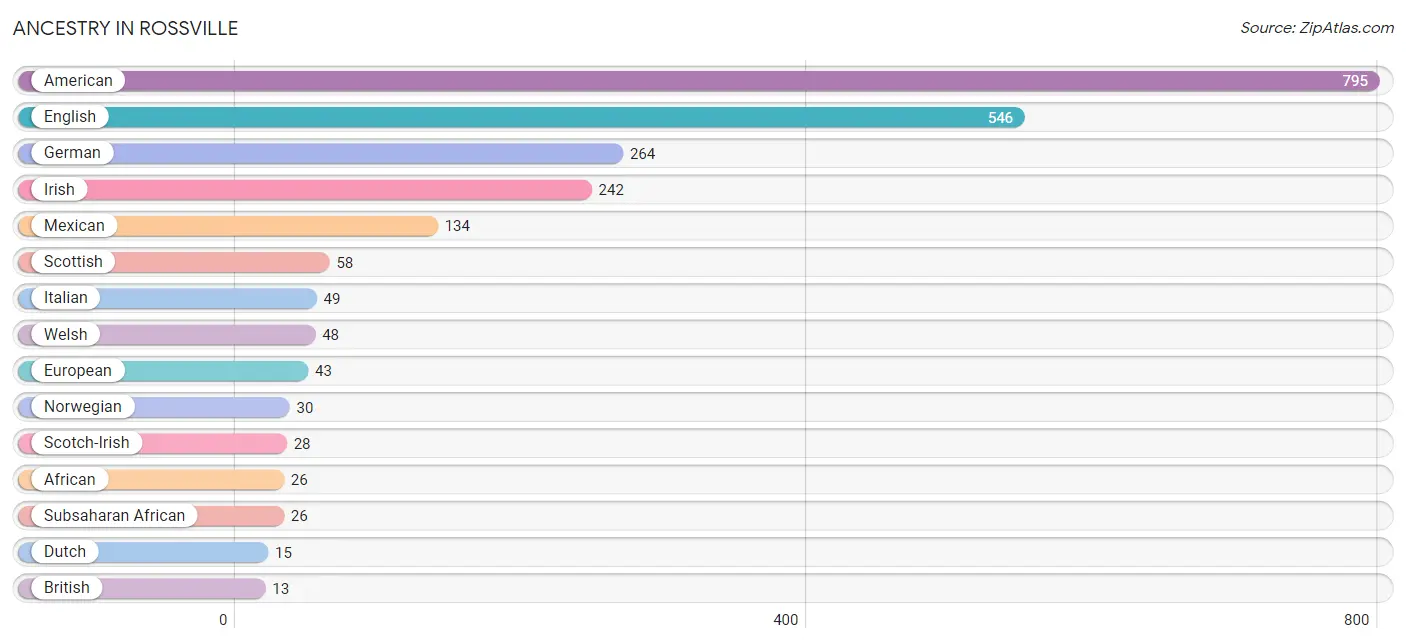
| Ancestry | # Population | % Population |
| African | 26 | 0.6% |
| American | 795 | 20.0% |
| Austrian | 4 | 0.1% |
| British | 13 | 0.3% |
| Cherokee | 6 | 0.2% |
| Dutch | 15 | 0.4% |
| English | 546 | 13.7% |
| European | 43 | 1.1% |
| German | 264 | 6.6% |
| Hungarian | 11 | 0.3% |
| Irish | 242 | 6.1% |
| Italian | 49 | 1.2% |
| Lithuanian | 6 | 0.2% |
| Mexican | 134 | 3.4% |
| Norwegian | 30 | 0.7% |
| Pueblo | 12 | 0.3% |
| Scotch-Irish | 28 | 0.7% |
| Scottish | 58 | 1.5% |
| Subsaharan African | 26 | 0.6% |
| Welsh | 48 | 1.2% | View All 20 Rows |
Immigrants in Rossville
The most numerous immigrant groups reported in Rossville came from Canada (36 | 0.9%), Eastern Europe (11 | 0.3%), Europe (11 | 0.3%), Hungary (11 | 0.3%), and Asia (1 | 0.0%), together accounting for 1.8% of all Rossville residents.
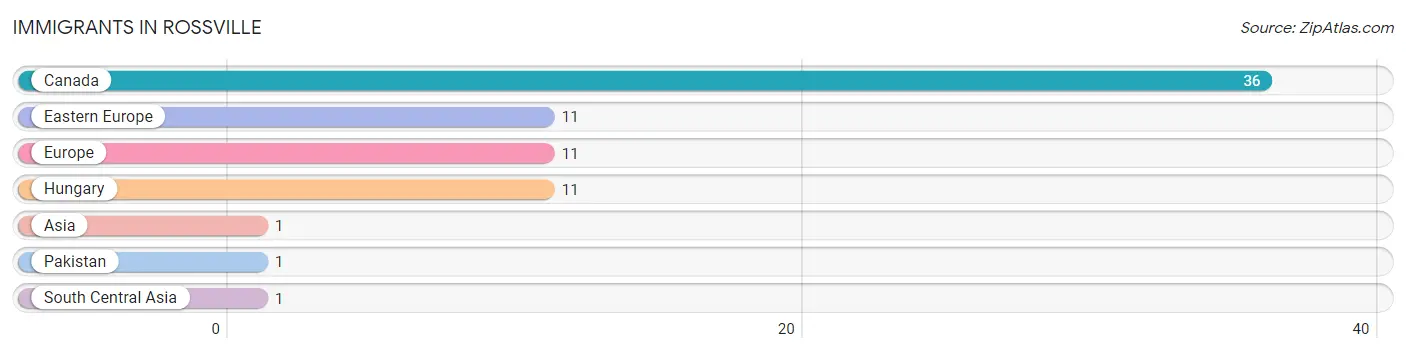
| Immigration Origin | # Population | % Population |
| Asia | 1 | 0.0% |
| Canada | 36 | 0.9% |
| Eastern Europe | 11 | 0.3% |
| Europe | 11 | 0.3% |
| Hungary | 11 | 0.3% |
| Pakistan | 1 | 0.0% |
| South Central Asia | 1 | 0.0% | View All 7 Rows |
Sex and Age in Rossville
Sex and Age in Rossville
The most populous age groups in Rossville are 40 to 44 Years (414 | 19.5%) for men and 50 to 54 Years (250 | 13.4%) for women.
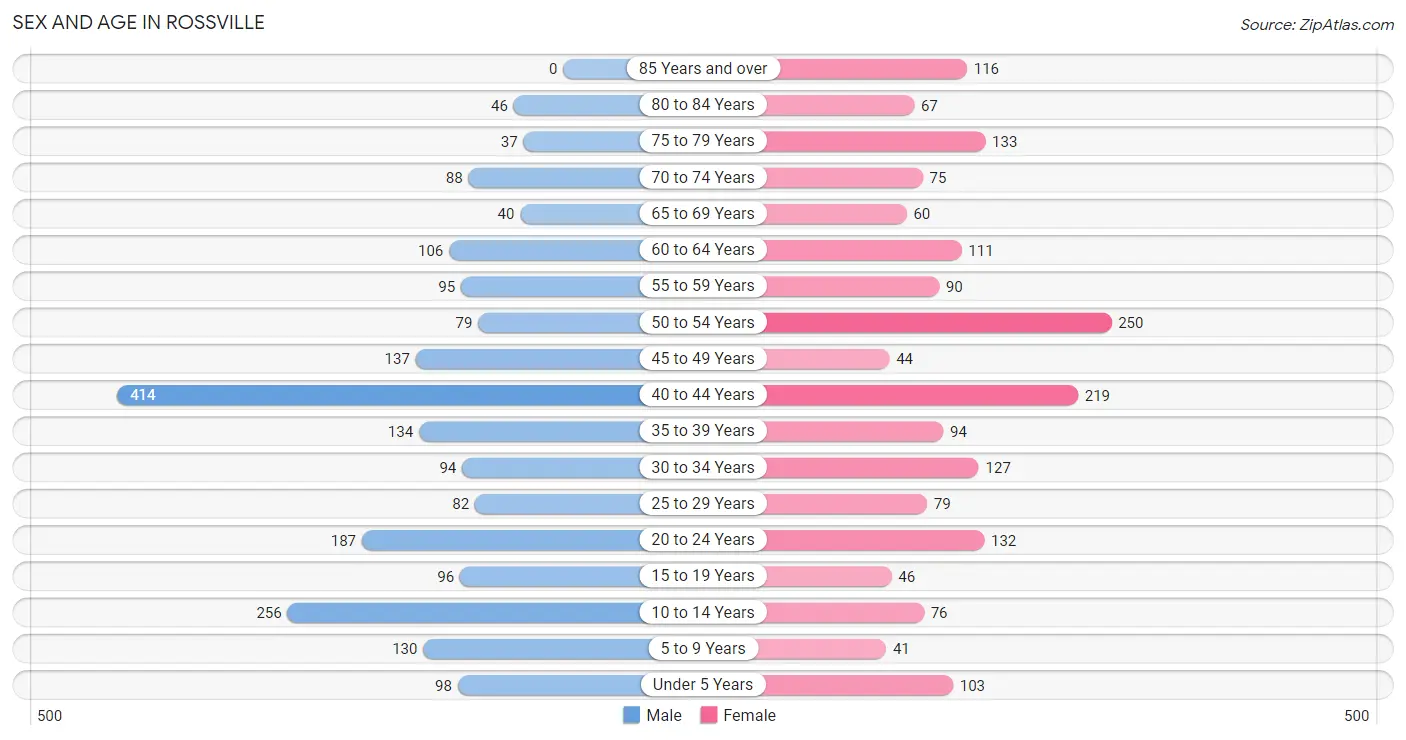
| Age Bracket | Male | Female |
| Under 5 Years | 98 (4.6%) | 103 (5.5%) |
| 5 to 9 Years | 130 (6.1%) | 41 (2.2%) |
| 10 to 14 Years | 256 (12.1%) | 76 (4.1%) |
| 15 to 19 Years | 96 (4.5%) | 46 (2.5%) |
| 20 to 24 Years | 187 (8.8%) | 132 (7.1%) |
| 25 to 29 Years | 82 (3.9%) | 79 (4.2%) |
| 30 to 34 Years | 94 (4.4%) | 127 (6.8%) |
| 35 to 39 Years | 134 (6.3%) | 94 (5.1%) |
| 40 to 44 Years | 414 (19.5%) | 219 (11.8%) |
| 45 to 49 Years | 137 (6.5%) | 44 (2.4%) |
| 50 to 54 Years | 79 (3.7%) | 250 (13.4%) |
| 55 to 59 Years | 95 (4.5%) | 90 (4.8%) |
| 60 to 64 Years | 106 (5.0%) | 111 (6.0%) |
| 65 to 69 Years | 40 (1.9%) | 60 (3.2%) |
| 70 to 74 Years | 88 (4.2%) | 75 (4.0%) |
| 75 to 79 Years | 37 (1.8%) | 133 (7.1%) |
| 80 to 84 Years | 46 (2.2%) | 67 (3.6%) |
| 85 Years and over | 0 (0.0%) | 116 (6.2%) |
| Total | 2,119 (100.0%) | 1,863 (100.0%) |
Families and Households in Rossville
Median Family Size in Rossville
The median family size in Rossville is 2.60 persons per family, with single female/mother families (426 | 32.9%) accounting for the largest median family size of 3.17 persons per family. On the other hand, single male/father families (363 | 28.0%) represent the smallest median family size with 1.87 persons per family.
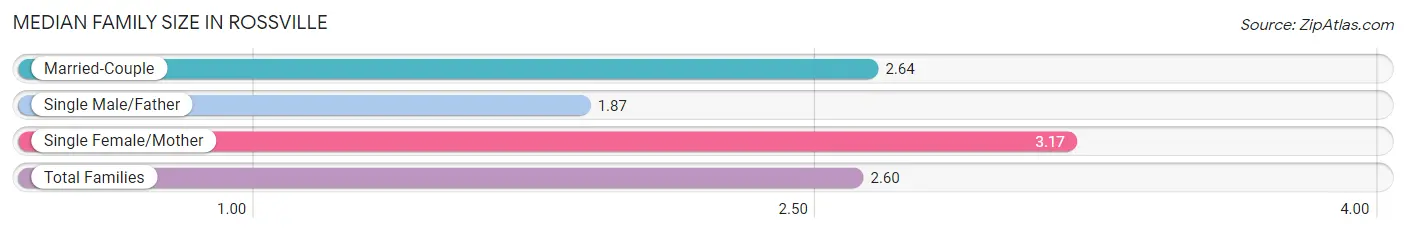
| Family Type | # Families | Family Size |
| Married-Couple | 506 (39.1%) | 2.64 |
| Single Male/Father | 363 (28.0%) | 1.87 |
| Single Female/Mother | 426 (32.9%) | 3.17 |
| Total Families | 1,295 (100.0%) | 2.60 |
Median Household Size in Rossville
The median household size in Rossville is 2.27 persons per household, with single female/mother households (426 | 24.9%) accounting for the largest median household size of 3.17 persons per household. non-family households (417 | 24.4%) represent the smallest median household size with 1.17 persons per household.
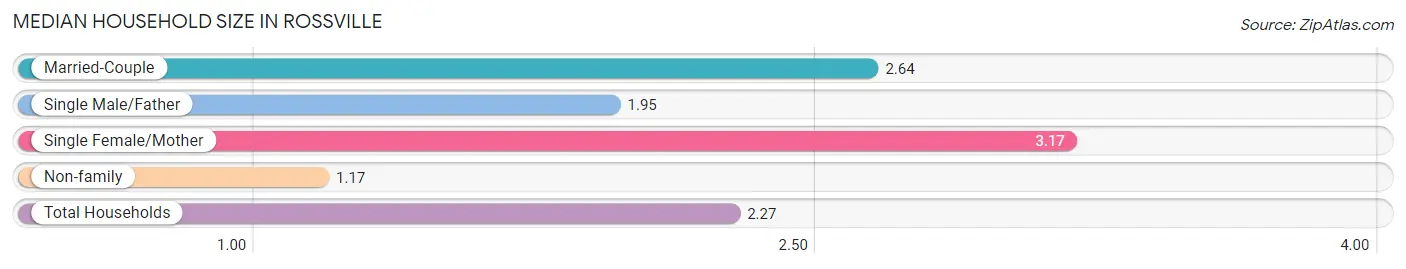
| Household Type | # Households | Household Size |
| Married-Couple | 506 (29.6%) | 2.64 |
| Single Male/Father | 363 (21.2%) | 1.95 |
| Single Female/Mother | 426 (24.9%) | 3.17 |
| Non-family | 417 (24.4%) | 1.17 |
| Total Households | 1,712 (100.0%) | 2.27 |
Household Size by Marriage Status in Rossville
Out of a total of 1,712 households in Rossville, 1,295 (75.6%) are family households, while 417 (24.4%) are nonfamily households. The most numerous type of family households are 2-person households, comprising 766, and the most common type of nonfamily households are 1-person households, comprising 367.
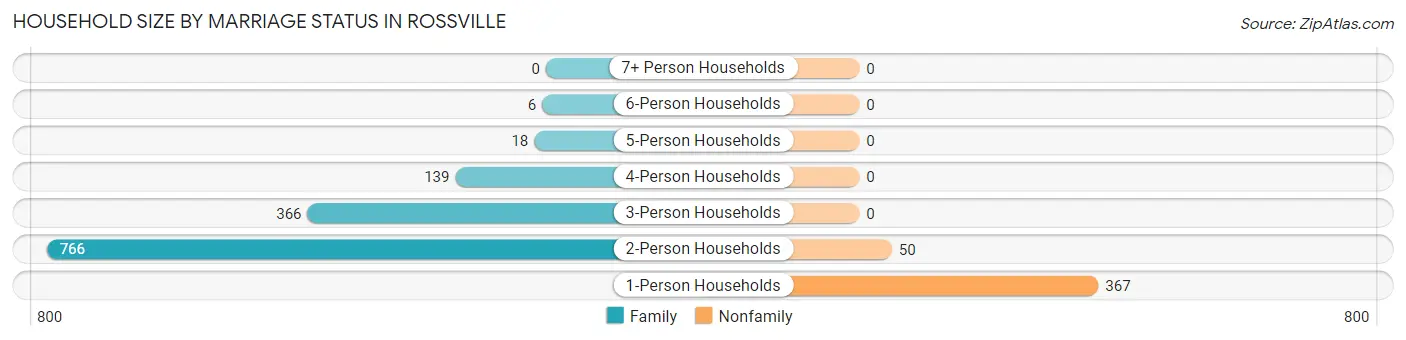
| Household Size | Family Households | Nonfamily Households |
| 1-Person Households | - | 367 (21.4%) |
| 2-Person Households | 766 (44.7%) | 50 (2.9%) |
| 3-Person Households | 366 (21.4%) | 0 (0.0%) |
| 4-Person Households | 139 (8.1%) | 0 (0.0%) |
| 5-Person Households | 18 (1.1%) | 0 (0.0%) |
| 6-Person Households | 6 (0.4%) | 0 (0.0%) |
| 7+ Person Households | 0 (0.0%) | 0 (0.0%) |
| Total | 1,295 (75.6%) | 417 (24.4%) |
Female Fertility in Rossville
Fertility by Age in Rossville
Average fertility rate in Rossville is 10.0 births per 1,000 women. Women in the age bracket of 20 to 34 years have the highest fertility rate with 24.0 births per 1,000 women. Women in the age bracket of 20 to 34 years acount for 100.0% of all women with births.
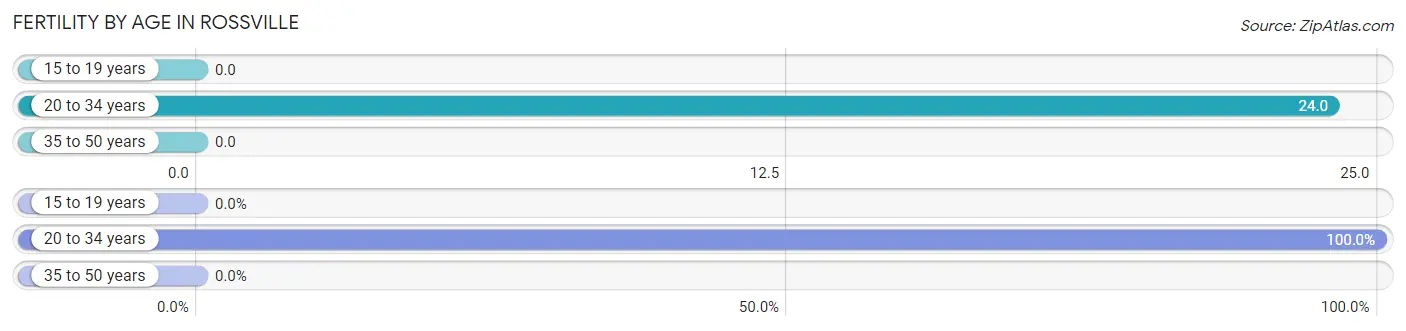
| Age Bracket | Women with Births | Births / 1,000 Women |
| 15 to 19 years | 0 (0.0%) | 0.0 |
| 20 to 34 years | 8 (100.0%) | 24.0 |
| 35 to 50 years | 0 (0.0%) | 0.0 |
| Total | 8 (100.0%) | 10.0 |
Fertility by Age by Marriage Status in Rossville
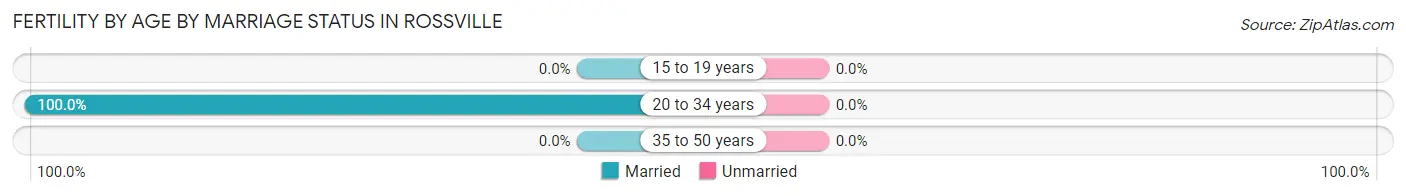
| Age Bracket | Married | Unmarried |
| 15 to 19 years | 0 (0.0%) | 0 (0.0%) |
| 20 to 34 years | 8 (100.0%) | 0 (0.0%) |
| 35 to 50 years | 0 (0.0%) | 0 (0.0%) |
| Total | 8 (100.0%) | 0 (0.0%) |
Fertility by Education in Rossville
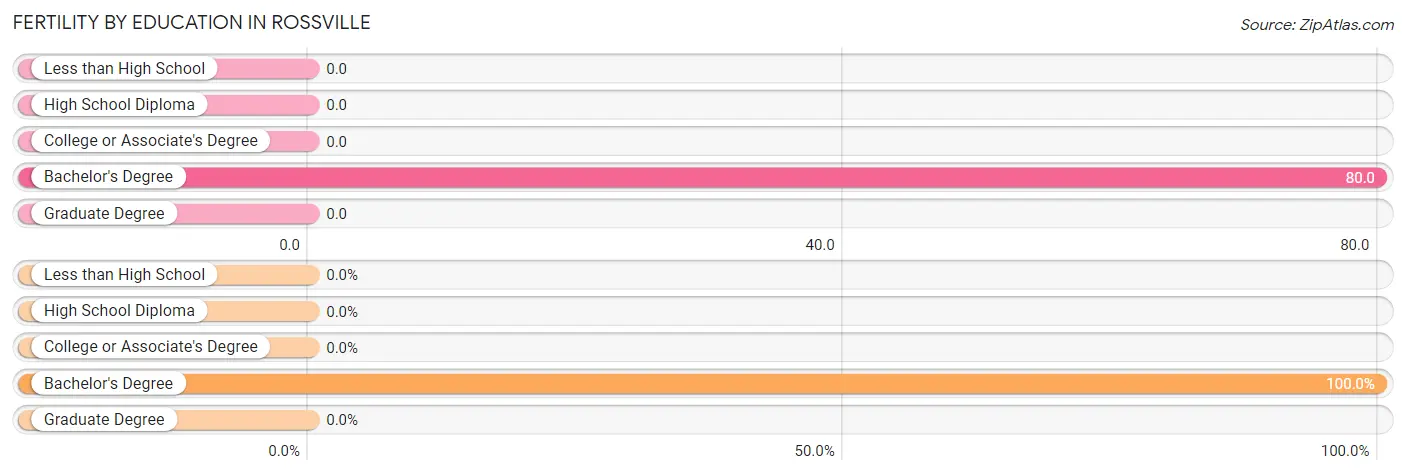
| Educational Attainment | Women with Births | Births / 1,000 Women |
| Less than High School | 0 (0.0%) | 0.0 |
| High School Diploma | 0 (0.0%) | 0.0 |
| College or Associate's Degree | 0 (0.0%) | 0.0 |
| Bachelor's Degree | 8 (100.0%) | 80.0 |
| Graduate Degree | 0 (0.0%) | 0.0 |
| Total | 8 (100.0%) | 10.0 |
Fertility by Education by Marriage Status in Rossville
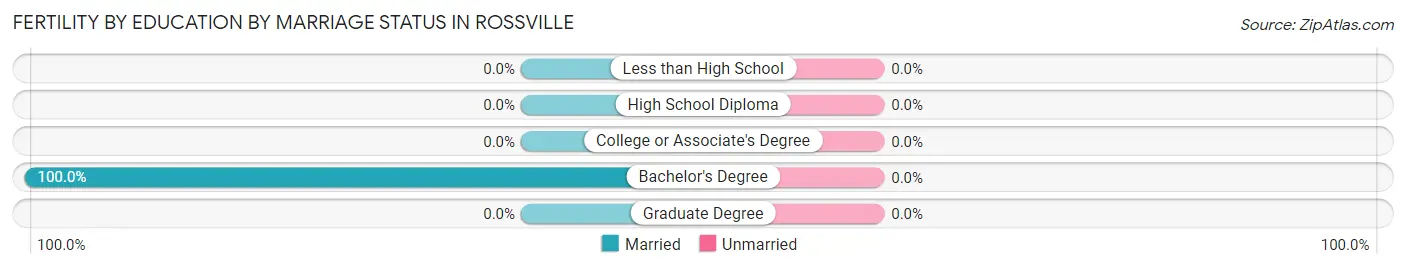
| Educational Attainment | Married | Unmarried |
| Less than High School | 0 (0.0%) | 0 (0.0%) |
| High School Diploma | 0 (0.0%) | 0 (0.0%) |
| College or Associate's Degree | 0 (0.0%) | 0 (0.0%) |
| Bachelor's Degree | 8 (100.0%) | 0 (0.0%) |
| Graduate Degree | 0 (0.0%) | 0 (0.0%) |
| Total | 8 (100.0%) | 0 (0.0%) |
Employment Characteristics in Rossville
Employment by Class of Employer in Rossville
Among the 1,826 employed individuals in Rossville, private company employees (1,556 | 85.2%), self-employed (incorporated) (84 | 4.6%), and self-employed (not incorporated) (78 | 4.3%) make up the most common classes of employment.
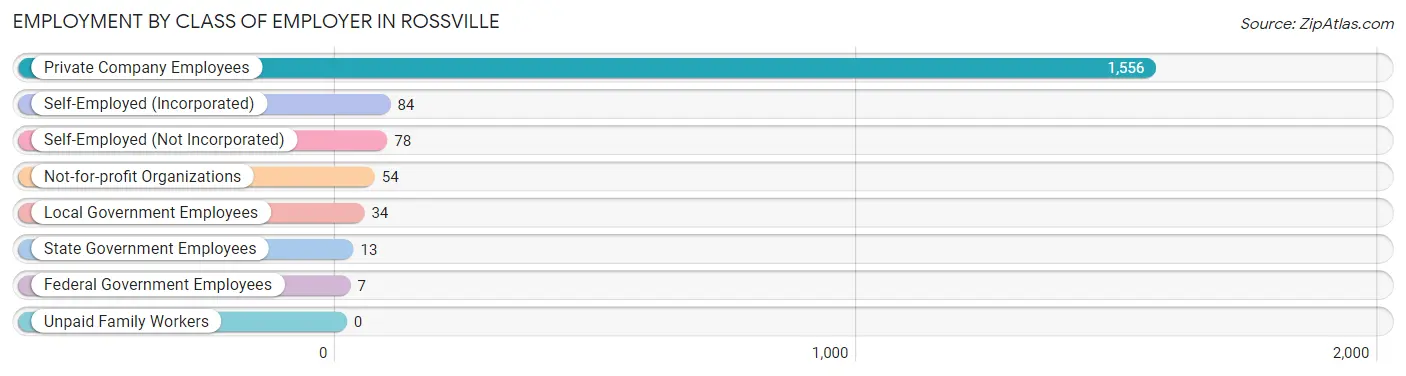
| Employer Class | # Employees | % Employees |
| Private Company Employees | 1,556 | 85.2% |
| Self-Employed (Incorporated) | 84 | 4.6% |
| Self-Employed (Not Incorporated) | 78 | 4.3% |
| Not-for-profit Organizations | 54 | 3.0% |
| Local Government Employees | 34 | 1.9% |
| State Government Employees | 13 | 0.7% |
| Federal Government Employees | 7 | 0.4% |
| Unpaid Family Workers | 0 | 0.0% |
| Total | 1,826 | 100.0% |
Employment Status by Age in Rossville
According to the labor force statistics for Rossville, out of the total population over 16 years of age (3,242), 59.9% or 1,942 individuals are in the labor force, with 5.3% or 103 of them unemployed. The age group with the highest labor force participation rate is 25 to 29 years, with 100.0% or 161 individuals in the labor force. Within the labor force, the 75 years and over age range has the highest percentage of unemployed individuals, with 80.6% or 29 of them being unemployed.
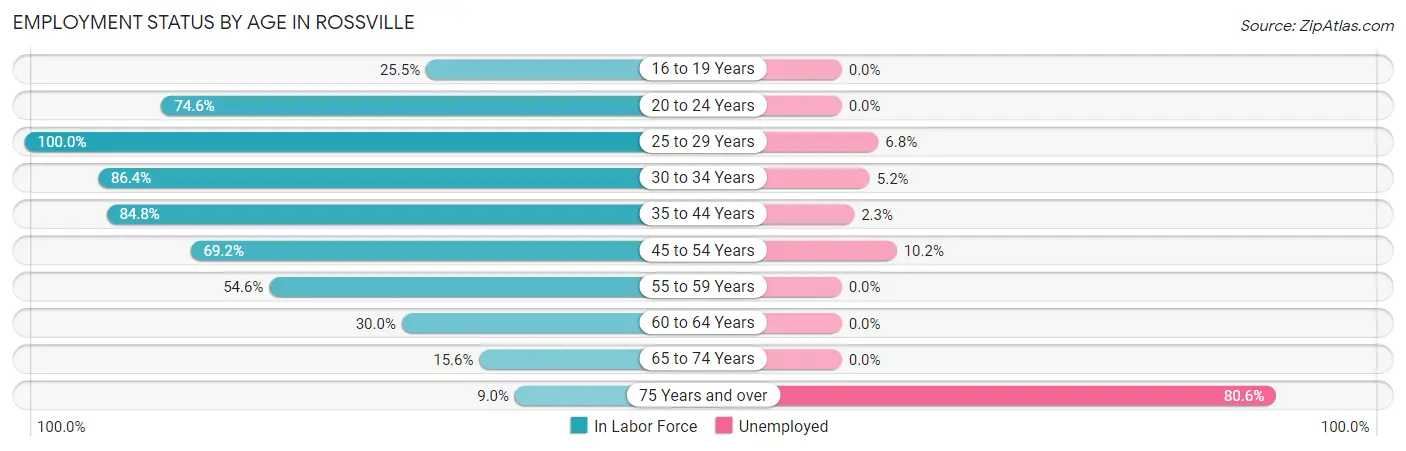
| Age Bracket | In Labor Force | Unemployed |
| 16 to 19 Years | 27 (25.5%) | 0 (0.0%) |
| 20 to 24 Years | 238 (74.6%) | 0 (0.0%) |
| 25 to 29 Years | 161 (100.0%) | 11 (6.8%) |
| 30 to 34 Years | 191 (86.4%) | 10 (5.2%) |
| 35 to 44 Years | 730 (84.8%) | 17 (2.3%) |
| 45 to 54 Years | 353 (69.2%) | 36 (10.2%) |
| 55 to 59 Years | 101 (54.6%) | 0 (0.0%) |
| 60 to 64 Years | 65 (30.0%) | 0 (0.0%) |
| 65 to 74 Years | 41 (15.6%) | 0 (0.0%) |
| 75 Years and over | 36 (9.0%) | 29 (80.6%) |
| Total | 1,942 (59.9%) | 103 (5.3%) |
Employment Status by Educational Attainment in Rossville
According to labor force statistics for Rossville, 74.3% of individuals (1,601) out of the total population between 25 and 64 years of age (2,155) are in the labor force, with 4.6% or 74 of them being unemployed. The group with the highest labor force participation rate are those with the educational attainment of bachelor's degree or higher, with 100.0% or 491 individuals in the labor force. Within the labor force, individuals with high school diploma education have the highest percentage of unemployment, with 8.5% or 36 of them being unemployed.
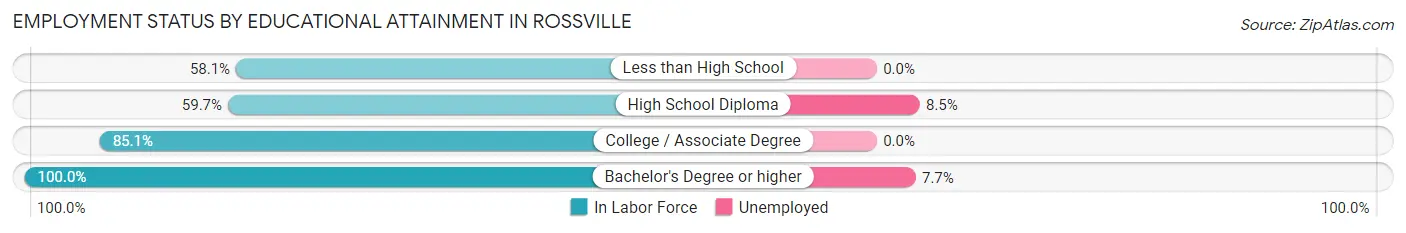
| Educational Attainment | In Labor Force | Unemployed |
| Less than High School | 269 (58.1%) | 0 (0.0%) |
| High School Diploma | 425 (59.7%) | 61 (8.5%) |
| College / Associate Degree | 416 (85.1%) | 0 (0.0%) |
| Bachelor's Degree or higher | 491 (100.0%) | 38 (7.7%) |
| Total | 1,601 (74.3%) | 99 (4.6%) |
Employment Occupations by Sex in Rossville
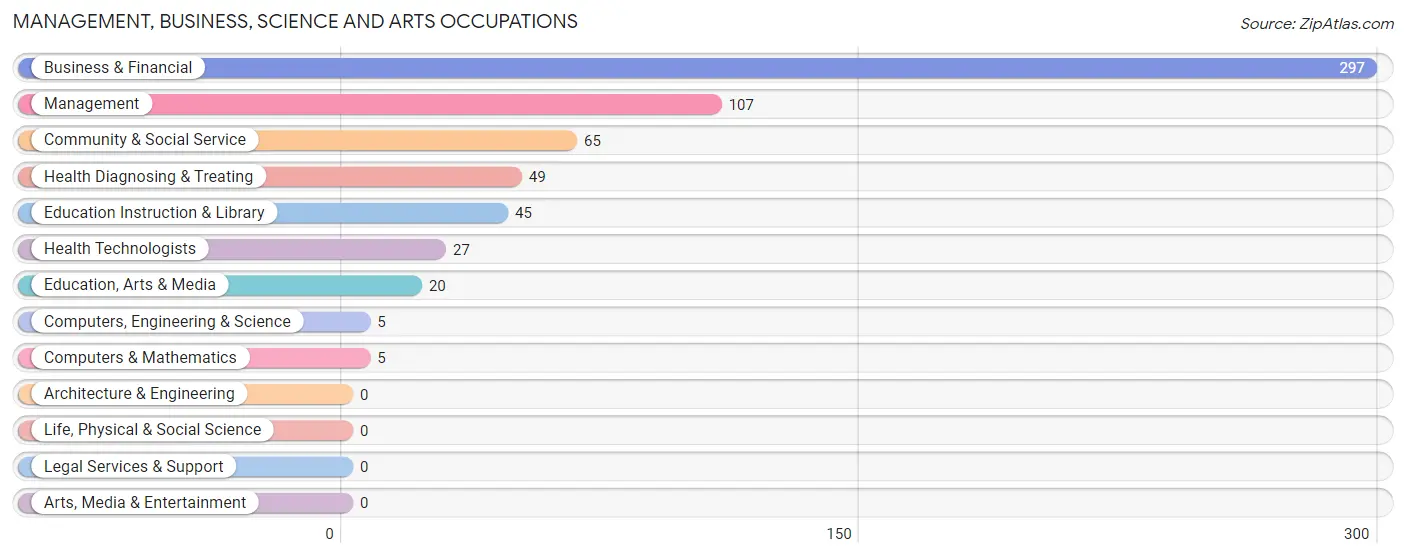
Management, Business, Science and Arts Occupations
The most common Management, Business, Science and Arts occupations in Rossville are Business & Financial (297 | 16.1%), Management (107 | 5.8%), Community & Social Service (65 | 3.5%), Health Diagnosing & Treating (49 | 2.7%), and Education Instruction & Library (45 | 2.5%).
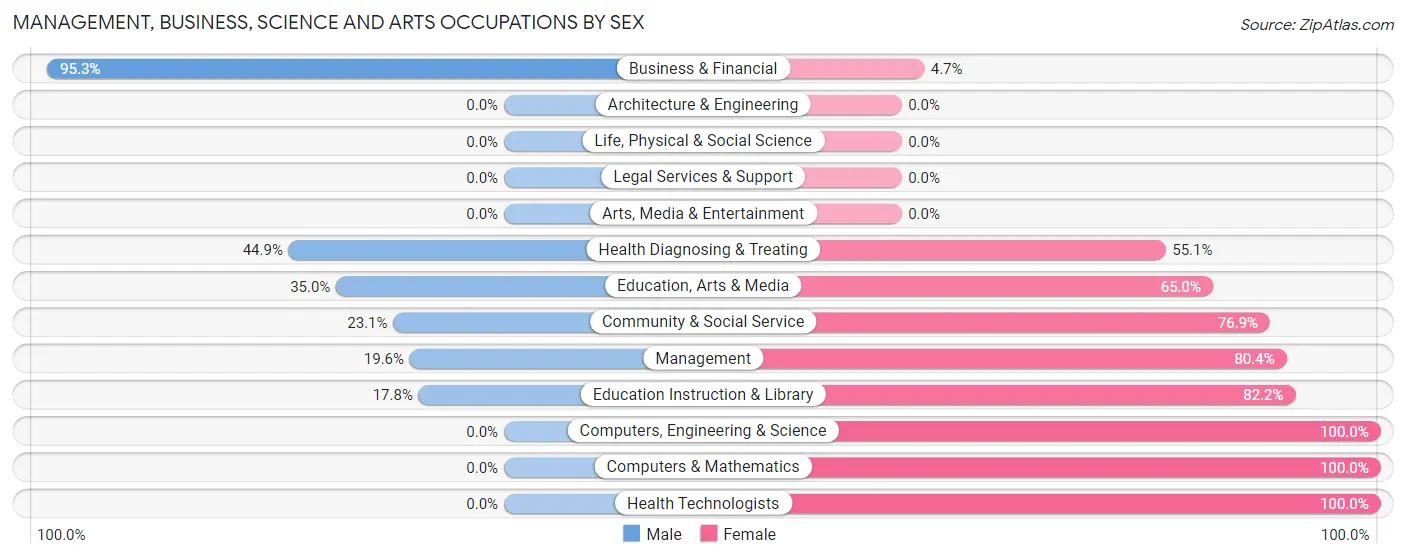
Management, Business, Science and Arts Occupations by Sex
Within the Management, Business, Science and Arts occupations in Rossville, the most male-oriented occupations are Business & Financial (95.3%), Health Diagnosing & Treating (44.9%), and Education, Arts & Media (35.0%), while the most female-oriented occupations are Computers, Engineering & Science (100.0%), Computers & Mathematics (100.0%), and Health Technologists (100.0%).
| Occupation | Male | Female |
| Management | 21 (19.6%) | 86 (80.4%) |
| Business & Financial | 283 (95.3%) | 14 (4.7%) |
| Computers, Engineering & Science | 0 (0.0%) | 5 (100.0%) |
| Computers & Mathematics | 0 (0.0%) | 5 (100.0%) |
| Architecture & Engineering | 0 (0.0%) | 0 (0.0%) |
| Life, Physical & Social Science | 0 (0.0%) | 0 (0.0%) |
| Community & Social Service | 15 (23.1%) | 50 (76.9%) |
| Education, Arts & Media | 7 (35.0%) | 13 (65.0%) |
| Legal Services & Support | 0 (0.0%) | 0 (0.0%) |
| Education Instruction & Library | 8 (17.8%) | 37 (82.2%) |
| Arts, Media & Entertainment | 0 (0.0%) | 0 (0.0%) |
| Health Diagnosing & Treating | 22 (44.9%) | 27 (55.1%) |
| Health Technologists | 0 (0.0%) | 27 (100.0%) |
| Total (Category) | 341 (65.2%) | 182 (34.8%) |
| Total (Overall) | 1,079 (58.6%) | 761 (41.4%) |
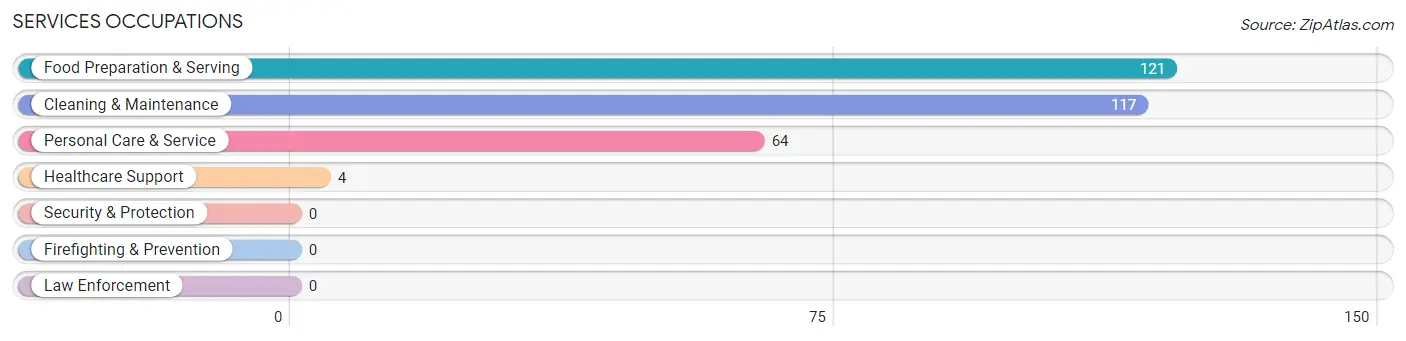
Services Occupations
The most common Services occupations in Rossville are Food Preparation & Serving (121 | 6.6%), Cleaning & Maintenance (117 | 6.4%), Personal Care & Service (64 | 3.5%), and Healthcare Support (4 | 0.2%).
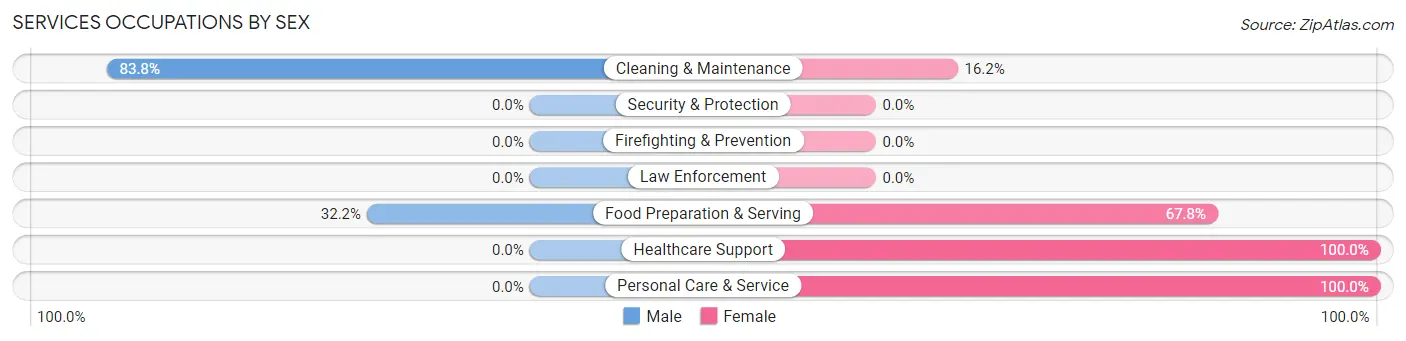
Services Occupations by Sex
Within the Services occupations in Rossville, the most male-oriented occupations are Cleaning & Maintenance (83.8%), and Food Preparation & Serving (32.2%), while the most female-oriented occupations are Healthcare Support (100.0%), Personal Care & Service (100.0%), and Food Preparation & Serving (67.8%).
| Occupation | Male | Female |
| Healthcare Support | 0 (0.0%) | 4 (100.0%) |
| Security & Protection | 0 (0.0%) | 0 (0.0%) |
| Firefighting & Prevention | 0 (0.0%) | 0 (0.0%) |
| Law Enforcement | 0 (0.0%) | 0 (0.0%) |
| Food Preparation & Serving | 39 (32.2%) | 82 (67.8%) |
| Cleaning & Maintenance | 98 (83.8%) | 19 (16.2%) |
| Personal Care & Service | 0 (0.0%) | 64 (100.0%) |
| Total (Category) | 137 (44.8%) | 169 (55.2%) |
| Total (Overall) | 1,079 (58.6%) | 761 (41.4%) |
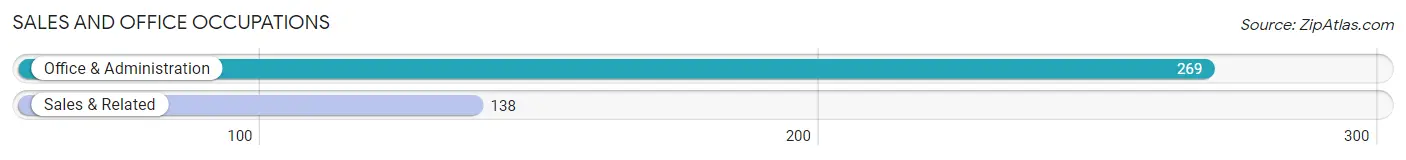
Sales and Office Occupations
The most common Sales and Office occupations in Rossville are Office & Administration (269 | 14.6%), and Sales & Related (138 | 7.5%).
Sales and Office Occupations by Sex
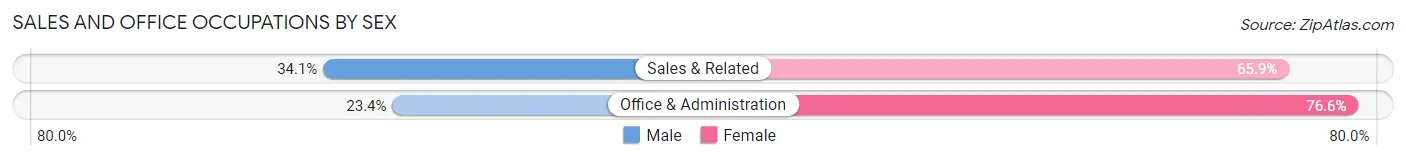
| Occupation | Male | Female |
| Sales & Related | 47 (34.1%) | 91 (65.9%) |
| Office & Administration | 63 (23.4%) | 206 (76.6%) |
| Total (Category) | 110 (27.0%) | 297 (73.0%) |
| Total (Overall) | 1,079 (58.6%) | 761 (41.4%) |
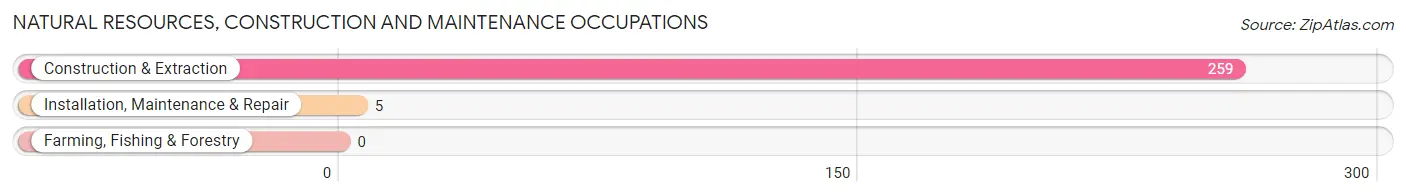
Natural Resources, Construction and Maintenance Occupations
The most common Natural Resources, Construction and Maintenance occupations in Rossville are Construction & Extraction (259 | 14.1%), and Installation, Maintenance & Repair (5 | 0.3%).
Natural Resources, Construction and Maintenance Occupations by Sex
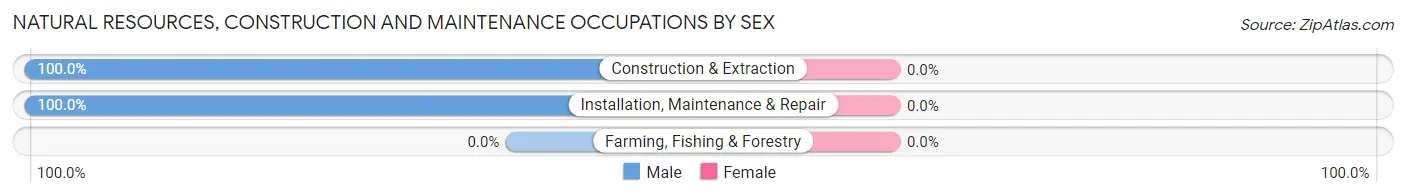
| Occupation | Male | Female |
| Farming, Fishing & Forestry | 0 (0.0%) | 0 (0.0%) |
| Construction & Extraction | 259 (100.0%) | 0 (0.0%) |
| Installation, Maintenance & Repair | 5 (100.0%) | 0 (0.0%) |
| Total (Category) | 264 (100.0%) | 0 (0.0%) |
| Total (Overall) | 1,079 (58.6%) | 761 (41.4%) |
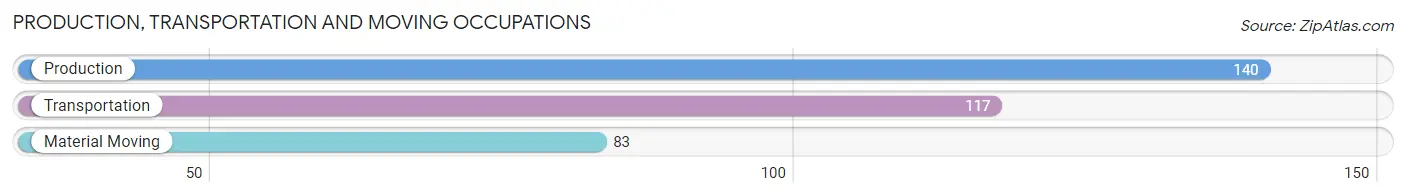
Production, Transportation and Moving Occupations
The most common Production, Transportation and Moving occupations in Rossville are Production (140 | 7.6%), Transportation (117 | 6.4%), and Material Moving (83 | 4.5%).
Production, Transportation and Moving Occupations by Sex
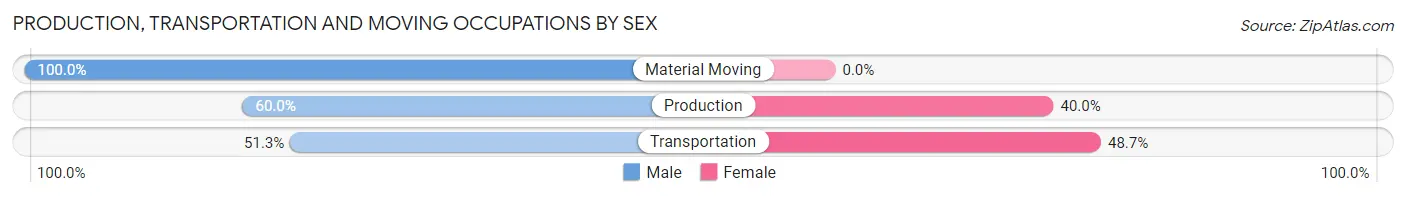
| Occupation | Male | Female |
| Production | 84 (60.0%) | 56 (40.0%) |
| Transportation | 60 (51.3%) | 57 (48.7%) |
| Material Moving | 83 (100.0%) | 0 (0.0%) |
| Total (Category) | 227 (66.8%) | 113 (33.2%) |
| Total (Overall) | 1,079 (58.6%) | 761 (41.4%) |
Employment Industries by Sex in Rossville
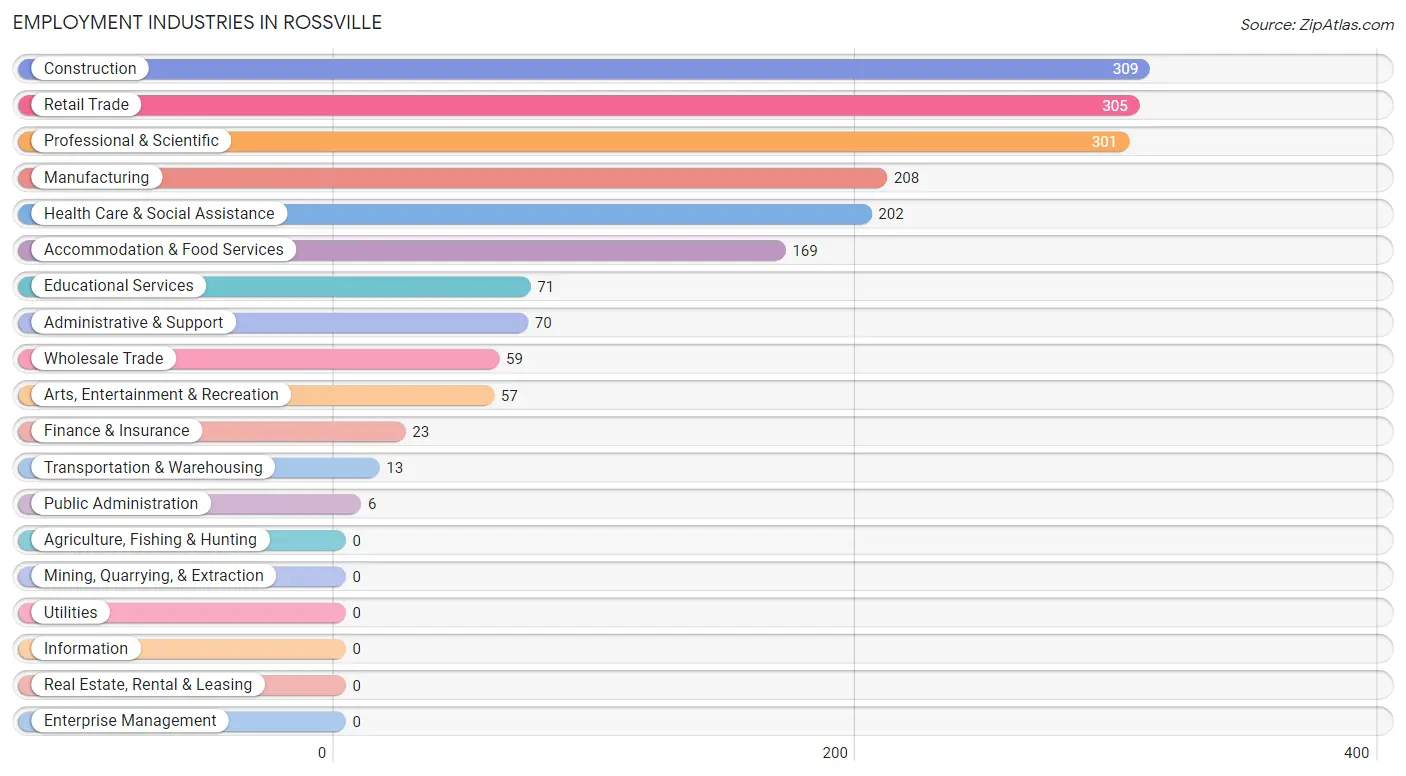
Employment Industries in Rossville
The major employment industries in Rossville include Construction (309 | 16.8%), Retail Trade (305 | 16.6%), Professional & Scientific (301 | 16.4%), Manufacturing (208 | 11.3%), and Health Care & Social Assistance (202 | 11.0%).
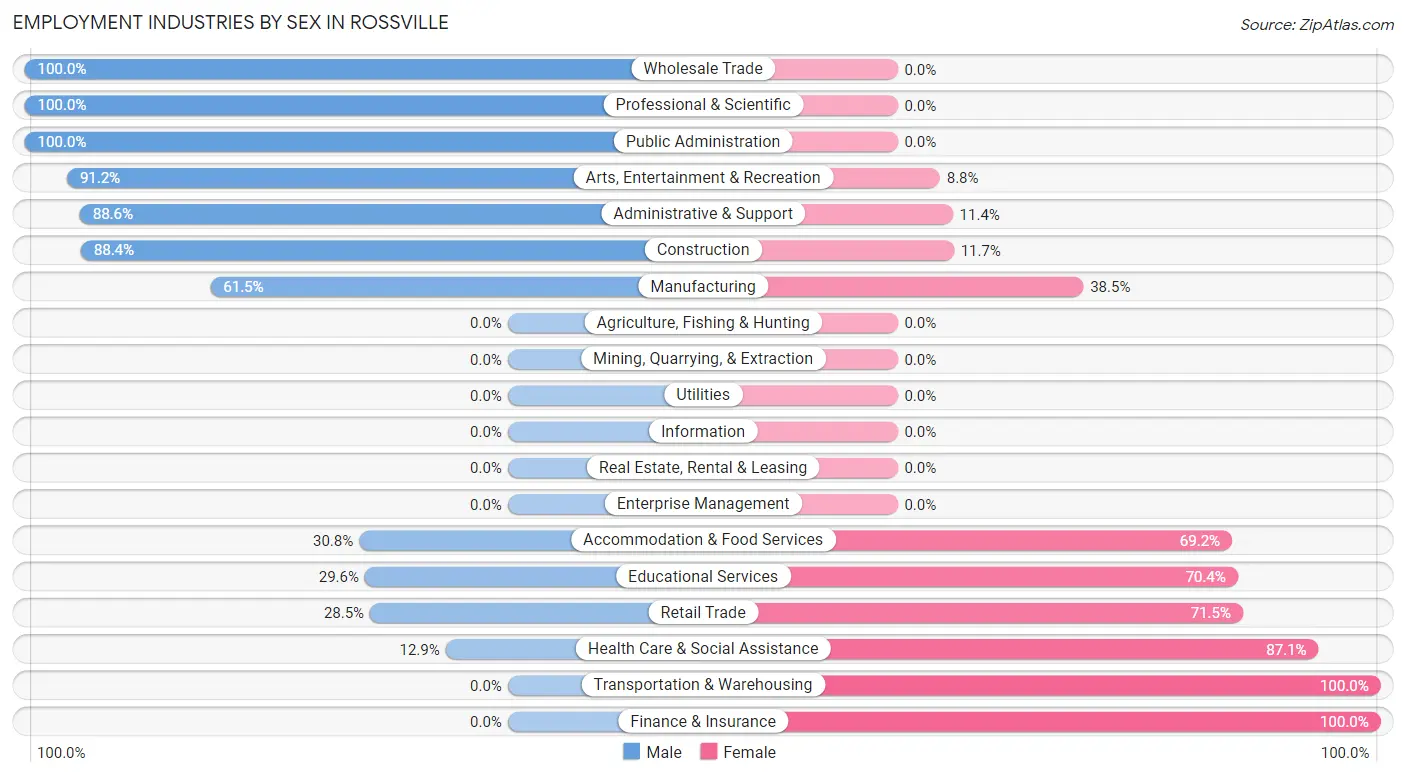
Employment Industries by Sex in Rossville
The Rossville industries that see more men than women are Wholesale Trade (100.0%), Professional & Scientific (100.0%), and Public Administration (100.0%), whereas the industries that tend to have a higher number of women are Transportation & Warehousing (100.0%), Finance & Insurance (100.0%), and Health Care & Social Assistance (87.1%).
| Industry | Male | Female |
| Agriculture, Fishing & Hunting | 0 (0.0%) | 0 (0.0%) |
| Mining, Quarrying, & Extraction | 0 (0.0%) | 0 (0.0%) |
| Construction | 273 (88.3%) | 36 (11.7%) |
| Manufacturing | 128 (61.5%) | 80 (38.5%) |
| Wholesale Trade | 59 (100.0%) | 0 (0.0%) |
| Retail Trade | 87 (28.5%) | 218 (71.5%) |
| Transportation & Warehousing | 0 (0.0%) | 13 (100.0%) |
| Utilities | 0 (0.0%) | 0 (0.0%) |
| Information | 0 (0.0%) | 0 (0.0%) |
| Finance & Insurance | 0 (0.0%) | 23 (100.0%) |
| Real Estate, Rental & Leasing | 0 (0.0%) | 0 (0.0%) |
| Professional & Scientific | 301 (100.0%) | 0 (0.0%) |
| Enterprise Management | 0 (0.0%) | 0 (0.0%) |
| Administrative & Support | 62 (88.6%) | 8 (11.4%) |
| Educational Services | 21 (29.6%) | 50 (70.4%) |
| Health Care & Social Assistance | 26 (12.9%) | 176 (87.1%) |
| Arts, Entertainment & Recreation | 52 (91.2%) | 5 (8.8%) |
| Accommodation & Food Services | 52 (30.8%) | 117 (69.2%) |
| Public Administration | 6 (100.0%) | 0 (0.0%) |
| Total | 1,079 (58.6%) | 761 (41.4%) |
Education in Rossville
School Enrollment in Rossville
The most common levels of schooling among the 1,102 students in Rossville are middle school (310 | 28.1%), graduate / professional (286 | 26.0%), and elementary school (181 | 16.4%).
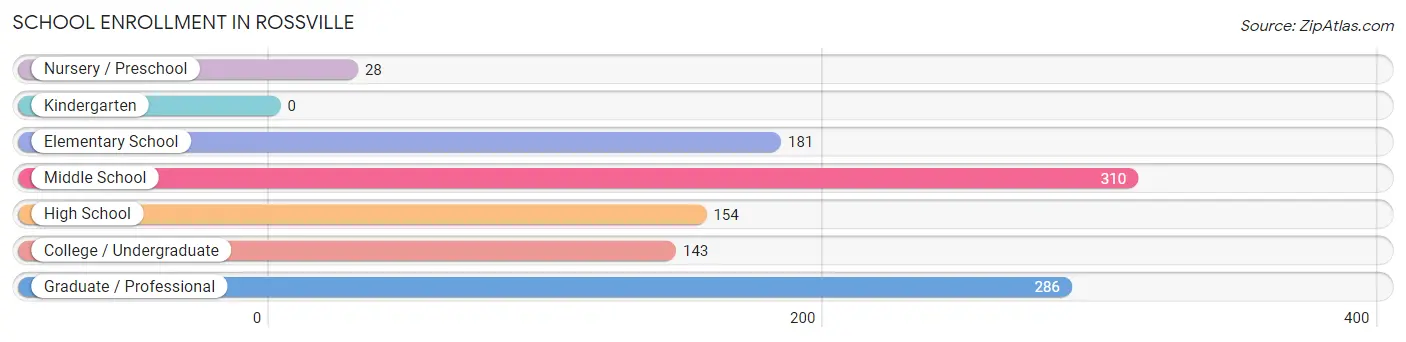
| School Level | # Students | % Students |
| Nursery / Preschool | 28 | 2.5% |
| Kindergarten | 0 | 0.0% |
| Elementary School | 181 | 16.4% |
| Middle School | 310 | 28.1% |
| High School | 154 | 14.0% |
| College / Undergraduate | 143 | 13.0% |
| Graduate / Professional | 286 | 26.0% |
| Total | 1,102 | 100.0% |
School Enrollment by Age by Funding Source in Rossville
Out of a total of 1,102 students who are enrolled in schools in Rossville, 22 (2.0%) attend a private institution, while the remaining 1,080 (98.0%) are enrolled in public schools. The age group of 25 to 34 year olds has the highest likelihood of being enrolled in private schools, with 8 (100.0% in the age bracket) enrolled. Conversely, the age group of 3 to 4 year olds has the lowest likelihood of being enrolled in a private school, with 28 (100.0% in the age bracket) attending a public institution.
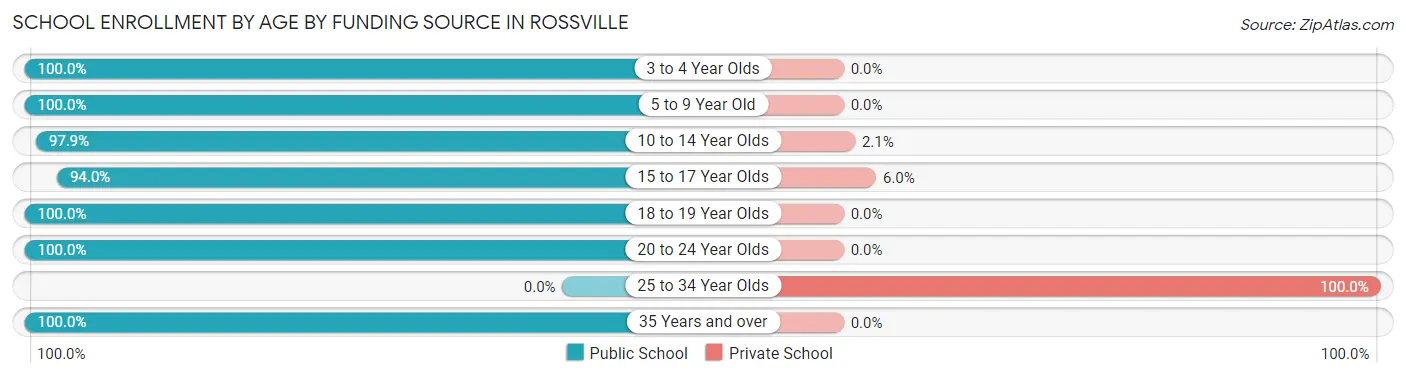
| Age Bracket | Public School | Private School |
| 3 to 4 Year Olds | 28 (100.0%) | 0 (0.0%) |
| 5 to 9 Year Old | 171 (100.0%) | 0 (0.0%) |
| 10 to 14 Year Olds | 325 (97.9%) | 7 (2.1%) |
| 15 to 17 Year Olds | 109 (94.0%) | 7 (6.0%) |
| 18 to 19 Year Olds | 26 (100.0%) | 0 (0.0%) |
| 20 to 24 Year Olds | 128 (100.0%) | 0 (0.0%) |
| 25 to 34 Year Olds | 0 (0.0%) | 8 (100.0%) |
| 35 Years and over | 293 (100.0%) | 0 (0.0%) |
| Total | 1,080 (98.0%) | 22 (2.0%) |
Educational Attainment by Field of Study in Rossville
Liberal arts & history (278 | 46.9%), business (159 | 26.8%), education (55 | 9.3%), psychology (41 | 6.9%), and computers & mathematics (13 | 2.2%) are the most common fields of study among 593 individuals in Rossville who have obtained a bachelor's degree or higher.
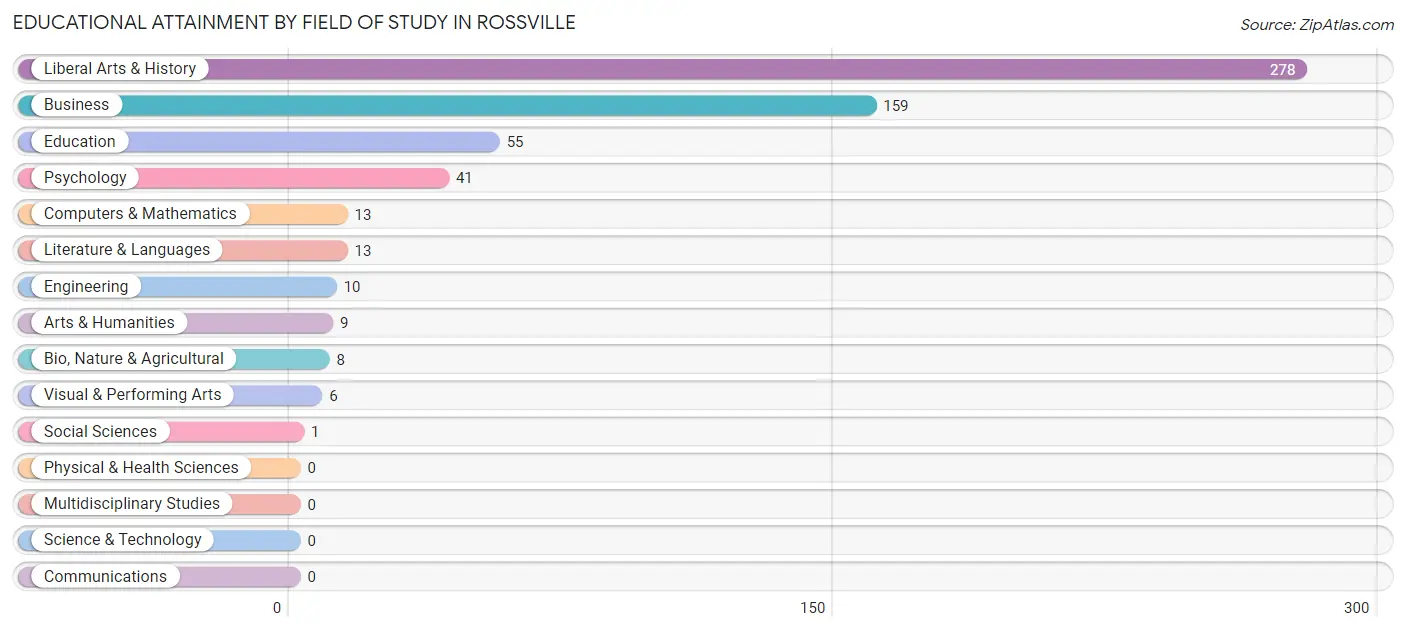
| Field of Study | # Graduates | % Graduates |
| Computers & Mathematics | 13 | 2.2% |
| Bio, Nature & Agricultural | 8 | 1.3% |
| Physical & Health Sciences | 0 | 0.0% |
| Psychology | 41 | 6.9% |
| Social Sciences | 1 | 0.2% |
| Engineering | 10 | 1.7% |
| Multidisciplinary Studies | 0 | 0.0% |
| Science & Technology | 0 | 0.0% |
| Business | 159 | 26.8% |
| Education | 55 | 9.3% |
| Literature & Languages | 13 | 2.2% |
| Liberal Arts & History | 278 | 46.9% |
| Visual & Performing Arts | 6 | 1.0% |
| Communications | 0 | 0.0% |
| Arts & Humanities | 9 | 1.5% |
| Total | 593 | 100.0% |
Transportation & Commute in Rossville
Vehicle Availability by Sex in Rossville
The most prevalent vehicle ownership categories in Rossville are males with 1 vehicle (453, accounting for 42.2%) and females with 1 vehicle (210, making up 60.2%).
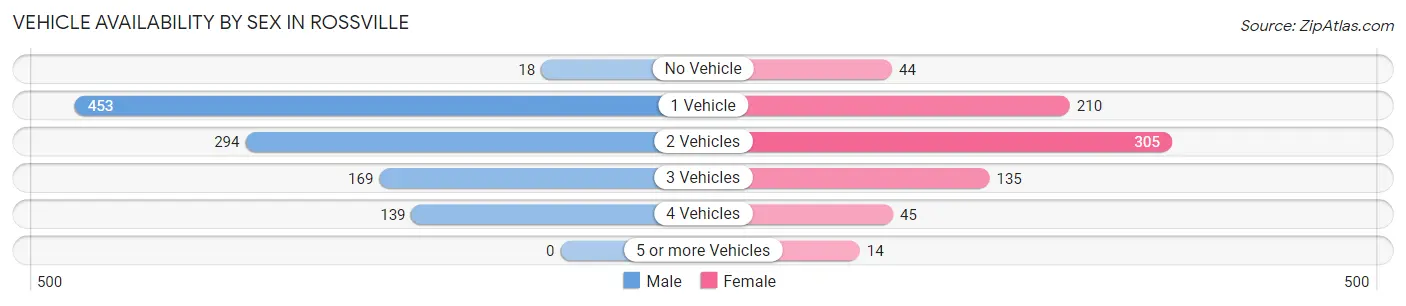
| Vehicles Available | Male | Female |
| No Vehicle | 18 (1.7%) | 44 (5.8%) |
| 1 Vehicle | 453 (42.2%) | 210 (27.9%) |
| 2 Vehicles | 294 (27.4%) | 305 (40.5%) |
| 3 Vehicles | 169 (15.8%) | 135 (17.9%) |
| 4 Vehicles | 139 (13.0%) | 45 (6.0%) |
| 5 or more Vehicles | 0 (0.0%) | 14 (1.9%) |
| Total | 1,073 (100.0%) | 753 (100.0%) |
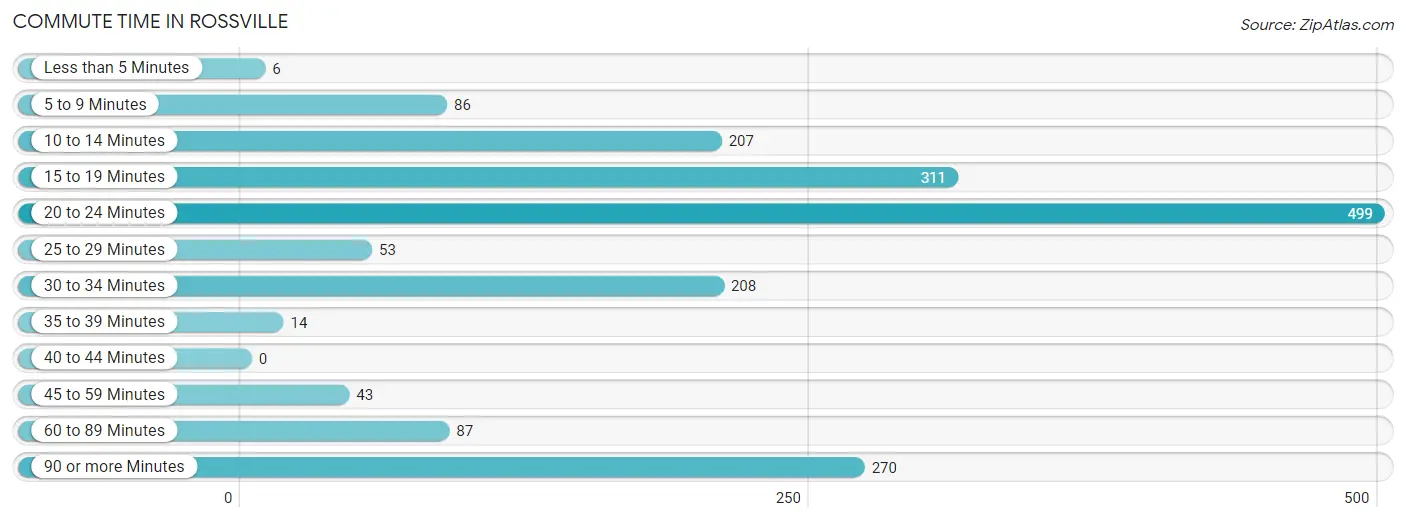
Commute Time in Rossville
The most frequently occuring commute durations in Rossville are 20 to 24 minutes (499 commuters, 28.0%), 15 to 19 minutes (311 commuters, 17.4%), and 90 or more minutes (270 commuters, 15.1%).
| Commute Time | # Commuters | % Commuters |
| Less than 5 Minutes | 6 | 0.3% |
| 5 to 9 Minutes | 86 | 4.8% |
| 10 to 14 Minutes | 207 | 11.6% |
| 15 to 19 Minutes | 311 | 17.4% |
| 20 to 24 Minutes | 499 | 28.0% |
| 25 to 29 Minutes | 53 | 3.0% |
| 30 to 34 Minutes | 208 | 11.7% |
| 35 to 39 Minutes | 14 | 0.8% |
| 40 to 44 Minutes | 0 | 0.0% |
| 45 to 59 Minutes | 43 | 2.4% |
| 60 to 89 Minutes | 87 | 4.9% |
| 90 or more Minutes | 270 | 15.1% |
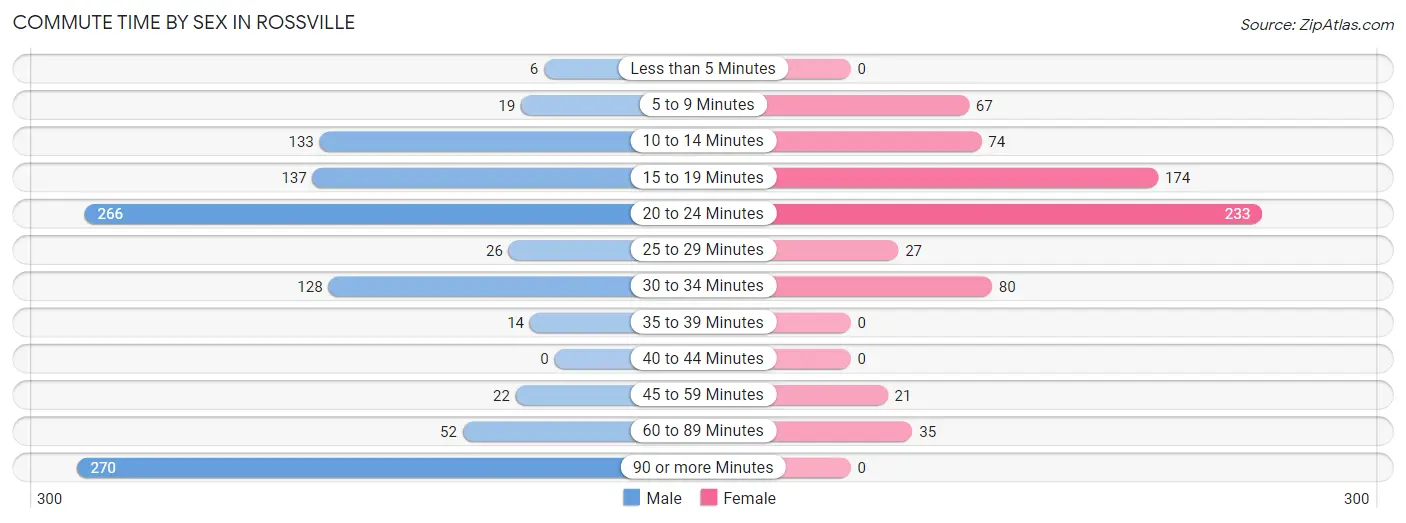
Commute Time by Sex in Rossville
The most common commute times in Rossville are 90 or more minutes (270 commuters, 25.2%) for males and 20 to 24 minutes (233 commuters, 32.8%) for females.
| Commute Time | Male | Female |
| Less than 5 Minutes | 6 (0.6%) | 0 (0.0%) |
| 5 to 9 Minutes | 19 (1.8%) | 67 (9.4%) |
| 10 to 14 Minutes | 133 (12.4%) | 74 (10.4%) |
| 15 to 19 Minutes | 137 (12.8%) | 174 (24.5%) |
| 20 to 24 Minutes | 266 (24.8%) | 233 (32.8%) |
| 25 to 29 Minutes | 26 (2.4%) | 27 (3.8%) |
| 30 to 34 Minutes | 128 (11.9%) | 80 (11.3%) |
| 35 to 39 Minutes | 14 (1.3%) | 0 (0.0%) |
| 40 to 44 Minutes | 0 (0.0%) | 0 (0.0%) |
| 45 to 59 Minutes | 22 (2.1%) | 21 (2.9%) |
| 60 to 89 Minutes | 52 (4.9%) | 35 (4.9%) |
| 90 or more Minutes | 270 (25.2%) | 0 (0.0%) |
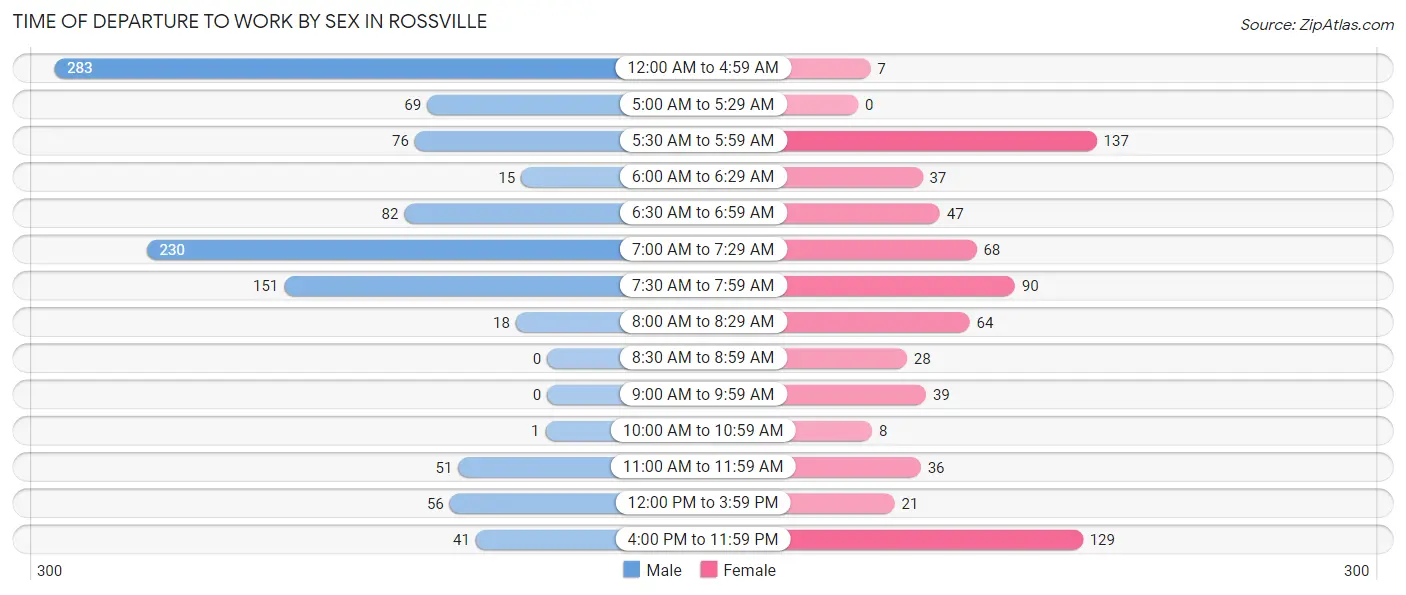
Time of Departure to Work by Sex in Rossville
The most frequent times of departure to work in Rossville are 12:00 AM to 4:59 AM (283, 26.4%) for males and 5:30 AM to 5:59 AM (137, 19.3%) for females.
| Time of Departure | Male | Female |
| 12:00 AM to 4:59 AM | 283 (26.4%) | 7 (1.0%) |
| 5:00 AM to 5:29 AM | 69 (6.4%) | 0 (0.0%) |
| 5:30 AM to 5:59 AM | 76 (7.1%) | 137 (19.3%) |
| 6:00 AM to 6:29 AM | 15 (1.4%) | 37 (5.2%) |
| 6:30 AM to 6:59 AM | 82 (7.6%) | 47 (6.6%) |
| 7:00 AM to 7:29 AM | 230 (21.4%) | 68 (9.6%) |
| 7:30 AM to 7:59 AM | 151 (14.1%) | 90 (12.7%) |
| 8:00 AM to 8:29 AM | 18 (1.7%) | 64 (9.0%) |
| 8:30 AM to 8:59 AM | 0 (0.0%) | 28 (3.9%) |
| 9:00 AM to 9:59 AM | 0 (0.0%) | 39 (5.5%) |
| 10:00 AM to 10:59 AM | 1 (0.1%) | 8 (1.1%) |
| 11:00 AM to 11:59 AM | 51 (4.8%) | 36 (5.1%) |
| 12:00 PM to 3:59 PM | 56 (5.2%) | 21 (2.9%) |
| 4:00 PM to 11:59 PM | 41 (3.8%) | 129 (18.1%) |
| Total | 1,073 (100.0%) | 711 (100.0%) |
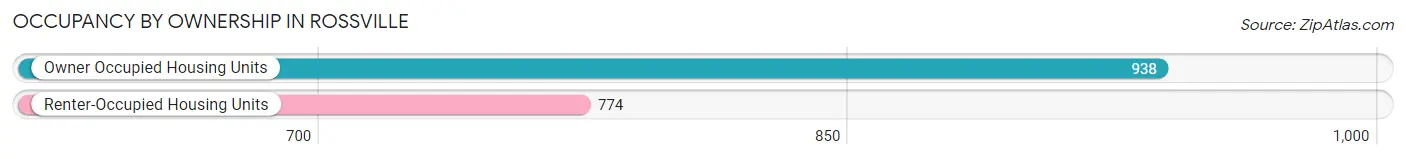
Housing Occupancy in Rossville
Occupancy by Ownership in Rossville
Of the total 1,712 dwellings in Rossville, owner-occupied units account for 938 (54.8%), while renter-occupied units make up 774 (45.2%).
| Occupancy | # Housing Units | % Housing Units |
| Owner Occupied Housing Units | 938 | 54.8% |
| Renter-Occupied Housing Units | 774 | 45.2% |
| Total Occupied Housing Units | 1,712 | 100.0% |
Occupancy by Household Size in Rossville
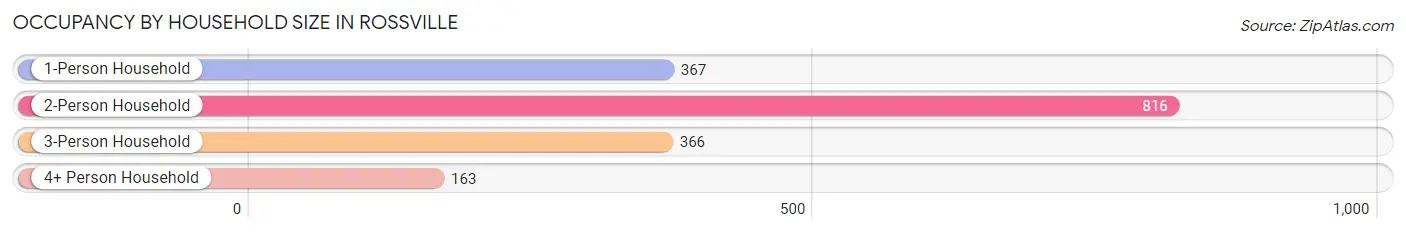
| Household Size | # Housing Units | % Housing Units |
| 1-Person Household | 367 | 21.4% |
| 2-Person Household | 816 | 47.7% |
| 3-Person Household | 366 | 21.4% |
| 4+ Person Household | 163 | 9.5% |
| Total Housing Units | 1,712 | 100.0% |
Occupancy by Ownership by Household Size in Rossville
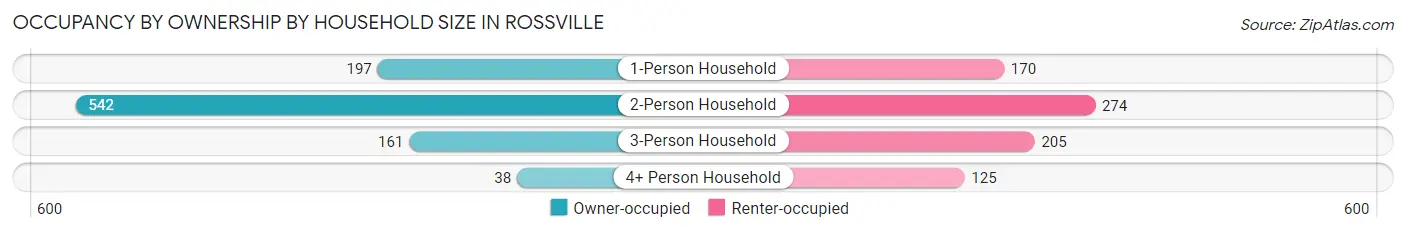
| Household Size | Owner-occupied | Renter-occupied |
| 1-Person Household | 197 (53.7%) | 170 (46.3%) |
| 2-Person Household | 542 (66.4%) | 274 (33.6%) |
| 3-Person Household | 161 (44.0%) | 205 (56.0%) |
| 4+ Person Household | 38 (23.3%) | 125 (76.7%) |
| Total Housing Units | 938 (54.8%) | 774 (45.2%) |
Occupancy by Educational Attainment in Rossville
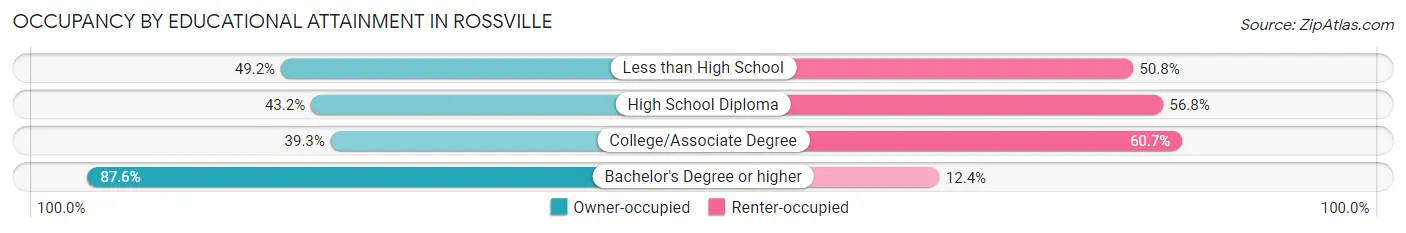
| Household Size | Owner-occupied | Renter-occupied |
| Less than High School | 181 (49.2%) | 187 (50.8%) |
| High School Diploma | 169 (43.2%) | 222 (56.8%) |
| College/Associate Degree | 201 (39.3%) | 310 (60.7%) |
| Bachelor's Degree or higher | 387 (87.6%) | 55 (12.4%) |
Occupancy by Age of Householder in Rossville
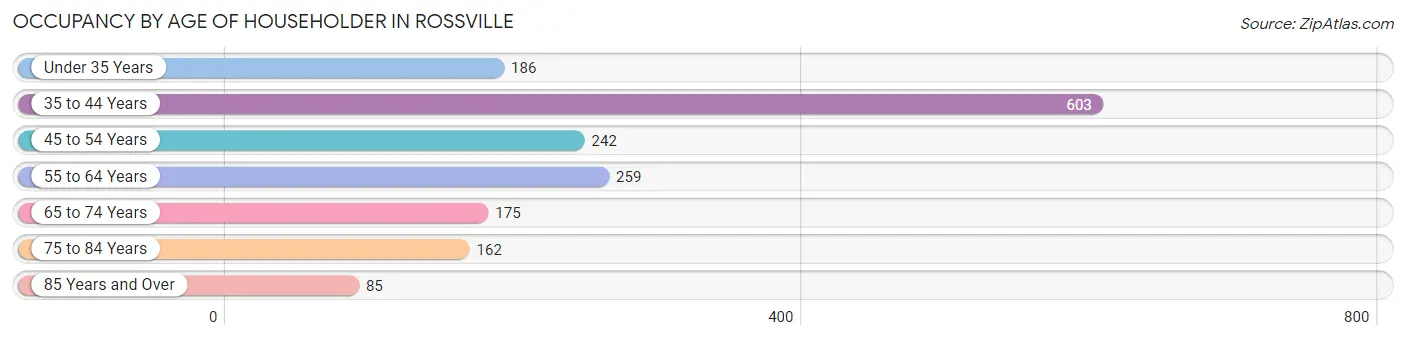
| Age Bracket | # Households | % Households |
| Under 35 Years | 186 | 10.9% |
| 35 to 44 Years | 603 | 35.2% |
| 45 to 54 Years | 242 | 14.1% |
| 55 to 64 Years | 259 | 15.1% |
| 65 to 74 Years | 175 | 10.2% |
| 75 to 84 Years | 162 | 9.5% |
| 85 Years and Over | 85 | 5.0% |
| Total | 1,712 | 100.0% |
Housing Finances in Rossville
Median Income by Occupancy in Rossville
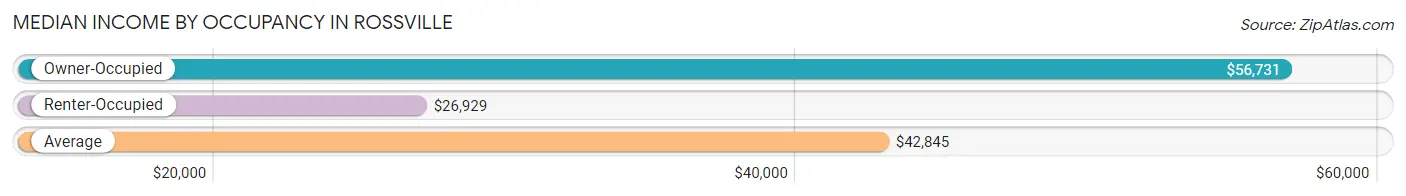
| Occupancy Type | # Households | Median Income |
| Owner-Occupied | 938 (54.8%) | $56,731 |
| Renter-Occupied | 774 (45.2%) | $26,929 |
| Average | 1,712 (100.0%) | $42,845 |
Occupancy by Householder Income Bracket in Rossville
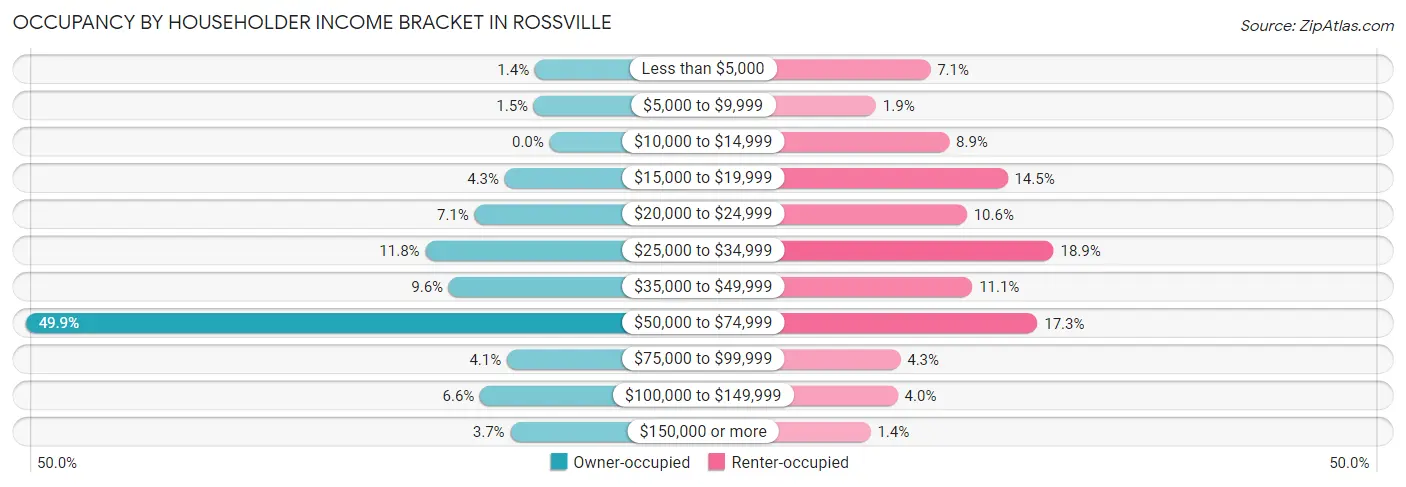
| Income Bracket | Owner-occupied | Renter-occupied |
| Less than $5,000 | 13 (1.4%) | 55 (7.1%) |
| $5,000 to $9,999 | 14 (1.5%) | 15 (1.9%) |
| $10,000 to $14,999 | 0 (0.0%) | 69 (8.9%) |
| $15,000 to $19,999 | 40 (4.3%) | 112 (14.5%) |
| $20,000 to $24,999 | 67 (7.1%) | 82 (10.6%) |
| $25,000 to $34,999 | 111 (11.8%) | 146 (18.9%) |
| $35,000 to $49,999 | 90 (9.6%) | 86 (11.1%) |
| $50,000 to $74,999 | 468 (49.9%) | 134 (17.3%) |
| $75,000 to $99,999 | 38 (4.1%) | 33 (4.3%) |
| $100,000 to $149,999 | 62 (6.6%) | 31 (4.0%) |
| $150,000 or more | 35 (3.7%) | 11 (1.4%) |
| Total | 938 (100.0%) | 774 (100.0%) |
Monthly Housing Cost Tiers in Rossville
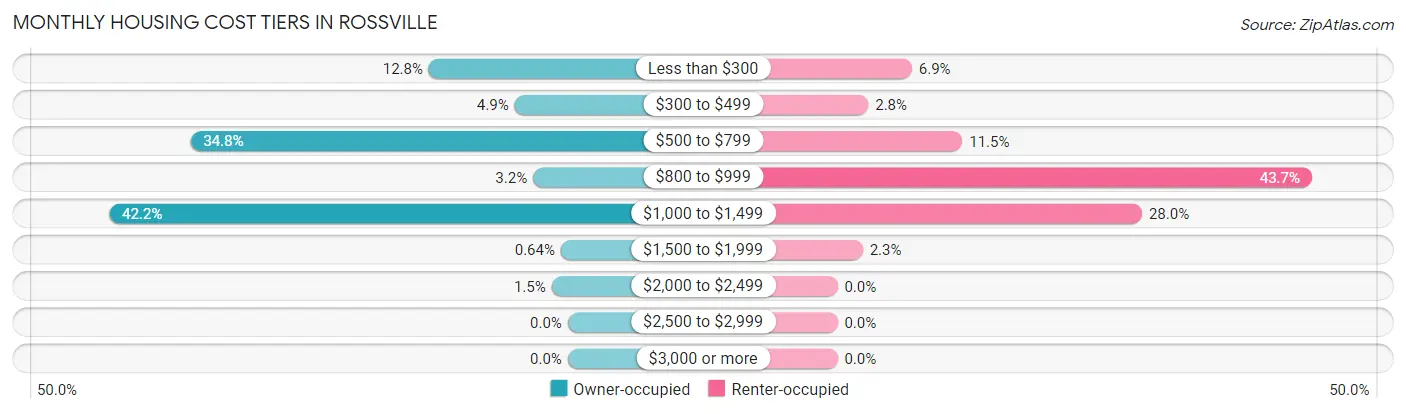
| Monthly Cost | Owner-occupied | Renter-occupied |
| Less than $300 | 120 (12.8%) | 53 (6.9%) |
| $300 to $499 | 46 (4.9%) | 22 (2.8%) |
| $500 to $799 | 326 (34.7%) | 89 (11.5%) |
| $800 to $999 | 30 (3.2%) | 338 (43.7%) |
| $1,000 to $1,499 | 396 (42.2%) | 217 (28.0%) |
| $1,500 to $1,999 | 6 (0.6%) | 18 (2.3%) |
| $2,000 to $2,499 | 14 (1.5%) | 0 (0.0%) |
| $2,500 to $2,999 | 0 (0.0%) | 0 (0.0%) |
| $3,000 or more | 0 (0.0%) | 0 (0.0%) |
| Total | 938 (100.0%) | 774 (100.0%) |
Physical Housing Characteristics in Rossville
Housing Structures in Rossville
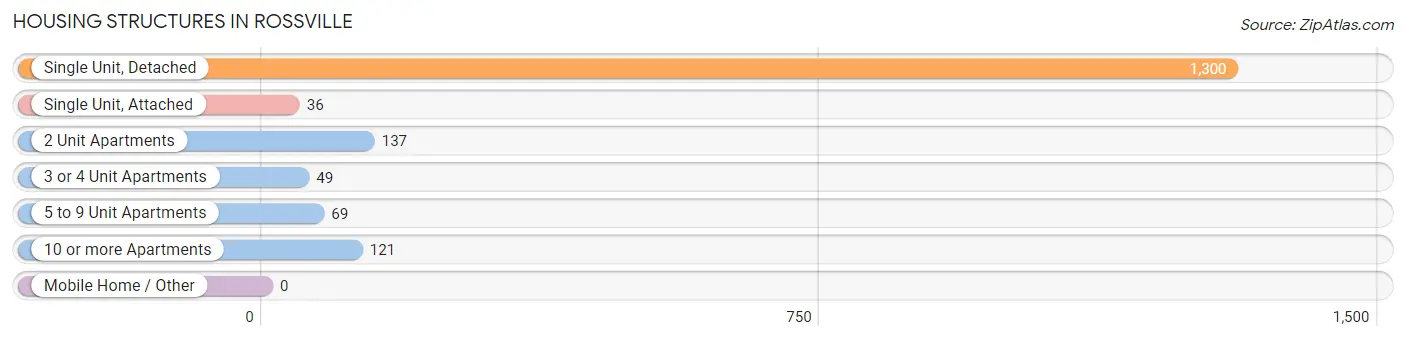
| Structure Type | # Housing Units | % Housing Units |
| Single Unit, Detached | 1,300 | 75.9% |
| Single Unit, Attached | 36 | 2.1% |
| 2 Unit Apartments | 137 | 8.0% |
| 3 or 4 Unit Apartments | 49 | 2.9% |
| 5 to 9 Unit Apartments | 69 | 4.0% |
| 10 or more Apartments | 121 | 7.1% |
| Mobile Home / Other | 0 | 0.0% |
| Total | 1,712 | 100.0% |
Housing Structures by Occupancy in Rossville
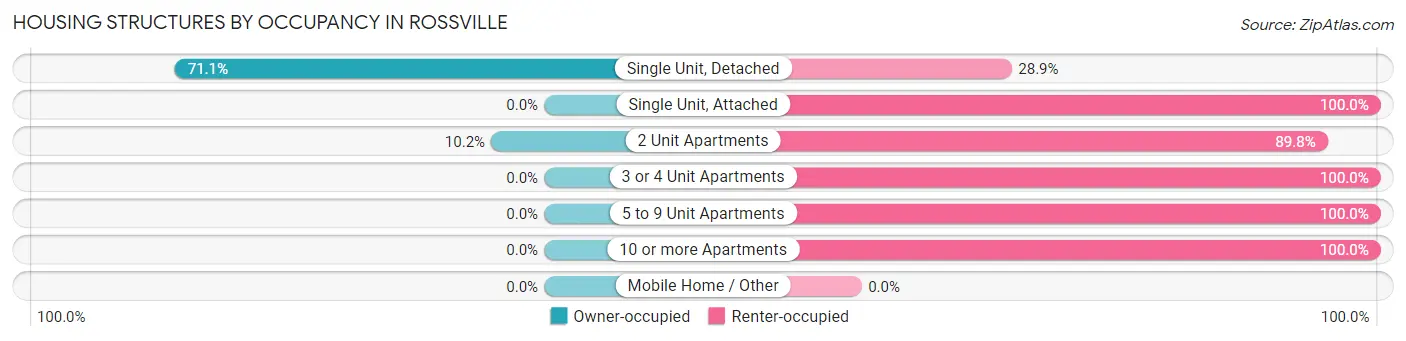
| Structure Type | Owner-occupied | Renter-occupied |
| Single Unit, Detached | 924 (71.1%) | 376 (28.9%) |
| Single Unit, Attached | 0 (0.0%) | 36 (100.0%) |
| 2 Unit Apartments | 14 (10.2%) | 123 (89.8%) |
| 3 or 4 Unit Apartments | 0 (0.0%) | 49 (100.0%) |
| 5 to 9 Unit Apartments | 0 (0.0%) | 69 (100.0%) |
| 10 or more Apartments | 0 (0.0%) | 121 (100.0%) |
| Mobile Home / Other | 0 (0.0%) | 0 (0.0%) |
| Total | 938 (54.8%) | 774 (45.2%) |
Housing Structures by Number of Rooms in Rossville
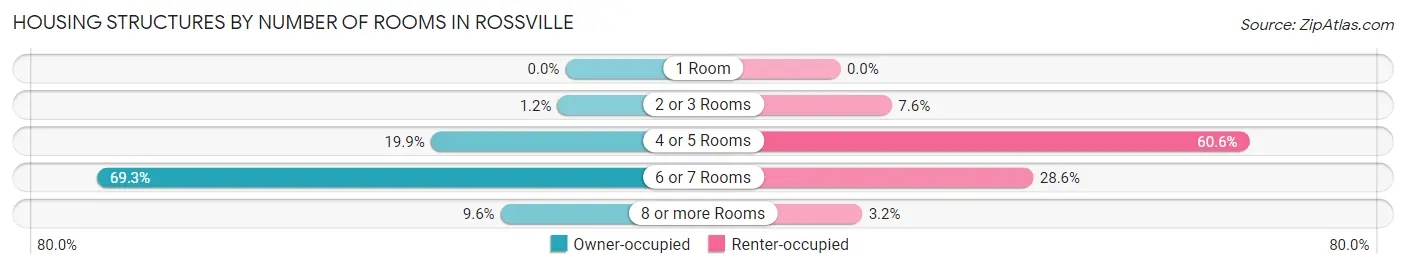
| Number of Rooms | Owner-occupied | Renter-occupied |
| 1 Room | 0 (0.0%) | 0 (0.0%) |
| 2 or 3 Rooms | 11 (1.2%) | 59 (7.6%) |
| 4 or 5 Rooms | 187 (19.9%) | 469 (60.6%) |
| 6 or 7 Rooms | 650 (69.3%) | 221 (28.5%) |
| 8 or more Rooms | 90 (9.6%) | 25 (3.2%) |
| Total | 938 (100.0%) | 774 (100.0%) |
Housing Structure by Heating Type in Rossville
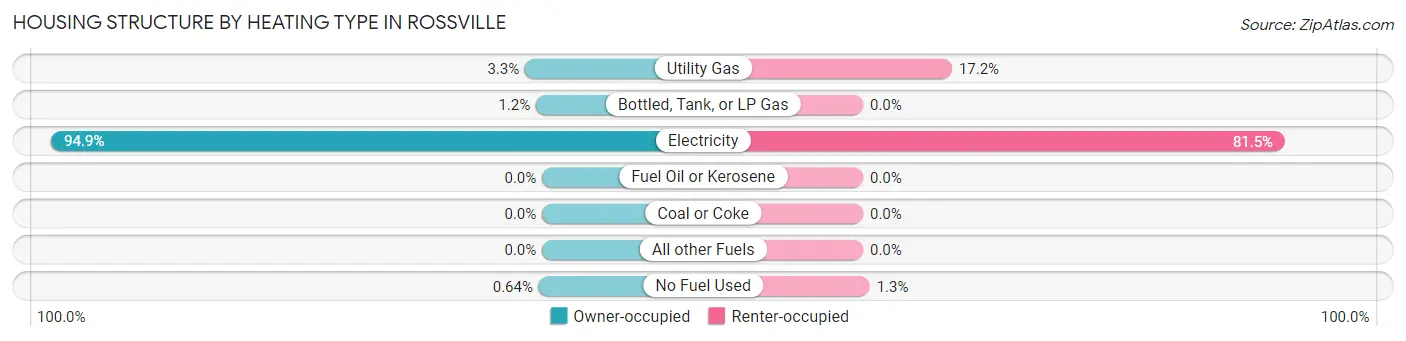
| Heating Type | Owner-occupied | Renter-occupied |
| Utility Gas | 31 (3.3%) | 133 (17.2%) |
| Bottled, Tank, or LP Gas | 11 (1.2%) | 0 (0.0%) |
| Electricity | 890 (94.9%) | 631 (81.5%) |
| Fuel Oil or Kerosene | 0 (0.0%) | 0 (0.0%) |
| Coal or Coke | 0 (0.0%) | 0 (0.0%) |
| All other Fuels | 0 (0.0%) | 0 (0.0%) |
| No Fuel Used | 6 (0.6%) | 10 (1.3%) |
| Total | 938 (100.0%) | 774 (100.0%) |
Household Vehicle Usage in Rossville
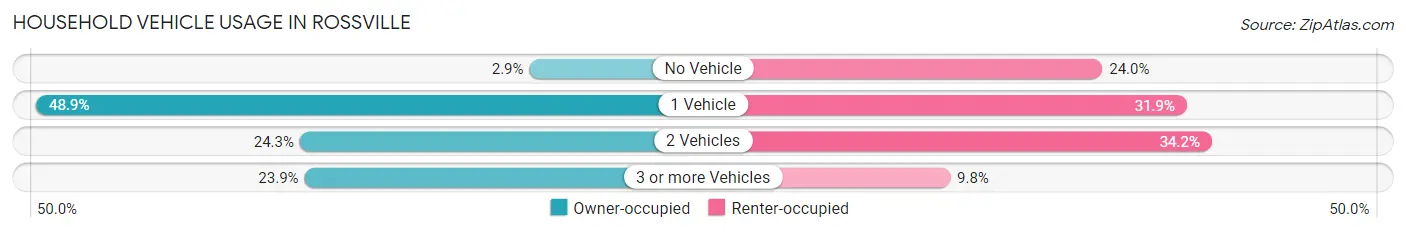
| Vehicles per Household | Owner-occupied | Renter-occupied |
| No Vehicle | 27 (2.9%) | 186 (24.0%) |
| 1 Vehicle | 459 (48.9%) | 247 (31.9%) |
| 2 Vehicles | 228 (24.3%) | 265 (34.2%) |
| 3 or more Vehicles | 224 (23.9%) | 76 (9.8%) |
| Total | 938 (100.0%) | 774 (100.0%) |
Real Estate & Mortgages in Rossville
Real Estate and Mortgage Overview in Rossville
| Characteristic | Without Mortgage | With Mortgage |
| Housing Units | 435 | 503 |
| Median Property Value | $137,500 | $58,000 |
| Median Household Income | $40,139 | $14 |
| Monthly Housing Costs | $540 | $0 |
| Real Estate Taxes | $745 | $0 |
Property Value by Mortgage Status in Rossville
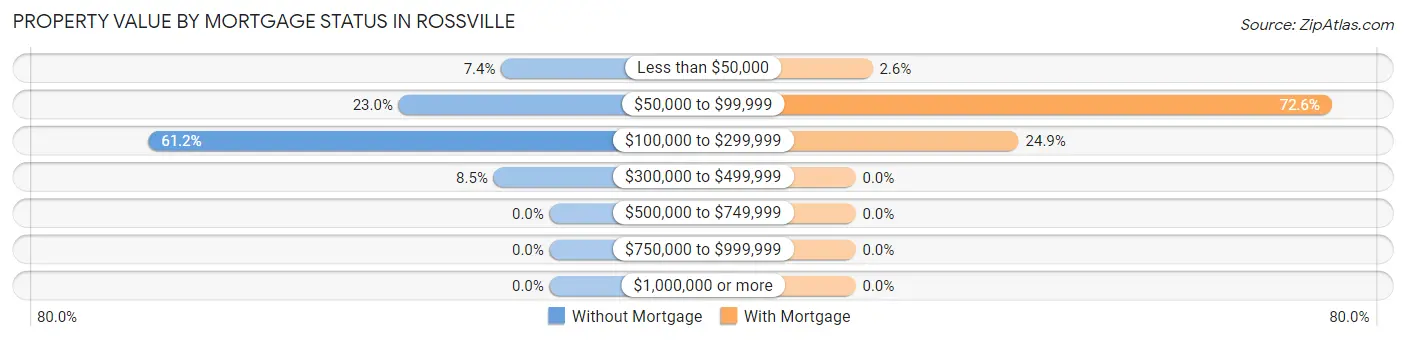
| Property Value | Without Mortgage | With Mortgage |
| Less than $50,000 | 32 (7.4%) | 13 (2.6%) |
| $50,000 to $99,999 | 100 (23.0%) | 365 (72.6%) |
| $100,000 to $299,999 | 266 (61.2%) | 125 (24.8%) |
| $300,000 to $499,999 | 37 (8.5%) | 0 (0.0%) |
| $500,000 to $749,999 | 0 (0.0%) | 0 (0.0%) |
| $750,000 to $999,999 | 0 (0.0%) | 0 (0.0%) |
| $1,000,000 or more | 0 (0.0%) | 0 (0.0%) |
| Total | 435 (100.0%) | 503 (100.0%) |
Household Income by Mortgage Status in Rossville
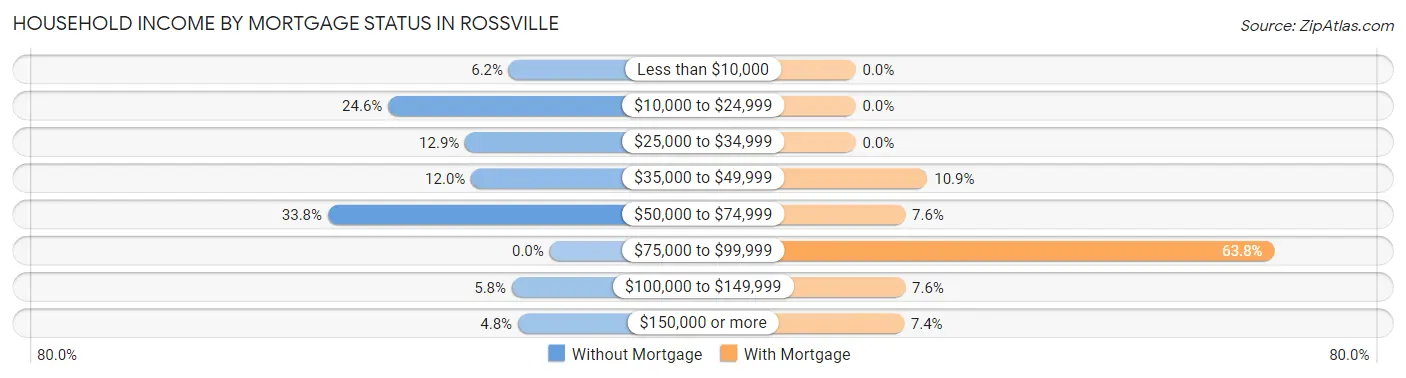
| Household Income | Without Mortgage | With Mortgage |
| Less than $10,000 | 27 (6.2%) | 0 (0.0%) |
| $10,000 to $24,999 | 107 (24.6%) | 0 (0.0%) |
| $25,000 to $34,999 | 56 (12.9%) | 0 (0.0%) |
| $35,000 to $49,999 | 52 (11.9%) | 55 (10.9%) |
| $50,000 to $74,999 | 147 (33.8%) | 38 (7.5%) |
| $75,000 to $99,999 | 0 (0.0%) | 321 (63.8%) |
| $100,000 to $149,999 | 25 (5.8%) | 38 (7.5%) |
| $150,000 or more | 21 (4.8%) | 37 (7.4%) |
| Total | 435 (100.0%) | 503 (100.0%) |
Property Value to Household Income Ratio in Rossville
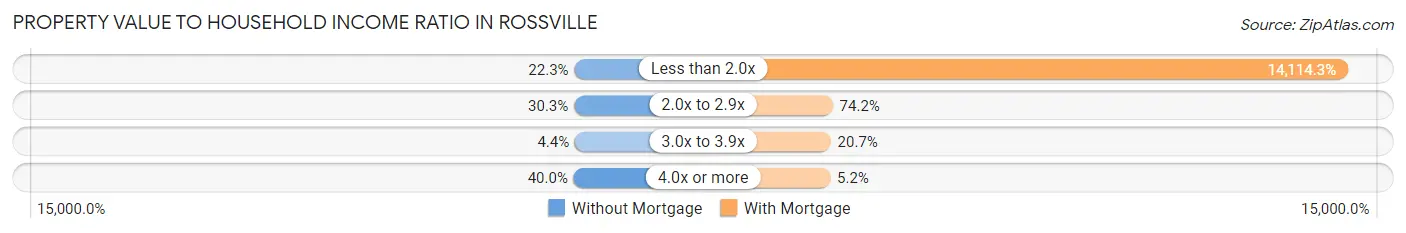
| Value-to-Income Ratio | Without Mortgage | With Mortgage |
| Less than 2.0x | 97 (22.3%) | 70,995 (14,114.3%) |
| 2.0x to 2.9x | 132 (30.3%) | 373 (74.2%) |
| 3.0x to 3.9x | 19 (4.4%) | 104 (20.7%) |
| 4.0x or more | 174 (40.0%) | 26 (5.2%) |
| Total | 435 (100.0%) | 503 (100.0%) |
Real Estate Taxes by Mortgage Status in Rossville
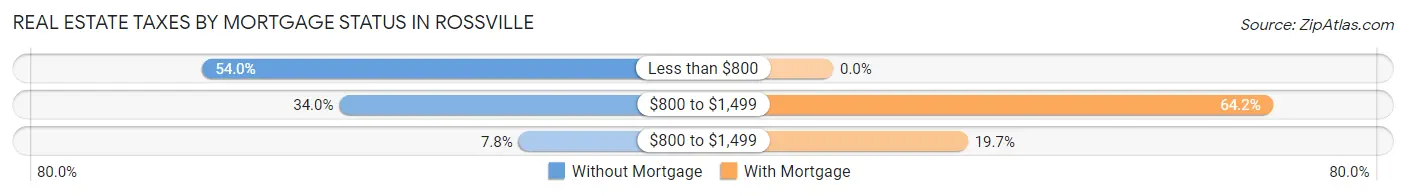
| Property Taxes | Without Mortgage | With Mortgage |
| Less than $800 | 235 (54.0%) | 0 (0.0%) |
| $800 to $1,499 | 148 (34.0%) | 323 (64.2%) |
| $800 to $1,499 | 34 (7.8%) | 99 (19.7%) |
| Total | 435 (100.0%) | 503 (100.0%) |
Health & Disability in Rossville
Health Insurance Coverage by Age in Rossville
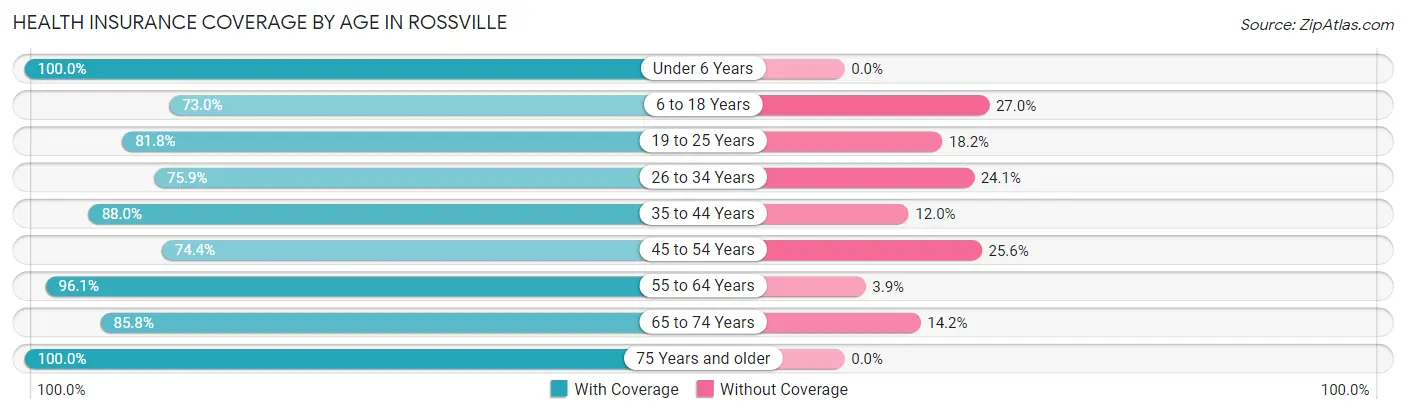
| Age Bracket | With Coverage | Without Coverage |
| Under 6 Years | 201 (100.0%) | 0 (0.0%) |
| 6 to 18 Years | 452 (73.0%) | 167 (27.0%) |
| 19 to 25 Years | 310 (81.8%) | 69 (18.2%) |
| 26 to 34 Years | 264 (75.9%) | 84 (24.1%) |
| 35 to 44 Years | 758 (88.0%) | 103 (12.0%) |
| 45 to 54 Years | 372 (74.4%) | 128 (25.6%) |
| 55 to 64 Years | 368 (96.1%) | 15 (3.9%) |
| 65 to 74 Years | 218 (85.8%) | 36 (14.2%) |
| 75 Years and older | 339 (100.0%) | 0 (0.0%) |
| Total | 3,282 (84.5%) | 602 (15.5%) |
Health Insurance Coverage by Citizenship Status in Rossville
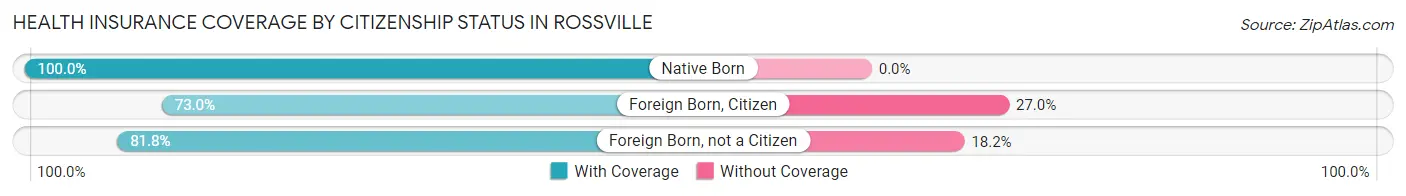
| Citizenship Status | With Coverage | Without Coverage |
| Native Born | 201 (100.0%) | 0 (0.0%) |
| Foreign Born, Citizen | 452 (73.0%) | 167 (27.0%) |
| Foreign Born, not a Citizen | 310 (81.8%) | 69 (18.2%) |
Health Insurance Coverage by Household Income in Rossville
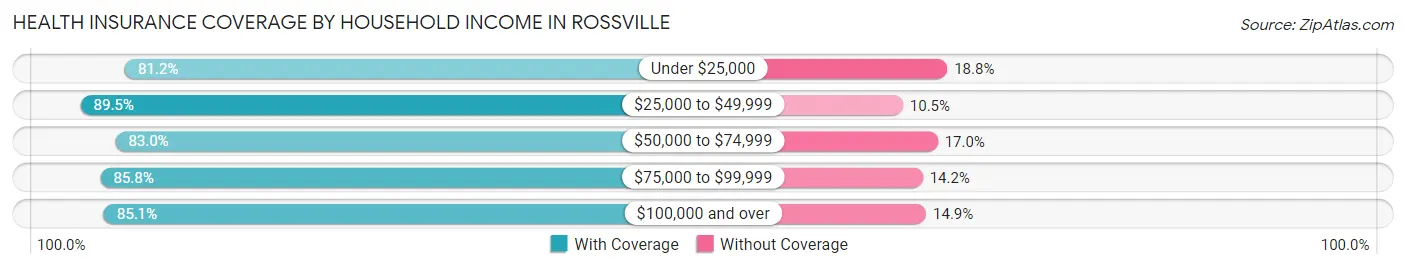
| Household Income | With Coverage | Without Coverage |
| Under $25,000 | 742 (81.2%) | 172 (18.8%) |
| $25,000 to $49,999 | 835 (89.5%) | 98 (10.5%) |
| $50,000 to $74,999 | 1,174 (83.0%) | 241 (17.0%) |
| $75,000 to $99,999 | 193 (85.8%) | 32 (14.2%) |
| $100,000 and over | 338 (85.1%) | 59 (14.9%) |
Public vs Private Health Insurance Coverage by Age in Rossville
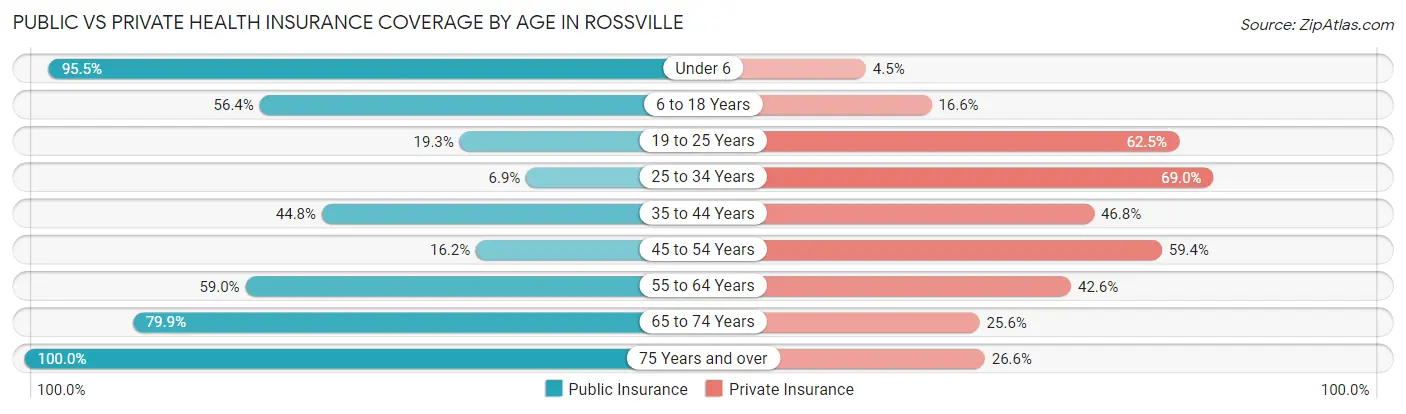
| Age Bracket | Public Insurance | Private Insurance |
| Under 6 | 192 (95.5%) | 9 (4.5%) |
| 6 to 18 Years | 349 (56.4%) | 103 (16.6%) |
| 19 to 25 Years | 73 (19.3%) | 237 (62.5%) |
| 25 to 34 Years | 24 (6.9%) | 240 (69.0%) |
| 35 to 44 Years | 386 (44.8%) | 403 (46.8%) |
| 45 to 54 Years | 81 (16.2%) | 297 (59.4%) |
| 55 to 64 Years | 226 (59.0%) | 163 (42.6%) |
| 65 to 74 Years | 203 (79.9%) | 65 (25.6%) |
| 75 Years and over | 339 (100.0%) | 90 (26.6%) |
| Total | 1,873 (48.2%) | 1,607 (41.4%) |
Disability Status by Sex by Age in Rossville
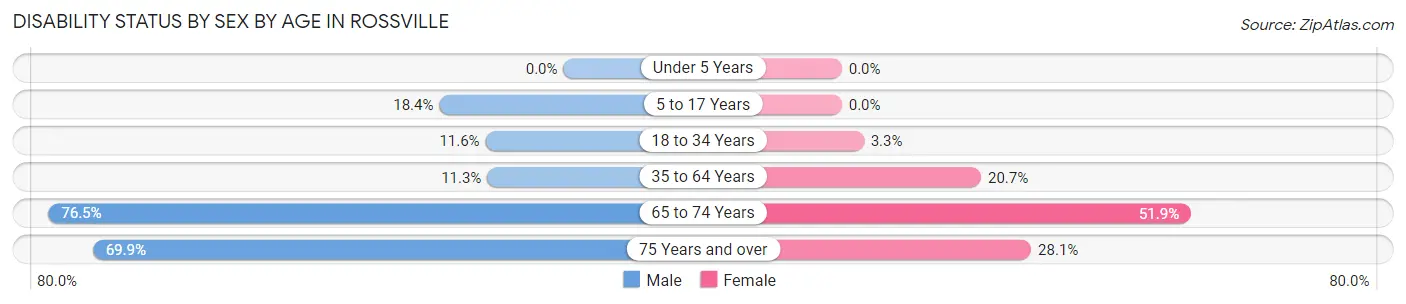
| Age Bracket | Male | Female |
| Under 5 Years | 0 (0.0%) | 0 (0.0%) |
| 5 to 17 Years | 84 (18.4%) | 0 (0.0%) |
| 18 to 34 Years | 45 (11.6%) | 11 (3.3%) |
| 35 to 64 Years | 107 (11.3%) | 165 (20.7%) |
| 65 to 74 Years | 91 (76.5%) | 70 (51.8%) |
| 75 Years and over | 58 (69.9%) | 72 (28.1%) |
Disability Class by Sex by Age in Rossville
Disability Class: Hearing Difficulty
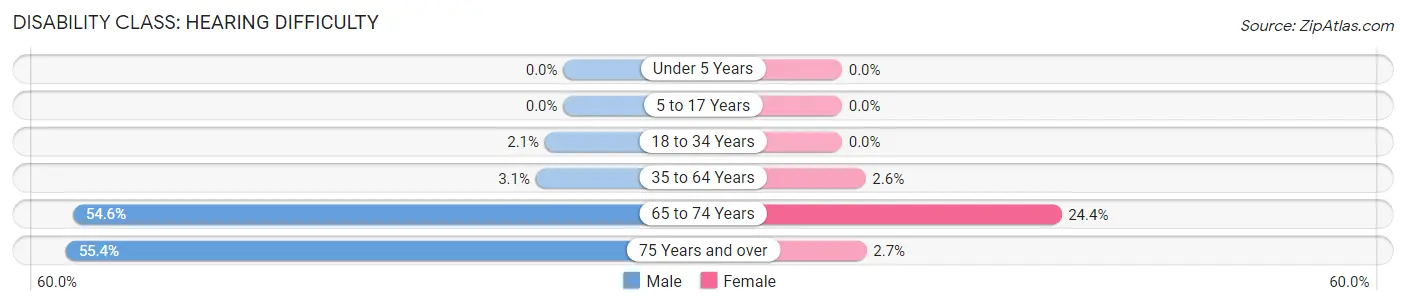
| Age Bracket | Male | Female |
| Under 5 Years | 0 (0.0%) | 0 (0.0%) |
| 5 to 17 Years | 0 (0.0%) | 0 (0.0%) |
| 18 to 34 Years | 8 (2.1%) | 0 (0.0%) |
| 35 to 64 Years | 29 (3.1%) | 21 (2.6%) |
| 65 to 74 Years | 65 (54.6%) | 33 (24.4%) |
| 75 Years and over | 46 (55.4%) | 7 (2.7%) |
Disability Class: Vision Difficulty
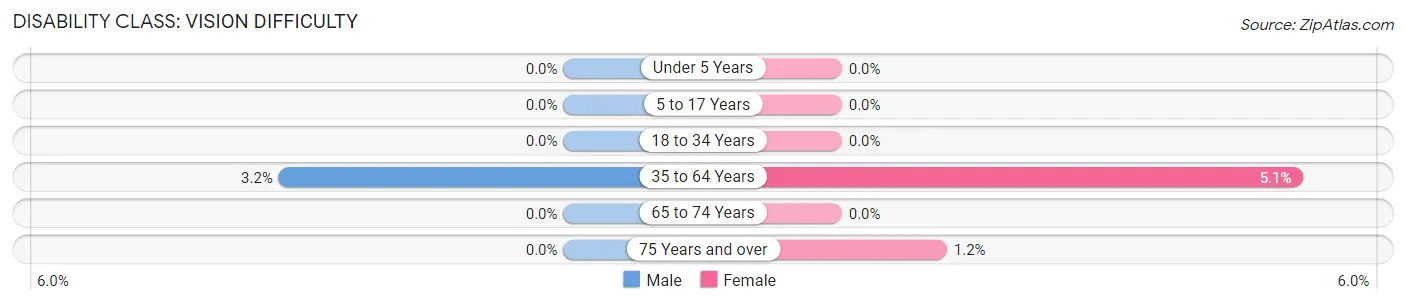
| Age Bracket | Male | Female |
| Under 5 Years | 0 (0.0%) | 0 (0.0%) |
| 5 to 17 Years | 0 (0.0%) | 0 (0.0%) |
| 18 to 34 Years | 0 (0.0%) | 0 (0.0%) |
| 35 to 64 Years | 30 (3.2%) | 41 (5.1%) |
| 65 to 74 Years | 0 (0.0%) | 0 (0.0%) |
| 75 Years and over | 0 (0.0%) | 3 (1.2%) |
Disability Class: Cognitive Difficulty
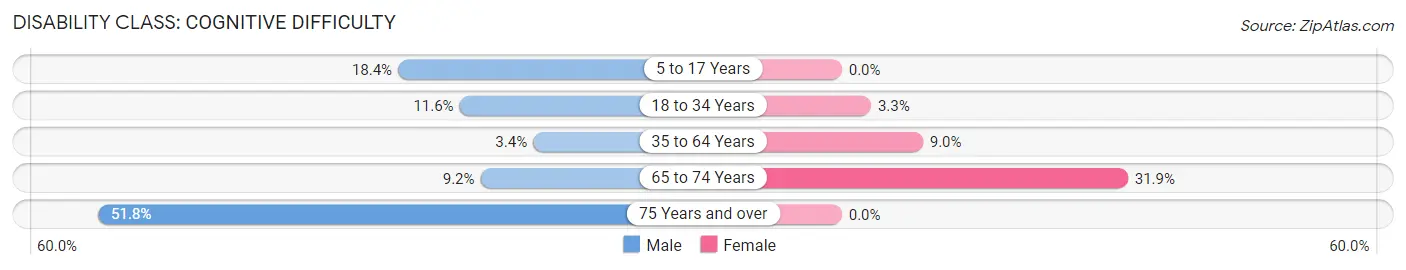
| Age Bracket | Male | Female |
| 5 to 17 Years | 84 (18.4%) | 0 (0.0%) |
| 18 to 34 Years | 45 (11.6%) | 11 (3.3%) |
| 35 to 64 Years | 32 (3.4%) | 72 (9.0%) |
| 65 to 74 Years | 11 (9.2%) | 43 (31.9%) |
| 75 Years and over | 43 (51.8%) | 0 (0.0%) |
Disability Class: Ambulatory Difficulty
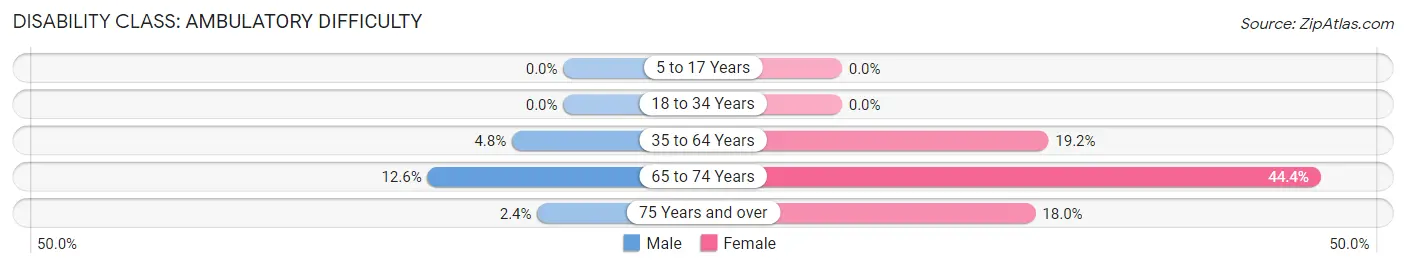
| Age Bracket | Male | Female |
| 5 to 17 Years | 0 (0.0%) | 0 (0.0%) |
| 18 to 34 Years | 0 (0.0%) | 0 (0.0%) |
| 35 to 64 Years | 45 (4.8%) | 153 (19.2%) |
| 65 to 74 Years | 15 (12.6%) | 60 (44.4%) |
| 75 Years and over | 2 (2.4%) | 46 (18.0%) |
Disability Class: Self-Care Difficulty
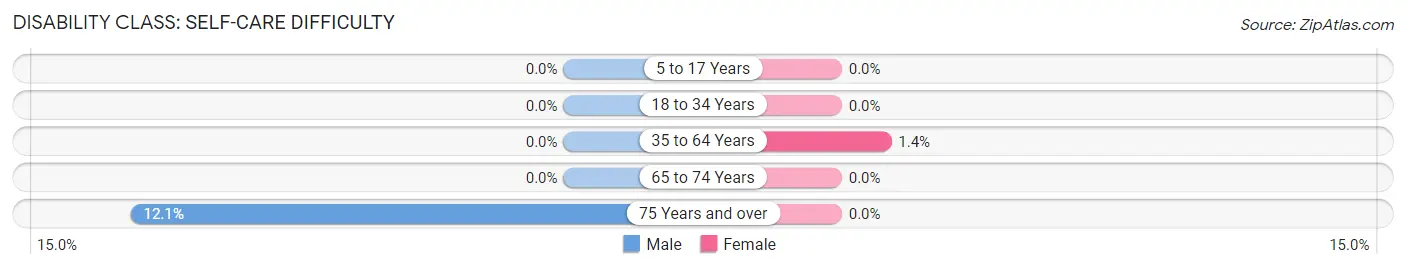
| Age Bracket | Male | Female |
| 5 to 17 Years | 0 (0.0%) | 0 (0.0%) |
| 18 to 34 Years | 0 (0.0%) | 0 (0.0%) |
| 35 to 64 Years | 0 (0.0%) | 11 (1.4%) |
| 65 to 74 Years | 0 (0.0%) | 0 (0.0%) |
| 75 Years and over | 10 (12.0%) | 0 (0.0%) |
Technology Access in Rossville
Computing Device Access in Rossville
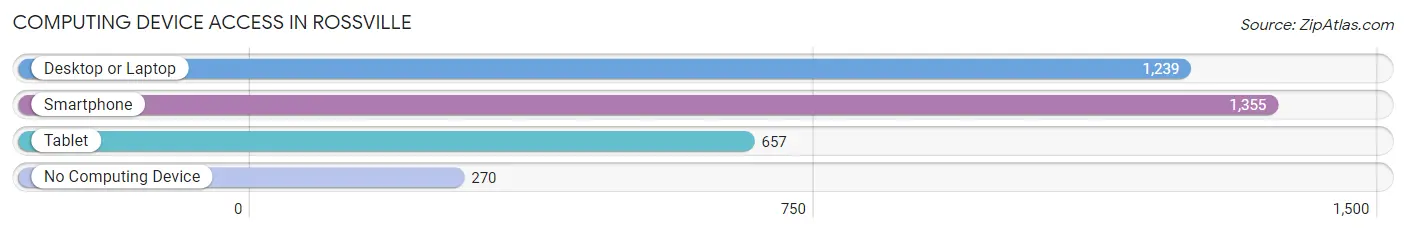
| Device Type | # Households | % Households |
| Desktop or Laptop | 1,239 | 72.4% |
| Smartphone | 1,355 | 79.1% |
| Tablet | 657 | 38.4% |
| No Computing Device | 270 | 15.8% |
| Total | 1,712 | 100.0% |
Internet Access in Rossville
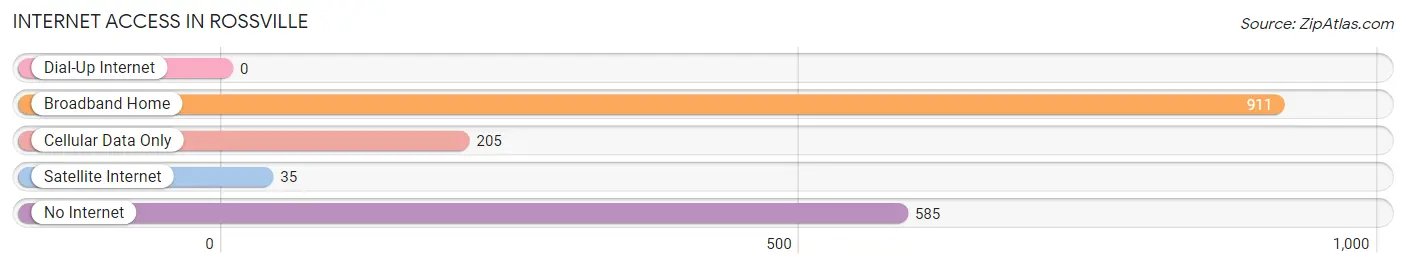
| Internet Type | # Households | % Households |
| Dial-Up Internet | 0 | 0.0% |
| Broadband Home | 911 | 53.2% |
| Cellular Data Only | 205 | 12.0% |
| Satellite Internet | 35 | 2.0% |
| No Internet | 585 | 34.2% |
| Total | 1,712 | 100.0% |
Rossville Summary
Rossville, Georgia is a small city located in the northwest corner of the state, just south of the Tennessee border. It is part of the Chattanooga, TN-GA Metropolitan Statistical Area and is the county seat of Walker County. The city has a population of 4,160 as of the 2010 census, and is the second-largest city in the county.
History
The area that is now Rossville was first settled in the early 1800s by Cherokee Indians. The city was founded in 1837 and named after John Ross, the principal chief of the Cherokee Nation. The city was incorporated in 1845 and was the first city in Walker County.
During the Civil War, Rossville was the site of several battles, including the Battle of Chickamauga in 1863. After the war, the city experienced a period of growth and prosperity, with the establishment of several businesses, including a cotton mill, a flour mill, and a brick factory.
Geography
Rossville is located in the northwest corner of Georgia, just south of the Tennessee border. It is part of the Chattanooga, TN-GA Metropolitan Statistical Area and is the county seat of Walker County. The city has a total area of 4.2 square miles, all of which is land.
The city is located in the foothills of the Appalachian Mountains and is surrounded by several small towns and rural areas. The city is located near the Chickamauga and Chattanooga National Military Park, which is a popular tourist destination.
Economy
The economy of Rossville is largely based on manufacturing and retail. The city is home to several manufacturing companies, including a paper mill, a steel mill, and a plastics factory. The city also has several retail stores, including a Walmart Supercenter, a Lowe’s Home Improvement store, and several restaurants.
The city is also home to several educational institutions, including the University of Tennessee at Chattanooga, Chattanooga State Community College, and the Georgia Northwestern Technical College.
Demographics
As of the 2010 census, the population of Rossville was 4,160. The racial makeup of the city was 79.2% White, 16.2% African American, 0.4% Native American, 0.7% Asian, 0.1% Pacific Islander, 1.2% from other races, and 2.2% from two or more races. Hispanic or Latino of any race were 3.2% of the population.
The median income for a household in the city was $31,250, and the median income for a family was $37,500. The per capita income for the city was $17,845. About 17.2% of families and 20.2% of the population were below the poverty line, including 28.2% of those under age 18 and 11.2% of those age 65 or over.
Common Questions
What is Per Capita Income in Rossville?
Per Capita income in Rossville is $25,491.
What is the Median Family Income in Rossville?
Median Family Income in Rossville is $55,903.
What is the Median Household income in Rossville?
Median Household Income in Rossville is $42,845.
What is Income or Wage Gap in Rossville?
Income or Wage Gap in Rossville is 50.5%.
Women in Rossville earn 49.5 cents for every dollar earned by a man.
What is Inequality or Gini Index in Rossville?
Inequality or Gini Index in Rossville is 0.42.
What is the Total Population of Rossville?
Total Population of Rossville is 3,982.
What is the Total Male Population of Rossville?
Total Male Population of Rossville is 2,119.
What is the Total Female Population of Rossville?
Total Female Population of Rossville is 1,863.
What is the Ratio of Males per 100 Females in Rossville?
There are 113.74 Males per 100 Females in Rossville.
What is the Ratio of Females per 100 Males in Rossville?
There are 87.92 Females per 100 Males in Rossville.
What is the Median Population Age in Rossville?
Median Population Age in Rossville is 42.7 Years.
What is the Average Family Size in Rossville
Average Family Size in Rossville is 2.6 People.
What is the Average Household Size in Rossville
Average Household Size in Rossville is 2.3 People.
How Large is the Labor Force in Rossville?
There are 1,942 People in the Labor Forcein in Rossville.
What is the Percentage of People in the Labor Force in Rossville?
59.9% of People are in the Labor Force in Rossville.
What is the Unemployment Rate in Rossville?
Unemployment Rate in Rossville is 5.3%.