Zip Codes with the Highest Percentage of Population with a Degree in Liberal Arts and History in Bainbridge, GA
RELATED REPORTS & OPTIONS
Liberal Arts and History
Bainbridge
Compare Zip Codes
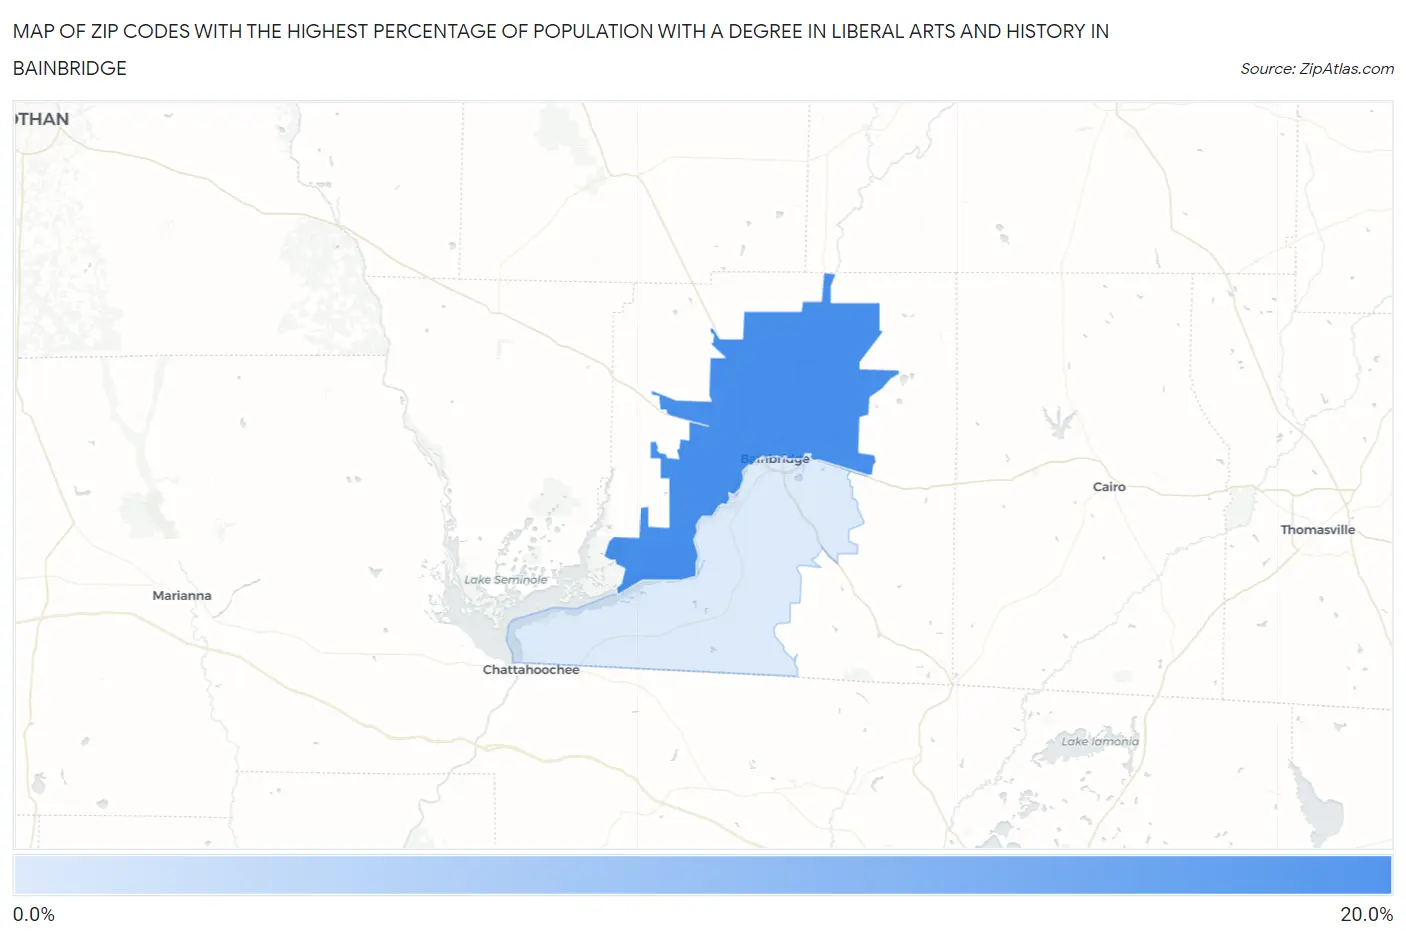
Map of Zip Codes with the Highest Percentage of Population with a Degree in Liberal Arts and History in Bainbridge
6.8%
17.6%
Zip Codes with the Highest Percentage of Population with a Degree in Liberal Arts and History in Bainbridge, GA
| Zip Code | % Graduates | vs State | vs National | |
| 1. | 39817 | 17.6% | 4.1%(+13.5)#18 | 4.9%(+12.7)#1,076 |
| 2. | 39819 | 6.8% | 4.1%(+2.62)#132 | 4.9%(+1.88)#6,828 |
1
Common Questions
What are the Top Zip Codes with the Highest Percentage of Population with a Degree in Liberal Arts and History in Bainbridge, GA?
Top Zip Codes with the Highest Percentage of Population with a Degree in Liberal Arts and History in Bainbridge, GA are:
What zip code has the Highest Percentage of Population with a Degree in Liberal Arts and History in Bainbridge, GA?
39817 has the Highest Percentage of Population with a Degree in Liberal Arts and History in Bainbridge, GA with 17.6%.
What is the Percentage of Population with a Degree in Liberal Arts and History in Bainbridge, GA?
Percentage of Population with a Degree in Liberal Arts and History in Bainbridge is 13.6%.
What is the Percentage of Population with a Degree in Liberal Arts and History in Georgia?
Percentage of Population with a Degree in Liberal Arts and History in Georgia is 4.1%.
What is the Percentage of Population with a Degree in Liberal Arts and History in the United States?
Percentage of Population with a Degree in Liberal Arts and History in the United States is 4.9%.