Zip Codes with the Highest Percentage of Population with a Degree in Liberal Arts and History in Buford, GA
RELATED REPORTS & OPTIONS
Liberal Arts and History
Buford
Compare Zip Codes
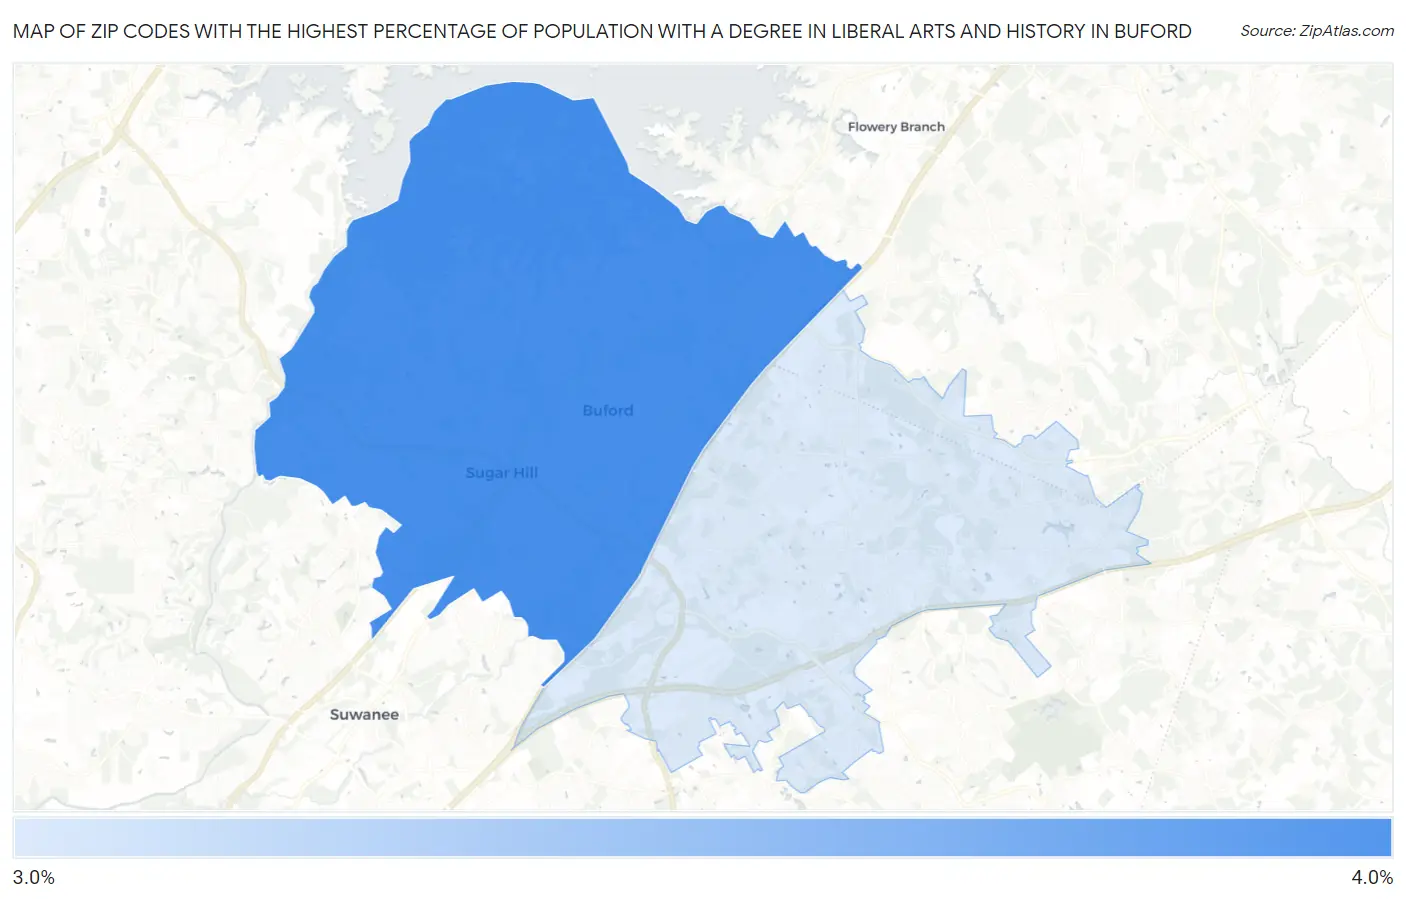
Map of Zip Codes with the Highest Percentage of Population with a Degree in Liberal Arts and History in Buford
3.5%
3.8%
Zip Codes with the Highest Percentage of Population with a Degree in Liberal Arts and History in Buford, GA
| Zip Code | % Graduates | vs State | vs National | |
| 1. | 30518 | 3.8% | 4.1%(-0.334)#340 | 4.9%(-1.08)#15,551 |
| 2. | 30519 | 3.5% | 4.1%(-0.589)#367 | 4.9%(-1.34)#16,453 |
1
Common Questions
What are the Top Zip Codes with the Highest Percentage of Population with a Degree in Liberal Arts and History in Buford, GA?
Top Zip Codes with the Highest Percentage of Population with a Degree in Liberal Arts and History in Buford, GA are:
What zip code has the Highest Percentage of Population with a Degree in Liberal Arts and History in Buford, GA?
30518 has the Highest Percentage of Population with a Degree in Liberal Arts and History in Buford, GA with 3.8%.
What is the Percentage of Population with a Degree in Liberal Arts and History in Buford, GA?
Percentage of Population with a Degree in Liberal Arts and History in Buford is 2.3%.
What is the Percentage of Population with a Degree in Liberal Arts and History in Georgia?
Percentage of Population with a Degree in Liberal Arts and History in Georgia is 4.1%.
What is the Percentage of Population with a Degree in Liberal Arts and History in the United States?
Percentage of Population with a Degree in Liberal Arts and History in the United States is 4.9%.