Icehouse Canyon, AZ Map & Demographics
Icehouse Canyon Map
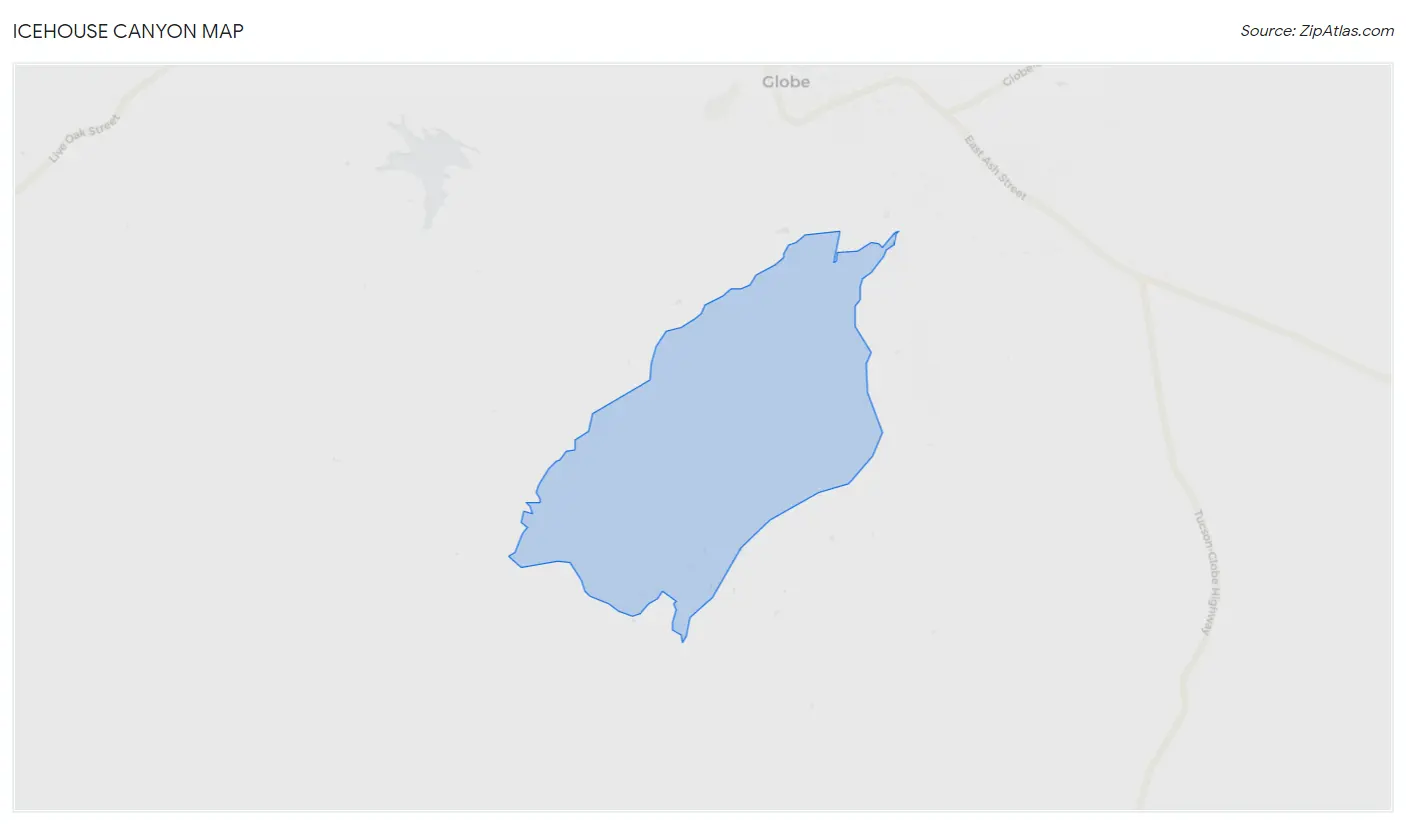
Icehouse Canyon Overview
$24,703
PER CAPITA INCOME
$56,538
AVG FAMILY INCOME
$47,161
AVG HOUSEHOLD INCOME
2.4%
WAGE / INCOME GAP [ % ]
97.6¢/ $1
WAGE / INCOME GAP [ $ ]
0.32
INEQUALITY / GINI INDEX
532
TOTAL POPULATION
202
MALE POPULATION
330
FEMALE POPULATION
61.21
MALES / 100 FEMALES
163.37
FEMALES / 100 MALES
59.1
MEDIAN AGE
3.0
AVG FAMILY SIZE
2.3
AVG HOUSEHOLD SIZE
153
LABOR FORCE [ PEOPLE ]
33.1%
PERCENT IN LABOR FORCE
Income in Icehouse Canyon
Income Overview in Icehouse Canyon
Per Capita Income in Icehouse Canyon is $24,703, while median incomes of families and households are $56,538 and $47,161 respectively.
| Characteristic | Number | Measure |
| Per Capita Income | 532 | $24,703 |
| Median Family Income | 148 | $56,538 |
| Mean Family Income | 148 | $58,779 |
| Median Household Income | 232 | $47,161 |
| Mean Household Income | 232 | $55,278 |
| Income Deficit | 148 | $0 |
| Wage / Income Gap (%) | 532 | 2.42% |
| Wage / Income Gap ($) | 532 | 97.58¢ per $1 |
| Gini / Inequality Index | 532 | 0.32 |
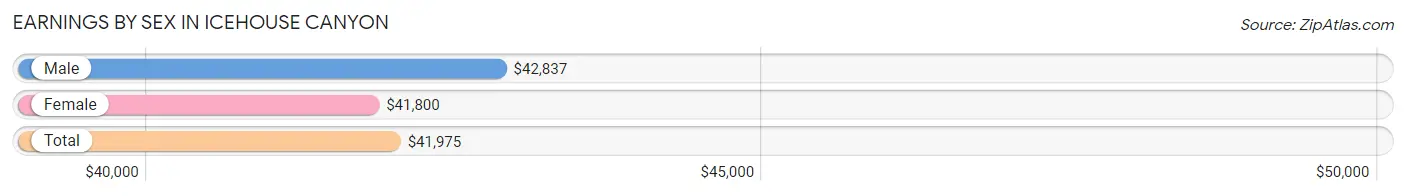
Earnings by Sex in Icehouse Canyon
Average Earnings in Icehouse Canyon are $41,975, $42,837 for men and $41,800 for women, a difference of 2.4%.
| Sex | Number | Average Earnings |
| Male | 45 (29.4%) | $42,837 |
| Female | 108 (70.6%) | $41,800 |
| Total | 153 (100.0%) | $41,975 |
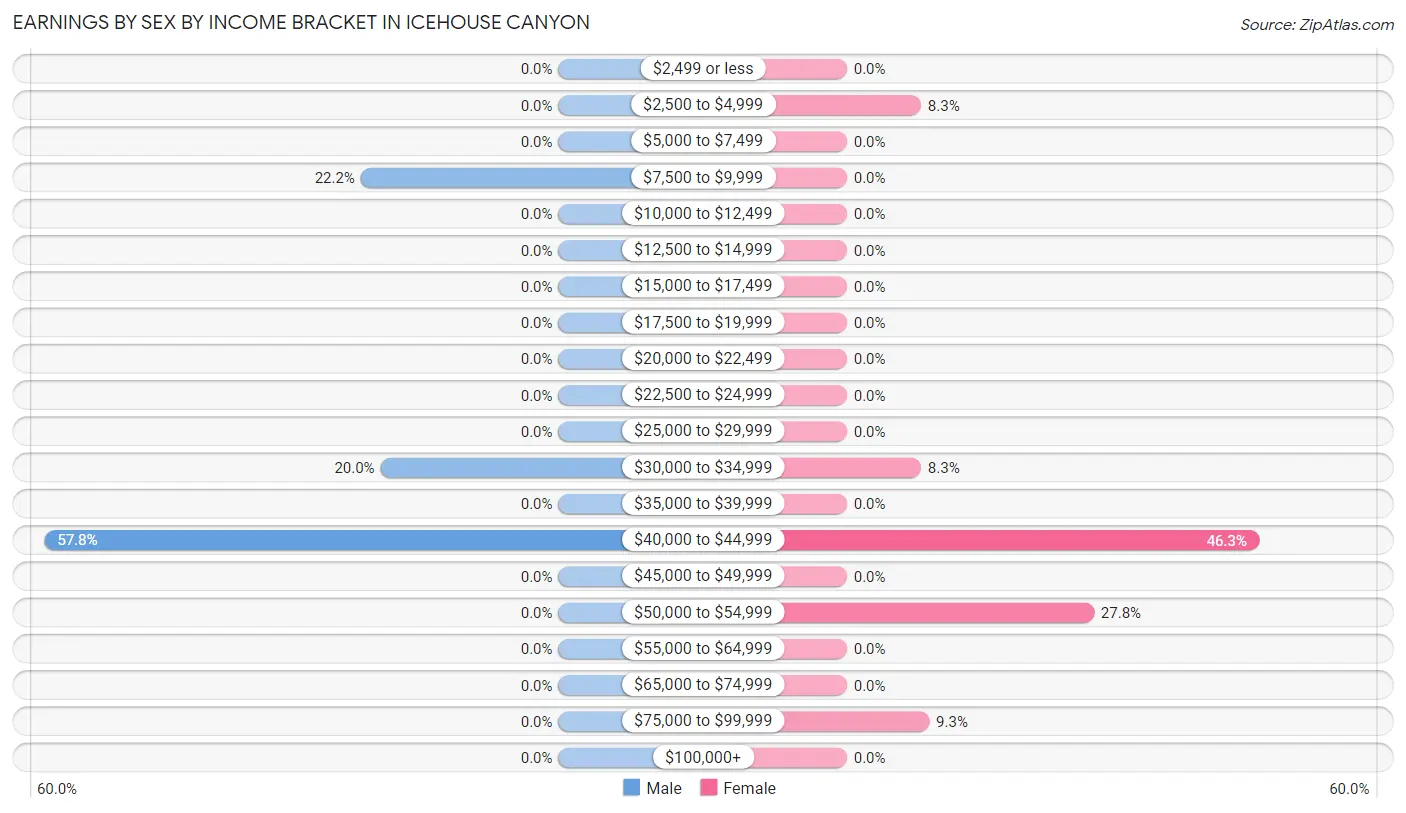
Earnings by Sex by Income Bracket in Icehouse Canyon
The most common earnings brackets in Icehouse Canyon are $40,000 to $44,999 for men (26 | 57.8%) and $40,000 to $44,999 for women (50 | 46.3%).
| Income | Male | Female |
| $2,499 or less | 0 (0.0%) | 0 (0.0%) |
| $2,500 to $4,999 | 0 (0.0%) | 9 (8.3%) |
| $5,000 to $7,499 | 0 (0.0%) | 0 (0.0%) |
| $7,500 to $9,999 | 10 (22.2%) | 0 (0.0%) |
| $10,000 to $12,499 | 0 (0.0%) | 0 (0.0%) |
| $12,500 to $14,999 | 0 (0.0%) | 0 (0.0%) |
| $15,000 to $17,499 | 0 (0.0%) | 0 (0.0%) |
| $17,500 to $19,999 | 0 (0.0%) | 0 (0.0%) |
| $20,000 to $22,499 | 0 (0.0%) | 0 (0.0%) |
| $22,500 to $24,999 | 0 (0.0%) | 0 (0.0%) |
| $25,000 to $29,999 | 0 (0.0%) | 0 (0.0%) |
| $30,000 to $34,999 | 9 (20.0%) | 9 (8.3%) |
| $35,000 to $39,999 | 0 (0.0%) | 0 (0.0%) |
| $40,000 to $44,999 | 26 (57.8%) | 50 (46.3%) |
| $45,000 to $49,999 | 0 (0.0%) | 0 (0.0%) |
| $50,000 to $54,999 | 0 (0.0%) | 30 (27.8%) |
| $55,000 to $64,999 | 0 (0.0%) | 0 (0.0%) |
| $65,000 to $74,999 | 0 (0.0%) | 0 (0.0%) |
| $75,000 to $99,999 | 0 (0.0%) | 10 (9.3%) |
| $100,000+ | 0 (0.0%) | 0 (0.0%) |
| Total | 45 (100.0%) | 108 (100.0%) |
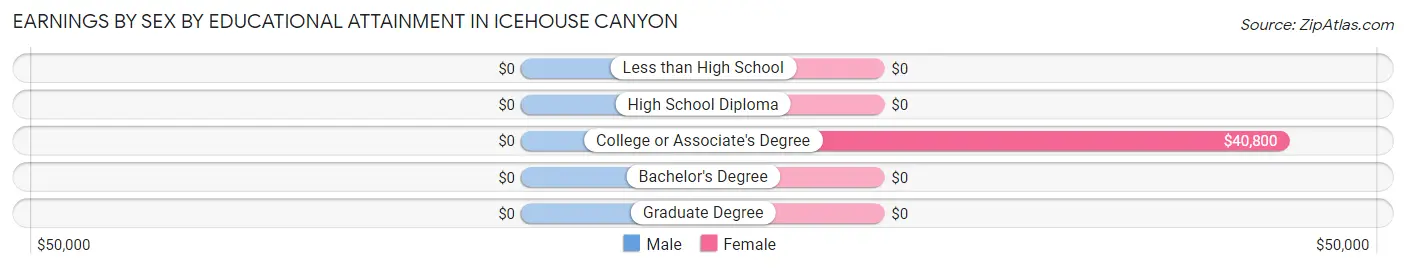
Earnings by Sex by Educational Attainment in Icehouse Canyon
| Educational Attainment | Male Income | Female Income |
| Less than High School | - | - |
| High School Diploma | - | - |
| College or Associate's Degree | - | - |
| Bachelor's Degree | - | - |
| Graduate Degree | - | - |
| Total | - | - |
Family Income in Icehouse Canyon
Family Income Brackets in Icehouse Canyon
According to the Icehouse Canyon family income data, there are 55 families falling into the $50,000 to $74,999 income range, which is the most common income bracket and makes up 37.2% of all families.
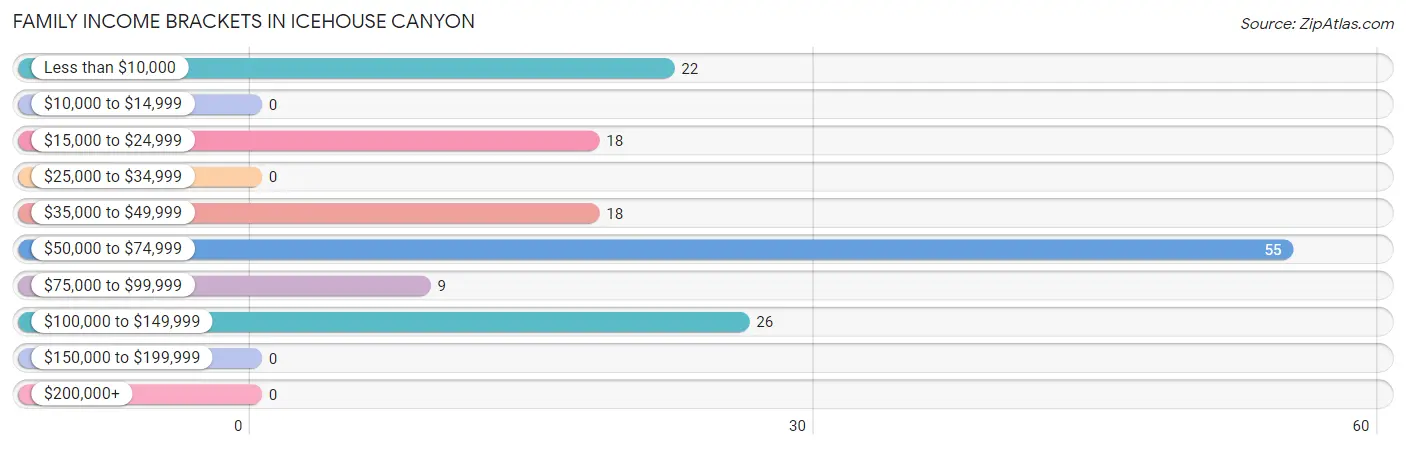
| Income Bracket | # Families | % Families |
| Less than $10,000 | 22 | 14.9% |
| $10,000 to $14,999 | 0 | 0.0% |
| $15,000 to $24,999 | 18 | 12.2% |
| $25,000 to $34,999 | 0 | 0.0% |
| $35,000 to $49,999 | 18 | 12.2% |
| $50,000 to $74,999 | 55 | 37.2% |
| $75,000 to $99,999 | 9 | 6.1% |
| $100,000 to $149,999 | 26 | 17.6% |
| $150,000 to $199,999 | 0 | 0.0% |
| $200,000+ | 0 | 0.0% |
Family Income by Famaliy Size in Icehouse Canyon
2-person families (74 | 50.0%) account for the highest median family income in Icehouse Canyon with $65,086 per family, while 2-person families (74 | 50.0%) have the highest median income of $32,543 per family member.
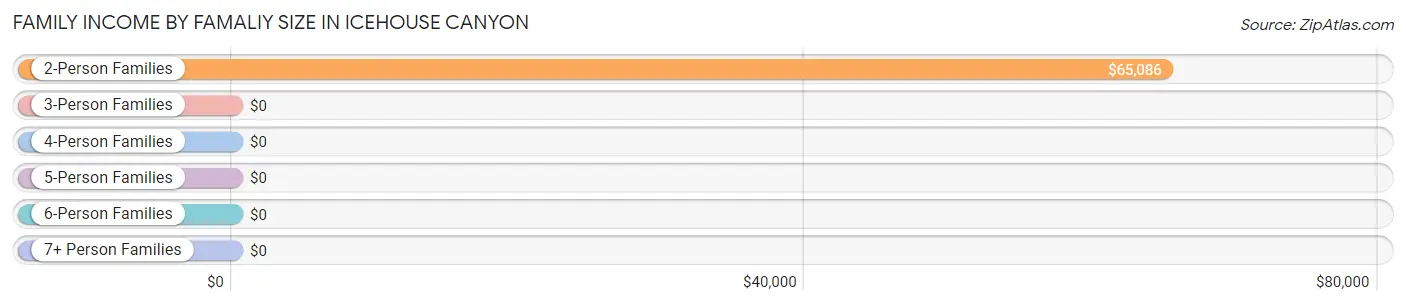
| Income Bracket | # Families | Median Income |
| 2-Person Families | 74 (50.0%) | $65,086 |
| 3-Person Families | 26 (17.6%) | $0 |
| 4-Person Families | 22 (14.9%) | $0 |
| 5-Person Families | 26 (17.6%) | $0 |
| 6-Person Families | 0 (0.0%) | $0 |
| 7+ Person Families | 0 (0.0%) | $0 |
| Total | 148 (100.0%) | $56,538 |
Family Income by Number of Earners in Icehouse Canyon
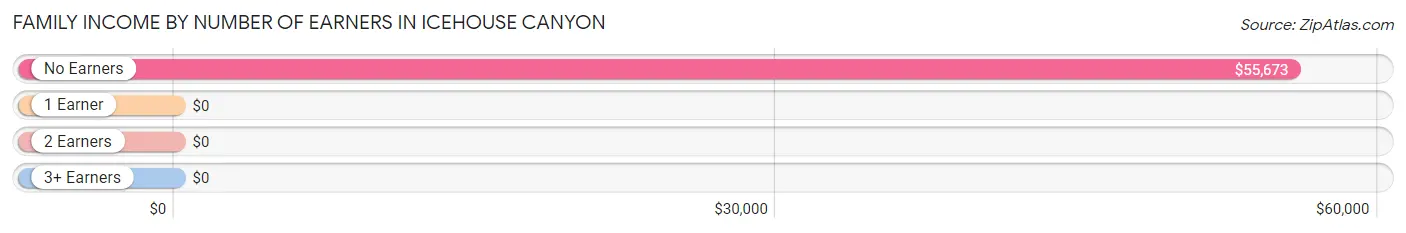
| Number of Earners | # Families | Median Income |
| No Earners | 96 (64.9%) | $55,673 |
| 1 Earner | 17 (11.5%) | $0 |
| 2 Earners | 35 (23.6%) | $0 |
| 3+ Earners | 0 (0.0%) | $0 |
| Total | 148 (100.0%) | $56,538 |
Household Income in Icehouse Canyon
Household Income Brackets in Icehouse Canyon
With 68 households falling in the category, the $35,000 to $49,999 income range is the most frequent in Icehouse Canyon, accounting for 29.3% of all households.
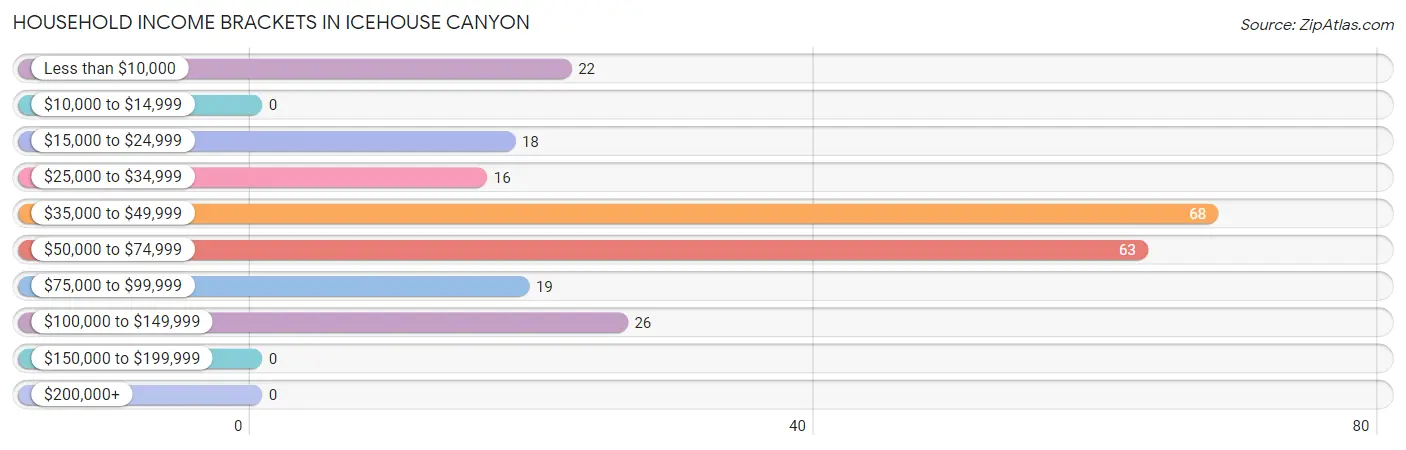
| Income Bracket | # Households | % Households |
| Less than $10,000 | 22 | 9.5% |
| $10,000 to $14,999 | 0 | 0.0% |
| $15,000 to $24,999 | 18 | 7.8% |
| $25,000 to $34,999 | 16 | 6.9% |
| $35,000 to $49,999 | 68 | 29.3% |
| $50,000 to $74,999 | 63 | 27.2% |
| $75,000 to $99,999 | 19 | 8.2% |
| $100,000 to $149,999 | 26 | 11.2% |
| $150,000 to $199,999 | 0 | 0.0% |
| $200,000+ | 0 | 0.0% |
Household Income by Householder Age in Icehouse Canyon
The median household income in Icehouse Canyon is $47,161, with the highest median household income of $55,192 found in the 65+ years age bracket for the primary householder. A total of 124 households (53.4%) fall into this category.
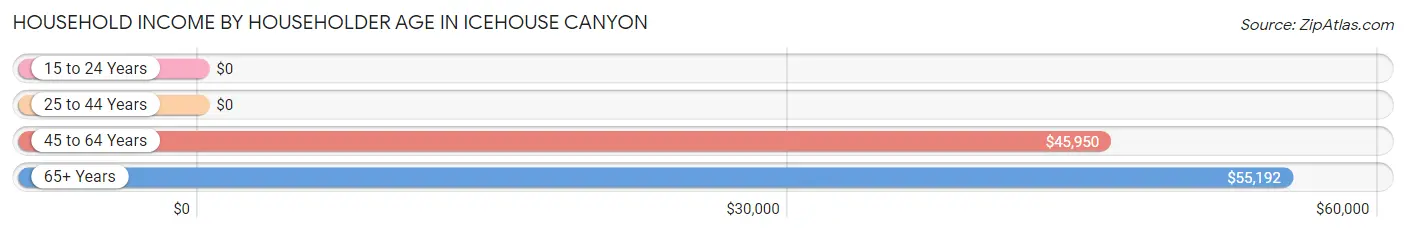
| Income Bracket | # Households | Median Income |
| 15 to 24 Years | 0 (0.0%) | $0 |
| 25 to 44 Years | 26 (11.2%) | $0 |
| 45 to 64 Years | 82 (35.3%) | $45,950 |
| 65+ Years | 124 (53.4%) | $55,192 |
| Total | 232 (100.0%) | $47,161 |
Poverty in Icehouse Canyon
Income Below Poverty by Sex and Age in Icehouse Canyon
With 17.8% poverty level for males and 19.1% for females among the residents of Icehouse Canyon, 45 to 54 year old males and 16 and 17 year old females are the most vulnerable to poverty, with 36 males (100.0%) and 20 females (62.5%) in their respective age groups living below the poverty level.
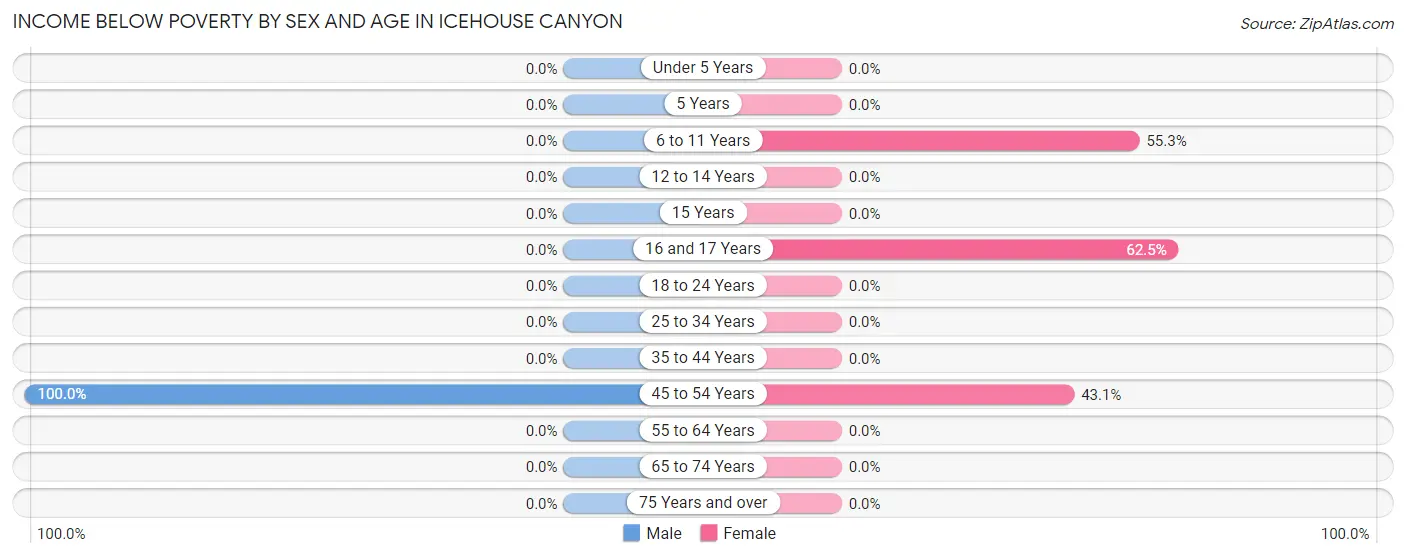
| Age Bracket | Male | Female |
| Under 5 Years | 0 (0.0%) | 0 (0.0%) |
| 5 Years | 0 (0.0%) | 0 (0.0%) |
| 6 to 11 Years | 0 (0.0%) | 21 (55.3%) |
| 12 to 14 Years | 0 (0.0%) | 0 (0.0%) |
| 15 Years | 0 (0.0%) | 0 (0.0%) |
| 16 and 17 Years | 0 (0.0%) | 20 (62.5%) |
| 18 to 24 Years | 0 (0.0%) | 0 (0.0%) |
| 25 to 34 Years | 0 (0.0%) | 0 (0.0%) |
| 35 to 44 Years | 0 (0.0%) | 0 (0.0%) |
| 45 to 54 Years | 36 (100.0%) | 22 (43.1%) |
| 55 to 64 Years | 0 (0.0%) | 0 (0.0%) |
| 65 to 74 Years | 0 (0.0%) | 0 (0.0%) |
| 75 Years and over | 0 (0.0%) | 0 (0.0%) |
| Total | 36 (17.8%) | 63 (19.1%) |
Income Above Poverty by Sex and Age in Icehouse Canyon
According to the poverty statistics in Icehouse Canyon, males aged 12 to 14 years and females aged 35 to 44 years are the age groups that are most secure financially, with 100.0% of males and 100.0% of females in these age groups living above the poverty line.
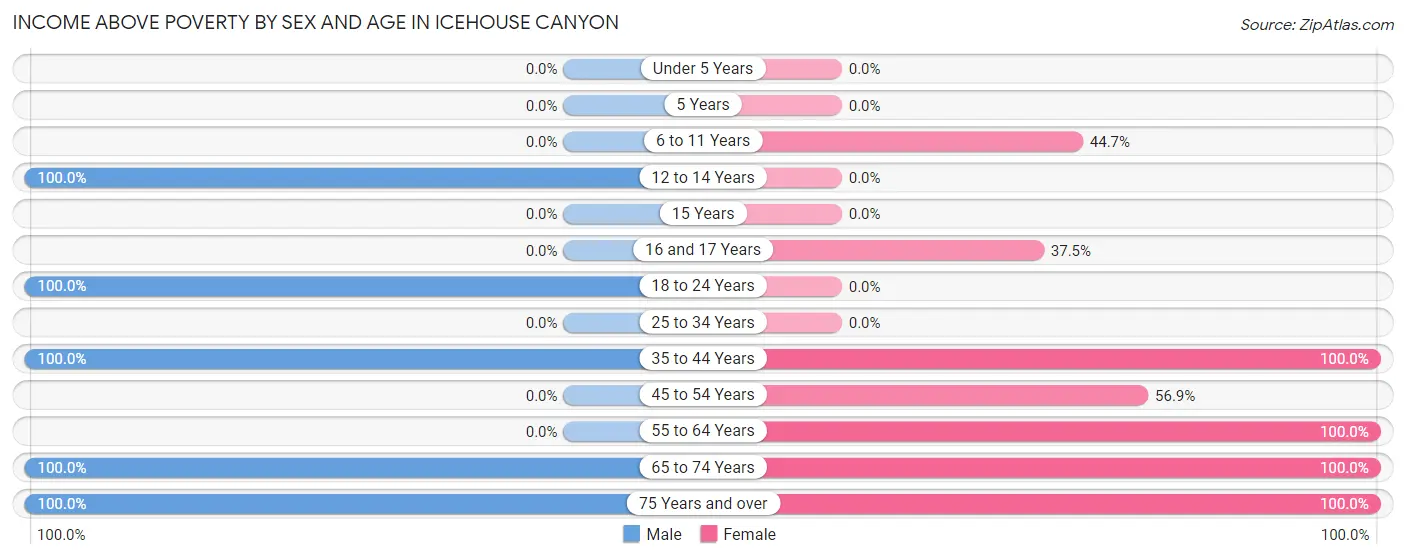
| Age Bracket | Male | Female |
| Under 5 Years | 0 (0.0%) | 0 (0.0%) |
| 5 Years | 0 (0.0%) | 0 (0.0%) |
| 6 to 11 Years | 0 (0.0%) | 17 (44.7%) |
| 12 to 14 Years | 32 (100.0%) | 0 (0.0%) |
| 15 Years | 0 (0.0%) | 0 (0.0%) |
| 16 and 17 Years | 0 (0.0%) | 12 (37.5%) |
| 18 to 24 Years | 10 (100.0%) | 0 (0.0%) |
| 25 to 34 Years | 0 (0.0%) | 0 (0.0%) |
| 35 to 44 Years | 26 (100.0%) | 38 (100.0%) |
| 45 to 54 Years | 0 (0.0%) | 29 (56.9%) |
| 55 to 64 Years | 0 (0.0%) | 69 (100.0%) |
| 65 to 74 Years | 46 (100.0%) | 63 (100.0%) |
| 75 Years and over | 52 (100.0%) | 39 (100.0%) |
| Total | 166 (82.2%) | 267 (80.9%) |
Income Below Poverty Among Married-Couple Families in Icehouse Canyon
The poverty statistics for married-couple families in Icehouse Canyon show that 16.9% or 22 of the total 130 families live below the poverty line. Families with 1 or 2 children have the highest poverty rate of 100.0%, comprising of 22 families. On the other hand, families with no children have the lowest poverty rate of 0.0%, which includes 0 families.
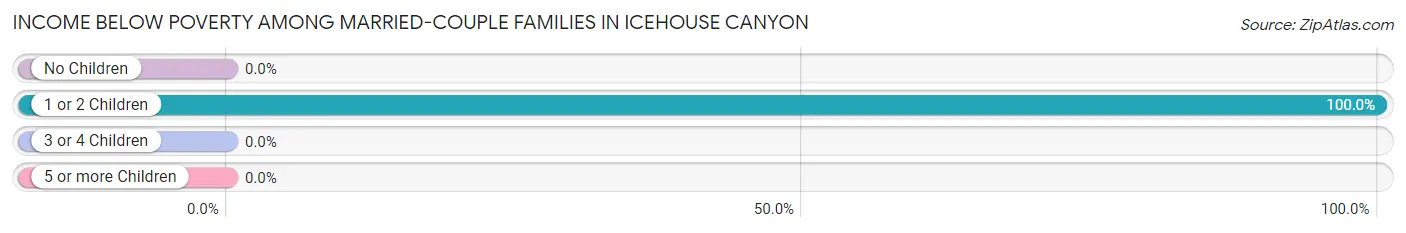
| Children | Above Poverty | Below Poverty |
| No Children | 82 (100.0%) | 0 (0.0%) |
| 1 or 2 Children | 0 (0.0%) | 22 (100.0%) |
| 3 or 4 Children | 26 (100.0%) | 0 (0.0%) |
| 5 or more Children | 0 (0.0%) | 0 (0.0%) |
| Total | 108 (83.1%) | 22 (16.9%) |
Income Below Poverty Among Single-Parent Households in Icehouse Canyon
| Children | Single Father | Single Mother |
| No Children | 0 (0.0%) | 0 (0.0%) |
| 1 or 2 Children | 0 (0.0%) | 0 (0.0%) |
| 3 or 4 Children | 0 (0.0%) | 0 (0.0%) |
| 5 or more Children | 0 (0.0%) | 0 (0.0%) |
| Total | 0 (0.0%) | 0 (0.0%) |
Income Below Poverty Among Married-Couple vs Single-Parent Households in Icehouse Canyon
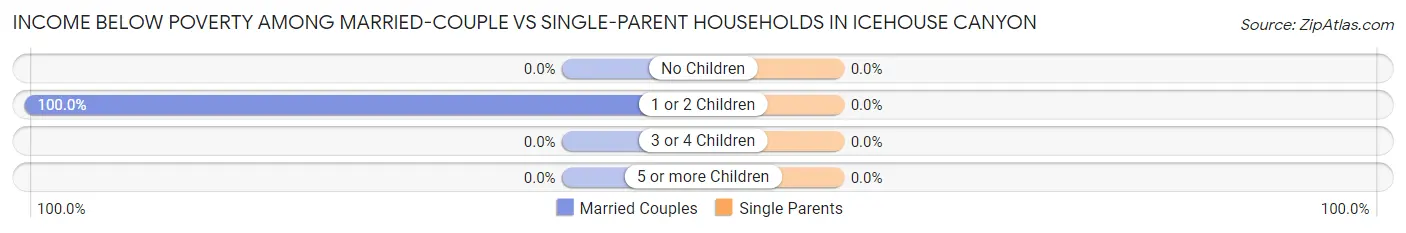
| Children | Married-Couple Families | Single-Parent Households |
| No Children | 0 (0.0%) | 0 (0.0%) |
| 1 or 2 Children | 22 (100.0%) | 0 (0.0%) |
| 3 or 4 Children | 0 (0.0%) | 0 (0.0%) |
| 5 or more Children | 0 (0.0%) | 0 (0.0%) |
| Total | 22 (16.9%) | 0 (0.0%) |
Race in Icehouse Canyon
The most populous races in Icehouse Canyon are White / Caucasian (482 | 90.6%), Two or more Races (50 | 9.4%), and Hispanic or Latino (46 | 8.6%).
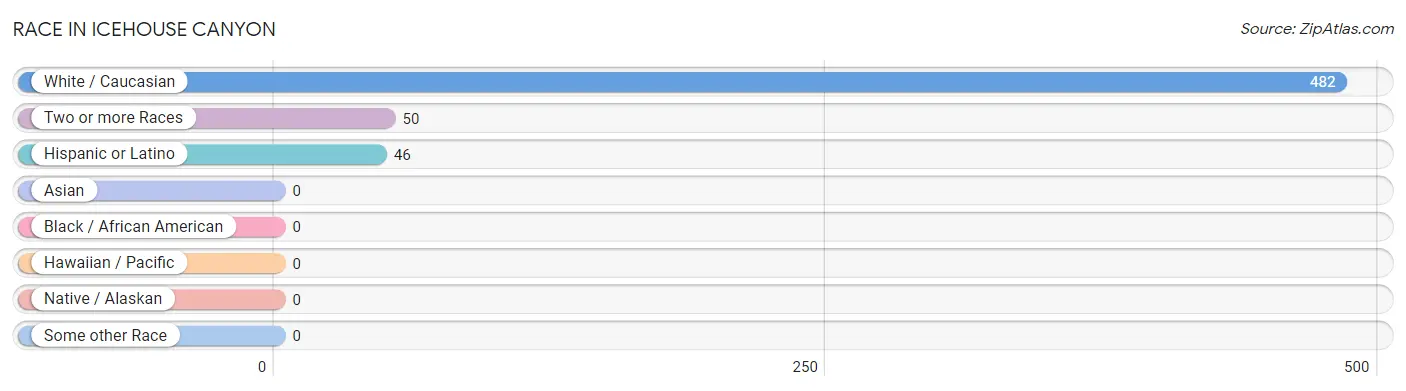
| Race | # Population | % Population |
| Asian | 0 | 0.0% |
| Black / African American | 0 | 0.0% |
| Hawaiian / Pacific | 0 | 0.0% |
| Hispanic or Latino | 46 | 8.6% |
| Native / Alaskan | 0 | 0.0% |
| White / Caucasian | 482 | 90.6% |
| Two or more Races | 50 | 9.4% |
| Some other Race | 0 | 0.0% |
| Total | 532 | 100.0% |
Ancestry in Icehouse Canyon
The most populous ancestries reported in Icehouse Canyon are German (196 | 36.8%), English (121 | 22.7%), Irish (88 | 16.5%), Cherokee (50 | 9.4%), and Polish (22 | 4.1%), together accounting for 89.7% of all Icehouse Canyon residents.
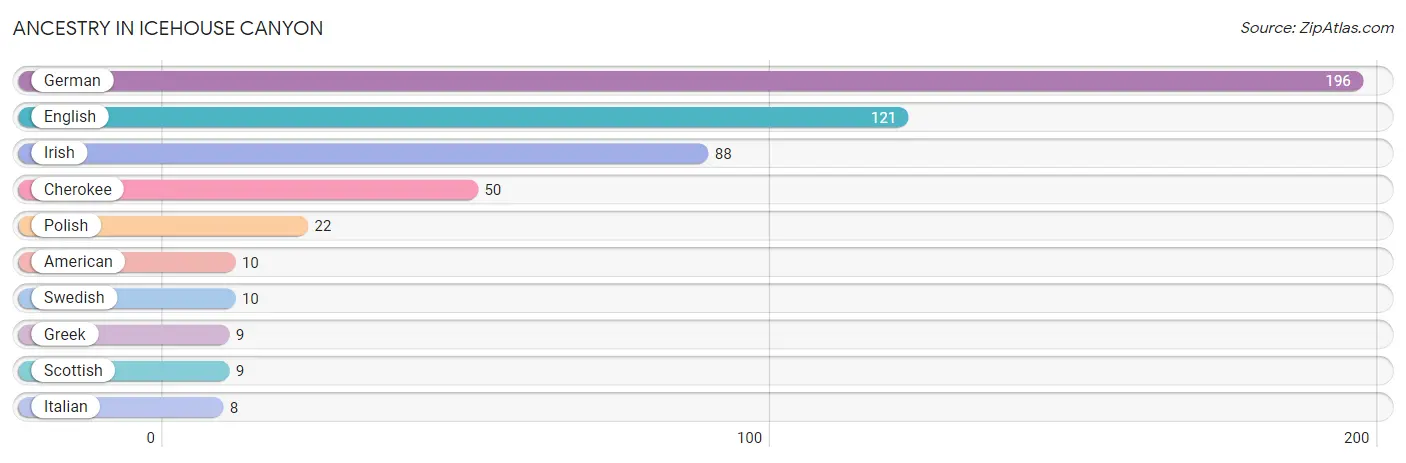
| Ancestry | # Population | % Population |
| American | 10 | 1.9% |
| Cherokee | 50 | 9.4% |
| English | 121 | 22.7% |
| German | 196 | 36.8% |
| Greek | 9 | 1.7% |
| Irish | 88 | 16.5% |
| Italian | 8 | 1.5% |
| Polish | 22 | 4.1% |
| Scottish | 9 | 1.7% |
| Swedish | 10 | 1.9% | View All 10 Rows |
Immigrants in Icehouse Canyon
The most numerous immigrant groups reported in Icehouse Canyon came from , and Canada (9 | 1.7%), together accounting for 1.7% of all Icehouse Canyon residents.

| Immigration Origin | # Population | % Population |
| Canada | 9 | 1.7% | View All 1 Rows |
Sex and Age in Icehouse Canyon
Sex and Age in Icehouse Canyon
The most populous age groups in Icehouse Canyon are 75 to 79 Years (44 | 21.8%) for men and 55 to 59 Years (50 | 15.1%) for women.
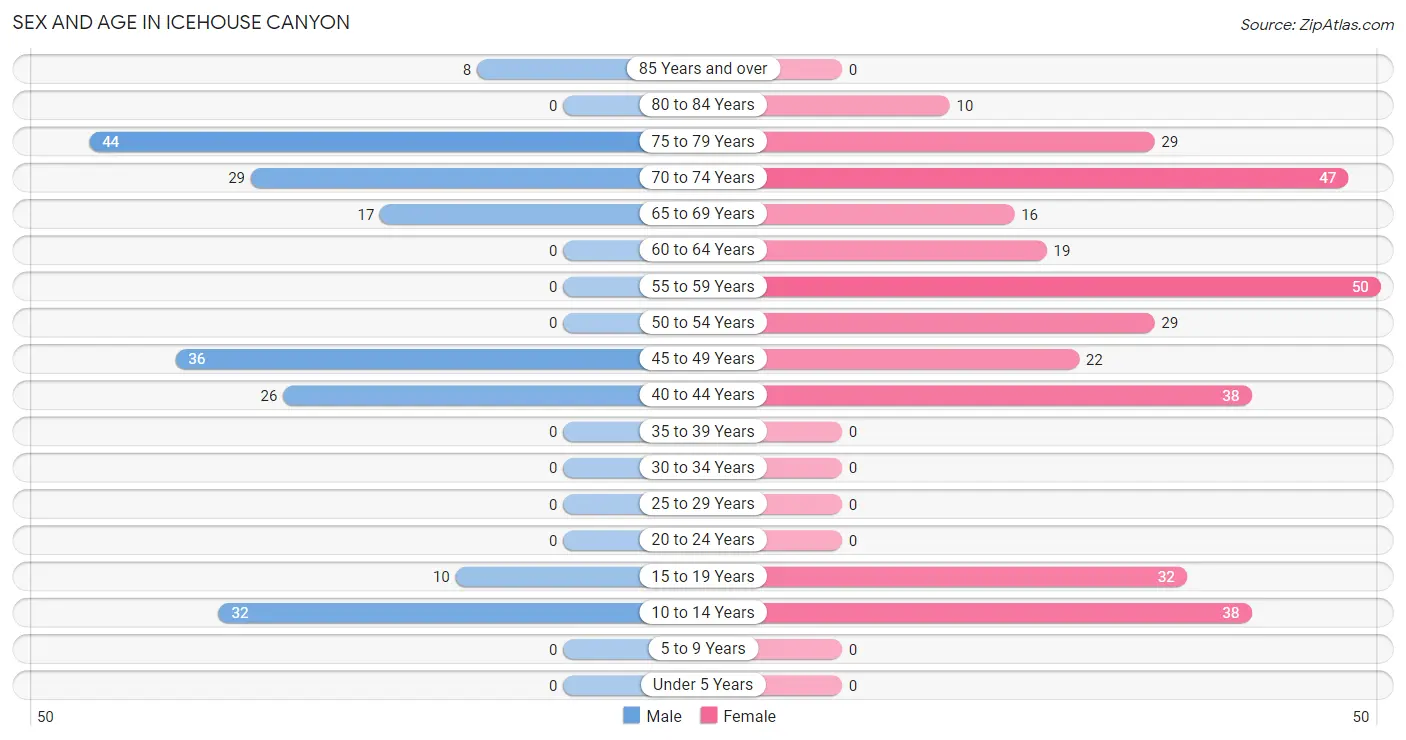
| Age Bracket | Male | Female |
| Under 5 Years | 0 (0.0%) | 0 (0.0%) |
| 5 to 9 Years | 0 (0.0%) | 0 (0.0%) |
| 10 to 14 Years | 32 (15.8%) | 38 (11.5%) |
| 15 to 19 Years | 10 (5.0%) | 32 (9.7%) |
| 20 to 24 Years | 0 (0.0%) | 0 (0.0%) |
| 25 to 29 Years | 0 (0.0%) | 0 (0.0%) |
| 30 to 34 Years | 0 (0.0%) | 0 (0.0%) |
| 35 to 39 Years | 0 (0.0%) | 0 (0.0%) |
| 40 to 44 Years | 26 (12.9%) | 38 (11.5%) |
| 45 to 49 Years | 36 (17.8%) | 22 (6.7%) |
| 50 to 54 Years | 0 (0.0%) | 29 (8.8%) |
| 55 to 59 Years | 0 (0.0%) | 50 (15.1%) |
| 60 to 64 Years | 0 (0.0%) | 19 (5.8%) |
| 65 to 69 Years | 17 (8.4%) | 16 (4.9%) |
| 70 to 74 Years | 29 (14.4%) | 47 (14.2%) |
| 75 to 79 Years | 44 (21.8%) | 29 (8.8%) |
| 80 to 84 Years | 0 (0.0%) | 10 (3.0%) |
| 85 Years and over | 8 (4.0%) | 0 (0.0%) |
| Total | 202 (100.0%) | 330 (100.0%) |
Families and Households in Icehouse Canyon
Median Family Size in Icehouse Canyon
The median family size in Icehouse Canyon is 3.03 persons per family, with married-couple families (130 | 87.8%) accounting for the largest median family size of 3.17 persons per family. On the other hand, single female/mother families (10 | 6.8%) represent the smallest median family size with 1.80 persons per family.
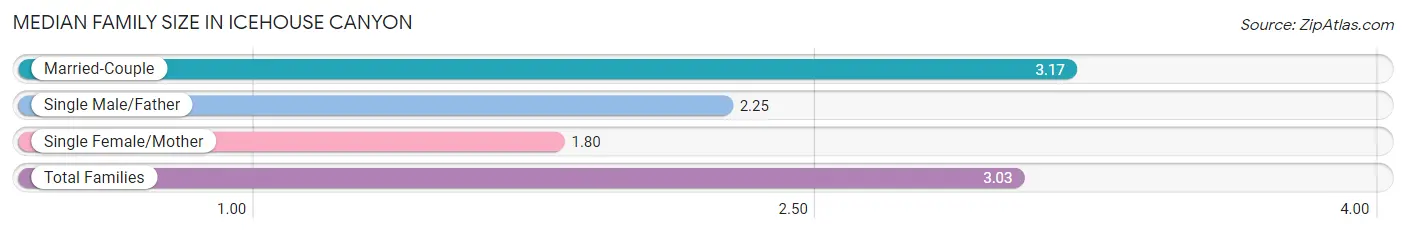
| Family Type | # Families | Family Size |
| Married-Couple | 130 (87.8%) | 3.17 |
| Single Male/Father | 8 (5.4%) | 2.25 |
| Single Female/Mother | 10 (6.8%) | 1.80 |
| Total Families | 148 (100.0%) | 3.03 |
Median Household Size in Icehouse Canyon
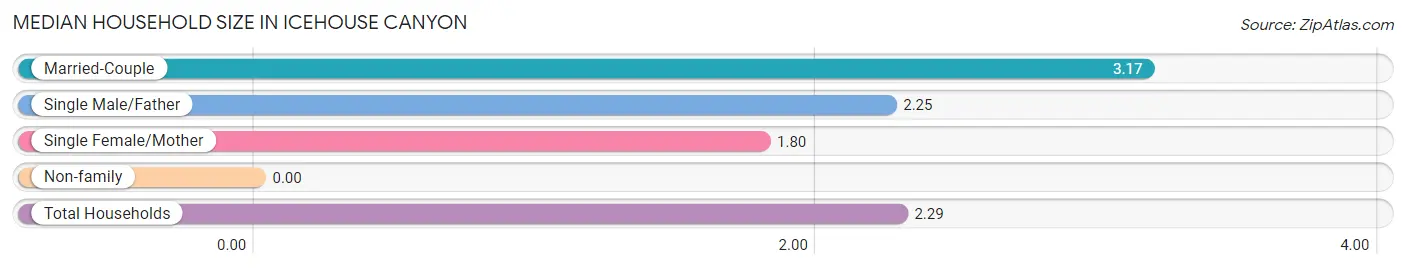
| Household Type | # Households | Household Size |
| Married-Couple | 130 (56.0%) | 3.17 |
| Single Male/Father | 8 (3.5%) | 2.25 |
| Single Female/Mother | 10 (4.3%) | 1.80 |
| Non-family | 84 (36.2%) | - |
| Total Households | 232 (100.0%) | 2.29 |
Household Size by Marriage Status in Icehouse Canyon
Out of a total of 232 households in Icehouse Canyon, 148 (63.8%) are family households, while 84 (36.2%) are nonfamily households. The most numerous type of family households are 2-person households, comprising 74, and the most common type of nonfamily households are 1-person households, comprising 84.
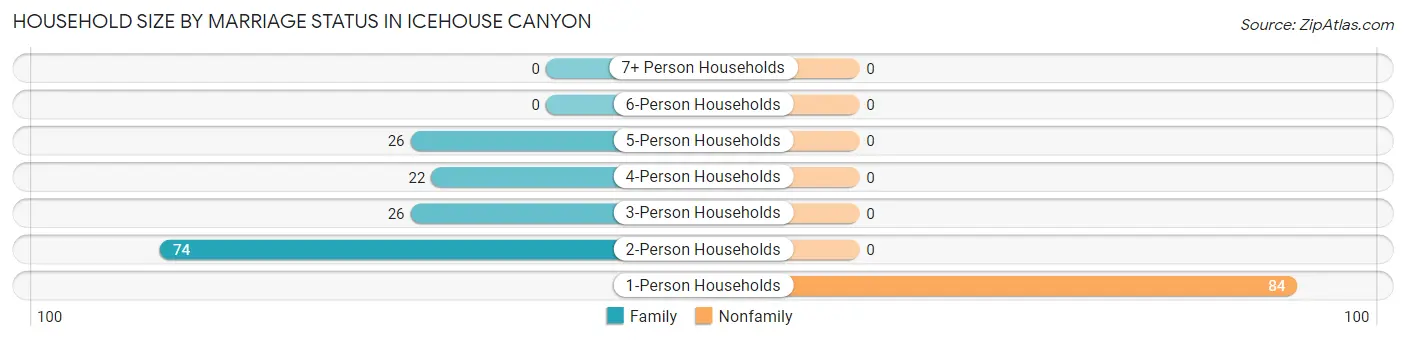
| Household Size | Family Households | Nonfamily Households |
| 1-Person Households | - | 84 (36.2%) |
| 2-Person Households | 74 (31.9%) | 0 (0.0%) |
| 3-Person Households | 26 (11.2%) | 0 (0.0%) |
| 4-Person Households | 22 (9.5%) | 0 (0.0%) |
| 5-Person Households | 26 (11.2%) | 0 (0.0%) |
| 6-Person Households | 0 (0.0%) | 0 (0.0%) |
| 7+ Person Households | 0 (0.0%) | 0 (0.0%) |
| Total | 148 (63.8%) | 84 (36.2%) |
Female Fertility in Icehouse Canyon
Fertility by Age in Icehouse Canyon
| Age Bracket | Women with Births | Births / 1,000 Women |
| 15 to 19 years | 0 (0.0%) | 0.0 |
| 20 to 34 years | 0 (0.0%) | 0.0 |
| 35 to 50 years | 0 (0.0%) | 0.0 |
| Total | 0 (0.0%) | 0.0 |
Fertility by Age by Marriage Status in Icehouse Canyon
| Age Bracket | Married | Unmarried |
| 15 to 19 years | 0 (0.0%) | 0 (0.0%) |
| 20 to 34 years | 0 (0.0%) | 0 (0.0%) |
| 35 to 50 years | 0 (0.0%) | 0 (0.0%) |
| Total | 0 (0.0%) | 0 (0.0%) |
Fertility by Education in Icehouse Canyon
| Educational Attainment | Women with Births | Births / 1,000 Women |
| Less than High School | 0 (0.0%) | 0.0 |
| High School Diploma | 0 (0.0%) | 0.0 |
| College or Associate's Degree | 0 (0.0%) | 0.0 |
| Bachelor's Degree | 0 (0.0%) | 0.0 |
| Graduate Degree | 0 (0.0%) | 0.0 |
| Total | 0 (0.0%) | 0.0 |
Fertility by Education by Marriage Status in Icehouse Canyon
| Educational Attainment | Married | Unmarried |
| Less than High School | 0 (0.0%) | 0 (0.0%) |
| High School Diploma | 0 (0.0%) | 0 (0.0%) |
| College or Associate's Degree | 0 (0.0%) | 0 (0.0%) |
| Bachelor's Degree | 0 (0.0%) | 0 (0.0%) |
| Graduate Degree | 0 (0.0%) | 0 (0.0%) |
| Total | 0 (0.0%) | 0 (0.0%) |
Employment Characteristics in Icehouse Canyon
Employment by Class of Employer in Icehouse Canyon
Among the 153 employed individuals in Icehouse Canyon, private company employees (104 | 68.0%), local government employees (40 | 26.1%), and self-employed (incorporated) (9 | 5.9%) make up the most common classes of employment.
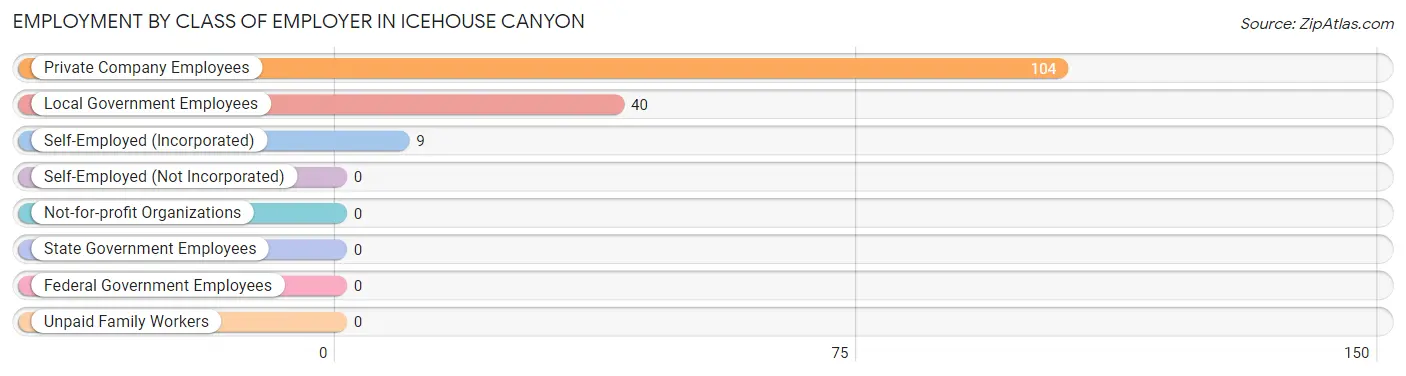
| Employer Class | # Employees | % Employees |
| Private Company Employees | 104 | 68.0% |
| Self-Employed (Incorporated) | 9 | 5.9% |
| Self-Employed (Not Incorporated) | 0 | 0.0% |
| Not-for-profit Organizations | 0 | 0.0% |
| Local Government Employees | 40 | 26.1% |
| State Government Employees | 0 | 0.0% |
| Federal Government Employees | 0 | 0.0% |
| Unpaid Family Workers | 0 | 0.0% |
| Total | 153 | 100.0% |
Employment Status by Age in Icehouse Canyon
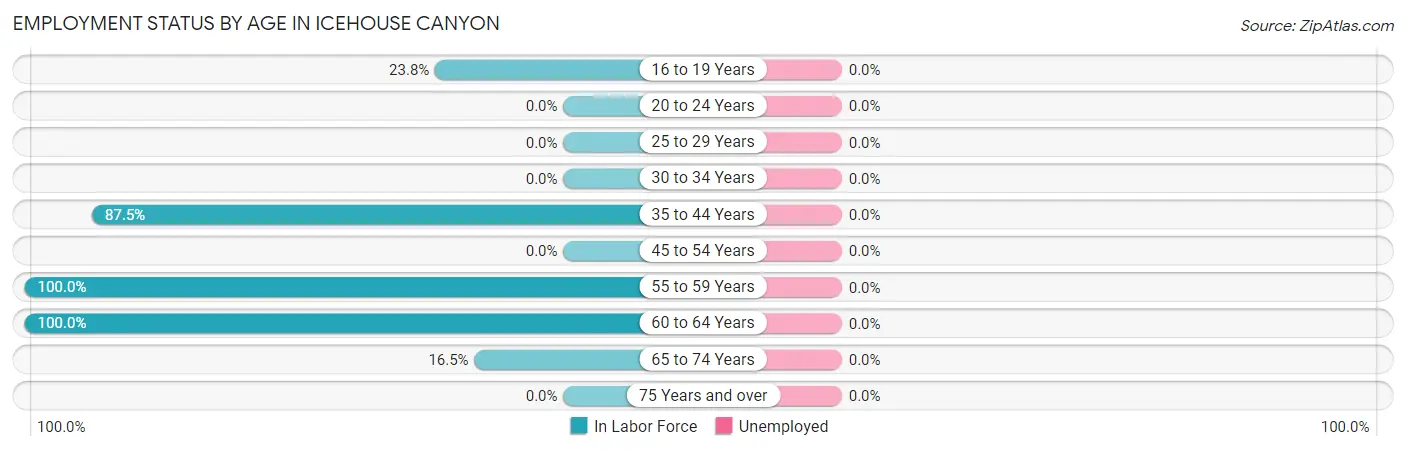
| Age Bracket | In Labor Force | Unemployed |
| 16 to 19 Years | 10 (23.8%) | 0 (0.0%) |
| 20 to 24 Years | 0 (0.0%) | 0 (0.0%) |
| 25 to 29 Years | 0 (0.0%) | 0 (0.0%) |
| 30 to 34 Years | 0 (0.0%) | 0 (0.0%) |
| 35 to 44 Years | 56 (87.5%) | 0 (0.0%) |
| 45 to 54 Years | 0 (0.0%) | 0 (0.0%) |
| 55 to 59 Years | 50 (100.0%) | 0 (0.0%) |
| 60 to 64 Years | 19 (100.0%) | 0 (0.0%) |
| 65 to 74 Years | 18 (16.5%) | 0 (0.0%) |
| 75 Years and over | 0 (0.0%) | 0 (0.0%) |
| Total | 153 (33.1%) | 0 (0.0%) |
Employment Status by Educational Attainment in Icehouse Canyon
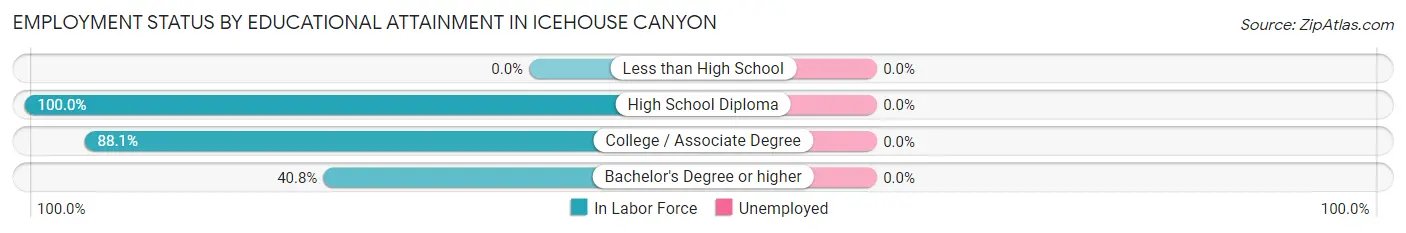
| Educational Attainment | In Labor Force | Unemployed |
| Less than High School | 0 (0.0%) | 0 (0.0%) |
| High School Diploma | 26 (100.0%) | 0 (0.0%) |
| College / Associate Degree | 59 (88.1%) | 0 (0.0%) |
| Bachelor's Degree or higher | 40 (40.8%) | 0 (0.0%) |
| Total | 125 (56.8%) | 0 (0.0%) |
Employment Occupations by Sex in Icehouse Canyon
Management, Business, Science and Arts Occupations
The most common Management, Business, Science and Arts occupations in Icehouse Canyon are Community & Social Service (30 | 19.6%), Education Instruction & Library (30 | 19.6%), Computers, Engineering & Science (10 | 6.5%), Life, Physical & Social Science (10 | 6.5%), and Health Diagnosing & Treating (9 | 5.9%).
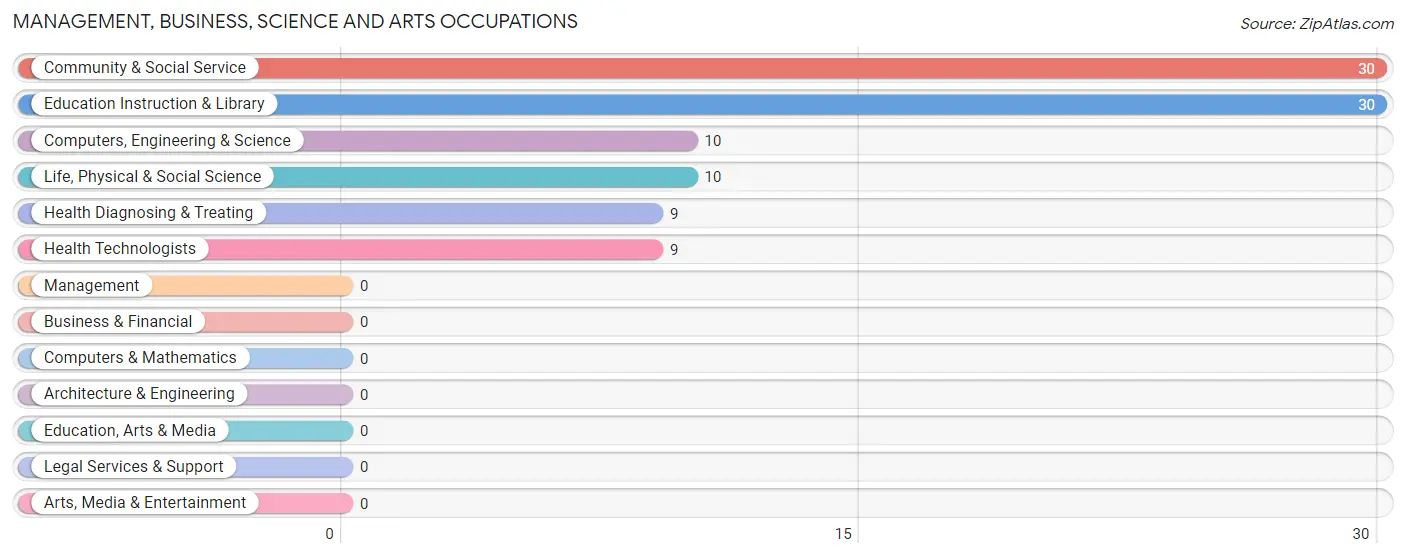
Management, Business, Science and Arts Occupations by Sex
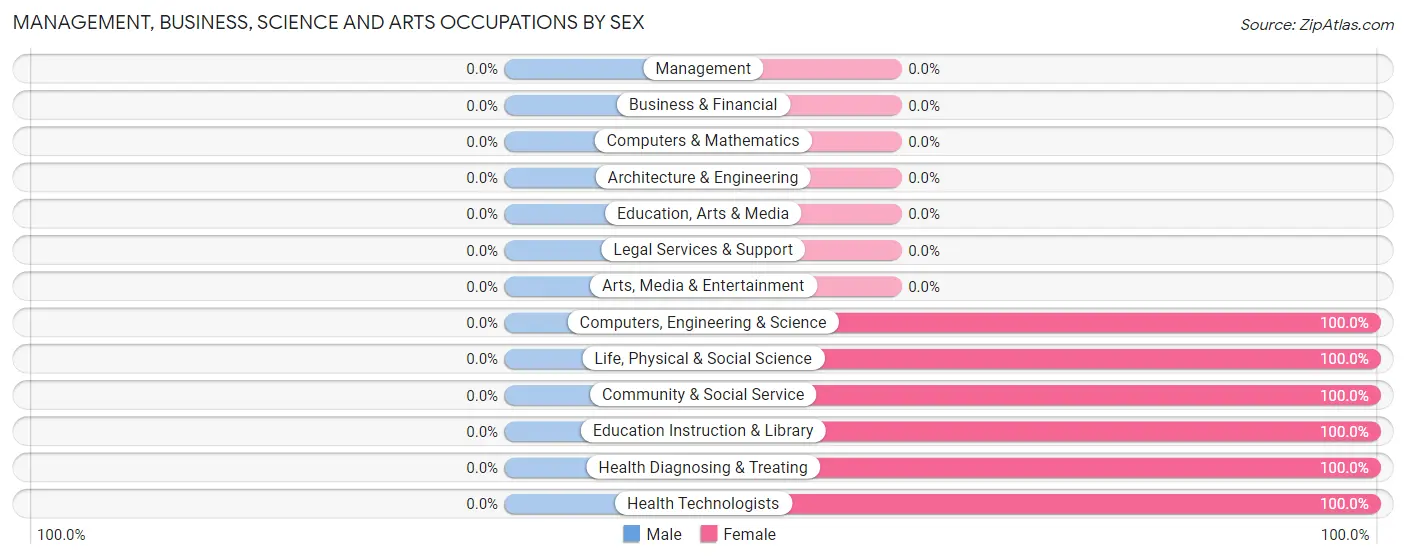
| Occupation | Male | Female |
| Management | 0 (0.0%) | 0 (0.0%) |
| Business & Financial | 0 (0.0%) | 0 (0.0%) |
| Computers, Engineering & Science | 0 (0.0%) | 10 (100.0%) |
| Computers & Mathematics | 0 (0.0%) | 0 (0.0%) |
| Architecture & Engineering | 0 (0.0%) | 0 (0.0%) |
| Life, Physical & Social Science | 0 (0.0%) | 10 (100.0%) |
| Community & Social Service | 0 (0.0%) | 30 (100.0%) |
| Education, Arts & Media | 0 (0.0%) | 0 (0.0%) |
| Legal Services & Support | 0 (0.0%) | 0 (0.0%) |
| Education Instruction & Library | 0 (0.0%) | 30 (100.0%) |
| Arts, Media & Entertainment | 0 (0.0%) | 0 (0.0%) |
| Health Diagnosing & Treating | 0 (0.0%) | 9 (100.0%) |
| Health Technologists | 0 (0.0%) | 9 (100.0%) |
| Total (Category) | 0 (0.0%) | 49 (100.0%) |
| Total (Overall) | 45 (29.4%) | 108 (70.6%) |
Services Occupations
The most common Services occupations in Icehouse Canyon are , and Personal Care & Service (50 | 32.7%).
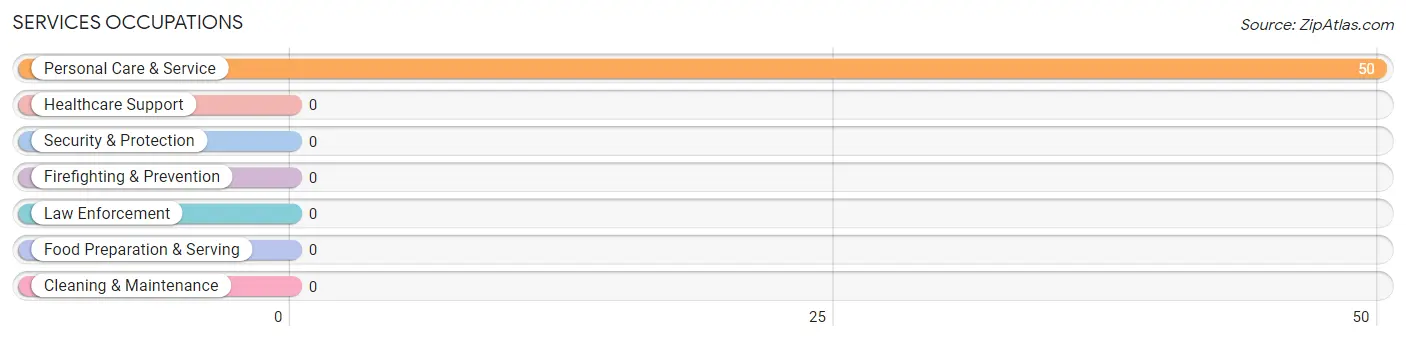
Services Occupations by Sex
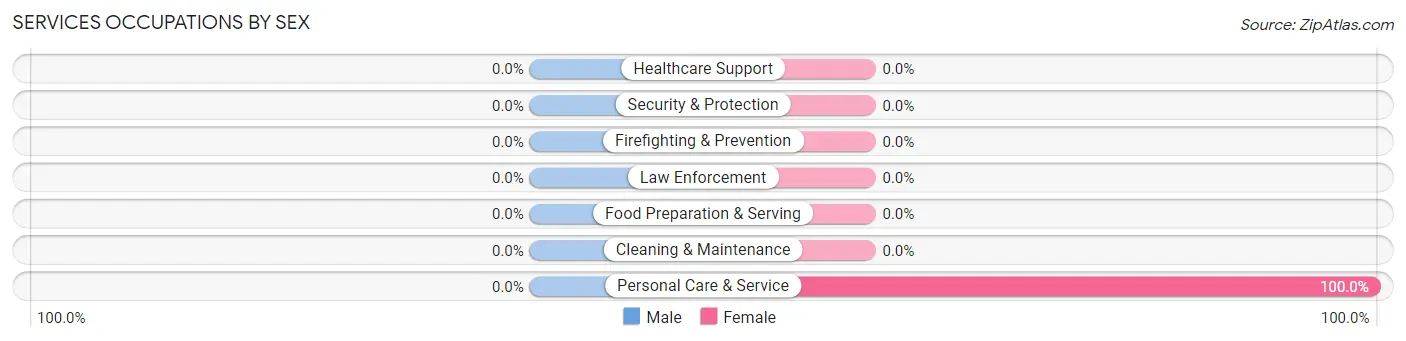
| Occupation | Male | Female |
| Healthcare Support | 0 (0.0%) | 0 (0.0%) |
| Security & Protection | 0 (0.0%) | 0 (0.0%) |
| Firefighting & Prevention | 0 (0.0%) | 0 (0.0%) |
| Law Enforcement | 0 (0.0%) | 0 (0.0%) |
| Food Preparation & Serving | 0 (0.0%) | 0 (0.0%) |
| Cleaning & Maintenance | 0 (0.0%) | 0 (0.0%) |
| Personal Care & Service | 0 (0.0%) | 50 (100.0%) |
| Total (Category) | 0 (0.0%) | 50 (100.0%) |
| Total (Overall) | 45 (29.4%) | 108 (70.6%) |
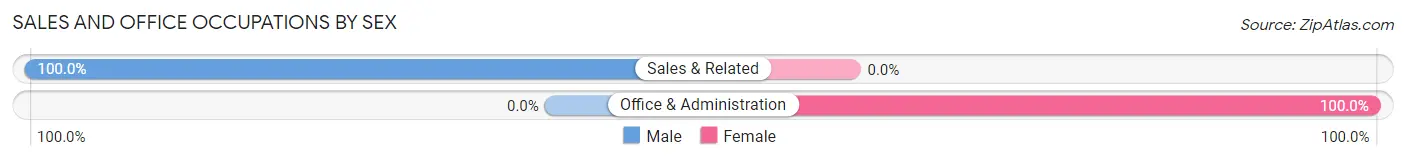
Sales and Office Occupations
The most common Sales and Office occupations in Icehouse Canyon are Sales & Related (10 | 6.5%), and Office & Administration (9 | 5.9%).
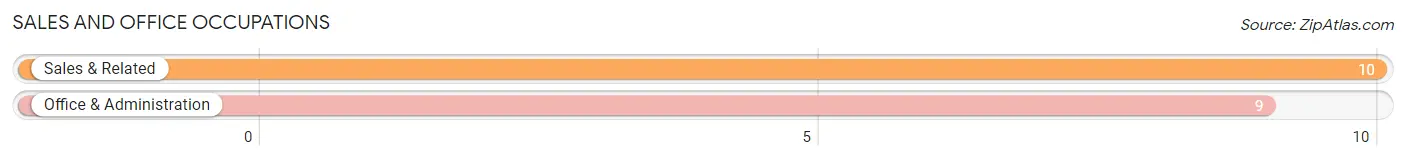
Sales and Office Occupations by Sex
| Occupation | Male | Female |
| Sales & Related | 10 (100.0%) | 0 (0.0%) |
| Office & Administration | 0 (0.0%) | 9 (100.0%) |
| Total (Category) | 10 (52.6%) | 9 (47.4%) |
| Total (Overall) | 45 (29.4%) | 108 (70.6%) |
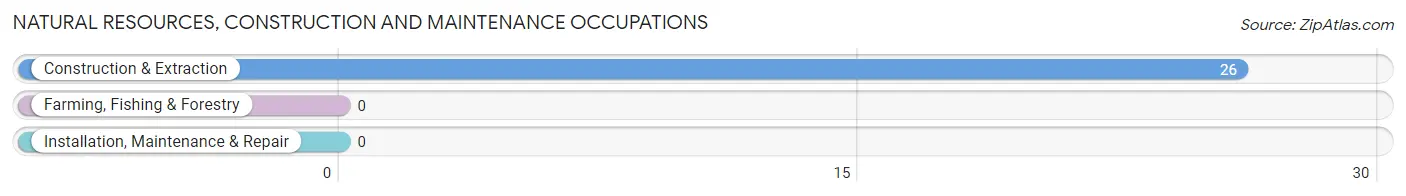
Natural Resources, Construction and Maintenance Occupations
The most common Natural Resources, Construction and Maintenance occupations in Icehouse Canyon are , and Construction & Extraction (26 | 17.0%).
Natural Resources, Construction and Maintenance Occupations by Sex
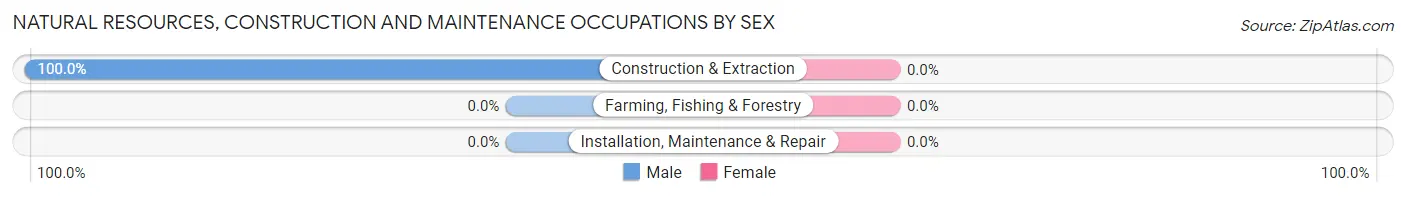
| Occupation | Male | Female |
| Farming, Fishing & Forestry | 0 (0.0%) | 0 (0.0%) |
| Construction & Extraction | 26 (100.0%) | 0 (0.0%) |
| Installation, Maintenance & Repair | 0 (0.0%) | 0 (0.0%) |
| Total (Category) | 26 (100.0%) | 0 (0.0%) |
| Total (Overall) | 45 (29.4%) | 108 (70.6%) |
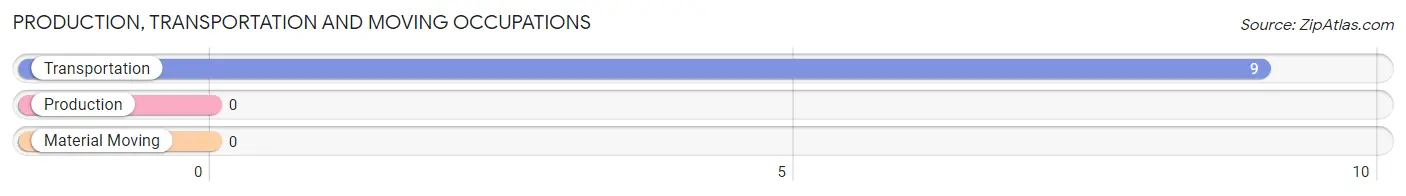
Production, Transportation and Moving Occupations
The most common Production, Transportation and Moving occupations in Icehouse Canyon are , and Transportation (9 | 5.9%).
Production, Transportation and Moving Occupations by Sex
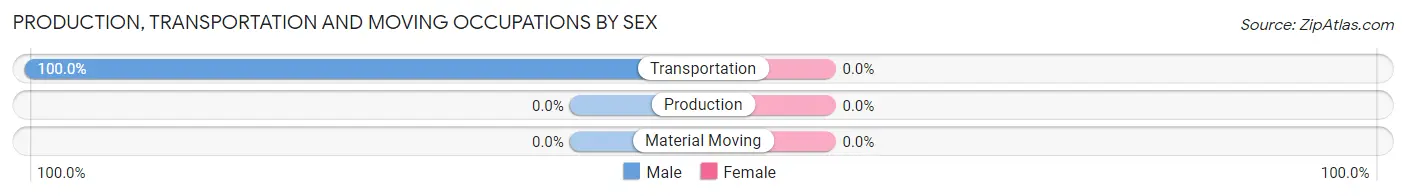
| Occupation | Male | Female |
| Production | 0 (0.0%) | 0 (0.0%) |
| Transportation | 9 (100.0%) | 0 (0.0%) |
| Material Moving | 0 (0.0%) | 0 (0.0%) |
| Total (Category) | 9 (100.0%) | 0 (0.0%) |
| Total (Overall) | 45 (29.4%) | 108 (70.6%) |
Employment Industries by Sex in Icehouse Canyon
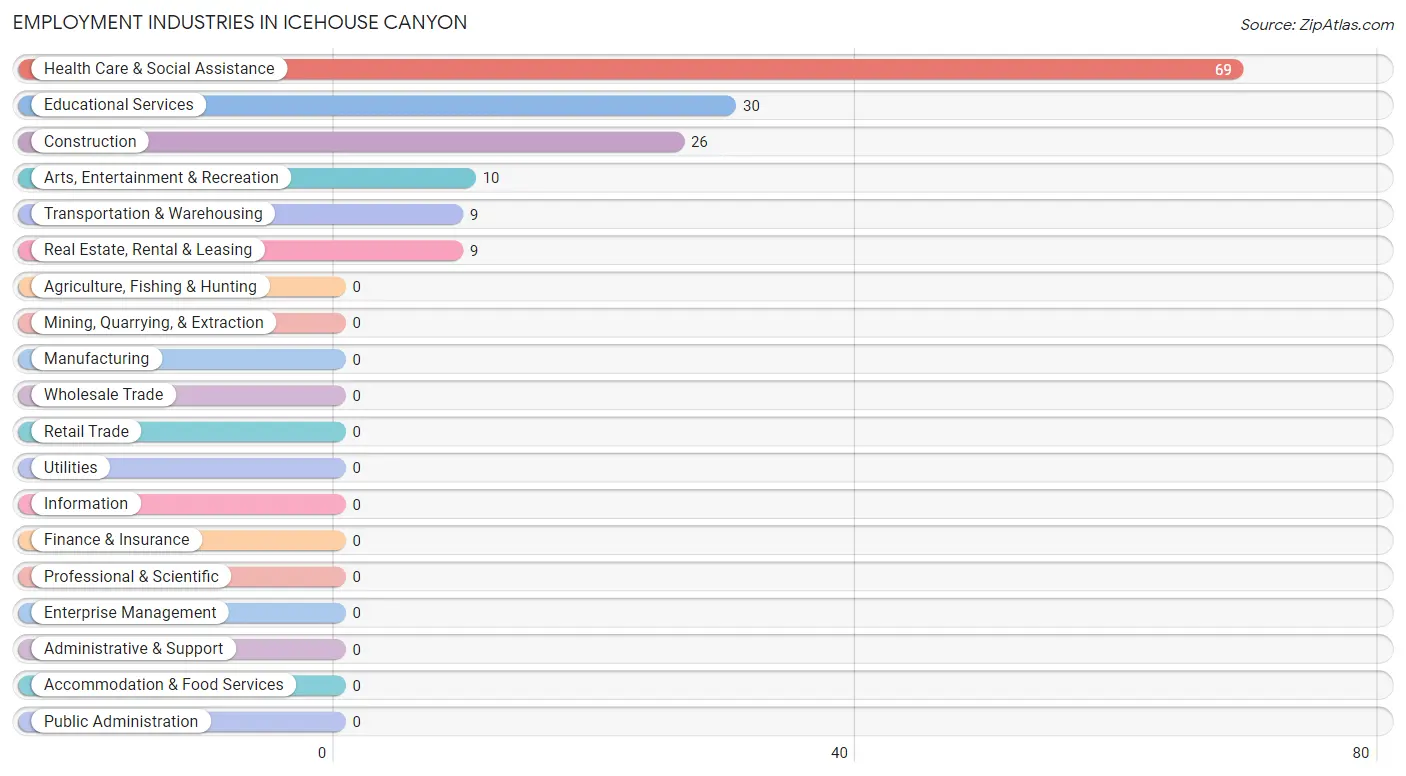
Employment Industries in Icehouse Canyon
The major employment industries in Icehouse Canyon include Health Care & Social Assistance (69 | 45.1%), Educational Services (30 | 19.6%), Construction (26 | 17.0%), Arts, Entertainment & Recreation (10 | 6.5%), and Transportation & Warehousing (9 | 5.9%).
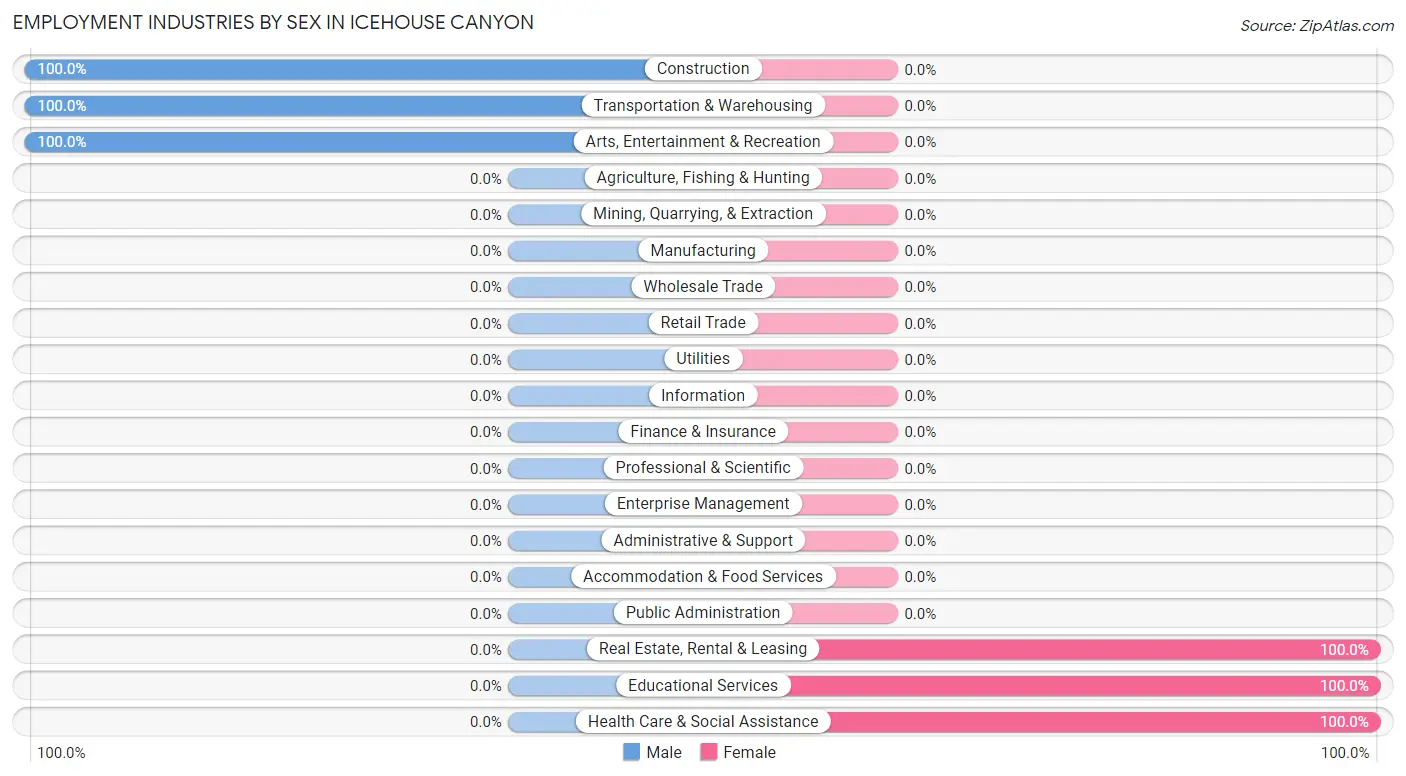
Employment Industries by Sex in Icehouse Canyon
The Icehouse Canyon industries that see more men than women are Construction (100.0%), Transportation & Warehousing (100.0%), and Arts, Entertainment & Recreation (100.0%), whereas the industries that tend to have a higher number of women are Real Estate, Rental & Leasing (100.0%), Educational Services (100.0%), and Health Care & Social Assistance (100.0%).
| Industry | Male | Female |
| Agriculture, Fishing & Hunting | 0 (0.0%) | 0 (0.0%) |
| Mining, Quarrying, & Extraction | 0 (0.0%) | 0 (0.0%) |
| Construction | 26 (100.0%) | 0 (0.0%) |
| Manufacturing | 0 (0.0%) | 0 (0.0%) |
| Wholesale Trade | 0 (0.0%) | 0 (0.0%) |
| Retail Trade | 0 (0.0%) | 0 (0.0%) |
| Transportation & Warehousing | 9 (100.0%) | 0 (0.0%) |
| Utilities | 0 (0.0%) | 0 (0.0%) |
| Information | 0 (0.0%) | 0 (0.0%) |
| Finance & Insurance | 0 (0.0%) | 0 (0.0%) |
| Real Estate, Rental & Leasing | 0 (0.0%) | 9 (100.0%) |
| Professional & Scientific | 0 (0.0%) | 0 (0.0%) |
| Enterprise Management | 0 (0.0%) | 0 (0.0%) |
| Administrative & Support | 0 (0.0%) | 0 (0.0%) |
| Educational Services | 0 (0.0%) | 30 (100.0%) |
| Health Care & Social Assistance | 0 (0.0%) | 69 (100.0%) |
| Arts, Entertainment & Recreation | 10 (100.0%) | 0 (0.0%) |
| Accommodation & Food Services | 0 (0.0%) | 0 (0.0%) |
| Public Administration | 0 (0.0%) | 0 (0.0%) |
| Total | 45 (29.4%) | 108 (70.6%) |
Education in Icehouse Canyon
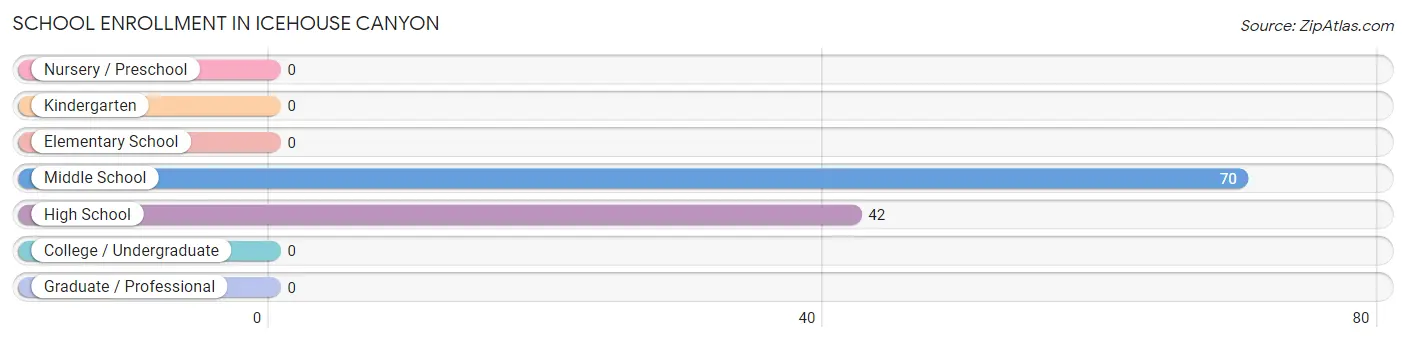
School Enrollment in Icehouse Canyon
The most common levels of schooling among the 112 students in Icehouse Canyon are middle school (70 | 62.5%), and high school (42 | 37.5%).
| School Level | # Students | % Students |
| Nursery / Preschool | 0 | 0.0% |
| Kindergarten | 0 | 0.0% |
| Elementary School | 0 | 0.0% |
| Middle School | 70 | 62.5% |
| High School | 42 | 37.5% |
| College / Undergraduate | 0 | 0.0% |
| Graduate / Professional | 0 | 0.0% |
| Total | 112 | 100.0% |
School Enrollment by Age by Funding Source in Icehouse Canyon
Out of a total of 112 students who are enrolled in schools in Icehouse Canyon, 20 (17.9%) attend a private institution, while the remaining 92 (82.1%) are enrolled in public schools. The age group of 15 to 17 year olds has the highest likelihood of being enrolled in private schools, with 20 (62.5% in the age bracket) enrolled. Conversely, the age group of 10 to 14 year olds has the lowest likelihood of being enrolled in a private school, with 70 (100.0% in the age bracket) attending a public institution.
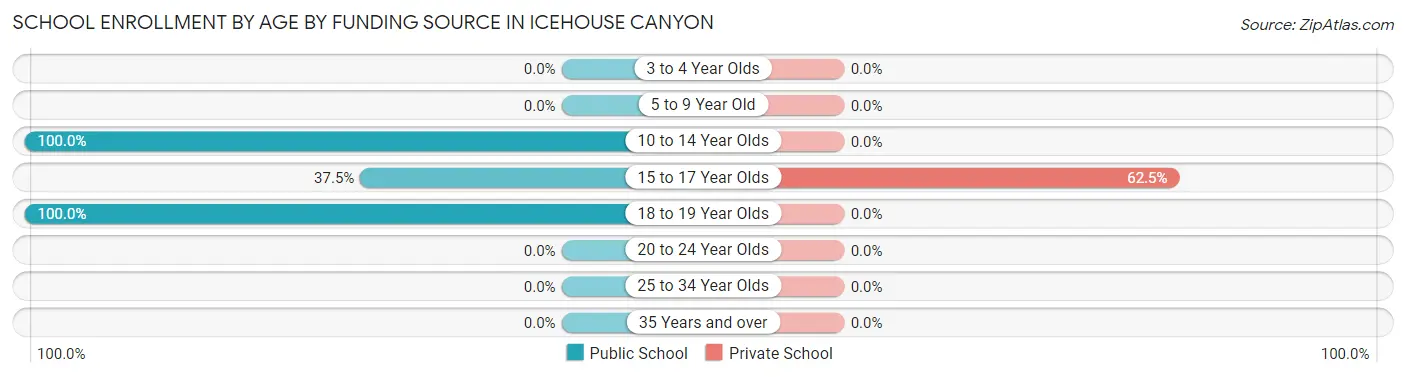
| Age Bracket | Public School | Private School |
| 3 to 4 Year Olds | 0 (0.0%) | 0 (0.0%) |
| 5 to 9 Year Old | 0 (0.0%) | 0 (0.0%) |
| 10 to 14 Year Olds | 70 (100.0%) | 0 (0.0%) |
| 15 to 17 Year Olds | 12 (37.5%) | 20 (62.5%) |
| 18 to 19 Year Olds | 10 (100.0%) | 0 (0.0%) |
| 20 to 24 Year Olds | 0 (0.0%) | 0 (0.0%) |
| 25 to 34 Year Olds | 0 (0.0%) | 0 (0.0%) |
| 35 Years and over | 0 (0.0%) | 0 (0.0%) |
| Total | 92 (82.1%) | 20 (17.9%) |
Educational Attainment by Field of Study in Icehouse Canyon
Liberal arts & history (36 | 21.6%), multidisciplinary studies (30 | 18.0%), science & technology (30 | 18.0%), business (30 | 18.0%), and bio, nature & agricultural (22 | 13.2%) are the most common fields of study among 167 individuals in Icehouse Canyon who have obtained a bachelor's degree or higher.
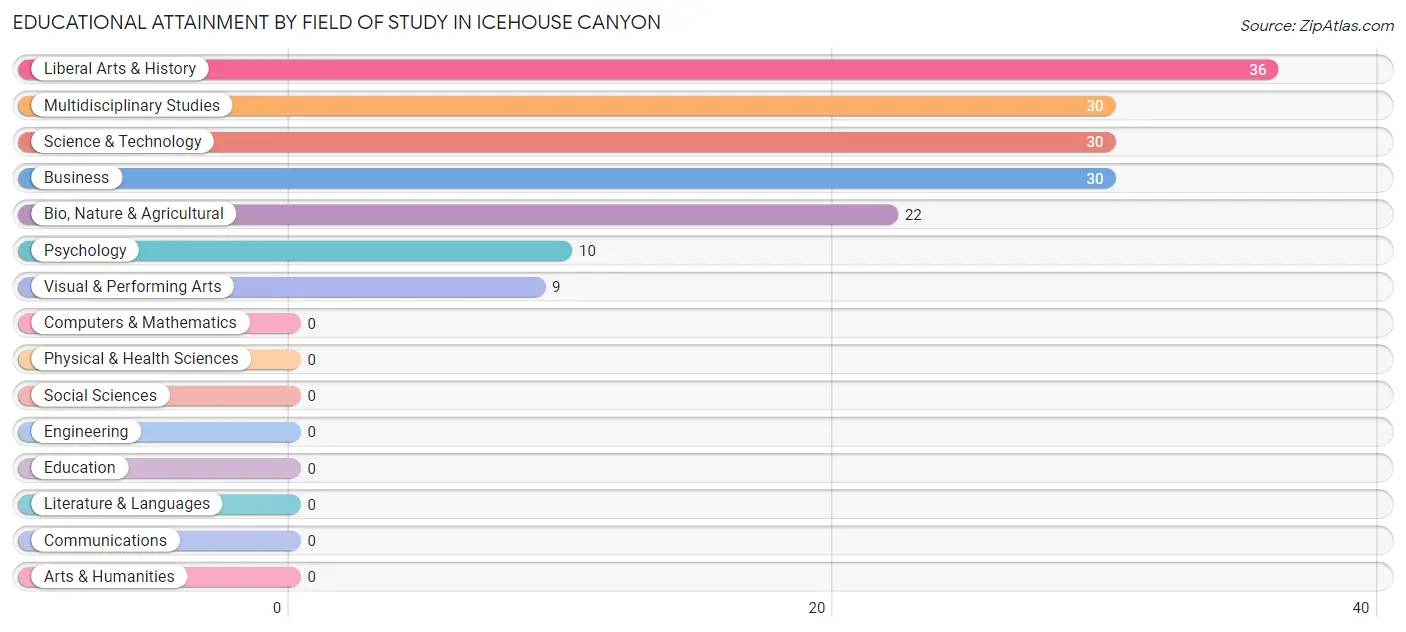
| Field of Study | # Graduates | % Graduates |
| Computers & Mathematics | 0 | 0.0% |
| Bio, Nature & Agricultural | 22 | 13.2% |
| Physical & Health Sciences | 0 | 0.0% |
| Psychology | 10 | 6.0% |
| Social Sciences | 0 | 0.0% |
| Engineering | 0 | 0.0% |
| Multidisciplinary Studies | 30 | 18.0% |
| Science & Technology | 30 | 18.0% |
| Business | 30 | 18.0% |
| Education | 0 | 0.0% |
| Literature & Languages | 0 | 0.0% |
| Liberal Arts & History | 36 | 21.6% |
| Visual & Performing Arts | 9 | 5.4% |
| Communications | 0 | 0.0% |
| Arts & Humanities | 0 | 0.0% |
| Total | 167 | 100.0% |
Transportation & Commute in Icehouse Canyon
Vehicle Availability by Sex in Icehouse Canyon
The most prevalent vehicle ownership categories in Icehouse Canyon are males with 4 vehicles (26, accounting for 57.8%) and females with 4 vehicles (30, making up 24.1%).
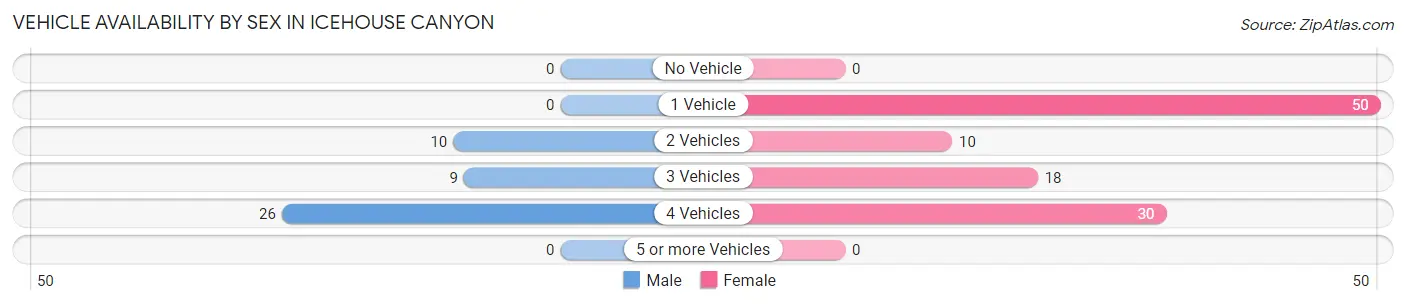
| Vehicles Available | Male | Female |
| No Vehicle | 0 (0.0%) | 0 (0.0%) |
| 1 Vehicle | 0 (0.0%) | 50 (46.3%) |
| 2 Vehicles | 10 (22.2%) | 10 (9.3%) |
| 3 Vehicles | 9 (20.0%) | 18 (16.7%) |
| 4 Vehicles | 26 (57.8%) | 30 (27.8%) |
| 5 or more Vehicles | 0 (0.0%) | 0 (0.0%) |
| Total | 45 (100.0%) | 108 (100.0%) |
Commute Time in Icehouse Canyon
The most frequently occuring commute durations in Icehouse Canyon are 10 to 14 minutes (56 commuters, 36.6%), 5 to 9 minutes (50 commuters, 32.7%), and 90 or more minutes (18 commuters, 11.8%).
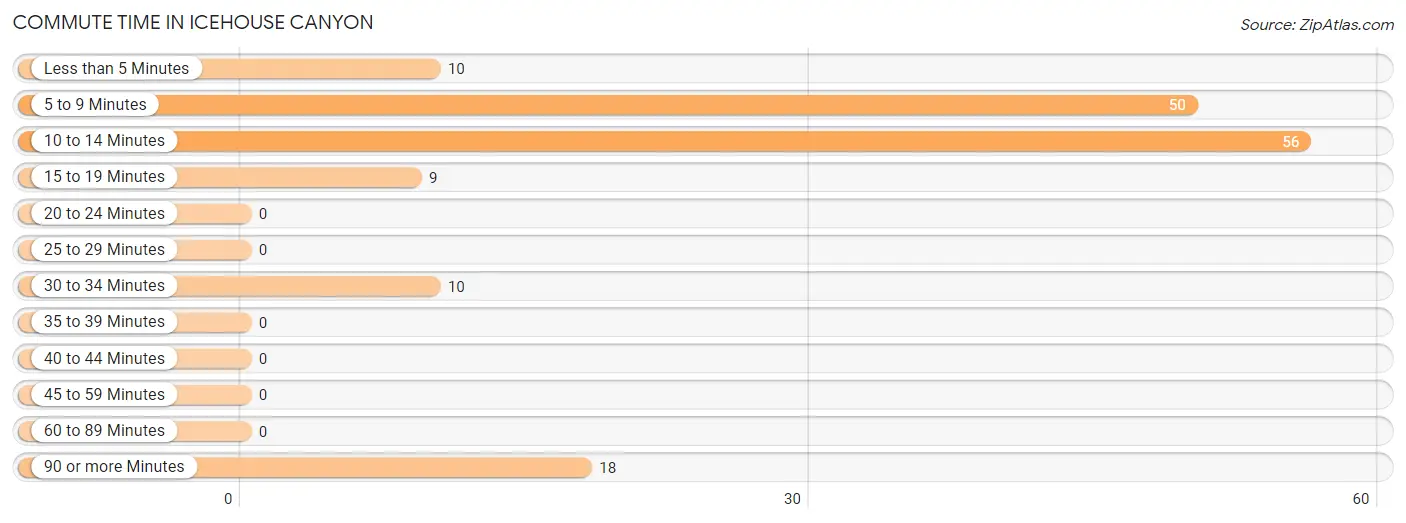
| Commute Time | # Commuters | % Commuters |
| Less than 5 Minutes | 10 | 6.5% |
| 5 to 9 Minutes | 50 | 32.7% |
| 10 to 14 Minutes | 56 | 36.6% |
| 15 to 19 Minutes | 9 | 5.9% |
| 20 to 24 Minutes | 0 | 0.0% |
| 25 to 29 Minutes | 0 | 0.0% |
| 30 to 34 Minutes | 10 | 6.5% |
| 35 to 39 Minutes | 0 | 0.0% |
| 40 to 44 Minutes | 0 | 0.0% |
| 45 to 59 Minutes | 0 | 0.0% |
| 60 to 89 Minutes | 0 | 0.0% |
| 90 or more Minutes | 18 | 11.8% |
Commute Time by Sex in Icehouse Canyon
The most common commute times in Icehouse Canyon are 10 to 14 minutes (26 commuters, 57.8%) for males and 5 to 9 minutes (50 commuters, 46.3%) for females.
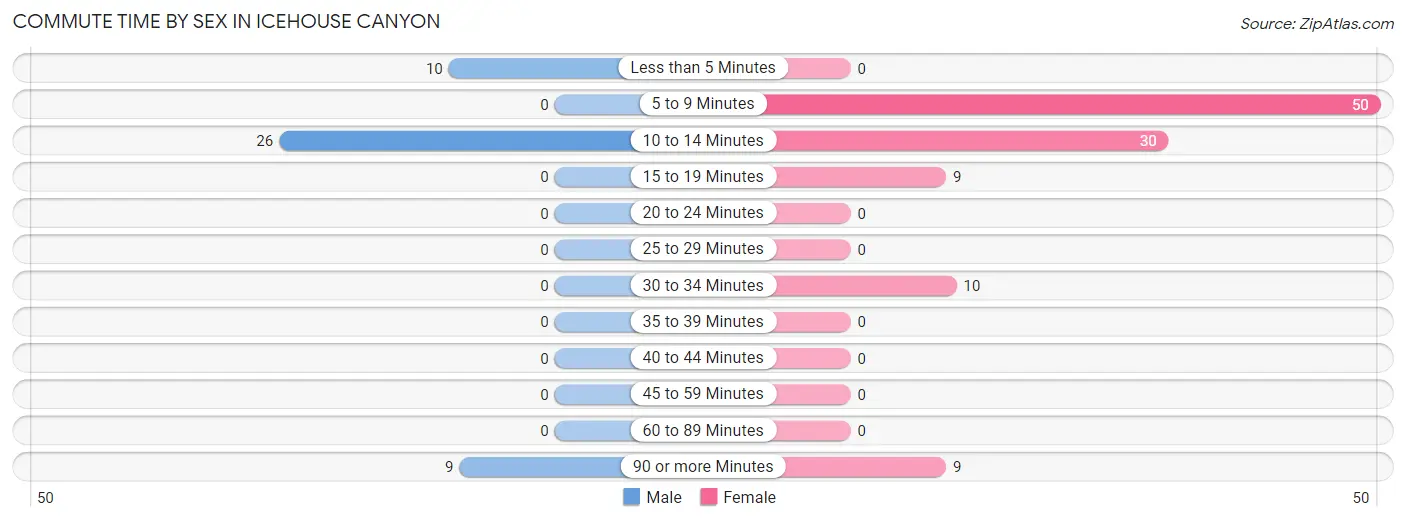
| Commute Time | Male | Female |
| Less than 5 Minutes | 10 (22.2%) | 0 (0.0%) |
| 5 to 9 Minutes | 0 (0.0%) | 50 (46.3%) |
| 10 to 14 Minutes | 26 (57.8%) | 30 (27.8%) |
| 15 to 19 Minutes | 0 (0.0%) | 9 (8.3%) |
| 20 to 24 Minutes | 0 (0.0%) | 0 (0.0%) |
| 25 to 29 Minutes | 0 (0.0%) | 0 (0.0%) |
| 30 to 34 Minutes | 0 (0.0%) | 10 (9.3%) |
| 35 to 39 Minutes | 0 (0.0%) | 0 (0.0%) |
| 40 to 44 Minutes | 0 (0.0%) | 0 (0.0%) |
| 45 to 59 Minutes | 0 (0.0%) | 0 (0.0%) |
| 60 to 89 Minutes | 0 (0.0%) | 0 (0.0%) |
| 90 or more Minutes | 9 (20.0%) | 9 (8.3%) |
Time of Departure to Work by Sex in Icehouse Canyon
The most frequent times of departure to work in Icehouse Canyon are 5:30 AM to 5:59 AM (26, 57.8%) for males and 7:00 AM to 7:29 AM (90, 83.3%) for females.
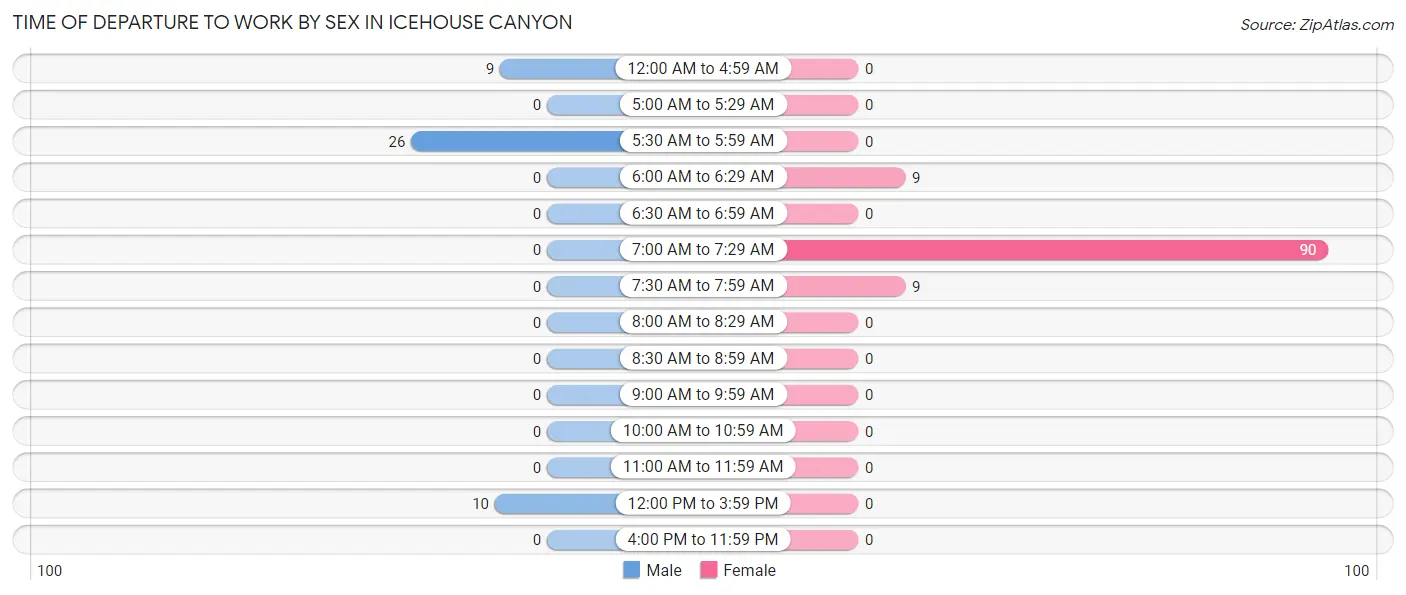
| Time of Departure | Male | Female |
| 12:00 AM to 4:59 AM | 9 (20.0%) | 0 (0.0%) |
| 5:00 AM to 5:29 AM | 0 (0.0%) | 0 (0.0%) |
| 5:30 AM to 5:59 AM | 26 (57.8%) | 0 (0.0%) |
| 6:00 AM to 6:29 AM | 0 (0.0%) | 9 (8.3%) |
| 6:30 AM to 6:59 AM | 0 (0.0%) | 0 (0.0%) |
| 7:00 AM to 7:29 AM | 0 (0.0%) | 90 (83.3%) |
| 7:30 AM to 7:59 AM | 0 (0.0%) | 9 (8.3%) |
| 8:00 AM to 8:29 AM | 0 (0.0%) | 0 (0.0%) |
| 8:30 AM to 8:59 AM | 0 (0.0%) | 0 (0.0%) |
| 9:00 AM to 9:59 AM | 0 (0.0%) | 0 (0.0%) |
| 10:00 AM to 10:59 AM | 0 (0.0%) | 0 (0.0%) |
| 11:00 AM to 11:59 AM | 0 (0.0%) | 0 (0.0%) |
| 12:00 PM to 3:59 PM | 10 (22.2%) | 0 (0.0%) |
| 4:00 PM to 11:59 PM | 0 (0.0%) | 0 (0.0%) |
| Total | 45 (100.0%) | 108 (100.0%) |
Housing Occupancy in Icehouse Canyon
Occupancy by Ownership in Icehouse Canyon
Of the total 232 dwellings in Icehouse Canyon, owner-occupied units account for 210 (90.5%), while renter-occupied units make up 22 (9.5%).
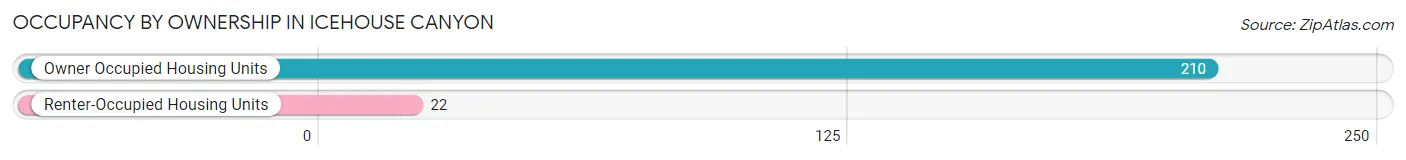
| Occupancy | # Housing Units | % Housing Units |
| Owner Occupied Housing Units | 210 | 90.5% |
| Renter-Occupied Housing Units | 22 | 9.5% |
| Total Occupied Housing Units | 232 | 100.0% |
Occupancy by Household Size in Icehouse Canyon
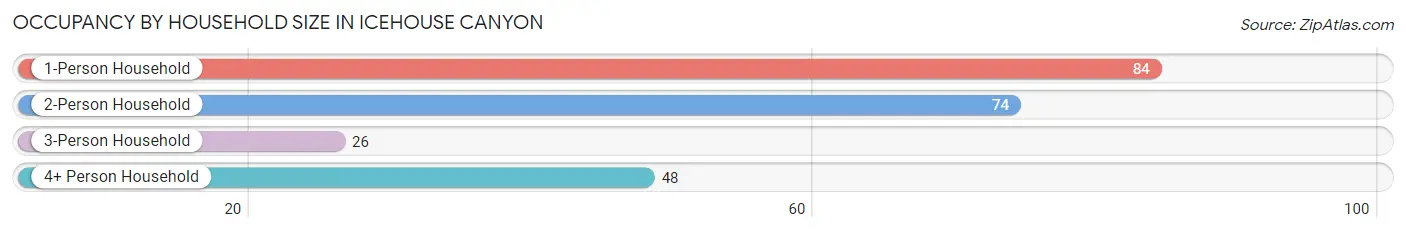
| Household Size | # Housing Units | % Housing Units |
| 1-Person Household | 84 | 36.2% |
| 2-Person Household | 74 | 31.9% |
| 3-Person Household | 26 | 11.2% |
| 4+ Person Household | 48 | 20.7% |
| Total Housing Units | 232 | 100.0% |
Occupancy by Ownership by Household Size in Icehouse Canyon
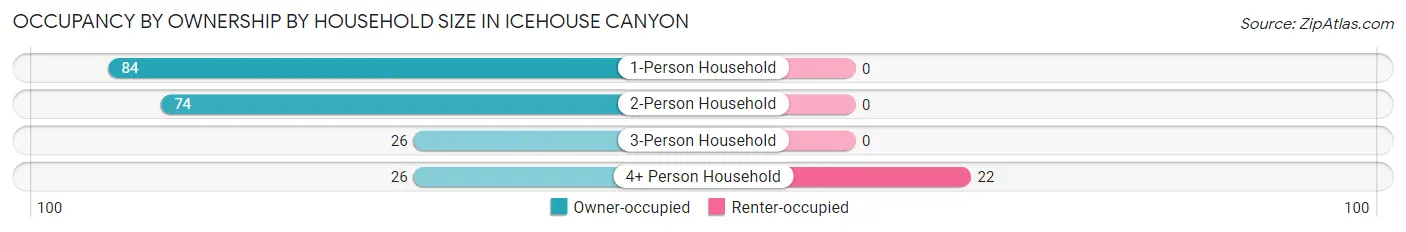
| Household Size | Owner-occupied | Renter-occupied |
| 1-Person Household | 84 (100.0%) | 0 (0.0%) |
| 2-Person Household | 74 (100.0%) | 0 (0.0%) |
| 3-Person Household | 26 (100.0%) | 0 (0.0%) |
| 4+ Person Household | 26 (54.2%) | 22 (45.8%) |
| Total Housing Units | 210 (90.5%) | 22 (9.5%) |
Occupancy by Educational Attainment in Icehouse Canyon
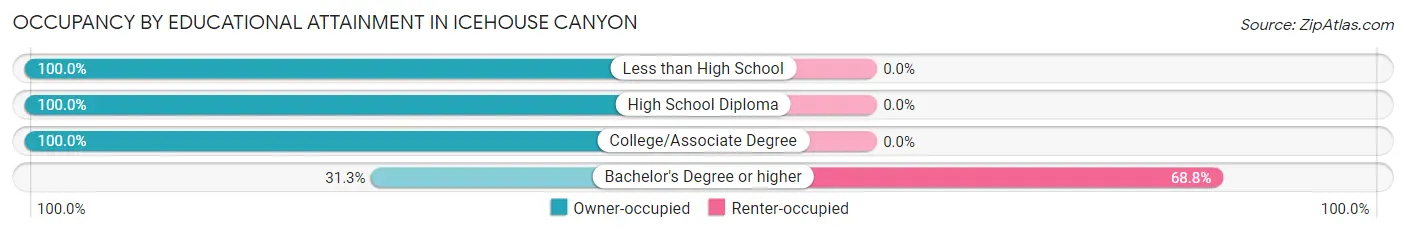
| Household Size | Owner-occupied | Renter-occupied |
| Less than High School | 9 (100.0%) | 0 (0.0%) |
| High School Diploma | 68 (100.0%) | 0 (0.0%) |
| College/Associate Degree | 123 (100.0%) | 0 (0.0%) |
| Bachelor's Degree or higher | 10 (31.2%) | 22 (68.8%) |
Occupancy by Age of Householder in Icehouse Canyon
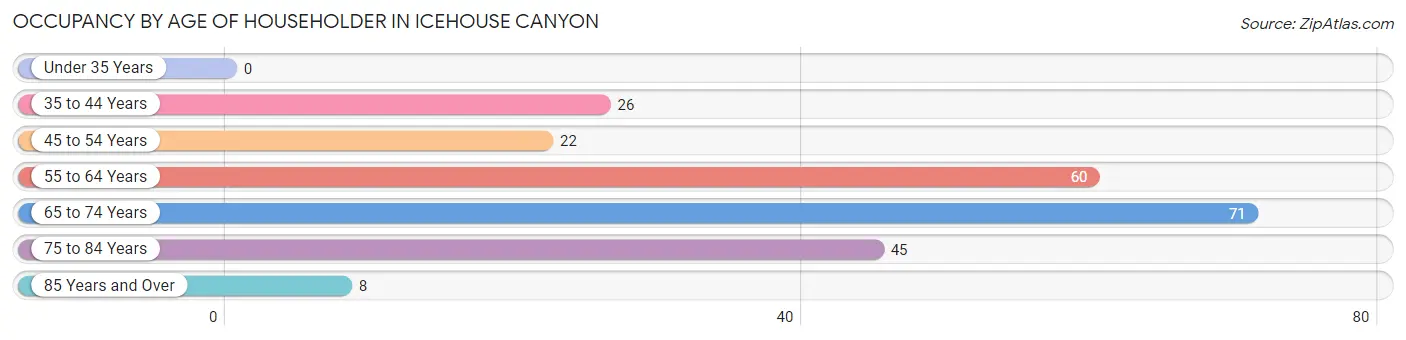
| Age Bracket | # Households | % Households |
| Under 35 Years | 0 | 0.0% |
| 35 to 44 Years | 26 | 11.2% |
| 45 to 54 Years | 22 | 9.5% |
| 55 to 64 Years | 60 | 25.9% |
| 65 to 74 Years | 71 | 30.6% |
| 75 to 84 Years | 45 | 19.4% |
| 85 Years and Over | 8 | 3.5% |
| Total | 232 | 100.0% |
Housing Finances in Icehouse Canyon
Median Income by Occupancy in Icehouse Canyon
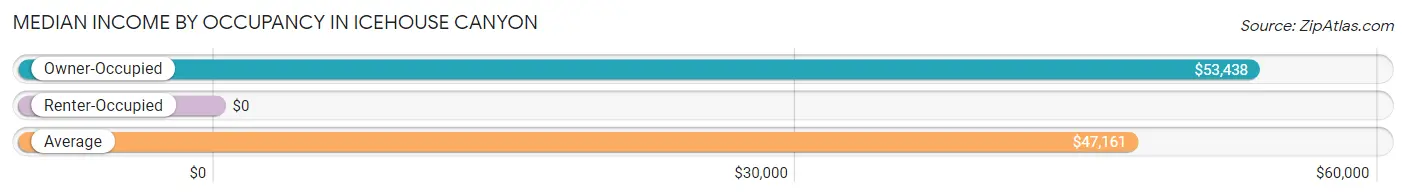
| Occupancy Type | # Households | Median Income |
| Owner-Occupied | 210 (90.5%) | $53,438 |
| Renter-Occupied | 22 (9.5%) | $0 |
| Average | 232 (100.0%) | $47,161 |
Occupancy by Householder Income Bracket in Icehouse Canyon
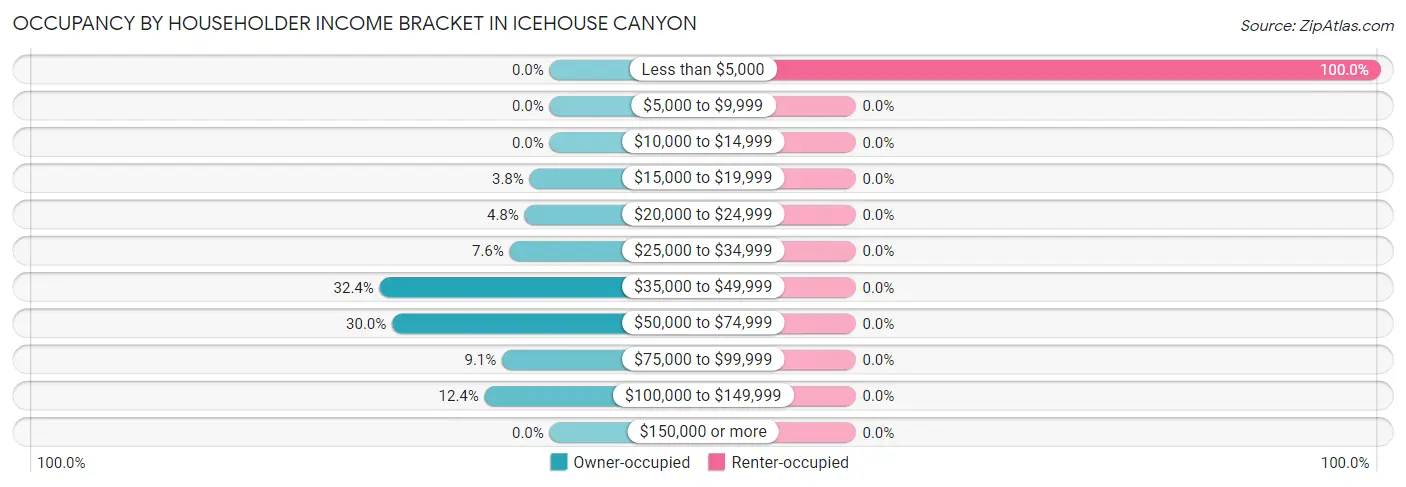
| Income Bracket | Owner-occupied | Renter-occupied |
| Less than $5,000 | 0 (0.0%) | 22 (100.0%) |
| $5,000 to $9,999 | 0 (0.0%) | 0 (0.0%) |
| $10,000 to $14,999 | 0 (0.0%) | 0 (0.0%) |
| $15,000 to $19,999 | 8 (3.8%) | 0 (0.0%) |
| $20,000 to $24,999 | 10 (4.8%) | 0 (0.0%) |
| $25,000 to $34,999 | 16 (7.6%) | 0 (0.0%) |
| $35,000 to $49,999 | 68 (32.4%) | 0 (0.0%) |
| $50,000 to $74,999 | 63 (30.0%) | 0 (0.0%) |
| $75,000 to $99,999 | 19 (9.0%) | 0 (0.0%) |
| $100,000 to $149,999 | 26 (12.4%) | 0 (0.0%) |
| $150,000 or more | 0 (0.0%) | 0 (0.0%) |
| Total | 210 (100.0%) | 22 (100.0%) |
Monthly Housing Cost Tiers in Icehouse Canyon
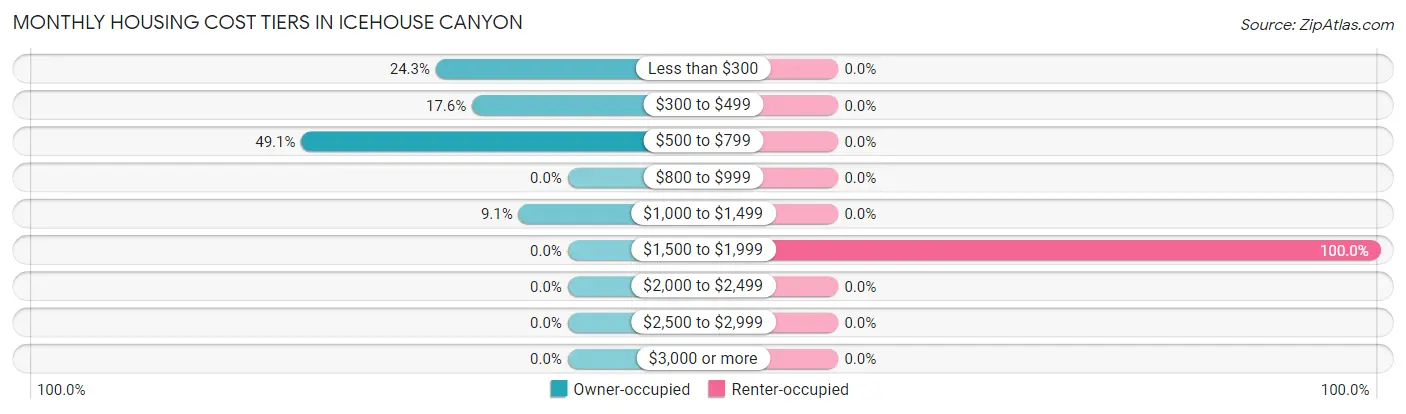
| Monthly Cost | Owner-occupied | Renter-occupied |
| Less than $300 | 51 (24.3%) | 0 (0.0%) |
| $300 to $499 | 37 (17.6%) | 0 (0.0%) |
| $500 to $799 | 103 (49.0%) | 0 (0.0%) |
| $800 to $999 | 0 (0.0%) | 0 (0.0%) |
| $1,000 to $1,499 | 19 (9.0%) | 0 (0.0%) |
| $1,500 to $1,999 | 0 (0.0%) | 22 (100.0%) |
| $2,000 to $2,499 | 0 (0.0%) | 0 (0.0%) |
| $2,500 to $2,999 | 0 (0.0%) | 0 (0.0%) |
| $3,000 or more | 0 (0.0%) | 0 (0.0%) |
| Total | 210 (100.0%) | 22 (100.0%) |
Physical Housing Characteristics in Icehouse Canyon
Housing Structures in Icehouse Canyon
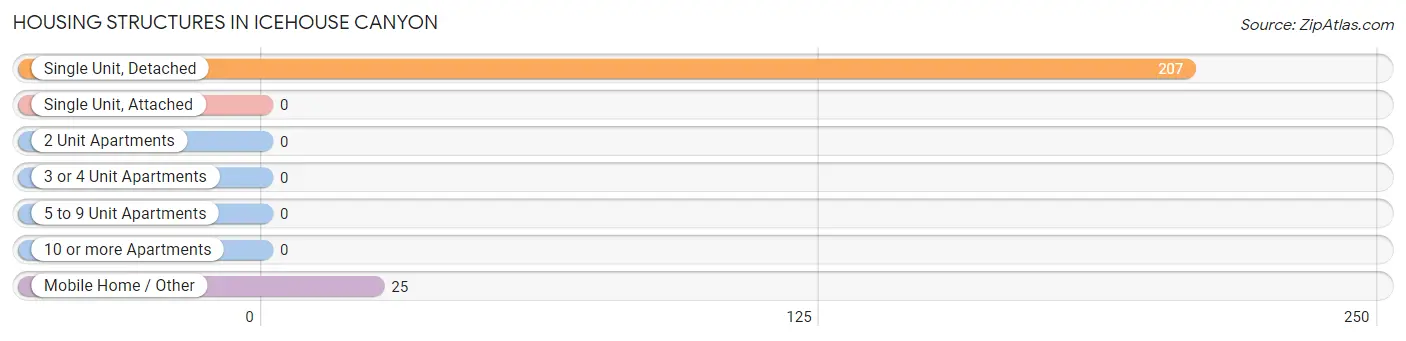
| Structure Type | # Housing Units | % Housing Units |
| Single Unit, Detached | 207 | 89.2% |
| Single Unit, Attached | 0 | 0.0% |
| 2 Unit Apartments | 0 | 0.0% |
| 3 or 4 Unit Apartments | 0 | 0.0% |
| 5 to 9 Unit Apartments | 0 | 0.0% |
| 10 or more Apartments | 0 | 0.0% |
| Mobile Home / Other | 25 | 10.8% |
| Total | 232 | 100.0% |
Housing Structures by Occupancy in Icehouse Canyon
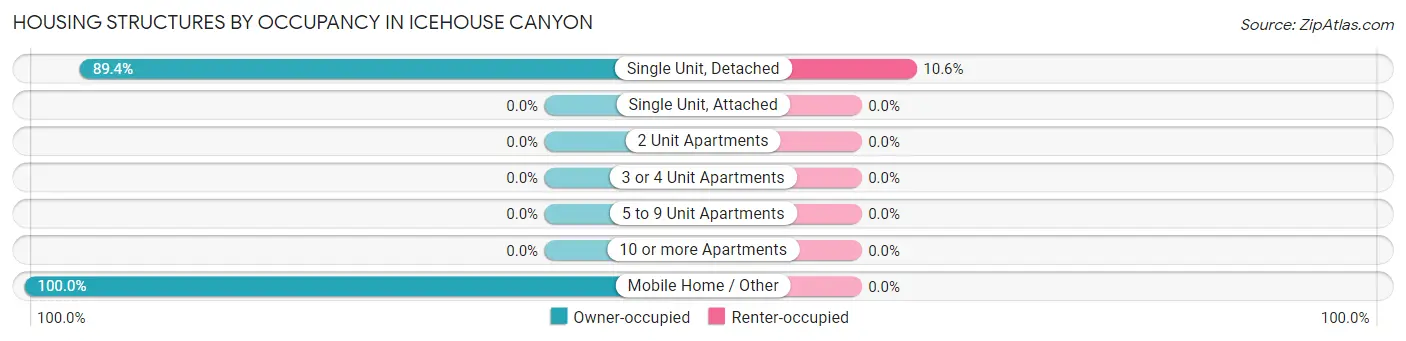
| Structure Type | Owner-occupied | Renter-occupied |
| Single Unit, Detached | 185 (89.4%) | 22 (10.6%) |
| Single Unit, Attached | 0 (0.0%) | 0 (0.0%) |
| 2 Unit Apartments | 0 (0.0%) | 0 (0.0%) |
| 3 or 4 Unit Apartments | 0 (0.0%) | 0 (0.0%) |
| 5 to 9 Unit Apartments | 0 (0.0%) | 0 (0.0%) |
| 10 or more Apartments | 0 (0.0%) | 0 (0.0%) |
| Mobile Home / Other | 25 (100.0%) | 0 (0.0%) |
| Total | 210 (90.5%) | 22 (9.5%) |
Housing Structures by Number of Rooms in Icehouse Canyon
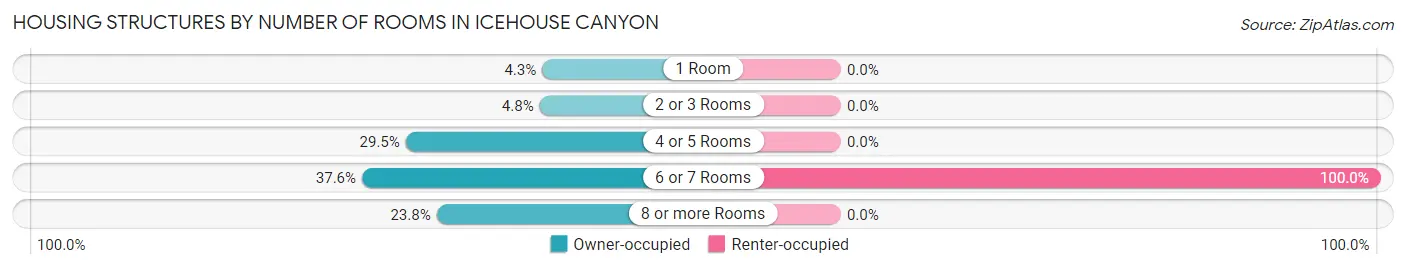
| Number of Rooms | Owner-occupied | Renter-occupied |
| 1 Room | 9 (4.3%) | 0 (0.0%) |
| 2 or 3 Rooms | 10 (4.8%) | 0 (0.0%) |
| 4 or 5 Rooms | 62 (29.5%) | 0 (0.0%) |
| 6 or 7 Rooms | 79 (37.6%) | 22 (100.0%) |
| 8 or more Rooms | 50 (23.8%) | 0 (0.0%) |
| Total | 210 (100.0%) | 22 (100.0%) |
Housing Structure by Heating Type in Icehouse Canyon
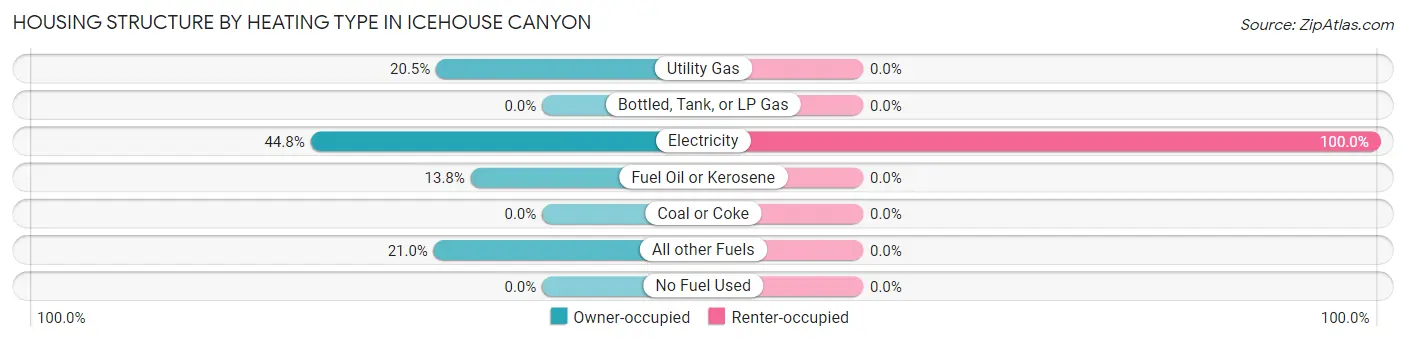
| Heating Type | Owner-occupied | Renter-occupied |
| Utility Gas | 43 (20.5%) | 0 (0.0%) |
| Bottled, Tank, or LP Gas | 0 (0.0%) | 0 (0.0%) |
| Electricity | 94 (44.8%) | 22 (100.0%) |
| Fuel Oil or Kerosene | 29 (13.8%) | 0 (0.0%) |
| Coal or Coke | 0 (0.0%) | 0 (0.0%) |
| All other Fuels | 44 (20.9%) | 0 (0.0%) |
| No Fuel Used | 0 (0.0%) | 0 (0.0%) |
| Total | 210 (100.0%) | 22 (100.0%) |
Household Vehicle Usage in Icehouse Canyon
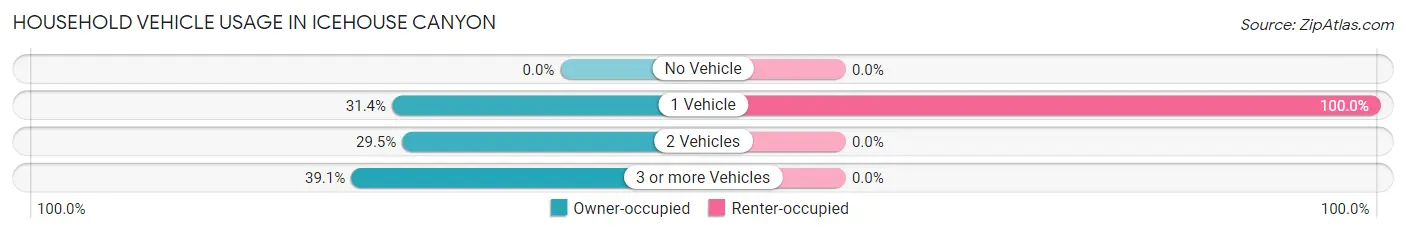
| Vehicles per Household | Owner-occupied | Renter-occupied |
| No Vehicle | 0 (0.0%) | 0 (0.0%) |
| 1 Vehicle | 66 (31.4%) | 22 (100.0%) |
| 2 Vehicles | 62 (29.5%) | 0 (0.0%) |
| 3 or more Vehicles | 82 (39.1%) | 0 (0.0%) |
| Total | 210 (100.0%) | 22 (100.0%) |
Real Estate & Mortgages in Icehouse Canyon
Real Estate and Mortgage Overview in Icehouse Canyon
| Characteristic | Without Mortgage | With Mortgage |
| Housing Units | 191 | 19 |
| Median Property Value | $121,400 | $0 |
| Median Household Income | $53,281 | $0 |
| Monthly Housing Costs | $513 | $0 |
| Real Estate Taxes | $1,283 | $0 |
Property Value by Mortgage Status in Icehouse Canyon
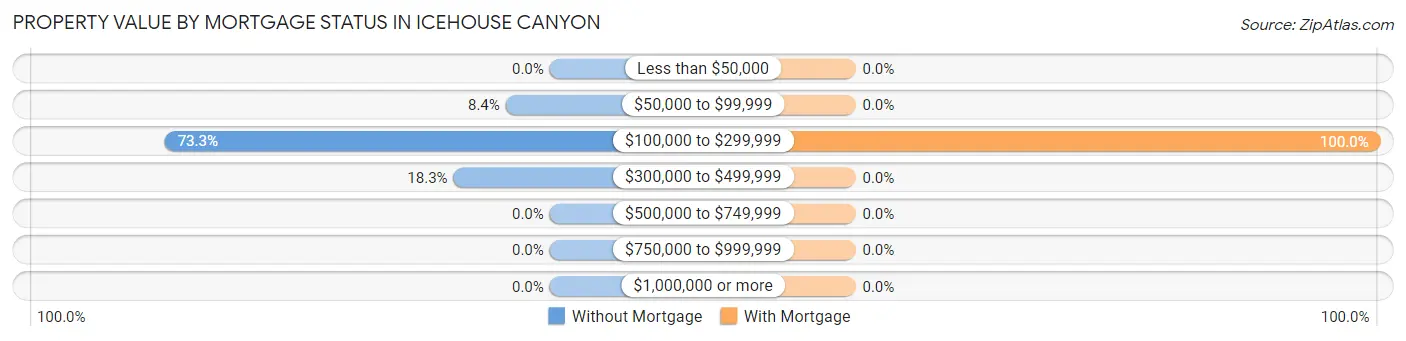
| Property Value | Without Mortgage | With Mortgage |
| Less than $50,000 | 0 (0.0%) | 0 (0.0%) |
| $50,000 to $99,999 | 16 (8.4%) | 0 (0.0%) |
| $100,000 to $299,999 | 140 (73.3%) | 19 (100.0%) |
| $300,000 to $499,999 | 35 (18.3%) | 0 (0.0%) |
| $500,000 to $749,999 | 0 (0.0%) | 0 (0.0%) |
| $750,000 to $999,999 | 0 (0.0%) | 0 (0.0%) |
| $1,000,000 or more | 0 (0.0%) | 0 (0.0%) |
| Total | 191 (100.0%) | 19 (100.0%) |
Household Income by Mortgage Status in Icehouse Canyon
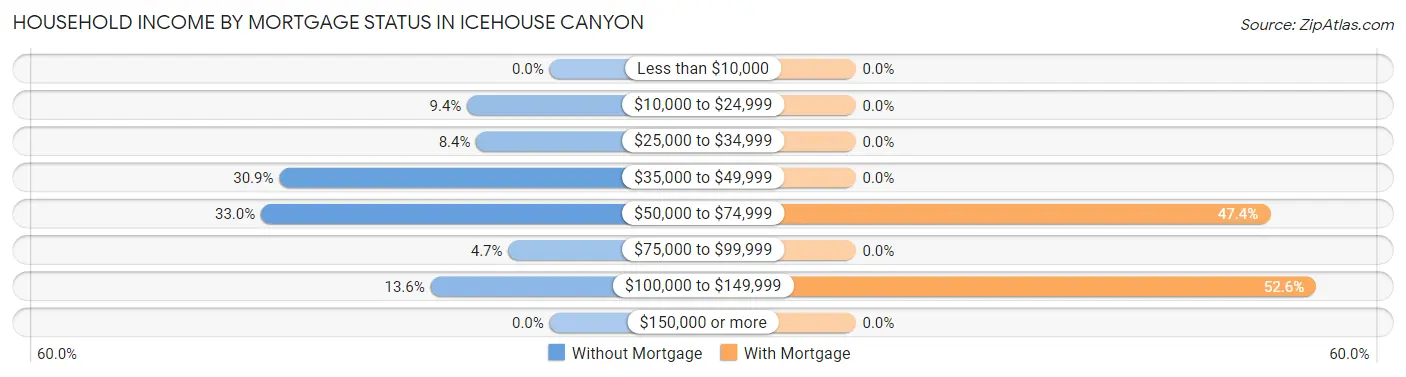
| Household Income | Without Mortgage | With Mortgage |
| Less than $10,000 | 0 (0.0%) | 0 (0.0%) |
| $10,000 to $24,999 | 18 (9.4%) | 0 (0.0%) |
| $25,000 to $34,999 | 16 (8.4%) | 0 (0.0%) |
| $35,000 to $49,999 | 59 (30.9%) | 0 (0.0%) |
| $50,000 to $74,999 | 63 (33.0%) | 9 (47.4%) |
| $75,000 to $99,999 | 9 (4.7%) | 0 (0.0%) |
| $100,000 to $149,999 | 26 (13.6%) | 10 (52.6%) |
| $150,000 or more | 0 (0.0%) | 0 (0.0%) |
| Total | 191 (100.0%) | 19 (100.0%) |
Property Value to Household Income Ratio in Icehouse Canyon
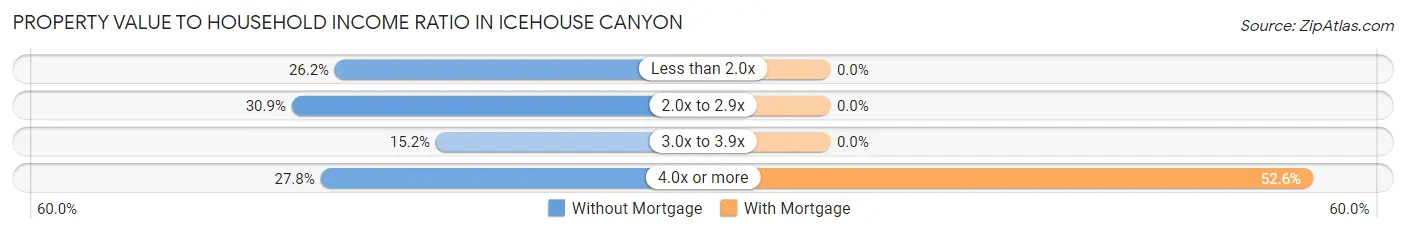
| Value-to-Income Ratio | Without Mortgage | With Mortgage |
| Less than 2.0x | 50 (26.2%) | 0 (0.0%) |
| 2.0x to 2.9x | 59 (30.9%) | 0 (0.0%) |
| 3.0x to 3.9x | 29 (15.2%) | 0 (0.0%) |
| 4.0x or more | 53 (27.8%) | 10 (52.6%) |
| Total | 191 (100.0%) | 19 (100.0%) |
Real Estate Taxes by Mortgage Status in Icehouse Canyon
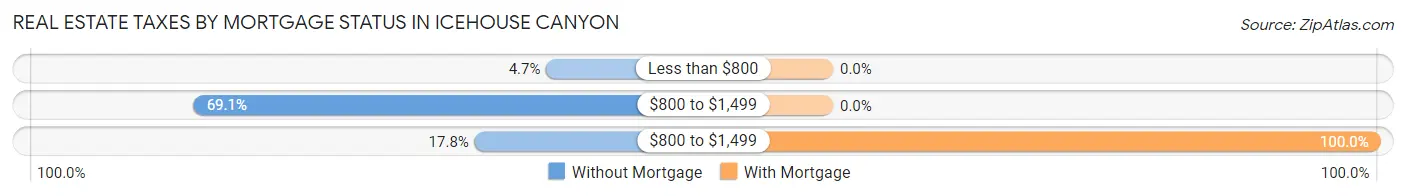
| Property Taxes | Without Mortgage | With Mortgage |
| Less than $800 | 9 (4.7%) | 0 (0.0%) |
| $800 to $1,499 | 132 (69.1%) | 0 (0.0%) |
| $800 to $1,499 | 34 (17.8%) | 19 (100.0%) |
| Total | 191 (100.0%) | 19 (100.0%) |
Health & Disability in Icehouse Canyon
Health Insurance Coverage by Age in Icehouse Canyon
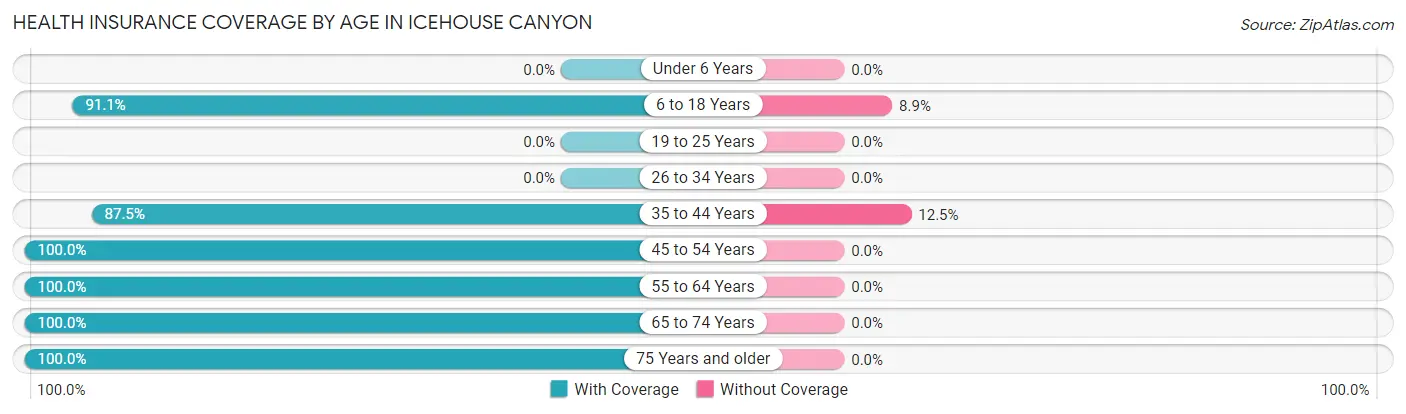
| Age Bracket | With Coverage | Without Coverage |
| Under 6 Years | 0 (0.0%) | 0 (0.0%) |
| 6 to 18 Years | 102 (91.1%) | 10 (8.9%) |
| 19 to 25 Years | 0 (0.0%) | 0 (0.0%) |
| 26 to 34 Years | 0 (0.0%) | 0 (0.0%) |
| 35 to 44 Years | 56 (87.5%) | 8 (12.5%) |
| 45 to 54 Years | 87 (100.0%) | 0 (0.0%) |
| 55 to 64 Years | 69 (100.0%) | 0 (0.0%) |
| 65 to 74 Years | 109 (100.0%) | 0 (0.0%) |
| 75 Years and older | 91 (100.0%) | 0 (0.0%) |
| Total | 514 (96.6%) | 18 (3.4%) |
Health Insurance Coverage by Citizenship Status in Icehouse Canyon
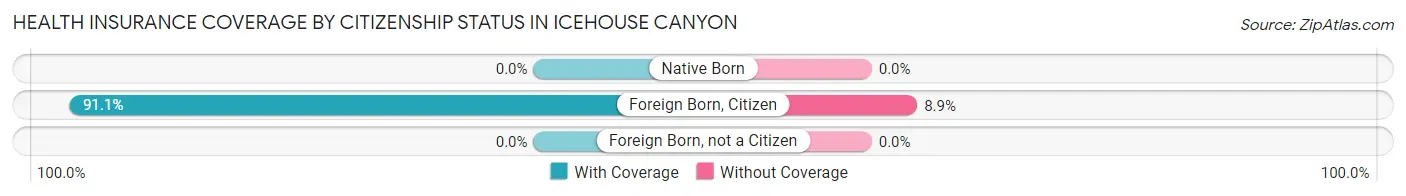
| Citizenship Status | With Coverage | Without Coverage |
| Native Born | 0 (0.0%) | 0 (0.0%) |
| Foreign Born, Citizen | 102 (91.1%) | 10 (8.9%) |
| Foreign Born, not a Citizen | 0 (0.0%) | 0 (0.0%) |
Health Insurance Coverage by Household Income in Icehouse Canyon
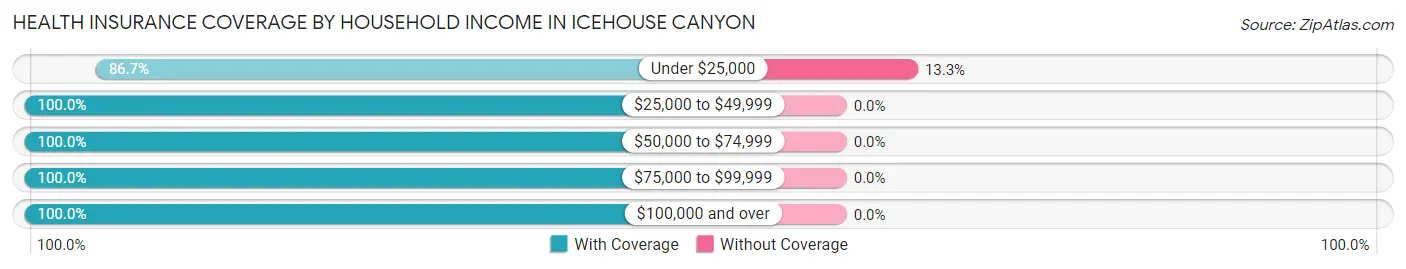
| Household Income | With Coverage | Without Coverage |
| Under $25,000 | 117 (86.7%) | 18 (13.3%) |
| $25,000 to $49,999 | 102 (100.0%) | 0 (0.0%) |
| $50,000 to $74,999 | 150 (100.0%) | 0 (0.0%) |
| $75,000 to $99,999 | 28 (100.0%) | 0 (0.0%) |
| $100,000 and over | 117 (100.0%) | 0 (0.0%) |
Public vs Private Health Insurance Coverage by Age in Icehouse Canyon
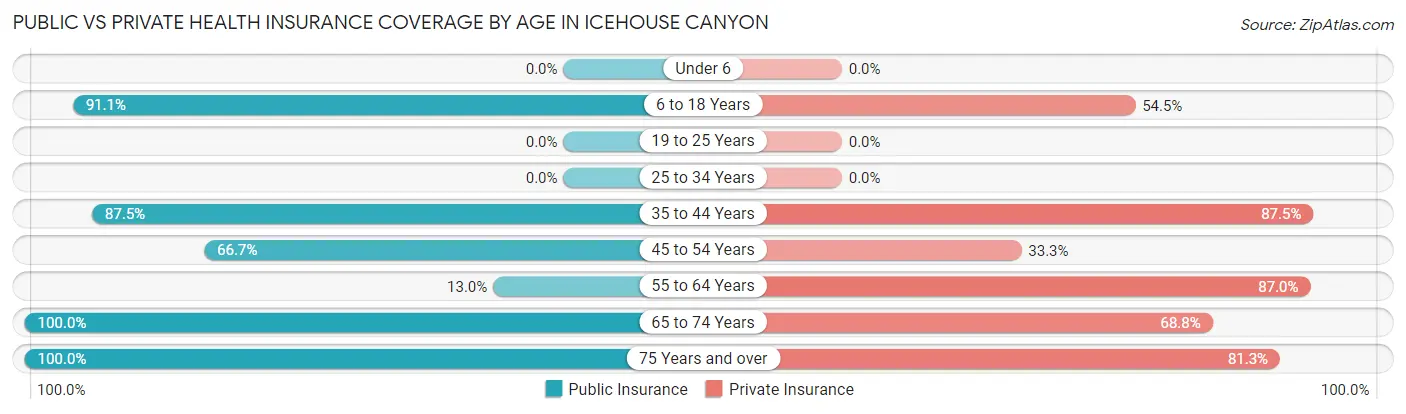
| Age Bracket | Public Insurance | Private Insurance |
| Under 6 | 0 (0.0%) | 0 (0.0%) |
| 6 to 18 Years | 102 (91.1%) | 61 (54.5%) |
| 19 to 25 Years | 0 (0.0%) | 0 (0.0%) |
| 25 to 34 Years | 0 (0.0%) | 0 (0.0%) |
| 35 to 44 Years | 56 (87.5%) | 56 (87.5%) |
| 45 to 54 Years | 58 (66.7%) | 29 (33.3%) |
| 55 to 64 Years | 9 (13.0%) | 60 (87.0%) |
| 65 to 74 Years | 109 (100.0%) | 75 (68.8%) |
| 75 Years and over | 91 (100.0%) | 74 (81.3%) |
| Total | 425 (79.9%) | 355 (66.7%) |
Disability Status by Sex by Age in Icehouse Canyon
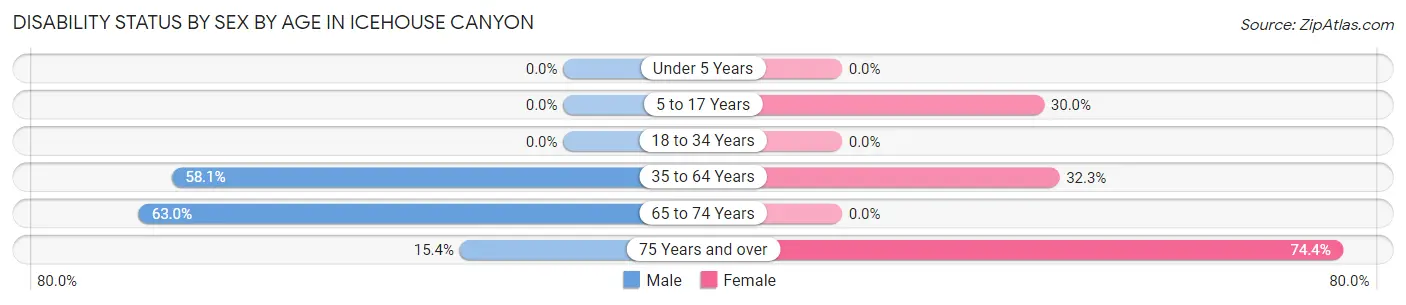
| Age Bracket | Male | Female |
| Under 5 Years | 0 (0.0%) | 0 (0.0%) |
| 5 to 17 Years | 0 (0.0%) | 21 (30.0%) |
| 18 to 34 Years | 0 (0.0%) | 0 (0.0%) |
| 35 to 64 Years | 36 (58.1%) | 51 (32.3%) |
| 65 to 74 Years | 29 (63.0%) | 0 (0.0%) |
| 75 Years and over | 8 (15.4%) | 29 (74.4%) |
Disability Class by Sex by Age in Icehouse Canyon
Disability Class: Hearing Difficulty
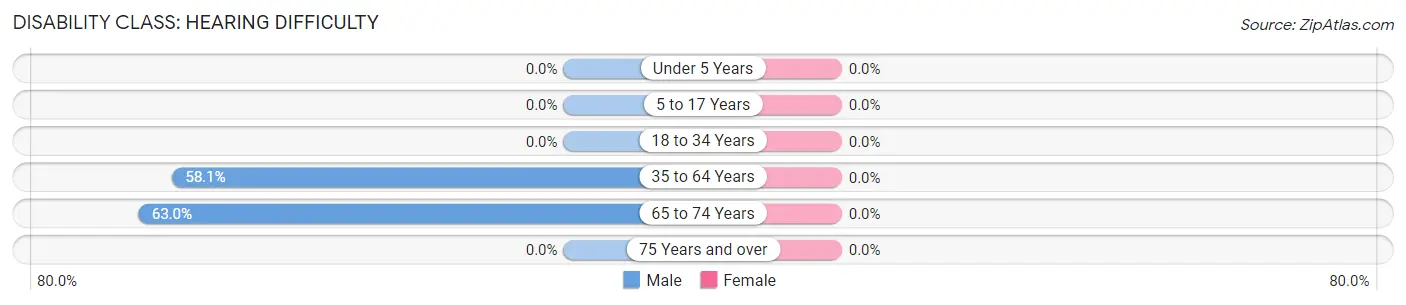
| Age Bracket | Male | Female |
| Under 5 Years | 0 (0.0%) | 0 (0.0%) |
| 5 to 17 Years | 0 (0.0%) | 0 (0.0%) |
| 18 to 34 Years | 0 (0.0%) | 0 (0.0%) |
| 35 to 64 Years | 36 (58.1%) | 0 (0.0%) |
| 65 to 74 Years | 29 (63.0%) | 0 (0.0%) |
| 75 Years and over | 0 (0.0%) | 0 (0.0%) |
Disability Class: Vision Difficulty
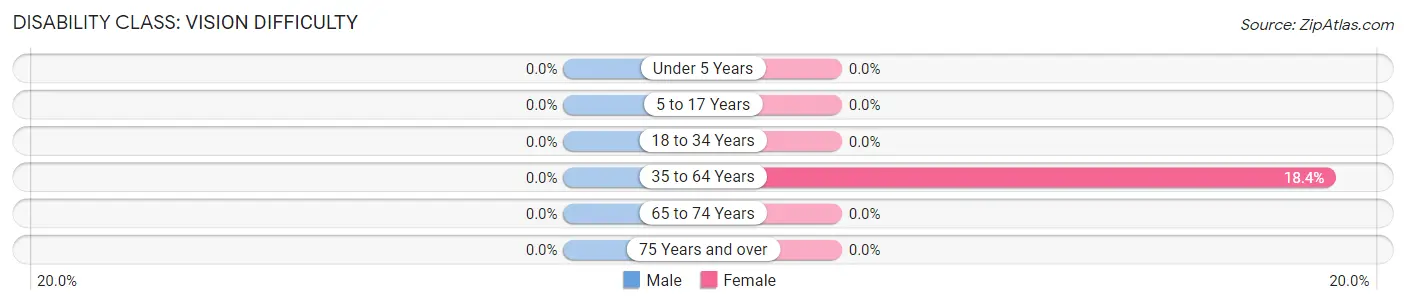
| Age Bracket | Male | Female |
| Under 5 Years | 0 (0.0%) | 0 (0.0%) |
| 5 to 17 Years | 0 (0.0%) | 0 (0.0%) |
| 18 to 34 Years | 0 (0.0%) | 0 (0.0%) |
| 35 to 64 Years | 0 (0.0%) | 29 (18.3%) |
| 65 to 74 Years | 0 (0.0%) | 0 (0.0%) |
| 75 Years and over | 0 (0.0%) | 0 (0.0%) |
Disability Class: Cognitive Difficulty
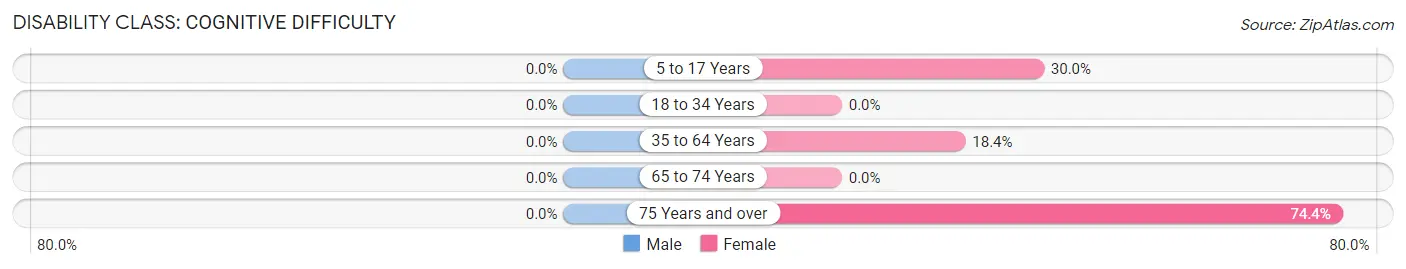
| Age Bracket | Male | Female |
| 5 to 17 Years | 0 (0.0%) | 21 (30.0%) |
| 18 to 34 Years | 0 (0.0%) | 0 (0.0%) |
| 35 to 64 Years | 0 (0.0%) | 29 (18.3%) |
| 65 to 74 Years | 0 (0.0%) | 0 (0.0%) |
| 75 Years and over | 0 (0.0%) | 29 (74.4%) |
Disability Class: Ambulatory Difficulty
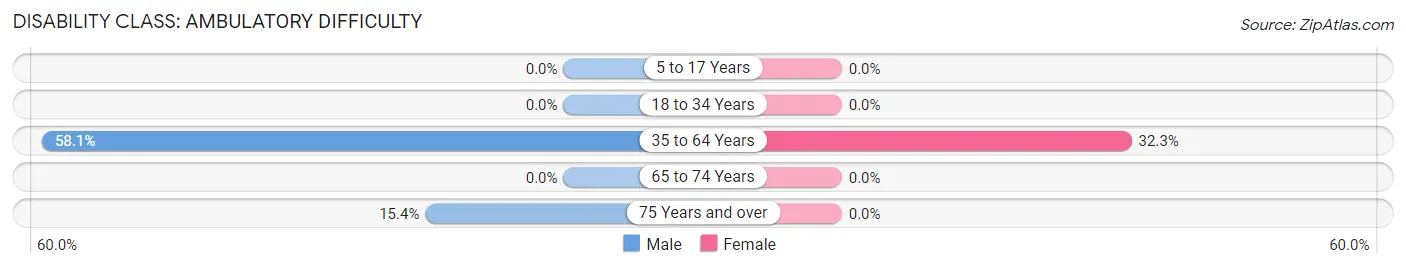
| Age Bracket | Male | Female |
| 5 to 17 Years | 0 (0.0%) | 0 (0.0%) |
| 18 to 34 Years | 0 (0.0%) | 0 (0.0%) |
| 35 to 64 Years | 36 (58.1%) | 51 (32.3%) |
| 65 to 74 Years | 0 (0.0%) | 0 (0.0%) |
| 75 Years and over | 8 (15.4%) | 0 (0.0%) |
Disability Class: Self-Care Difficulty
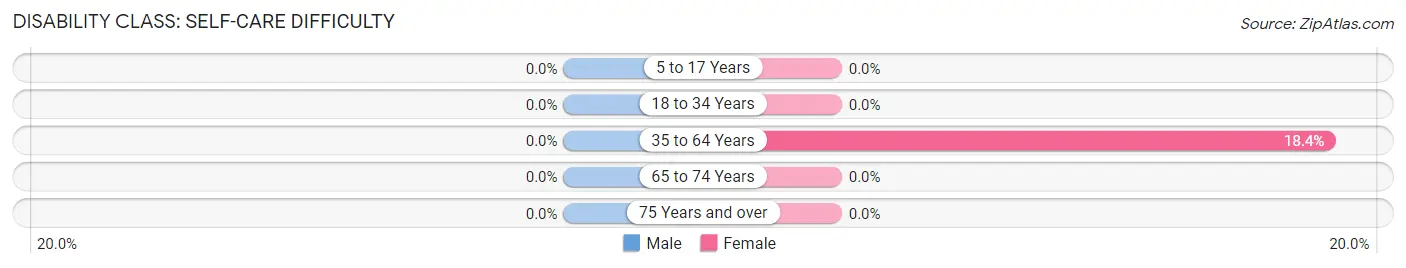
| Age Bracket | Male | Female |
| 5 to 17 Years | 0 (0.0%) | 0 (0.0%) |
| 18 to 34 Years | 0 (0.0%) | 0 (0.0%) |
| 35 to 64 Years | 0 (0.0%) | 29 (18.3%) |
| 65 to 74 Years | 0 (0.0%) | 0 (0.0%) |
| 75 Years and over | 0 (0.0%) | 0 (0.0%) |
Technology Access in Icehouse Canyon
Computing Device Access in Icehouse Canyon
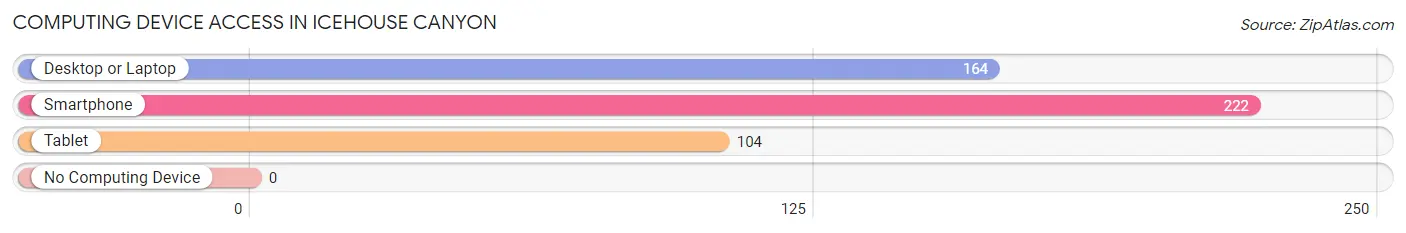
| Device Type | # Households | % Households |
| Desktop or Laptop | 164 | 70.7% |
| Smartphone | 222 | 95.7% |
| Tablet | 104 | 44.8% |
| No Computing Device | 0 | 0.0% |
| Total | 232 | 100.0% |
Internet Access in Icehouse Canyon
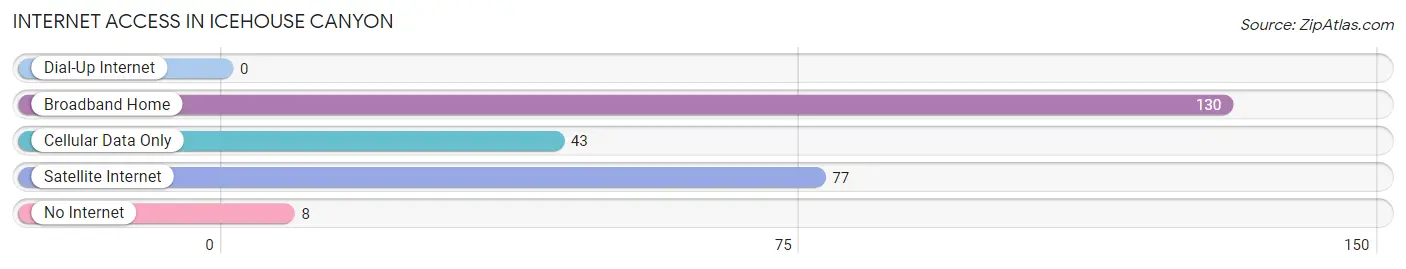
| Internet Type | # Households | % Households |
| Dial-Up Internet | 0 | 0.0% |
| Broadband Home | 130 | 56.0% |
| Cellular Data Only | 43 | 18.5% |
| Satellite Internet | 77 | 33.2% |
| No Internet | 8 | 3.5% |
| Total | 232 | 100.0% |
Icehouse Canyon Summary
Icehouse Canyon is a small canyon located in the Santa Catalina Mountains of Arizona. It is located in the Coronado National Forest and is part of the Pusch Ridge Wilderness Area. The canyon is approximately 4 miles long and is home to a variety of wildlife, including deer, javelina, and mountain lions.
Geography
Icehouse Canyon is located in the Santa Catalina Mountains of Arizona, approximately 25 miles north of Tucson. The canyon is part of the Coronado National Forest and is part of the Pusch Ridge Wilderness Area. The canyon is approximately 4 miles long and is home to a variety of wildlife, including deer, javelina, and mountain lions. The canyon is surrounded by the Santa Catalina Mountains, which are part of the Sky Islands, a series of mountain ranges that are isolated from each other by desert valleys. The canyon is also home to a variety of plant life, including oaks, junipers, and pines.
History
Icehouse Canyon has been inhabited by humans for thousands of years. The canyon was home to the Hohokam people, who lived in the area from around 300 BC to 1450 AD. The canyon was also home to the Tohono O'odham people, who lived in the area until the late 19th century. The canyon was also home to the Apache people, who lived in the area until the late 19th century.
The canyon was first explored by Europeans in the late 19th century. In 1883, the canyon was surveyed by the US Geological Survey. In the early 20th century, the canyon was used by ranchers and miners. In the 1930s, the canyon was used by the Civilian Conservation Corps to build trails and roads.
Economy
Icehouse Canyon is a popular destination for hikers, campers, and nature lovers. The canyon is home to a variety of trails, including the Icehouse Canyon Trail, which is a popular destination for hikers. The canyon is also home to a variety of wildlife, including deer, javelina, and mountain lions. The canyon is also home to a variety of plant life, including oaks, junipers, and pines.
The canyon is also home to a variety of businesses, including restaurants, hotels, and stores. The canyon is also home to a variety of outdoor recreation businesses, including horseback riding, fishing, and hunting.
Demographics
Icehouse Canyon is a small, rural community with a population of approximately 200 people. The population is primarily white, with a small percentage of Hispanic and Native American residents. The median household income is approximately $50,000, and the median home value is approximately $200,000. The unemployment rate is approximately 5%, and the poverty rate is approximately 10%.
Conclusion
Icehouse Canyon is a small canyon located in the Santa Catalina Mountains of Arizona. It is part of the Coronado National Forest and is part of the Pusch Ridge Wilderness Area. The canyon is home to a variety of wildlife, including deer, javelina, and mountain lions. The canyon is also home to a variety of businesses, including restaurants, hotels, and stores. The population of Icehouse Canyon is primarily white, with a small percentage of Hispanic and Native American residents. The median household income is approximately $50,000, and the median home value is approximately $200,000. The canyon is a popular destination for hikers, campers, and nature lovers, and is home to a variety of trails and outdoor recreation businesses.
Common Questions
What is Per Capita Income in Icehouse Canyon?
Per Capita income in Icehouse Canyon is $24,703.
What is the Median Family Income in Icehouse Canyon?
Median Family Income in Icehouse Canyon is $56,538.
What is the Median Household income in Icehouse Canyon?
Median Household Income in Icehouse Canyon is $47,161.
What is Income or Wage Gap in Icehouse Canyon?
Income or Wage Gap in Icehouse Canyon is 2.4%.
Women in Icehouse Canyon earn 97.6 cents for every dollar earned by a man.
What is Inequality or Gini Index in Icehouse Canyon?
Inequality or Gini Index in Icehouse Canyon is 0.32.
What is the Total Population of Icehouse Canyon?
Total Population of Icehouse Canyon is 532.
What is the Total Male Population of Icehouse Canyon?
Total Male Population of Icehouse Canyon is 202.
What is the Total Female Population of Icehouse Canyon?
Total Female Population of Icehouse Canyon is 330.
What is the Ratio of Males per 100 Females in Icehouse Canyon?
There are 61.21 Males per 100 Females in Icehouse Canyon.
What is the Ratio of Females per 100 Males in Icehouse Canyon?
There are 163.37 Females per 100 Males in Icehouse Canyon.
What is the Median Population Age in Icehouse Canyon?
Median Population Age in Icehouse Canyon is 59.1 Years.
What is the Average Family Size in Icehouse Canyon
Average Family Size in Icehouse Canyon is 3.0 People.
What is the Average Household Size in Icehouse Canyon
Average Household Size in Icehouse Canyon is 2.3 People.
How Large is the Labor Force in Icehouse Canyon?
There are 153 People in the Labor Forcein in Icehouse Canyon.
What is the Percentage of People in the Labor Force in Icehouse Canyon?
33.1% of People are in the Labor Force in Icehouse Canyon.