Sun Lakes, AZ Map & Demographics
Sun Lakes Map
Sun Lakes Overview
$51,559
PER CAPITA INCOME
$84,182
AVG FAMILY INCOME
$62,148
AVG HOUSEHOLD INCOME
11.8%
WAGE / INCOME GAP [ % ]
88.2¢/ $1
WAGE / INCOME GAP [ $ ]
$11,794
FAMILY INCOME DEFICIT
0.47
INEQUALITY / GINI INDEX
14,147
TOTAL POPULATION
6,166
MALE POPULATION
7,981
FEMALE POPULATION
77.26
MALES / 100 FEMALES
129.44
FEMALES / 100 MALES
73.6
MEDIAN AGE
2.1
AVG FAMILY SIZE
1.6
AVG HOUSEHOLD SIZE
2,910
LABOR FORCE [ PEOPLE ]
20.6%
PERCENT IN LABOR FORCE
6.1%
UNEMPLOYMENT RATE
Income in Sun Lakes
Income Overview in Sun Lakes
Per Capita Income in Sun Lakes is $51,559, while median incomes of families and households are $84,182 and $62,148 respectively.
| Characteristic | Number | Measure |
| Per Capita Income | 14,147 | $51,559 |
| Median Family Income | 4,739 | $84,182 |
| Mean Family Income | 4,739 | $102,437 |
| Median Household Income | 8,677 | $62,148 |
| Mean Household Income | 8,677 | $83,857 |
| Income Deficit | 4,739 | $11,794 |
| Wage / Income Gap (%) | 14,147 | 11.83% |
| Wage / Income Gap ($) | 14,147 | 88.17¢ per $1 |
| Gini / Inequality Index | 14,147 | 0.47 |
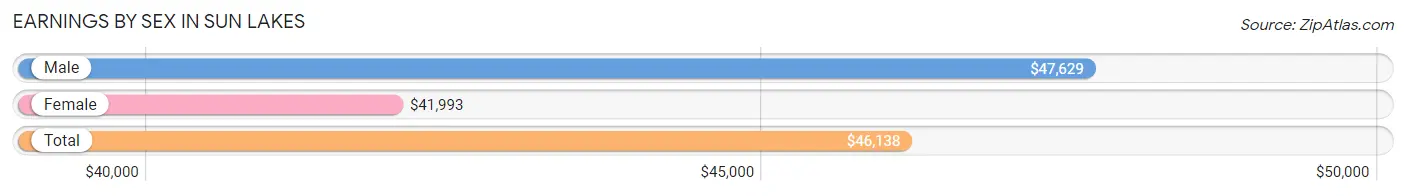
Earnings by Sex in Sun Lakes
Average Earnings in Sun Lakes are $46,138, $47,629 for men and $41,993 for women, a difference of 11.8%.
| Sex | Number | Average Earnings |
| Male | 1,521 (46.1%) | $47,629 |
| Female | 1,780 (53.9%) | $41,993 |
| Total | 3,301 (100.0%) | $46,138 |
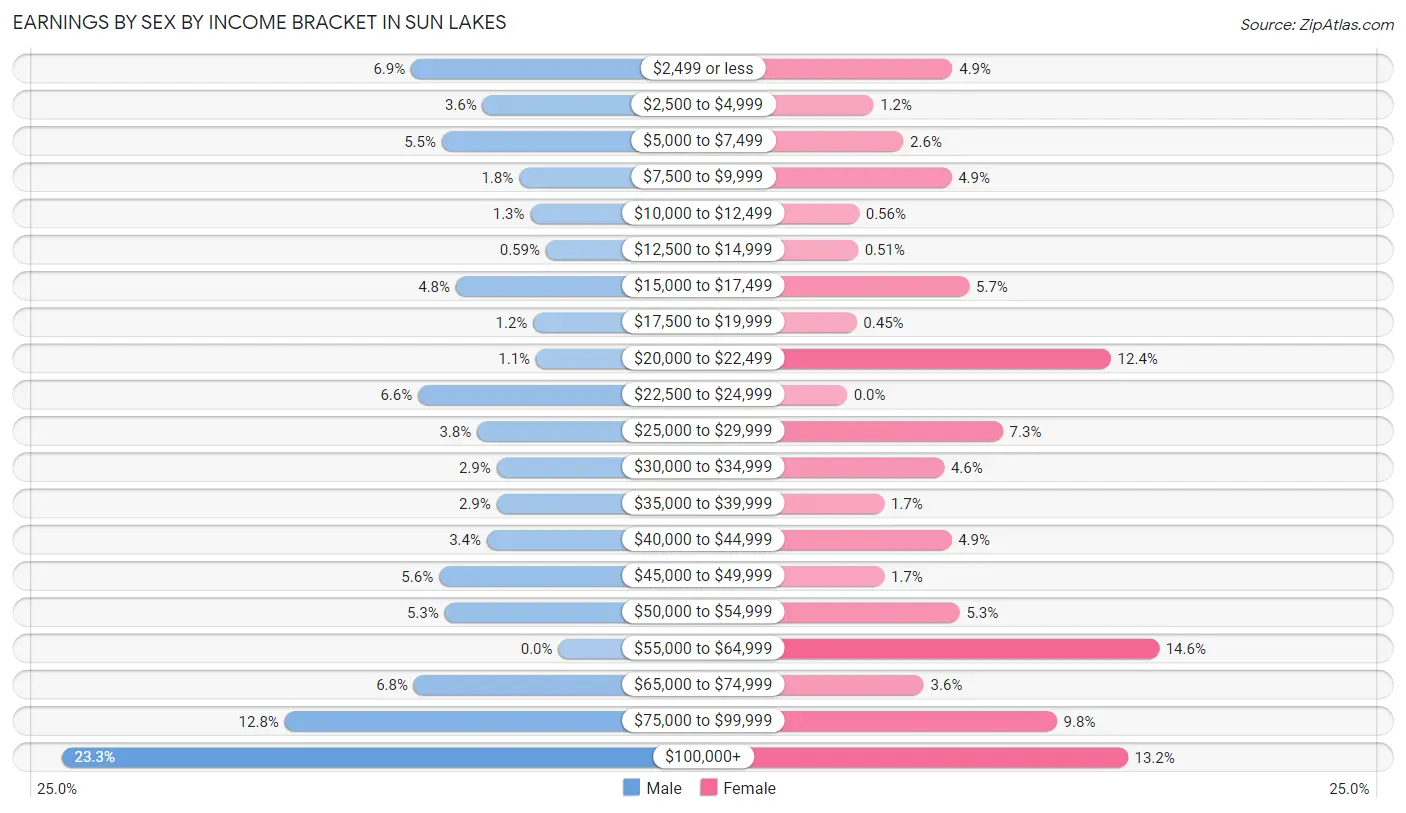
Earnings by Sex by Income Bracket in Sun Lakes
The most common earnings brackets in Sun Lakes are $100,000+ for men (354 | 23.3%) and $55,000 to $64,999 for women (260 | 14.6%).
| Income | Male | Female |
| $2,499 or less | 105 (6.9%) | 88 (4.9%) |
| $2,500 to $4,999 | 54 (3.5%) | 22 (1.2%) |
| $5,000 to $7,499 | 83 (5.5%) | 47 (2.6%) |
| $7,500 to $9,999 | 28 (1.8%) | 87 (4.9%) |
| $10,000 to $12,499 | 20 (1.3%) | 10 (0.6%) |
| $12,500 to $14,999 | 9 (0.6%) | 9 (0.5%) |
| $15,000 to $17,499 | 73 (4.8%) | 102 (5.7%) |
| $17,500 to $19,999 | 18 (1.2%) | 8 (0.4%) |
| $20,000 to $22,499 | 16 (1.1%) | 220 (12.4%) |
| $22,500 to $24,999 | 100 (6.6%) | 0 (0.0%) |
| $25,000 to $29,999 | 58 (3.8%) | 130 (7.3%) |
| $30,000 to $34,999 | 44 (2.9%) | 81 (4.5%) |
| $35,000 to $39,999 | 44 (2.9%) | 31 (1.7%) |
| $40,000 to $44,999 | 51 (3.4%) | 87 (4.9%) |
| $45,000 to $49,999 | 85 (5.6%) | 31 (1.7%) |
| $50,000 to $54,999 | 81 (5.3%) | 94 (5.3%) |
| $55,000 to $64,999 | 0 (0.0%) | 260 (14.6%) |
| $65,000 to $74,999 | 103 (6.8%) | 64 (3.6%) |
| $75,000 to $99,999 | 195 (12.8%) | 175 (9.8%) |
| $100,000+ | 354 (23.3%) | 234 (13.2%) |
| Total | 1,521 (100.0%) | 1,780 (100.0%) |
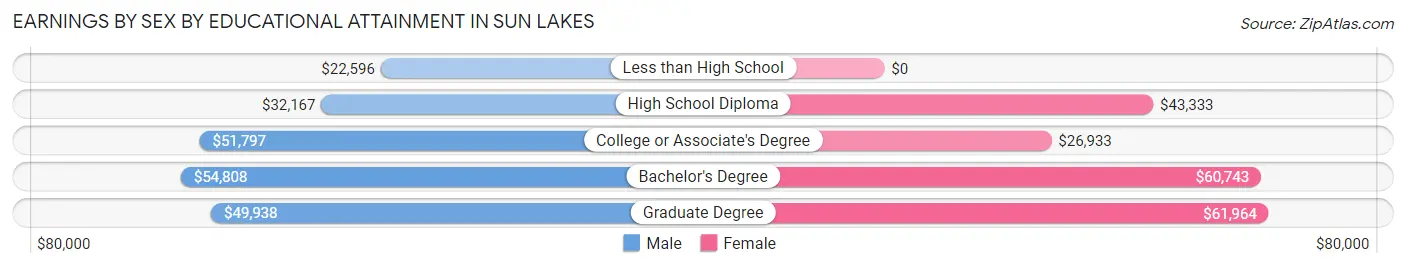
Earnings by Sex by Educational Attainment in Sun Lakes
Average earnings in Sun Lakes are $48,621 for men and $42,464 for women, a difference of 12.7%. Men with an educational attainment of bachelor's degree enjoy the highest average annual earnings of $54,808, while those with less than high school education earn the least with $22,596. Women with an educational attainment of graduate degree earn the most with the average annual earnings of $61,964, while those with college or associate's degree education have the smallest earnings of $26,933.
| Educational Attainment | Male Income | Female Income |
| Less than High School | $22,596 | $0 |
| High School Diploma | $32,167 | $43,333 |
| College or Associate's Degree | $51,797 | $26,933 |
| Bachelor's Degree | $54,808 | $60,743 |
| Graduate Degree | $49,938 | $61,964 |
| Total | $48,621 | $42,464 |
Family Income in Sun Lakes
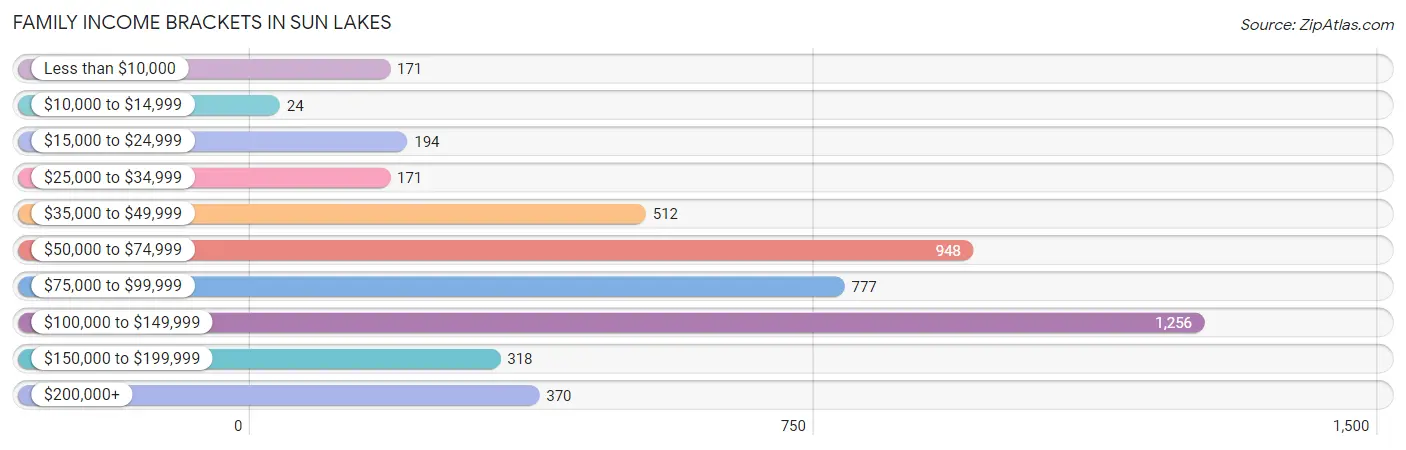
Family Income Brackets in Sun Lakes
According to the Sun Lakes family income data, there are 1,256 families falling into the $100,000 to $149,999 income range, which is the most common income bracket and makes up 26.5% of all families. Conversely, the $10,000 to $14,999 income bracket is the least frequent group with only 24 families (0.5%) belonging to this category.
| Income Bracket | # Families | % Families |
| Less than $10,000 | 171 | 3.6% |
| $10,000 to $14,999 | 24 | 0.5% |
| $15,000 to $24,999 | 194 | 4.1% |
| $25,000 to $34,999 | 171 | 3.6% |
| $35,000 to $49,999 | 512 | 10.8% |
| $50,000 to $74,999 | 948 | 20.0% |
| $75,000 to $99,999 | 777 | 16.4% |
| $100,000 to $149,999 | 1,256 | 26.5% |
| $150,000 to $199,999 | 318 | 6.7% |
| $200,000+ | 370 | 7.8% |
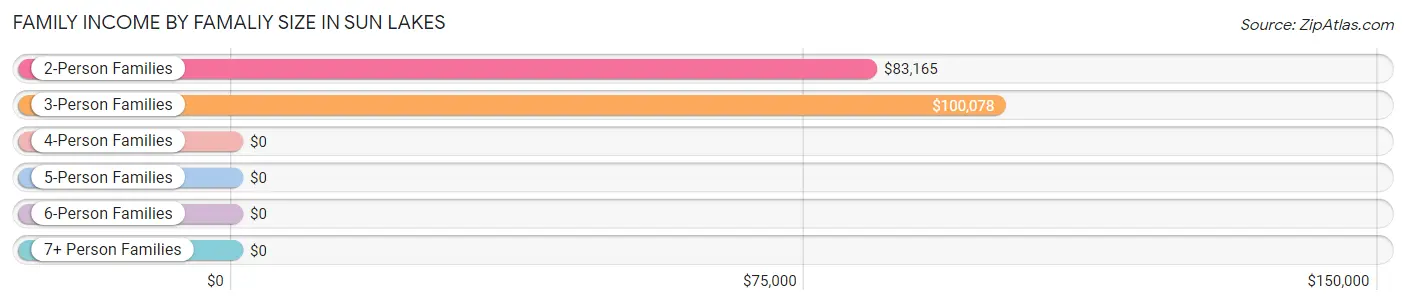
Family Income by Famaliy Size in Sun Lakes
3-person families (245 | 5.2%) account for the highest median family income in Sun Lakes with $100,078 per family, while 2-person families (4,474 | 94.4%) have the highest median income of $41,582 per family member.
| Income Bracket | # Families | Median Income |
| 2-Person Families | 4,474 (94.4%) | $83,165 |
| 3-Person Families | 245 (5.2%) | $100,078 |
| 4-Person Families | 20 (0.4%) | $0 |
| 5-Person Families | 0 (0.0%) | $0 |
| 6-Person Families | 0 (0.0%) | $0 |
| 7+ Person Families | 0 (0.0%) | $0 |
| Total | 4,739 (100.0%) | $84,182 |
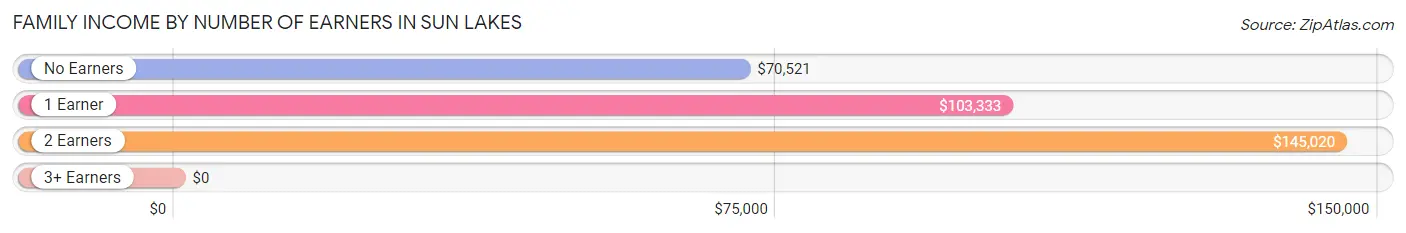
Family Income by Number of Earners in Sun Lakes
| Number of Earners | # Families | Median Income |
| No Earners | 3,059 (64.5%) | $70,521 |
| 1 Earner | 1,200 (25.3%) | $103,333 |
| 2 Earners | 451 (9.5%) | $145,020 |
| 3+ Earners | 29 (0.6%) | $0 |
| Total | 4,739 (100.0%) | $84,182 |
Household Income in Sun Lakes
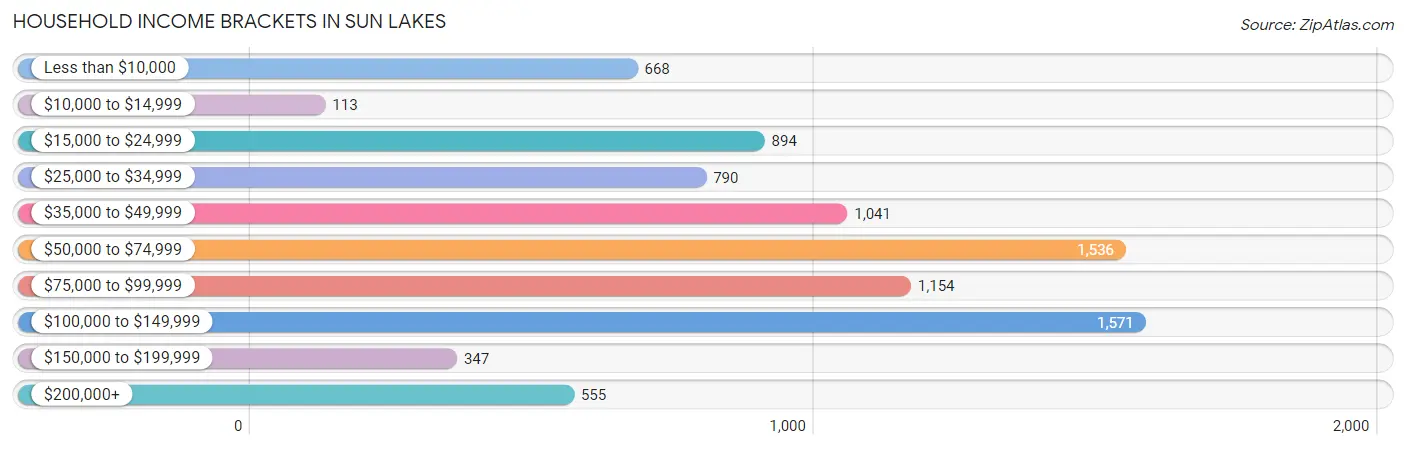
Household Income Brackets in Sun Lakes
With 1,571 households falling in the category, the $100,000 to $149,999 income range is the most frequent in Sun Lakes, accounting for 18.1% of all households. In contrast, only 113 households (1.3%) fall into the $10,000 to $14,999 income bracket, making it the least populous group.
| Income Bracket | # Households | % Households |
| Less than $10,000 | 668 | 7.7% |
| $10,000 to $14,999 | 113 | 1.3% |
| $15,000 to $24,999 | 894 | 10.3% |
| $25,000 to $34,999 | 790 | 9.1% |
| $35,000 to $49,999 | 1,041 | 12.0% |
| $50,000 to $74,999 | 1,536 | 17.7% |
| $75,000 to $99,999 | 1,154 | 13.3% |
| $100,000 to $149,999 | 1,571 | 18.1% |
| $150,000 to $199,999 | 347 | 4.0% |
| $200,000+ | 555 | 6.4% |
Household Income by Householder Age in Sun Lakes
The median household income in Sun Lakes is $62,148, with the highest median household income of $250,001 found in the 25 to 44 years age bracket for the primary householder. A total of 72 households (0.8%) fall into this category. Meanwhile, the 15 to 24 years age bracket for the primary householder has the lowest median household income of $0, with 8 households (0.1%) in this group.
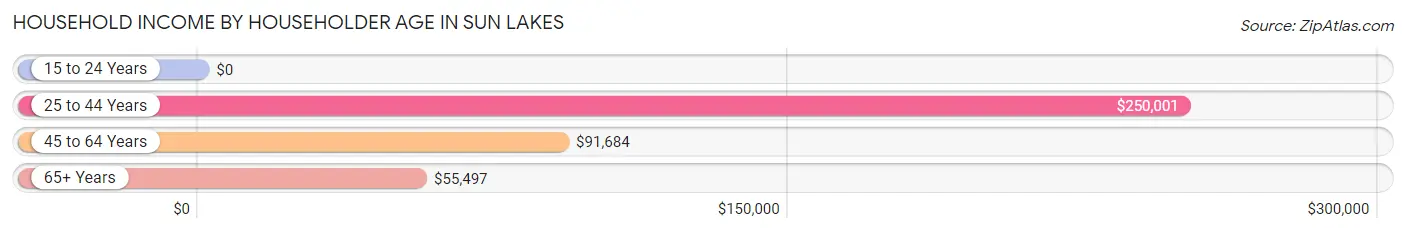
| Income Bracket | # Households | Median Income |
| 15 to 24 Years | 8 (0.1%) | $0 |
| 25 to 44 Years | 72 (0.8%) | $250,001 |
| 45 to 64 Years | 1,408 (16.2%) | $91,684 |
| 65+ Years | 7,189 (82.9%) | $55,497 |
| Total | 8,677 (100.0%) | $62,148 |
Poverty in Sun Lakes
Income Below Poverty by Sex and Age in Sun Lakes
With 8.7% poverty level for males and 8.6% for females among the residents of Sun Lakes, 18 to 24 year old males and 55 to 64 year old females are the most vulnerable to poverty, with 9 males (28.1%) and 162 females (11.6%) in their respective age groups living below the poverty level.
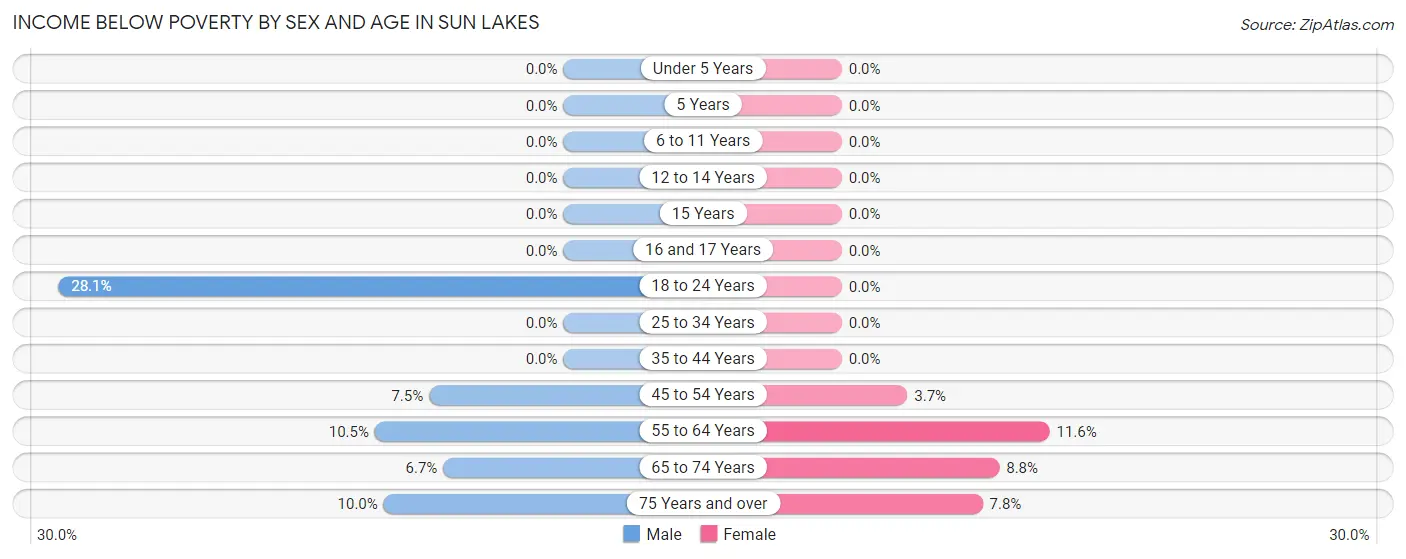
| Age Bracket | Male | Female |
| Under 5 Years | 0 (0.0%) | 0 (0.0%) |
| 5 Years | 0 (0.0%) | 0 (0.0%) |
| 6 to 11 Years | 0 (0.0%) | 0 (0.0%) |
| 12 to 14 Years | 0 (0.0%) | 0 (0.0%) |
| 15 Years | 0 (0.0%) | 0 (0.0%) |
| 16 and 17 Years | 0 (0.0%) | 0 (0.0%) |
| 18 to 24 Years | 9 (28.1%) | 0 (0.0%) |
| 25 to 34 Years | 0 (0.0%) | 0 (0.0%) |
| 35 to 44 Years | 0 (0.0%) | 0 (0.0%) |
| 45 to 54 Years | 11 (7.5%) | 8 (3.6%) |
| 55 to 64 Years | 92 (10.5%) | 162 (11.6%) |
| 65 to 74 Years | 130 (6.7%) | 252 (8.8%) |
| 75 Years and over | 294 (10.0%) | 263 (7.8%) |
| Total | 536 (8.7%) | 685 (8.6%) |
Income Above Poverty by Sex and Age in Sun Lakes
According to the poverty statistics in Sun Lakes, males aged 6 to 11 years and females aged 18 to 24 years are the age groups that are most secure financially, with 100.0% of males and 100.0% of females in these age groups living above the poverty line.
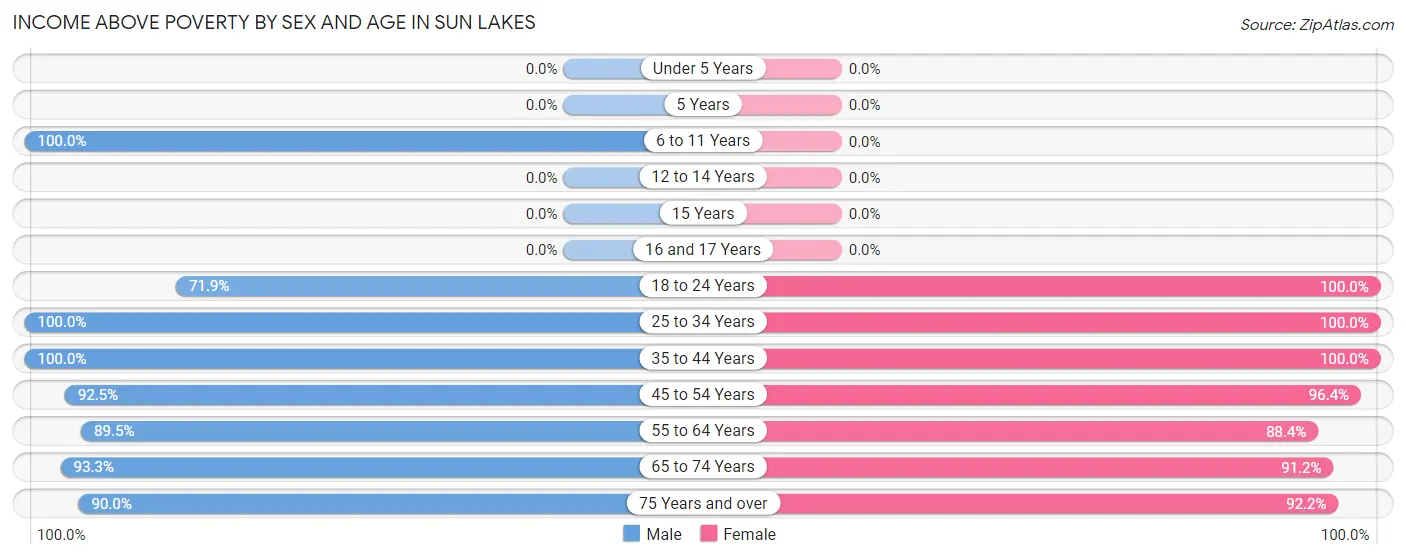
| Age Bracket | Male | Female |
| Under 5 Years | 0 (0.0%) | 0 (0.0%) |
| 5 Years | 0 (0.0%) | 0 (0.0%) |
| 6 to 11 Years | 21 (100.0%) | 0 (0.0%) |
| 12 to 14 Years | 0 (0.0%) | 0 (0.0%) |
| 15 Years | 0 (0.0%) | 0 (0.0%) |
| 16 and 17 Years | 0 (0.0%) | 0 (0.0%) |
| 18 to 24 Years | 23 (71.9%) | 26 (100.0%) |
| 25 to 34 Years | 78 (100.0%) | 74 (100.0%) |
| 35 to 44 Years | 133 (100.0%) | 35 (100.0%) |
| 45 to 54 Years | 136 (92.5%) | 211 (96.4%) |
| 55 to 64 Years | 784 (89.5%) | 1,238 (88.4%) |
| 65 to 74 Years | 1,813 (93.3%) | 2,621 (91.2%) |
| 75 Years and over | 2,642 (90.0%) | 3,091 (92.2%) |
| Total | 5,630 (91.3%) | 7,296 (91.4%) |
Income Below Poverty Among Married-Couple Families in Sun Lakes
The poverty statistics for married-couple families in Sun Lakes show that 4.8% or 216 of the total 4,472 families live below the poverty line. Families with no children have the highest poverty rate of 4.9%, comprising of 216 families. On the other hand, families with 1 or 2 children have the lowest poverty rate of 0.0%, which includes 0 families.
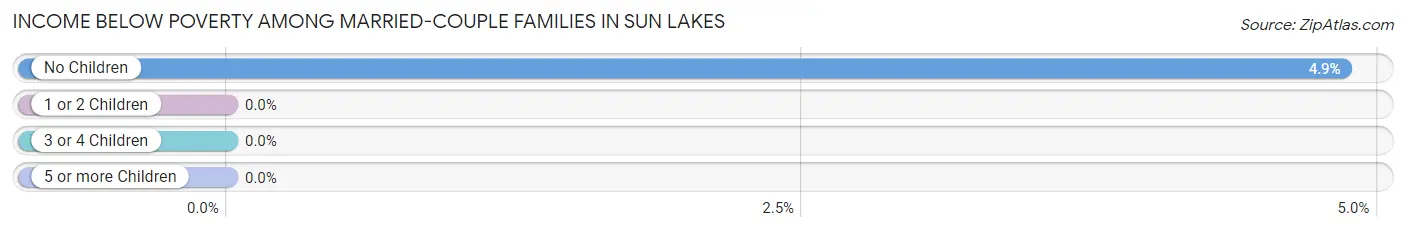
| Children | Above Poverty | Below Poverty |
| No Children | 4,236 (95.2%) | 216 (4.9%) |
| 1 or 2 Children | 20 (100.0%) | 0 (0.0%) |
| 3 or 4 Children | 0 (0.0%) | 0 (0.0%) |
| 5 or more Children | 0 (0.0%) | 0 (0.0%) |
| Total | 4,256 (95.2%) | 216 (4.8%) |
Income Below Poverty Among Single-Parent Households in Sun Lakes
| Children | Single Father | Single Mother |
| No Children | 0 (0.0%) | 0 (0.0%) |
| 1 or 2 Children | 0 (0.0%) | 0 (0.0%) |
| 3 or 4 Children | 0 (0.0%) | 0 (0.0%) |
| 5 or more Children | 0 (0.0%) | 0 (0.0%) |
| Total | 0 (0.0%) | 0 (0.0%) |
Income Below Poverty Among Married-Couple vs Single-Parent Households in Sun Lakes
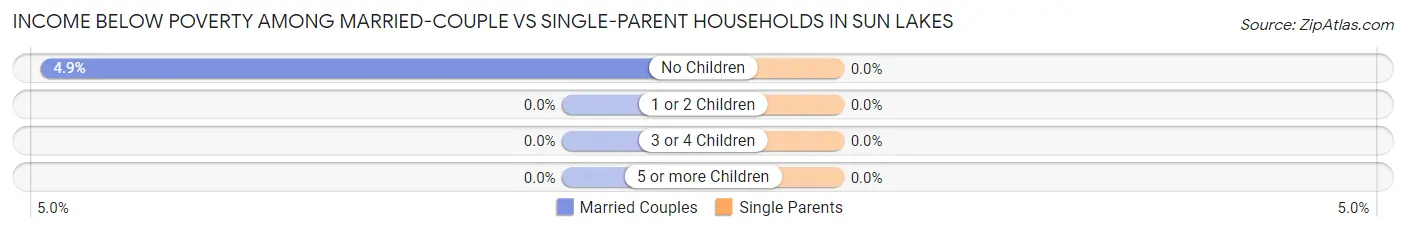
| Children | Married-Couple Families | Single-Parent Households |
| No Children | 216 (4.9%) | 0 (0.0%) |
| 1 or 2 Children | 0 (0.0%) | 0 (0.0%) |
| 3 or 4 Children | 0 (0.0%) | 0 (0.0%) |
| 5 or more Children | 0 (0.0%) | 0 (0.0%) |
| Total | 216 (4.8%) | 0 (0.0%) |
Race in Sun Lakes
The most populous races in Sun Lakes are White / Caucasian (13,631 | 96.4%), Hispanic or Latino (322 | 2.3%), and Two or more Races (178 | 1.3%).
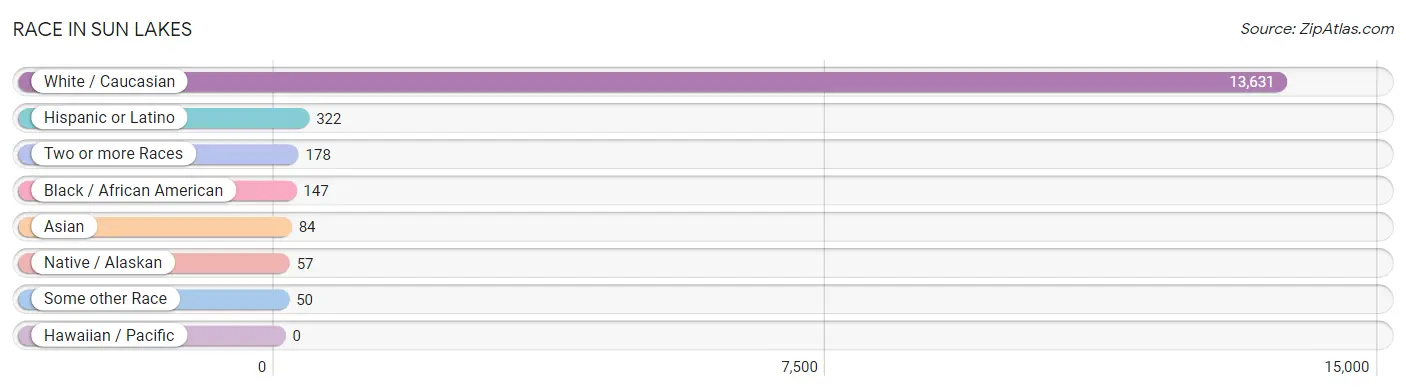
| Race | # Population | % Population |
| Asian | 84 | 0.6% |
| Black / African American | 147 | 1.0% |
| Hawaiian / Pacific | 0 | 0.0% |
| Hispanic or Latino | 322 | 2.3% |
| Native / Alaskan | 57 | 0.4% |
| White / Caucasian | 13,631 | 96.4% |
| Two or more Races | 178 | 1.3% |
| Some other Race | 50 | 0.4% |
| Total | 14,147 | 100.0% |
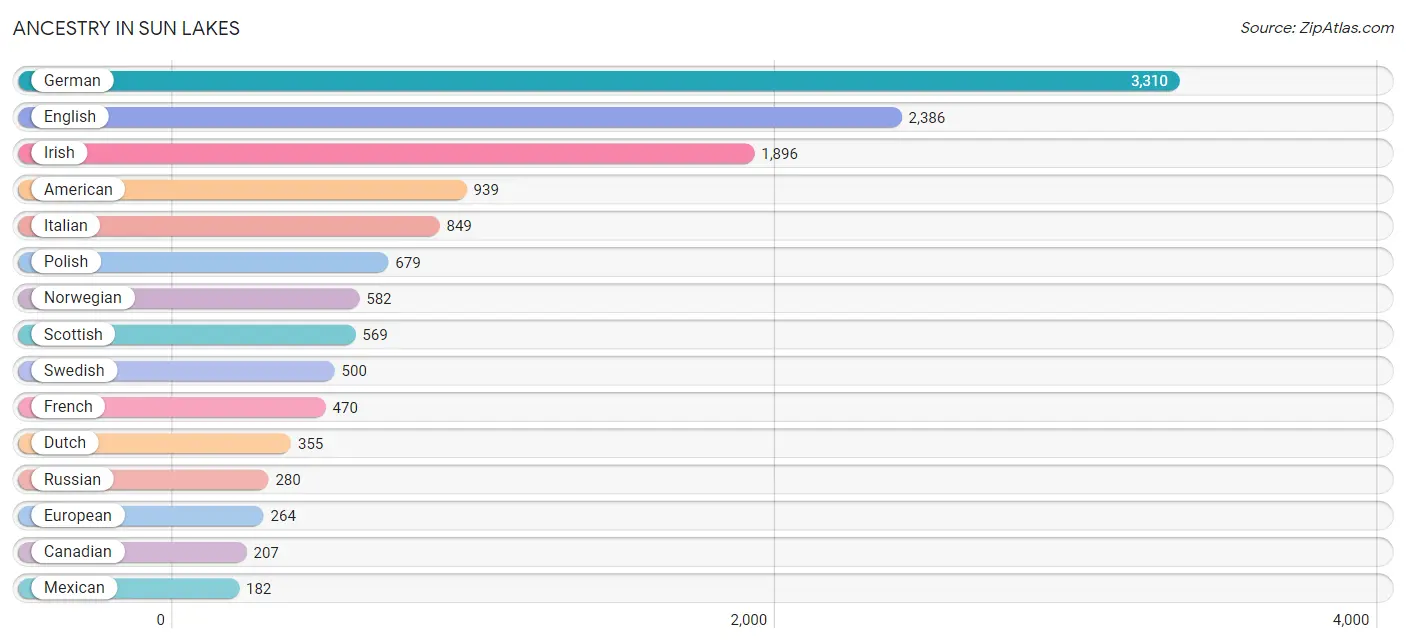
Ancestry in Sun Lakes
The most populous ancestries reported in Sun Lakes are German (3,310 | 23.4%), English (2,386 | 16.9%), Irish (1,896 | 13.4%), American (939 | 6.6%), and Italian (849 | 6.0%), together accounting for 66.3% of all Sun Lakes residents.
| Ancestry | # Population | % Population |
| African | 10 | 0.1% |
| American | 939 | 6.6% |
| Argentinean | 10 | 0.1% |
| Australian | 19 | 0.1% |
| Austrian | 73 | 0.5% |
| Basque | 10 | 0.1% |
| Belgian | 22 | 0.2% |
| Bhutanese | 21 | 0.2% |
| British | 117 | 0.8% |
| Burmese | 26 | 0.2% |
| Canadian | 207 | 1.5% |
| Central American | 9 | 0.1% |
| Central American Indian | 9 | 0.1% |
| Cherokee | 6 | 0.0% |
| Croatian | 25 | 0.2% |
| Czech | 63 | 0.4% |
| Czechoslovakian | 16 | 0.1% |
| Danish | 129 | 0.9% |
| Dutch | 355 | 2.5% |
| Eastern European | 153 | 1.1% |
| English | 2,386 | 16.9% |
| European | 264 | 1.9% |
| Finnish | 46 | 0.3% |
| French | 470 | 3.3% |
| French Canadian | 114 | 0.8% |
| German | 3,310 | 23.4% |
| Greek | 21 | 0.2% |
| Honduran | 9 | 0.1% |
| Hopi | 7 | 0.1% |
| Hungarian | 60 | 0.4% |
| Irish | 1,896 | 13.4% |
| Italian | 849 | 6.0% |
| Korean | 16 | 0.1% |
| Latvian | 12 | 0.1% |
| Lithuanian | 90 | 0.6% |
| Macedonian | 7 | 0.1% |
| Mexican | 182 | 1.3% |
| Native Hawaiian | 9 | 0.1% |
| Navajo | 7 | 0.1% |
| New Zealander | 8 | 0.1% |
| Northern European | 16 | 0.1% |
| Norwegian | 582 | 4.1% |
| Ottawa | 3 | 0.0% |
| Peruvian | 10 | 0.1% |
| Polish | 679 | 4.8% |
| Portuguese | 29 | 0.2% |
| Pueblo | 9 | 0.1% |
| Puerto Rican | 23 | 0.2% |
| Romanian | 18 | 0.1% |
| Russian | 280 | 2.0% |
| Scandinavian | 89 | 0.6% |
| Scotch-Irish | 170 | 1.2% |
| Scottish | 569 | 4.0% |
| Serbian | 24 | 0.2% |
| Slovak | 79 | 0.6% |
| South American | 20 | 0.1% |
| Spanish | 88 | 0.6% |
| Sri Lankan | 29 | 0.2% |
| Subsaharan African | 10 | 0.1% |
| Swedish | 500 | 3.5% |
| Swiss | 131 | 0.9% |
| Tohono O'Odham | 16 | 0.1% |
| Ukrainian | 87 | 0.6% |
| Welsh | 139 | 1.0% |
| Yugoslavian | 19 | 0.1% | View All 65 Rows |
Immigrants in Sun Lakes
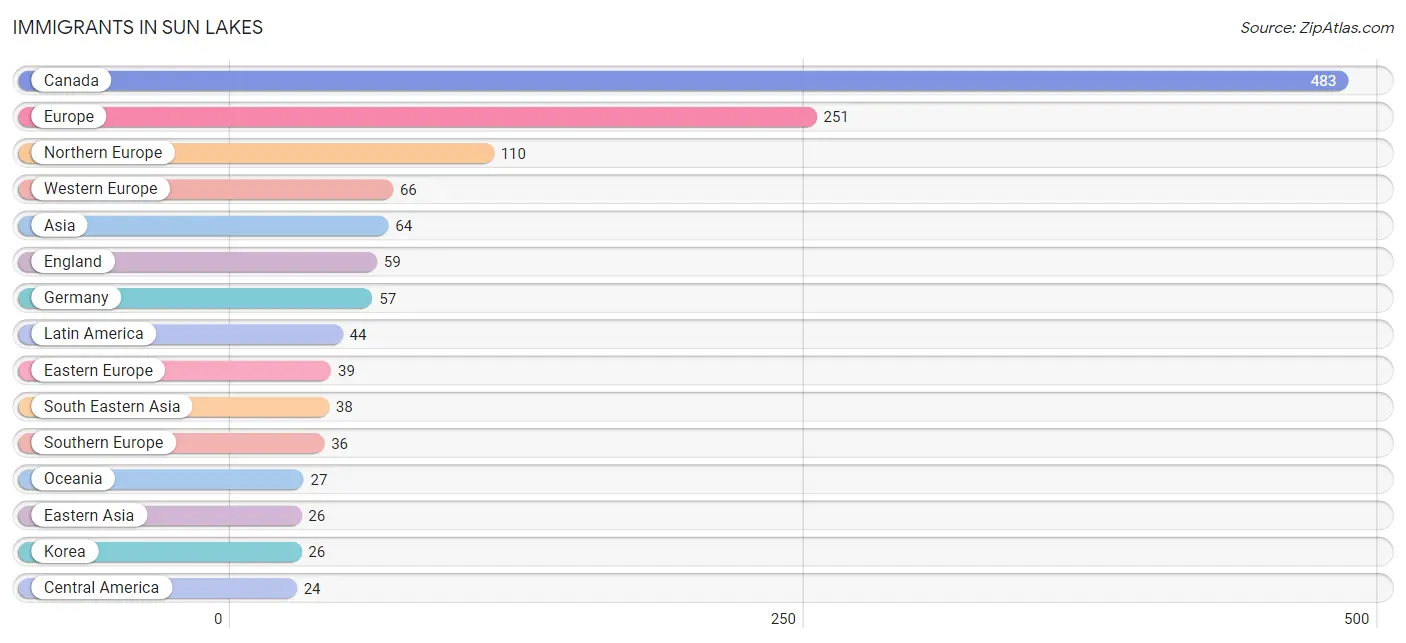
The most numerous immigrant groups reported in Sun Lakes came from Canada (483 | 3.4%), Europe (251 | 1.8%), Northern Europe (110 | 0.8%), Western Europe (66 | 0.5%), and Asia (64 | 0.4%), together accounting for 6.9% of all Sun Lakes residents.
| Immigration Origin | # Population | % Population |
| Argentina | 10 | 0.1% |
| Asia | 64 | 0.4% |
| Australia | 19 | 0.1% |
| Canada | 483 | 3.4% |
| Central America | 24 | 0.2% |
| Eastern Asia | 26 | 0.2% |
| Eastern Europe | 39 | 0.3% |
| England | 59 | 0.4% |
| Europe | 251 | 1.8% |
| Germany | 57 | 0.4% |
| Greece | 12 | 0.1% |
| Hungary | 8 | 0.1% |
| Ireland | 6 | 0.0% |
| Italy | 24 | 0.2% |
| Korea | 26 | 0.2% |
| Latin America | 44 | 0.3% |
| Mexico | 24 | 0.2% |
| Netherlands | 9 | 0.1% |
| Northern Europe | 110 | 0.8% |
| Oceania | 27 | 0.2% |
| Peru | 10 | 0.1% |
| Philippines | 18 | 0.1% |
| Scotland | 11 | 0.1% |
| Serbia | 24 | 0.2% |
| South America | 20 | 0.1% |
| South Eastern Asia | 38 | 0.3% |
| Southern Europe | 36 | 0.3% |
| Vietnam | 20 | 0.1% |
| Western Europe | 66 | 0.5% | View All 29 Rows |
Sex and Age in Sun Lakes
Sex and Age in Sun Lakes
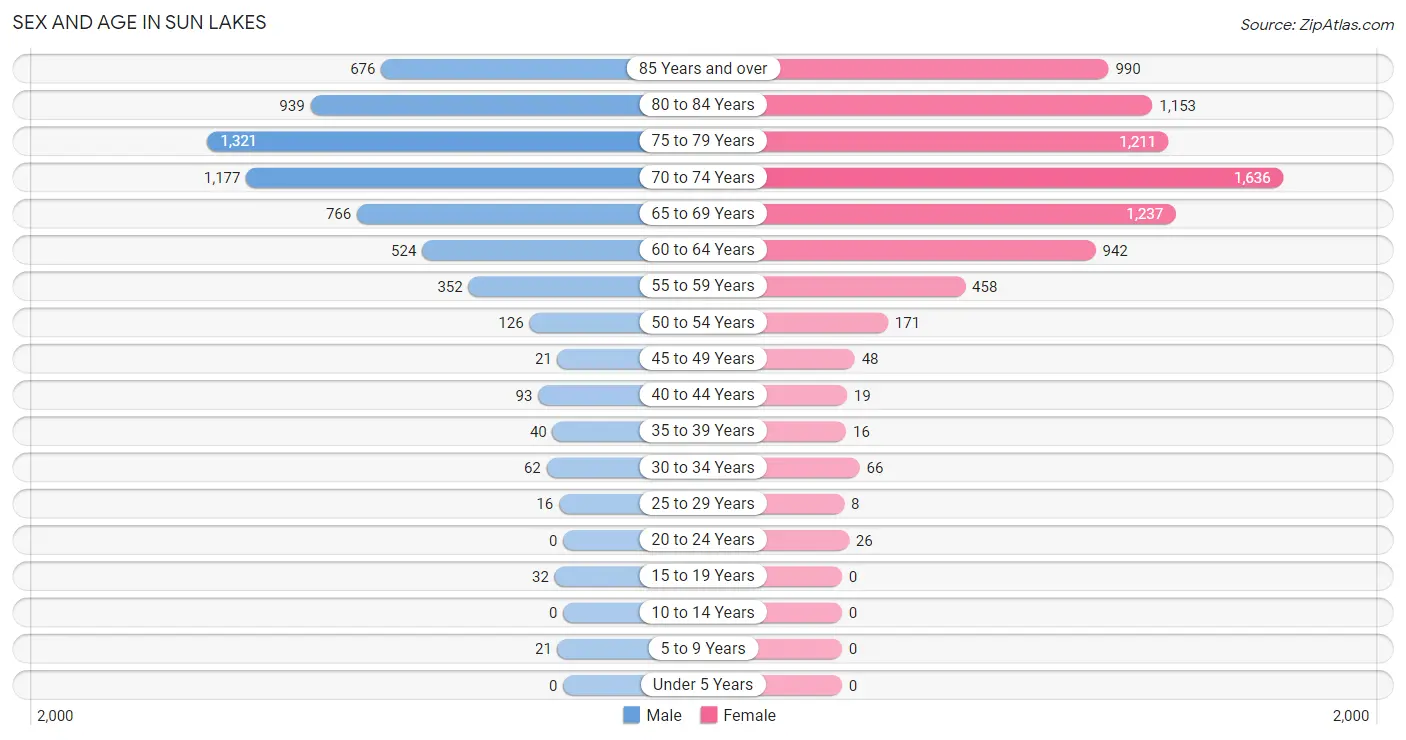
The most populous age groups in Sun Lakes are 75 to 79 Years (1,321 | 21.4%) for men and 70 to 74 Years (1,636 | 20.5%) for women.
| Age Bracket | Male | Female |
| Under 5 Years | 0 (0.0%) | 0 (0.0%) |
| 5 to 9 Years | 21 (0.3%) | 0 (0.0%) |
| 10 to 14 Years | 0 (0.0%) | 0 (0.0%) |
| 15 to 19 Years | 32 (0.5%) | 0 (0.0%) |
| 20 to 24 Years | 0 (0.0%) | 26 (0.3%) |
| 25 to 29 Years | 16 (0.3%) | 8 (0.1%) |
| 30 to 34 Years | 62 (1.0%) | 66 (0.8%) |
| 35 to 39 Years | 40 (0.6%) | 16 (0.2%) |
| 40 to 44 Years | 93 (1.5%) | 19 (0.2%) |
| 45 to 49 Years | 21 (0.3%) | 48 (0.6%) |
| 50 to 54 Years | 126 (2.0%) | 171 (2.1%) |
| 55 to 59 Years | 352 (5.7%) | 458 (5.7%) |
| 60 to 64 Years | 524 (8.5%) | 942 (11.8%) |
| 65 to 69 Years | 766 (12.4%) | 1,237 (15.5%) |
| 70 to 74 Years | 1,177 (19.1%) | 1,636 (20.5%) |
| 75 to 79 Years | 1,321 (21.4%) | 1,211 (15.2%) |
| 80 to 84 Years | 939 (15.2%) | 1,153 (14.4%) |
| 85 Years and over | 676 (11.0%) | 990 (12.4%) |
| Total | 6,166 (100.0%) | 7,981 (100.0%) |
Families and Households in Sun Lakes
Median Family Size in Sun Lakes
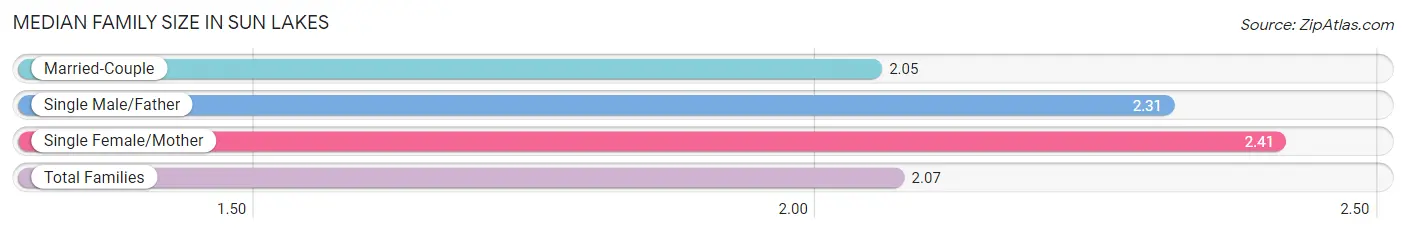
The median family size in Sun Lakes is 2.07 persons per family, with single female/mother families (235 | 5.0%) accounting for the largest median family size of 2.41 persons per family. On the other hand, married-couple families (4,472 | 94.4%) represent the smallest median family size with 2.05 persons per family.
| Family Type | # Families | Family Size |
| Married-Couple | 4,472 (94.4%) | 2.05 |
| Single Male/Father | 32 (0.7%) | 2.31 |
| Single Female/Mother | 235 (5.0%) | 2.41 |
| Total Families | 4,739 (100.0%) | 2.07 |
Median Household Size in Sun Lakes
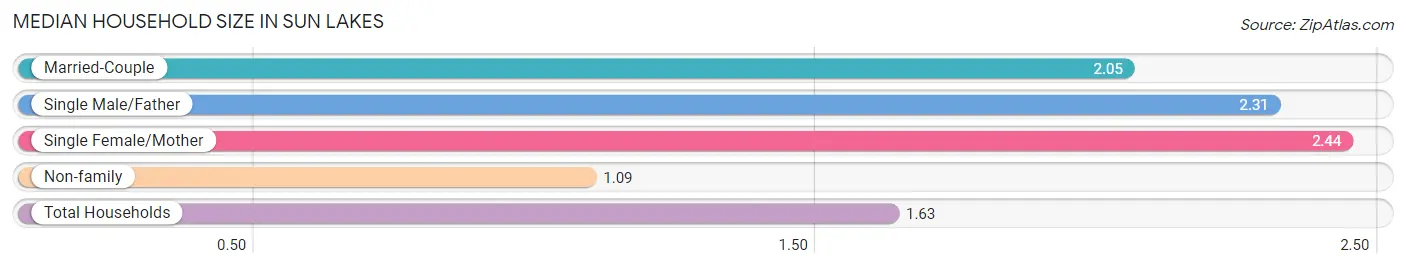
The median household size in Sun Lakes is 1.63 persons per household, with single female/mother households (235 | 2.7%) accounting for the largest median household size of 2.44 persons per household. non-family households (3,938 | 45.4%) represent the smallest median household size with 1.09 persons per household.
| Household Type | # Households | Household Size |
| Married-Couple | 4,472 (51.5%) | 2.05 |
| Single Male/Father | 32 (0.4%) | 2.31 |
| Single Female/Mother | 235 (2.7%) | 2.44 |
| Non-family | 3,938 (45.4%) | 1.09 |
| Total Households | 8,677 (100.0%) | 1.63 |
Household Size by Marriage Status in Sun Lakes
Out of a total of 8,677 households in Sun Lakes, 4,739 (54.6%) are family households, while 3,938 (45.4%) are nonfamily households. The most numerous type of family households are 2-person households, comprising 4,464, and the most common type of nonfamily households are 1-person households, comprising 3,611.
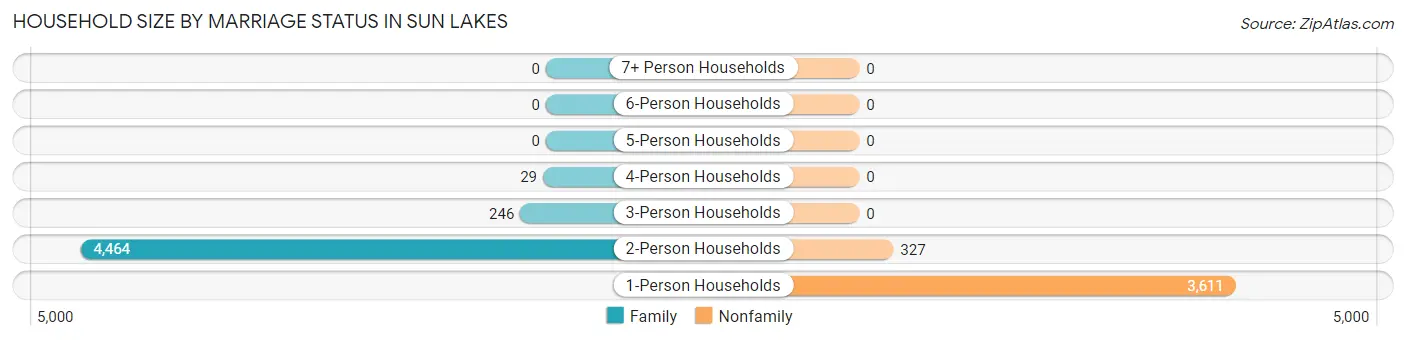
| Household Size | Family Households | Nonfamily Households |
| 1-Person Households | - | 3,611 (41.6%) |
| 2-Person Households | 4,464 (51.4%) | 327 (3.8%) |
| 3-Person Households | 246 (2.8%) | 0 (0.0%) |
| 4-Person Households | 29 (0.3%) | 0 (0.0%) |
| 5-Person Households | 0 (0.0%) | 0 (0.0%) |
| 6-Person Households | 0 (0.0%) | 0 (0.0%) |
| 7+ Person Households | 0 (0.0%) | 0 (0.0%) |
| Total | 4,739 (54.6%) | 3,938 (45.4%) |
Female Fertility in Sun Lakes
Fertility by Age in Sun Lakes
| Age Bracket | Women with Births | Births / 1,000 Women |
| 15 to 19 years | 0 (0.0%) | 0.0 |
| 20 to 34 years | 0 (0.0%) | 0.0 |
| 35 to 50 years | 0 (0.0%) | 0.0 |
| Total | 0 (0.0%) | 0.0 |
Fertility by Age by Marriage Status in Sun Lakes
| Age Bracket | Married | Unmarried |
| 15 to 19 years | 0 (0.0%) | 0 (0.0%) |
| 20 to 34 years | 0 (0.0%) | 0 (0.0%) |
| 35 to 50 years | 0 (0.0%) | 0 (0.0%) |
| Total | 0 (0.0%) | 0 (0.0%) |
Fertility by Education in Sun Lakes
| Educational Attainment | Women with Births | Births / 1,000 Women |
| Less than High School | 0 (0.0%) | 0.0 |
| High School Diploma | 0 (0.0%) | 0.0 |
| College or Associate's Degree | 0 (0.0%) | 0.0 |
| Bachelor's Degree | 0 (0.0%) | 0.0 |
| Graduate Degree | 0 (0.0%) | 0.0 |
| Total | 0 (0.0%) | 0.0 |
Fertility by Education by Marriage Status in Sun Lakes
| Educational Attainment | Married | Unmarried |
| Less than High School | 0 (0.0%) | 0 (0.0%) |
| High School Diploma | 0 (0.0%) | 0 (0.0%) |
| College or Associate's Degree | 0 (0.0%) | 0 (0.0%) |
| Bachelor's Degree | 0 (0.0%) | 0 (0.0%) |
| Graduate Degree | 0 (0.0%) | 0 (0.0%) |
| Total | 0 (0.0%) | 0 (0.0%) |
Employment Characteristics in Sun Lakes
Employment by Class of Employer in Sun Lakes
Among the 2,656 employed individuals in Sun Lakes, private company employees (1,286 | 48.4%), local government employees (382 | 14.4%), and not-for-profit organizations (291 | 11.0%) make up the most common classes of employment.
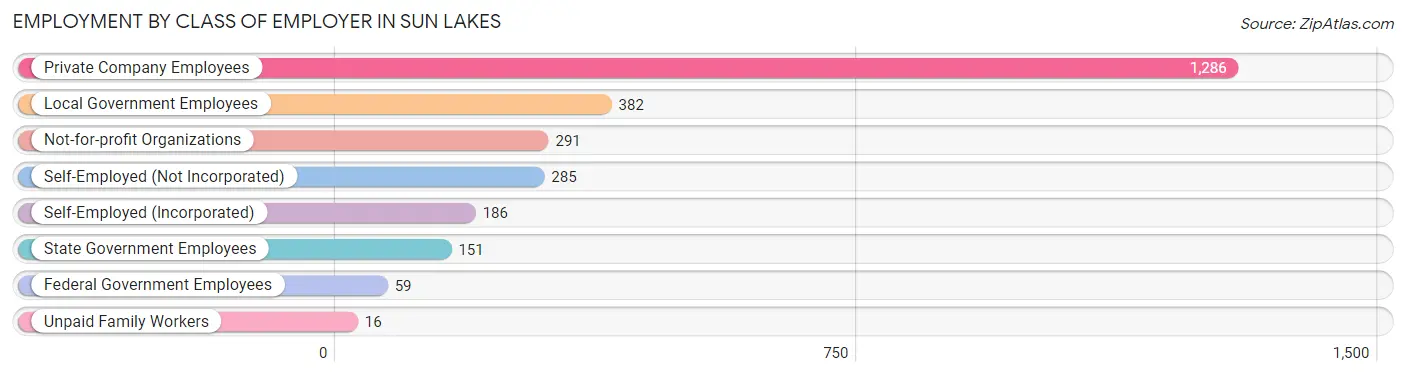
| Employer Class | # Employees | % Employees |
| Private Company Employees | 1,286 | 48.4% |
| Self-Employed (Incorporated) | 186 | 7.0% |
| Self-Employed (Not Incorporated) | 285 | 10.7% |
| Not-for-profit Organizations | 291 | 11.0% |
| Local Government Employees | 382 | 14.4% |
| State Government Employees | 151 | 5.7% |
| Federal Government Employees | 59 | 2.2% |
| Unpaid Family Workers | 16 | 0.6% |
| Total | 2,656 | 100.0% |
Employment Status by Age in Sun Lakes
According to the labor force statistics for Sun Lakes, out of the total population over 16 years of age (14,126), 20.6% or 2,910 individuals are in the labor force, with 6.1% or 178 of them unemployed. The age group with the highest labor force participation rate is 20 to 24 years, with 100.0% or 26 individuals in the labor force. Within the labor force, the 20 to 24 years age range has the highest percentage of unemployed individuals, with 38.5% or 10 of them being unemployed.
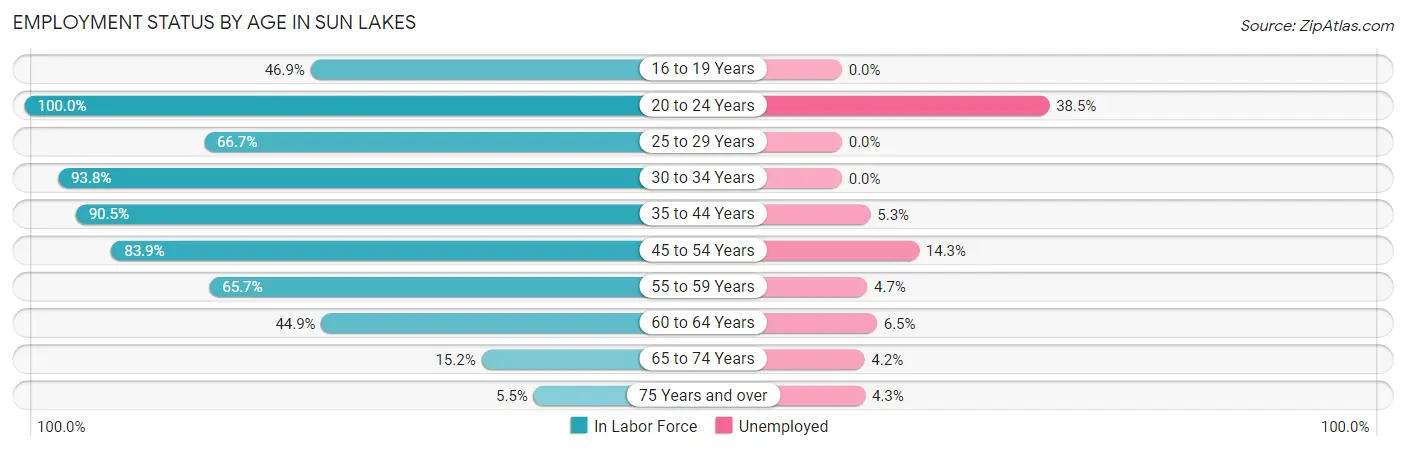
| Age Bracket | In Labor Force | Unemployed |
| 16 to 19 Years | 15 (46.9%) | 0 (0.0%) |
| 20 to 24 Years | 26 (100.0%) | 10 (38.5%) |
| 25 to 29 Years | 16 (66.7%) | 0 (0.0%) |
| 30 to 34 Years | 120 (93.8%) | 0 (0.0%) |
| 35 to 44 Years | 152 (90.5%) | 8 (5.3%) |
| 45 to 54 Years | 307 (83.9%) | 44 (14.3%) |
| 55 to 59 Years | 532 (65.7%) | 25 (4.7%) |
| 60 to 64 Years | 658 (44.9%) | 43 (6.5%) |
| 65 to 74 Years | 732 (15.2%) | 31 (4.2%) |
| 75 Years and over | 346 (5.5%) | 15 (4.3%) |
| Total | 2,910 (20.6%) | 178 (6.1%) |
Employment Status by Educational Attainment in Sun Lakes
According to labor force statistics for Sun Lakes, 60.3% of individuals (1,786) out of the total population between 25 and 64 years of age (2,962) are in the labor force, with 6.8% or 121 of them being unemployed. The group with the highest labor force participation rate are those with the educational attainment of less than high school, with 69.4% or 50 individuals in the labor force. Within the labor force, individuals with less than high school education have the highest percentage of unemployment, with 32.0% or 16 of them being unemployed.
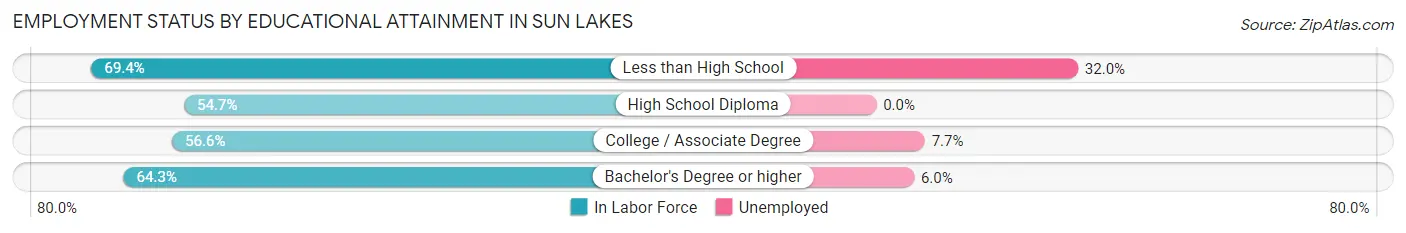
| Educational Attainment | In Labor Force | Unemployed |
| Less than High School | 50 (69.4%) | 23 (32.0%) |
| High School Diploma | 186 (54.7%) | 0 (0.0%) |
| College / Associate Degree | 661 (56.6%) | 90 (7.7%) |
| Bachelor's Degree or higher | 889 (64.3%) | 83 (6.0%) |
| Total | 1,786 (60.3%) | 201 (6.8%) |
Employment Occupations by Sex in Sun Lakes
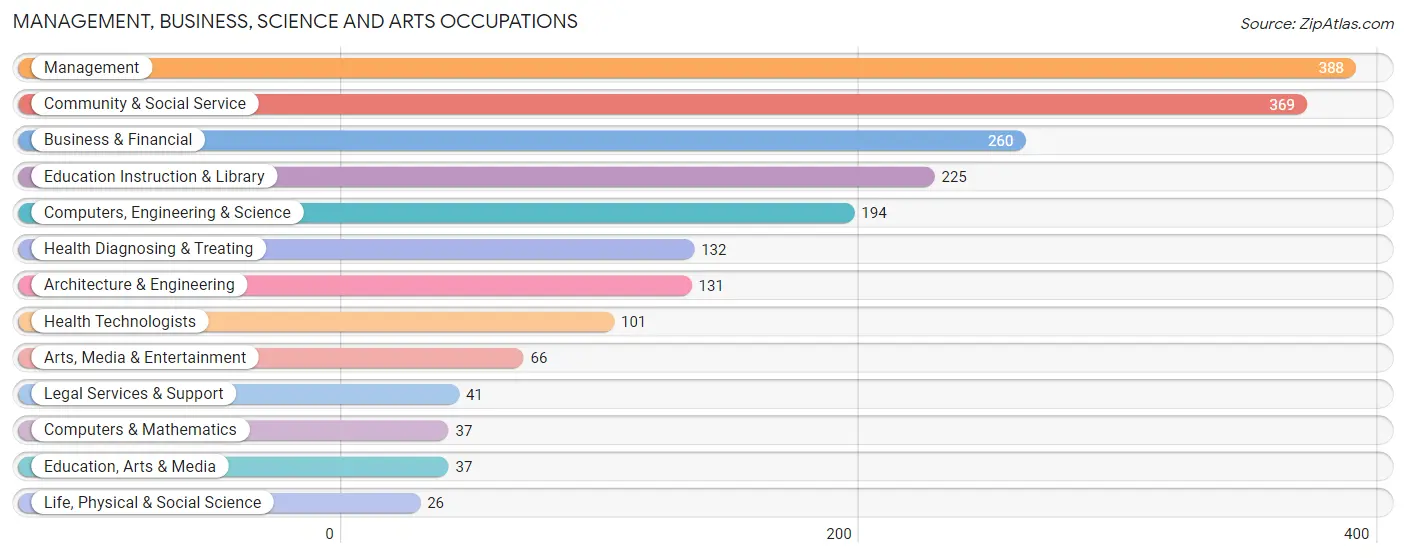
Management, Business, Science and Arts Occupations
The most common Management, Business, Science and Arts occupations in Sun Lakes are Management (388 | 14.3%), Community & Social Service (369 | 13.6%), Business & Financial (260 | 9.6%), Education Instruction & Library (225 | 8.3%), and Computers, Engineering & Science (194 | 7.1%).
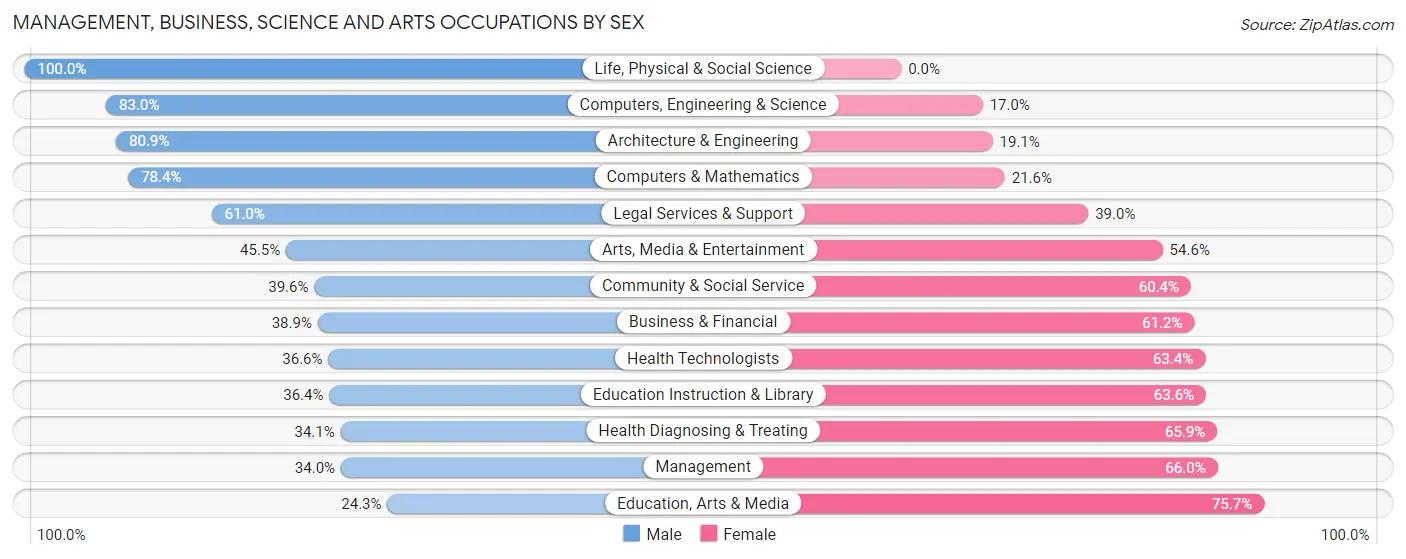
Management, Business, Science and Arts Occupations by Sex
Within the Management, Business, Science and Arts occupations in Sun Lakes, the most male-oriented occupations are Life, Physical & Social Science (100.0%), Computers, Engineering & Science (83.0%), and Architecture & Engineering (80.9%), while the most female-oriented occupations are Education, Arts & Media (75.7%), Management (66.0%), and Health Diagnosing & Treating (65.9%).
| Occupation | Male | Female |
| Management | 132 (34.0%) | 256 (66.0%) |
| Business & Financial | 101 (38.9%) | 159 (61.2%) |
| Computers, Engineering & Science | 161 (83.0%) | 33 (17.0%) |
| Computers & Mathematics | 29 (78.4%) | 8 (21.6%) |
| Architecture & Engineering | 106 (80.9%) | 25 (19.1%) |
| Life, Physical & Social Science | 26 (100.0%) | 0 (0.0%) |
| Community & Social Service | 146 (39.6%) | 223 (60.4%) |
| Education, Arts & Media | 9 (24.3%) | 28 (75.7%) |
| Legal Services & Support | 25 (61.0%) | 16 (39.0%) |
| Education Instruction & Library | 82 (36.4%) | 143 (63.6%) |
| Arts, Media & Entertainment | 30 (45.5%) | 36 (54.5%) |
| Health Diagnosing & Treating | 45 (34.1%) | 87 (65.9%) |
| Health Technologists | 37 (36.6%) | 64 (63.4%) |
| Total (Category) | 585 (43.6%) | 758 (56.4%) |
| Total (Overall) | 1,214 (44.7%) | 1,504 (55.3%) |
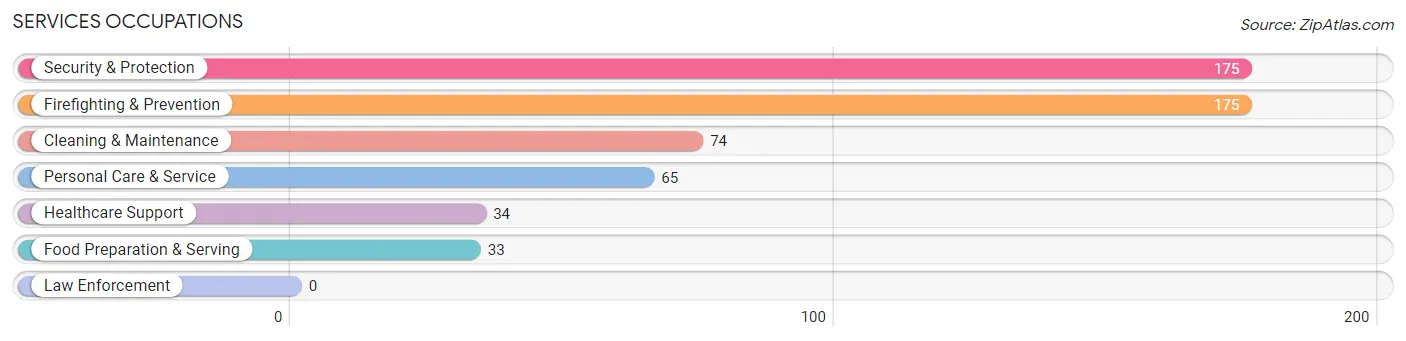
Services Occupations
The most common Services occupations in Sun Lakes are Security & Protection (175 | 6.4%), Firefighting & Prevention (175 | 6.4%), Cleaning & Maintenance (74 | 2.7%), Personal Care & Service (65 | 2.4%), and Healthcare Support (34 | 1.3%).
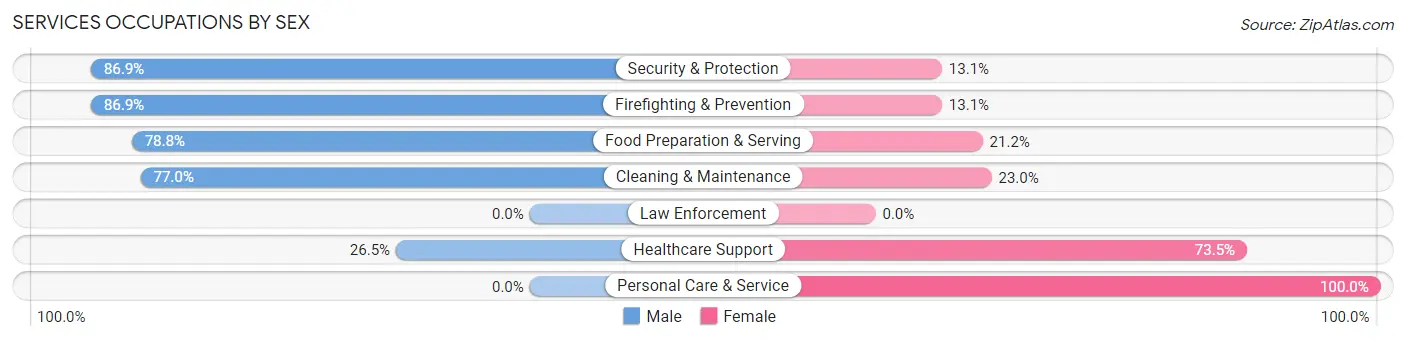
Services Occupations by Sex
Within the Services occupations in Sun Lakes, the most male-oriented occupations are Security & Protection (86.9%), Firefighting & Prevention (86.9%), and Food Preparation & Serving (78.8%), while the most female-oriented occupations are Personal Care & Service (100.0%), Healthcare Support (73.5%), and Cleaning & Maintenance (23.0%).
| Occupation | Male | Female |
| Healthcare Support | 9 (26.5%) | 25 (73.5%) |
| Security & Protection | 152 (86.9%) | 23 (13.1%) |
| Firefighting & Prevention | 152 (86.9%) | 23 (13.1%) |
| Law Enforcement | 0 (0.0%) | 0 (0.0%) |
| Food Preparation & Serving | 26 (78.8%) | 7 (21.2%) |
| Cleaning & Maintenance | 57 (77.0%) | 17 (23.0%) |
| Personal Care & Service | 0 (0.0%) | 65 (100.0%) |
| Total (Category) | 244 (64.0%) | 137 (36.0%) |
| Total (Overall) | 1,214 (44.7%) | 1,504 (55.3%) |
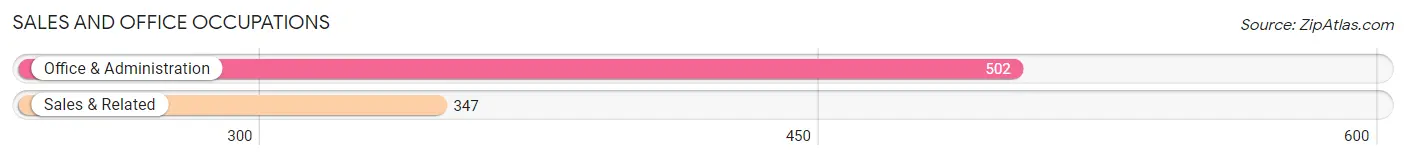
Sales and Office Occupations
The most common Sales and Office occupations in Sun Lakes are Office & Administration (502 | 18.5%), and Sales & Related (347 | 12.8%).
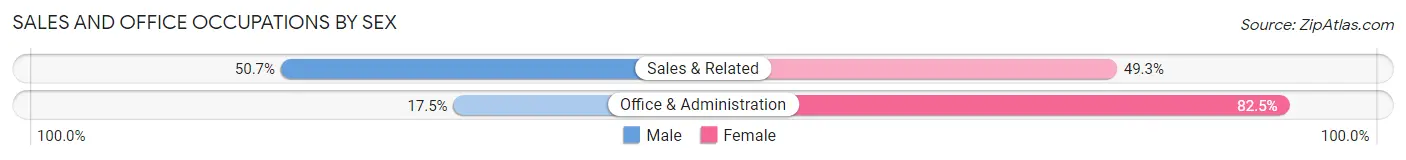
Sales and Office Occupations by Sex
| Occupation | Male | Female |
| Sales & Related | 176 (50.7%) | 171 (49.3%) |
| Office & Administration | 88 (17.5%) | 414 (82.5%) |
| Total (Category) | 264 (31.1%) | 585 (68.9%) |
| Total (Overall) | 1,214 (44.7%) | 1,504 (55.3%) |
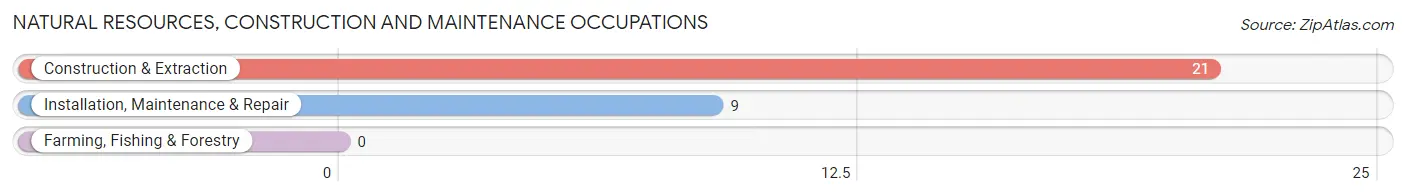
Natural Resources, Construction and Maintenance Occupations
The most common Natural Resources, Construction and Maintenance occupations in Sun Lakes are Construction & Extraction (21 | 0.8%), and Installation, Maintenance & Repair (9 | 0.3%).
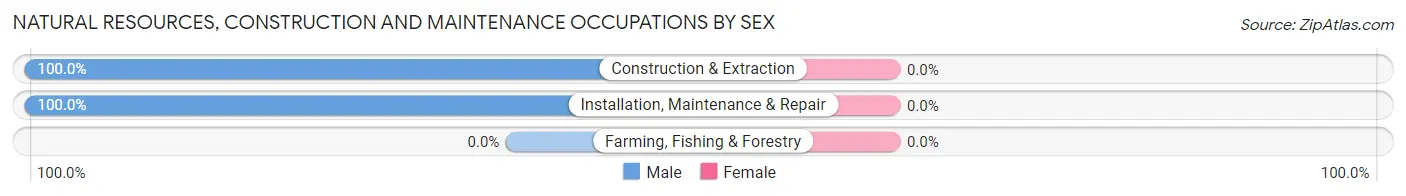
Natural Resources, Construction and Maintenance Occupations by Sex
| Occupation | Male | Female |
| Farming, Fishing & Forestry | 0 (0.0%) | 0 (0.0%) |
| Construction & Extraction | 21 (100.0%) | 0 (0.0%) |
| Installation, Maintenance & Repair | 9 (100.0%) | 0 (0.0%) |
| Total (Category) | 30 (100.0%) | 0 (0.0%) |
| Total (Overall) | 1,214 (44.7%) | 1,504 (55.3%) |
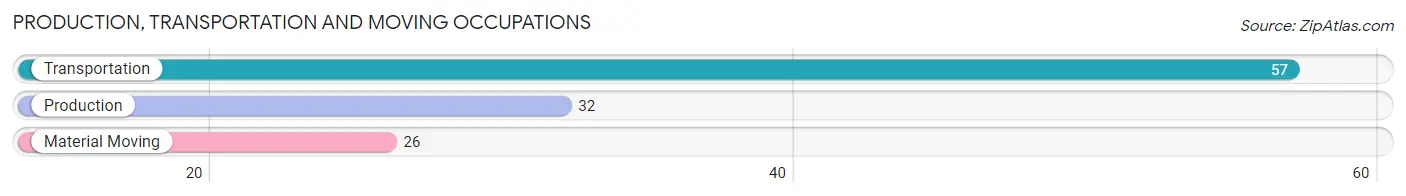
Production, Transportation and Moving Occupations
The most common Production, Transportation and Moving occupations in Sun Lakes are Transportation (57 | 2.1%), Production (32 | 1.2%), and Material Moving (26 | 1.0%).
Production, Transportation and Moving Occupations by Sex
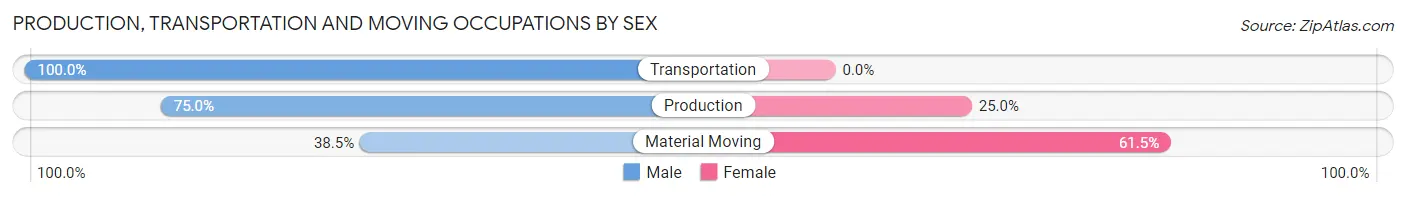
| Occupation | Male | Female |
| Production | 24 (75.0%) | 8 (25.0%) |
| Transportation | 57 (100.0%) | 0 (0.0%) |
| Material Moving | 10 (38.5%) | 16 (61.5%) |
| Total (Category) | 91 (79.1%) | 24 (20.9%) |
| Total (Overall) | 1,214 (44.7%) | 1,504 (55.3%) |
Employment Industries by Sex in Sun Lakes
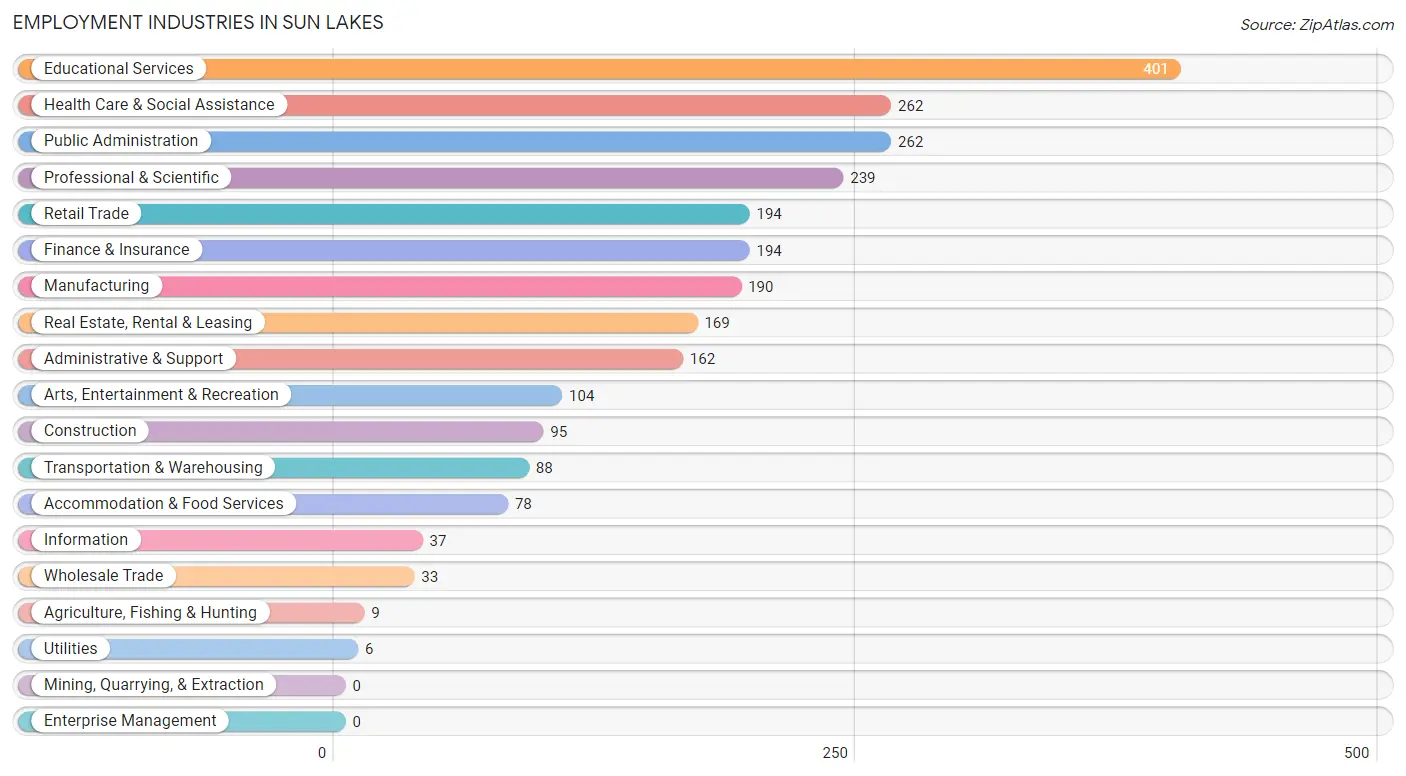
Employment Industries in Sun Lakes
The major employment industries in Sun Lakes include Educational Services (401 | 14.7%), Health Care & Social Assistance (262 | 9.6%), Public Administration (262 | 9.6%), Professional & Scientific (239 | 8.8%), and Retail Trade (194 | 7.1%).
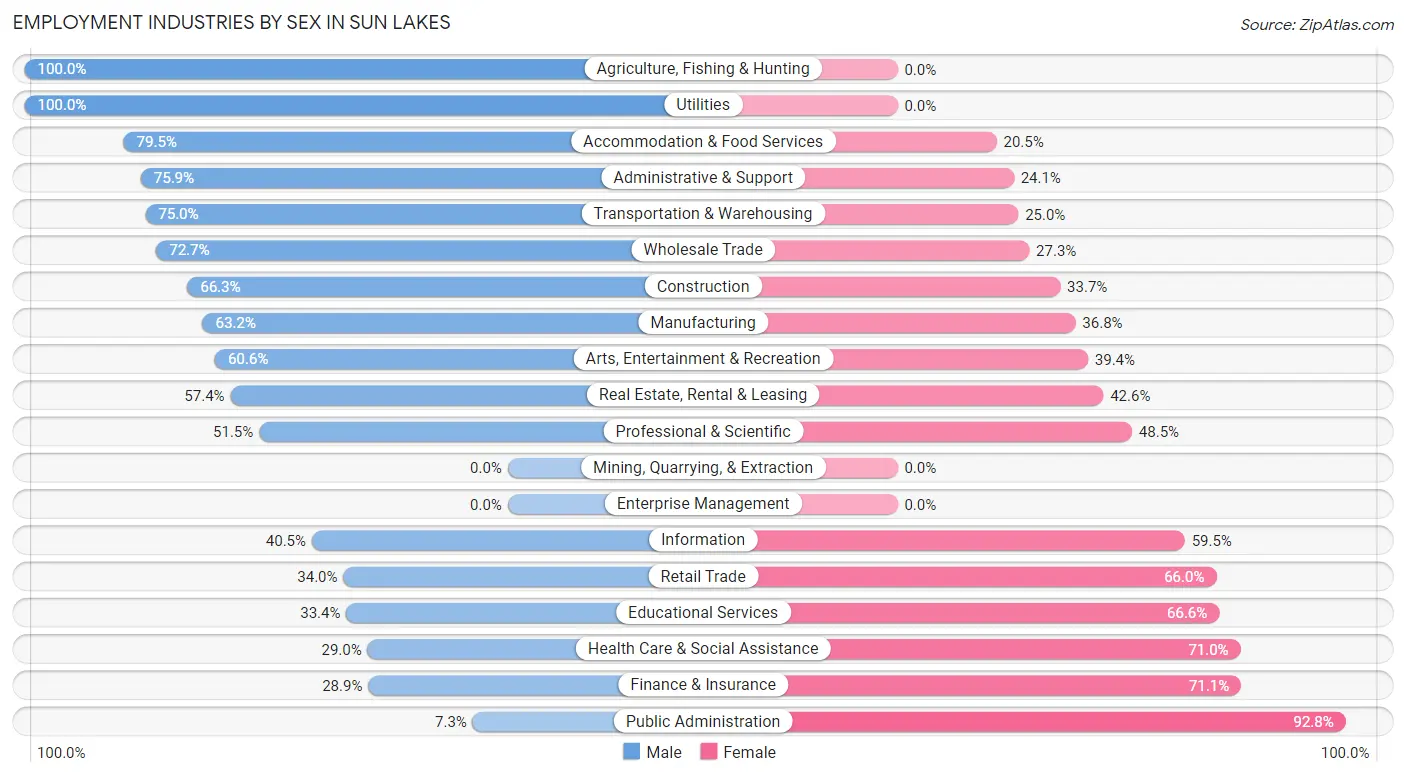
Employment Industries by Sex in Sun Lakes
The Sun Lakes industries that see more men than women are Agriculture, Fishing & Hunting (100.0%), Utilities (100.0%), and Accommodation & Food Services (79.5%), whereas the industries that tend to have a higher number of women are Public Administration (92.7%), Finance & Insurance (71.1%), and Health Care & Social Assistance (71.0%).
| Industry | Male | Female |
| Agriculture, Fishing & Hunting | 9 (100.0%) | 0 (0.0%) |
| Mining, Quarrying, & Extraction | 0 (0.0%) | 0 (0.0%) |
| Construction | 63 (66.3%) | 32 (33.7%) |
| Manufacturing | 120 (63.2%) | 70 (36.8%) |
| Wholesale Trade | 24 (72.7%) | 9 (27.3%) |
| Retail Trade | 66 (34.0%) | 128 (66.0%) |
| Transportation & Warehousing | 66 (75.0%) | 22 (25.0%) |
| Utilities | 6 (100.0%) | 0 (0.0%) |
| Information | 15 (40.5%) | 22 (59.5%) |
| Finance & Insurance | 56 (28.9%) | 138 (71.1%) |
| Real Estate, Rental & Leasing | 97 (57.4%) | 72 (42.6%) |
| Professional & Scientific | 123 (51.5%) | 116 (48.5%) |
| Enterprise Management | 0 (0.0%) | 0 (0.0%) |
| Administrative & Support | 123 (75.9%) | 39 (24.1%) |
| Educational Services | 134 (33.4%) | 267 (66.6%) |
| Health Care & Social Assistance | 76 (29.0%) | 186 (71.0%) |
| Arts, Entertainment & Recreation | 63 (60.6%) | 41 (39.4%) |
| Accommodation & Food Services | 62 (79.5%) | 16 (20.5%) |
| Public Administration | 19 (7.2%) | 243 (92.7%) |
| Total | 1,214 (44.7%) | 1,504 (55.3%) |
Education in Sun Lakes
School Enrollment in Sun Lakes
The most common levels of schooling among the 248 students in Sun Lakes are college / undergraduate (134 | 54.0%), graduate / professional (92 | 37.1%), and high school (22 | 8.9%).
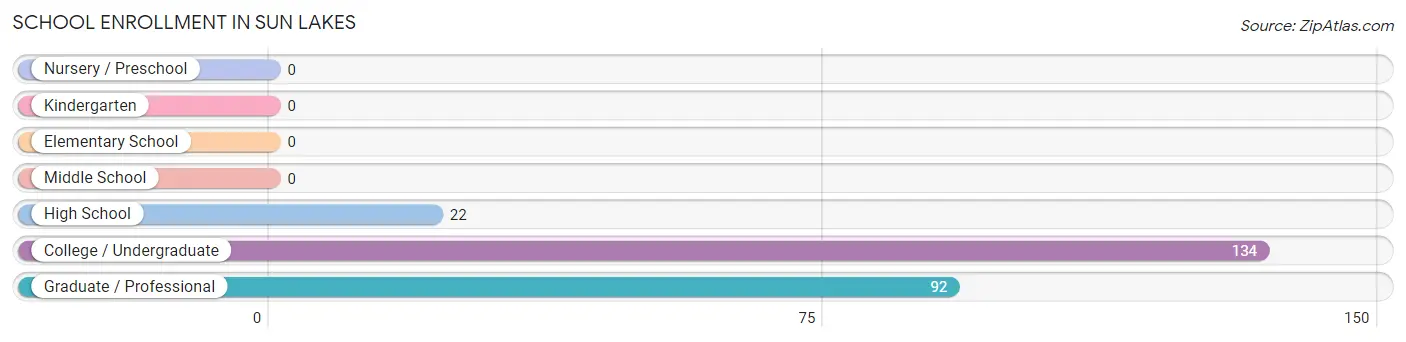
| School Level | # Students | % Students |
| Nursery / Preschool | 0 | 0.0% |
| Kindergarten | 0 | 0.0% |
| Elementary School | 0 | 0.0% |
| Middle School | 0 | 0.0% |
| High School | 22 | 8.9% |
| College / Undergraduate | 134 | 54.0% |
| Graduate / Professional | 92 | 37.1% |
| Total | 248 | 100.0% |
School Enrollment by Age by Funding Source in Sun Lakes
Out of a total of 248 students who are enrolled in schools in Sun Lakes, 63 (25.4%) attend a private institution, while the remaining 185 (74.6%) are enrolled in public schools. The age group of 35 years and over has the highest likelihood of being enrolled in private schools, with 63 (29.3% in the age bracket) enrolled. Conversely, the age group of 18 to 19 year olds has the lowest likelihood of being enrolled in a private school, with 17 (100.0% in the age bracket) attending a public institution.
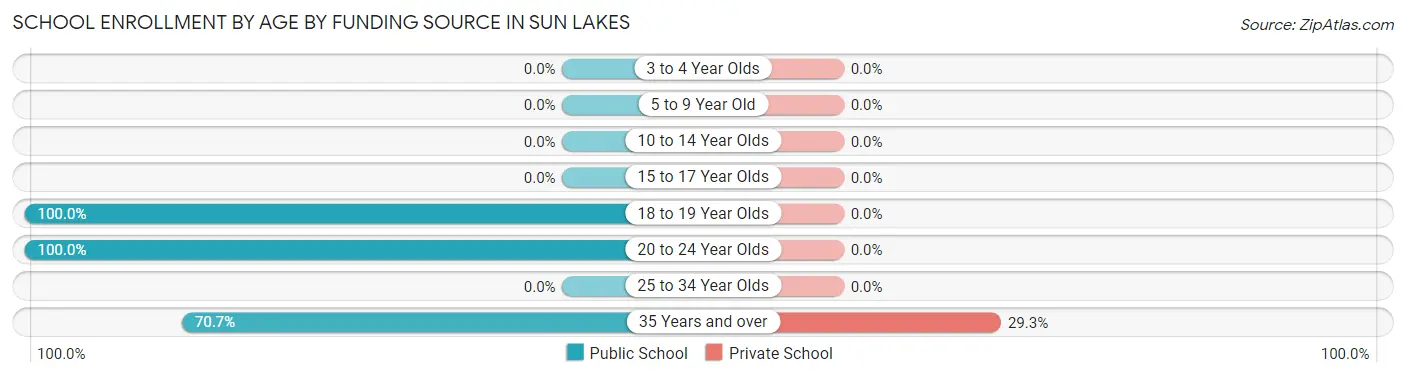
| Age Bracket | Public School | Private School |
| 3 to 4 Year Olds | 0 (0.0%) | 0 (0.0%) |
| 5 to 9 Year Old | 0 (0.0%) | 0 (0.0%) |
| 10 to 14 Year Olds | 0 (0.0%) | 0 (0.0%) |
| 15 to 17 Year Olds | 0 (0.0%) | 0 (0.0%) |
| 18 to 19 Year Olds | 17 (100.0%) | 0 (0.0%) |
| 20 to 24 Year Olds | 16 (100.0%) | 0 (0.0%) |
| 25 to 34 Year Olds | 0 (0.0%) | 0 (0.0%) |
| 35 Years and over | 152 (70.7%) | 63 (29.3%) |
| Total | 185 (74.6%) | 63 (25.4%) |
Educational Attainment by Field of Study in Sun Lakes
Business (1,535 | 24.0%), education (1,385 | 21.7%), science & technology (542 | 8.5%), engineering (524 | 8.2%), and psychology (402 | 6.3%) are the most common fields of study among 6,395 individuals in Sun Lakes who have obtained a bachelor's degree or higher.
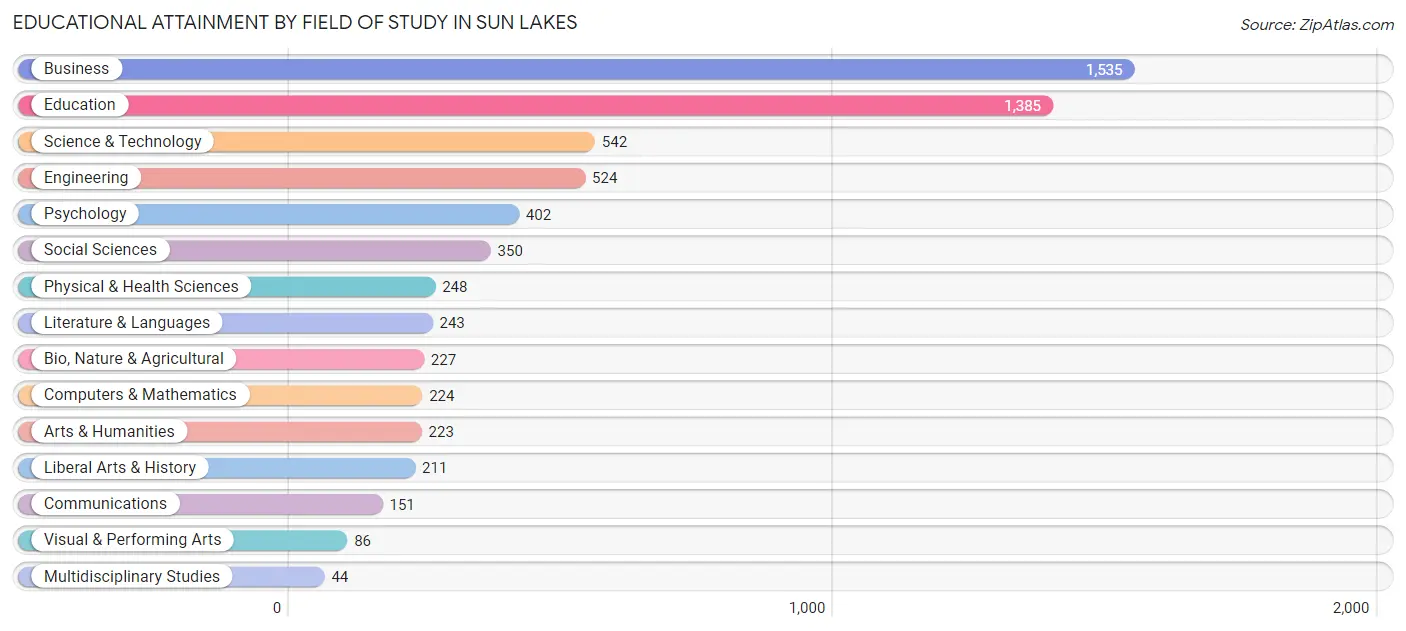
| Field of Study | # Graduates | % Graduates |
| Computers & Mathematics | 224 | 3.5% |
| Bio, Nature & Agricultural | 227 | 3.5% |
| Physical & Health Sciences | 248 | 3.9% |
| Psychology | 402 | 6.3% |
| Social Sciences | 350 | 5.5% |
| Engineering | 524 | 8.2% |
| Multidisciplinary Studies | 44 | 0.7% |
| Science & Technology | 542 | 8.5% |
| Business | 1,535 | 24.0% |
| Education | 1,385 | 21.7% |
| Literature & Languages | 243 | 3.8% |
| Liberal Arts & History | 211 | 3.3% |
| Visual & Performing Arts | 86 | 1.3% |
| Communications | 151 | 2.4% |
| Arts & Humanities | 223 | 3.5% |
| Total | 6,395 | 100.0% |
Transportation & Commute in Sun Lakes
Vehicle Availability by Sex in Sun Lakes
The most prevalent vehicle ownership categories in Sun Lakes are males with 2 vehicles (676, accounting for 56.8%) and females with 2 vehicles (612, making up 46.1%).
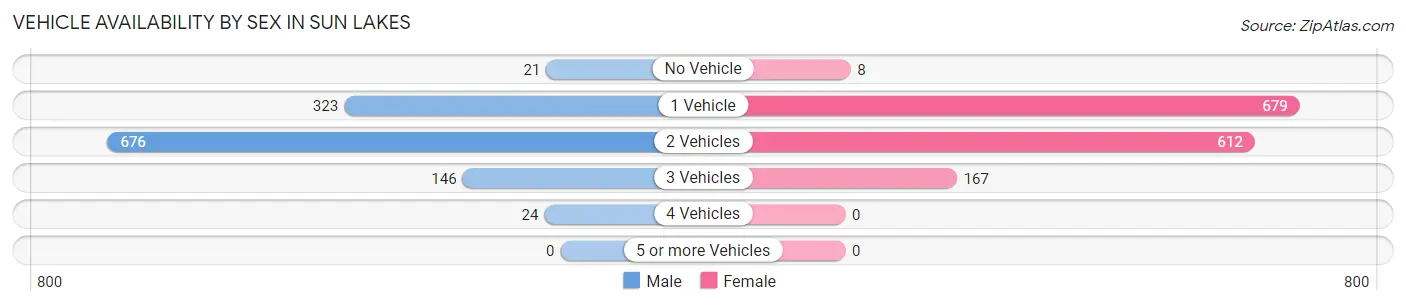
| Vehicles Available | Male | Female |
| No Vehicle | 21 (1.8%) | 8 (0.5%) |
| 1 Vehicle | 323 (27.1%) | 679 (46.3%) |
| 2 Vehicles | 676 (56.8%) | 612 (41.7%) |
| 3 Vehicles | 146 (12.3%) | 167 (11.4%) |
| 4 Vehicles | 24 (2.0%) | 0 (0.0%) |
| 5 or more Vehicles | 0 (0.0%) | 0 (0.0%) |
| Total | 1,190 (100.0%) | 1,466 (100.0%) |
Commute Time in Sun Lakes
The most frequently occuring commute durations in Sun Lakes are 5 to 9 minutes (515 commuters, 24.1%), 30 to 34 minutes (335 commuters, 15.7%), and 20 to 24 minutes (258 commuters, 12.1%).
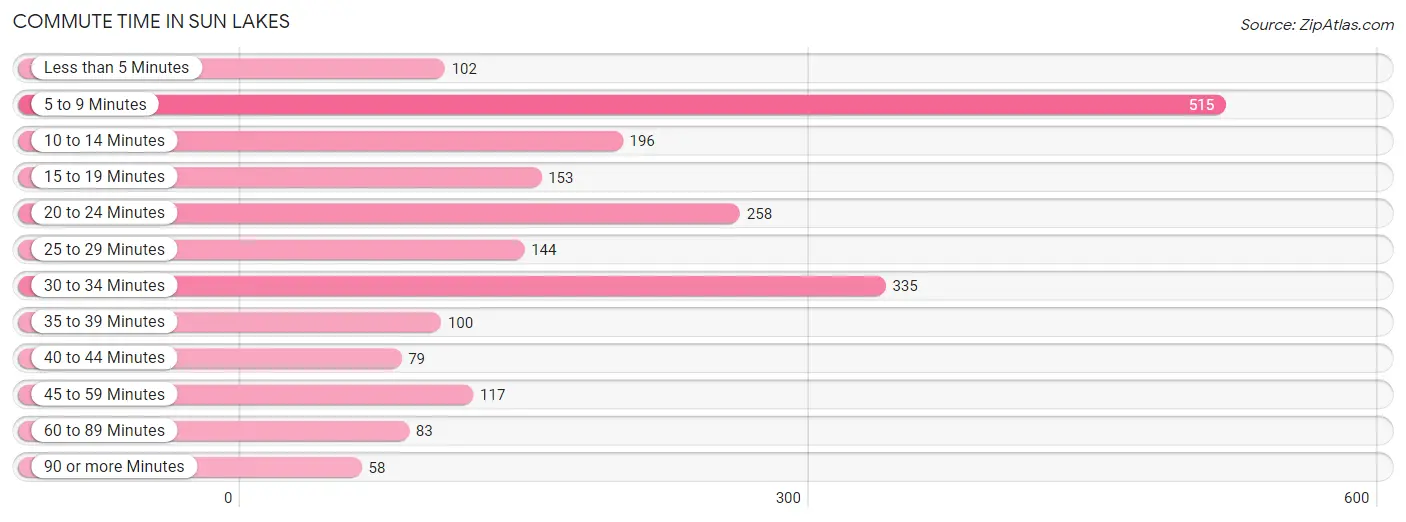
| Commute Time | # Commuters | % Commuters |
| Less than 5 Minutes | 102 | 4.8% |
| 5 to 9 Minutes | 515 | 24.1% |
| 10 to 14 Minutes | 196 | 9.2% |
| 15 to 19 Minutes | 153 | 7.1% |
| 20 to 24 Minutes | 258 | 12.1% |
| 25 to 29 Minutes | 144 | 6.7% |
| 30 to 34 Minutes | 335 | 15.7% |
| 35 to 39 Minutes | 100 | 4.7% |
| 40 to 44 Minutes | 79 | 3.7% |
| 45 to 59 Minutes | 117 | 5.5% |
| 60 to 89 Minutes | 83 | 3.9% |
| 90 or more Minutes | 58 | 2.7% |
Commute Time by Sex in Sun Lakes
The most common commute times in Sun Lakes are 30 to 34 minutes (242 commuters, 23.7%) for males and 5 to 9 minutes (359 commuters, 32.1%) for females.
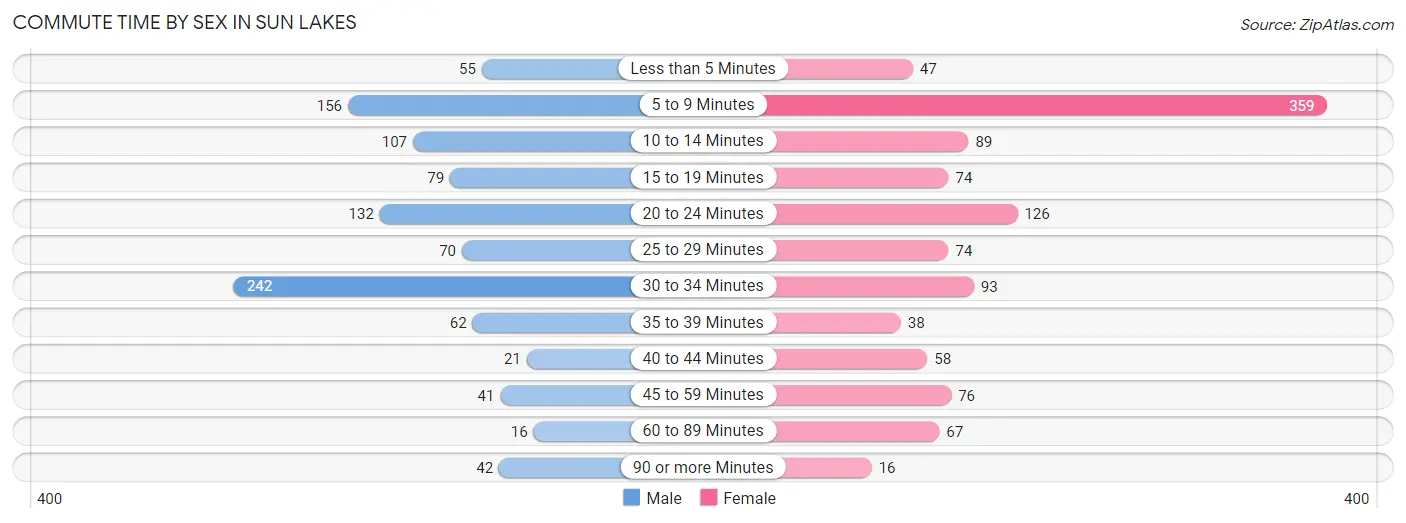
| Commute Time | Male | Female |
| Less than 5 Minutes | 55 (5.4%) | 47 (4.2%) |
| 5 to 9 Minutes | 156 (15.2%) | 359 (32.1%) |
| 10 to 14 Minutes | 107 (10.5%) | 89 (8.0%) |
| 15 to 19 Minutes | 79 (7.7%) | 74 (6.6%) |
| 20 to 24 Minutes | 132 (12.9%) | 126 (11.3%) |
| 25 to 29 Minutes | 70 (6.8%) | 74 (6.6%) |
| 30 to 34 Minutes | 242 (23.7%) | 93 (8.3%) |
| 35 to 39 Minutes | 62 (6.1%) | 38 (3.4%) |
| 40 to 44 Minutes | 21 (2.1%) | 58 (5.2%) |
| 45 to 59 Minutes | 41 (4.0%) | 76 (6.8%) |
| 60 to 89 Minutes | 16 (1.6%) | 67 (6.0%) |
| 90 or more Minutes | 42 (4.1%) | 16 (1.4%) |
Time of Departure to Work by Sex in Sun Lakes
The most frequent times of departure to work in Sun Lakes are 12:00 PM to 3:59 PM (166, 16.2%) for males and 6:30 AM to 6:59 AM (310, 27.8%) for females.
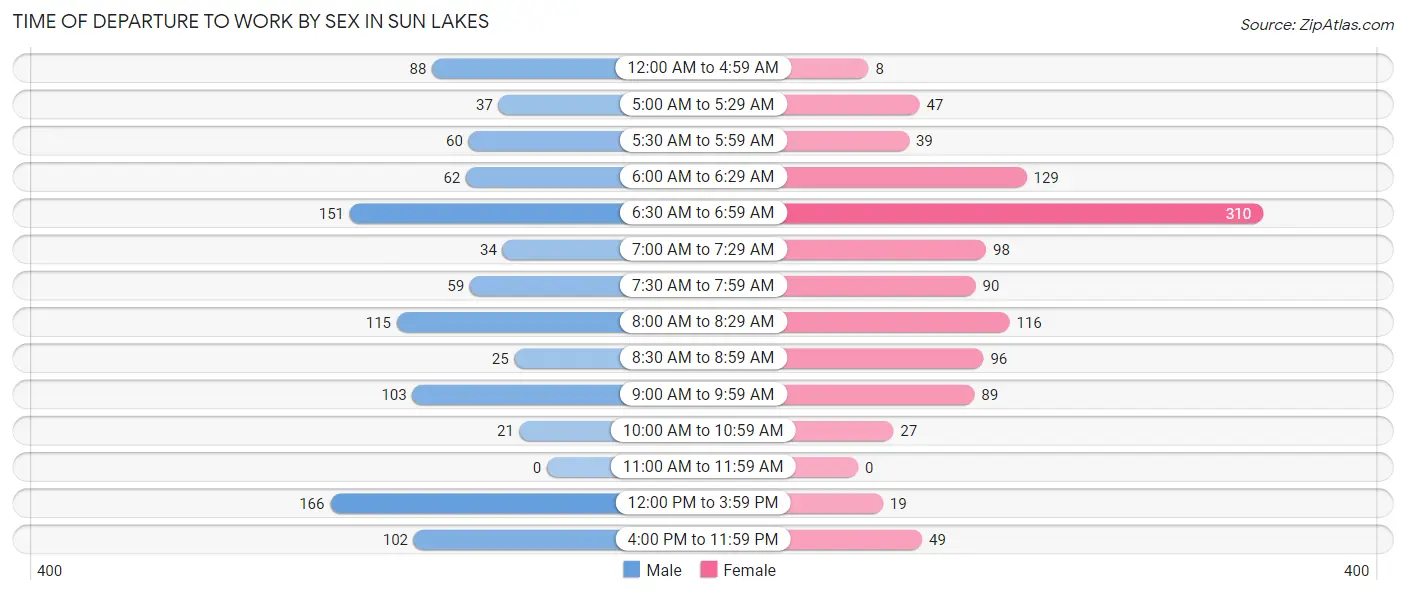
| Time of Departure | Male | Female |
| 12:00 AM to 4:59 AM | 88 (8.6%) | 8 (0.7%) |
| 5:00 AM to 5:29 AM | 37 (3.6%) | 47 (4.2%) |
| 5:30 AM to 5:59 AM | 60 (5.9%) | 39 (3.5%) |
| 6:00 AM to 6:29 AM | 62 (6.1%) | 129 (11.6%) |
| 6:30 AM to 6:59 AM | 151 (14.8%) | 310 (27.8%) |
| 7:00 AM to 7:29 AM | 34 (3.3%) | 98 (8.8%) |
| 7:30 AM to 7:59 AM | 59 (5.8%) | 90 (8.1%) |
| 8:00 AM to 8:29 AM | 115 (11.2%) | 116 (10.4%) |
| 8:30 AM to 8:59 AM | 25 (2.4%) | 96 (8.6%) |
| 9:00 AM to 9:59 AM | 103 (10.1%) | 89 (8.0%) |
| 10:00 AM to 10:59 AM | 21 (2.1%) | 27 (2.4%) |
| 11:00 AM to 11:59 AM | 0 (0.0%) | 0 (0.0%) |
| 12:00 PM to 3:59 PM | 166 (16.2%) | 19 (1.7%) |
| 4:00 PM to 11:59 PM | 102 (10.0%) | 49 (4.4%) |
| Total | 1,023 (100.0%) | 1,117 (100.0%) |
Housing Occupancy in Sun Lakes
Occupancy by Ownership in Sun Lakes
Of the total 8,677 dwellings in Sun Lakes, owner-occupied units account for 7,641 (88.1%), while renter-occupied units make up 1,036 (11.9%).
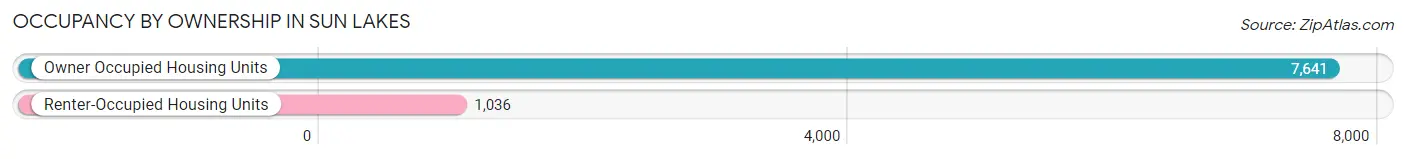
| Occupancy | # Housing Units | % Housing Units |
| Owner Occupied Housing Units | 7,641 | 88.1% |
| Renter-Occupied Housing Units | 1,036 | 11.9% |
| Total Occupied Housing Units | 8,677 | 100.0% |
Occupancy by Household Size in Sun Lakes
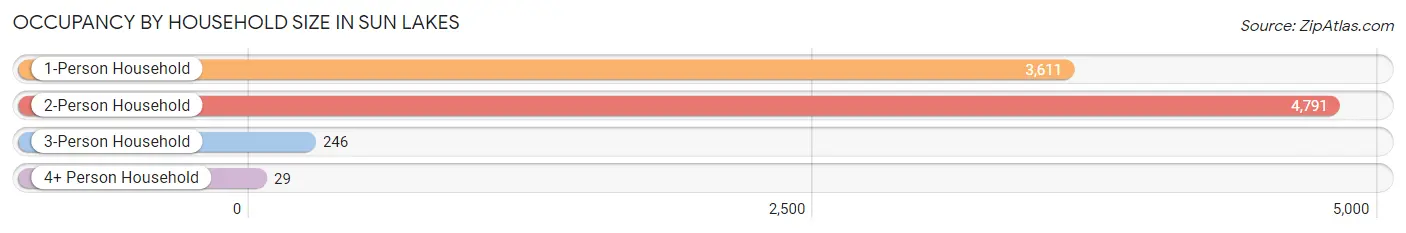
| Household Size | # Housing Units | % Housing Units |
| 1-Person Household | 3,611 | 41.6% |
| 2-Person Household | 4,791 | 55.2% |
| 3-Person Household | 246 | 2.8% |
| 4+ Person Household | 29 | 0.3% |
| Total Housing Units | 8,677 | 100.0% |
Occupancy by Ownership by Household Size in Sun Lakes
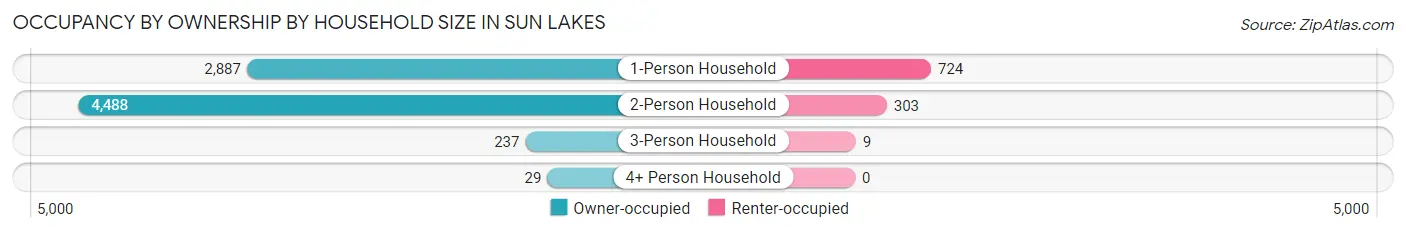
| Household Size | Owner-occupied | Renter-occupied |
| 1-Person Household | 2,887 (79.9%) | 724 (20.1%) |
| 2-Person Household | 4,488 (93.7%) | 303 (6.3%) |
| 3-Person Household | 237 (96.3%) | 9 (3.7%) |
| 4+ Person Household | 29 (100.0%) | 0 (0.0%) |
| Total Housing Units | 7,641 (88.1%) | 1,036 (11.9%) |
Occupancy by Educational Attainment in Sun Lakes
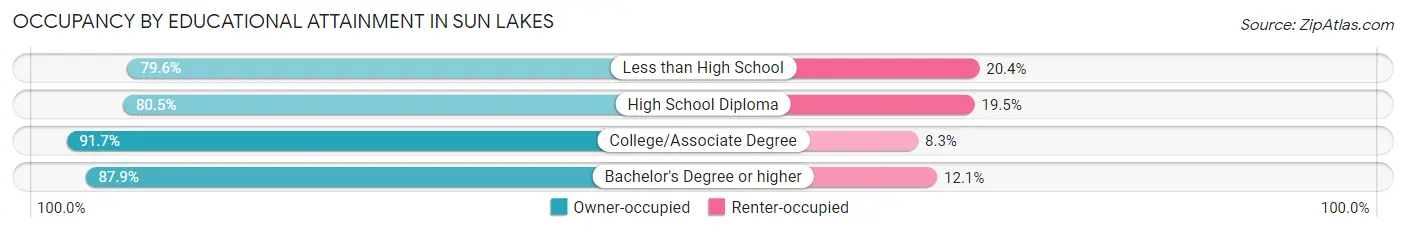
| Household Size | Owner-occupied | Renter-occupied |
| Less than High School | 144 (79.6%) | 37 (20.4%) |
| High School Diploma | 1,077 (80.5%) | 261 (19.5%) |
| College/Associate Degree | 3,078 (91.7%) | 279 (8.3%) |
| Bachelor's Degree or higher | 3,342 (87.9%) | 459 (12.1%) |
Occupancy by Age of Householder in Sun Lakes
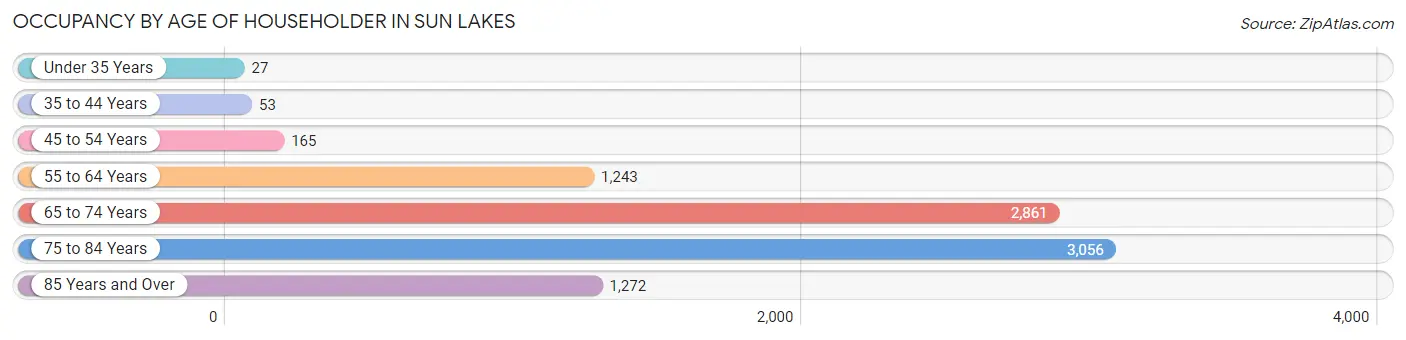
| Age Bracket | # Households | % Households |
| Under 35 Years | 27 | 0.3% |
| 35 to 44 Years | 53 | 0.6% |
| 45 to 54 Years | 165 | 1.9% |
| 55 to 64 Years | 1,243 | 14.3% |
| 65 to 74 Years | 2,861 | 33.0% |
| 75 to 84 Years | 3,056 | 35.2% |
| 85 Years and Over | 1,272 | 14.7% |
| Total | 8,677 | 100.0% |
Housing Finances in Sun Lakes
Median Income by Occupancy in Sun Lakes
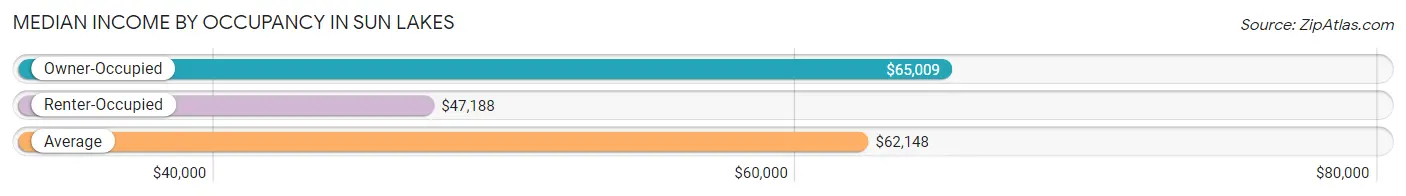
| Occupancy Type | # Households | Median Income |
| Owner-Occupied | 7,641 (88.1%) | $65,009 |
| Renter-Occupied | 1,036 (11.9%) | $47,188 |
| Average | 8,677 (100.0%) | $62,148 |
Occupancy by Householder Income Bracket in Sun Lakes
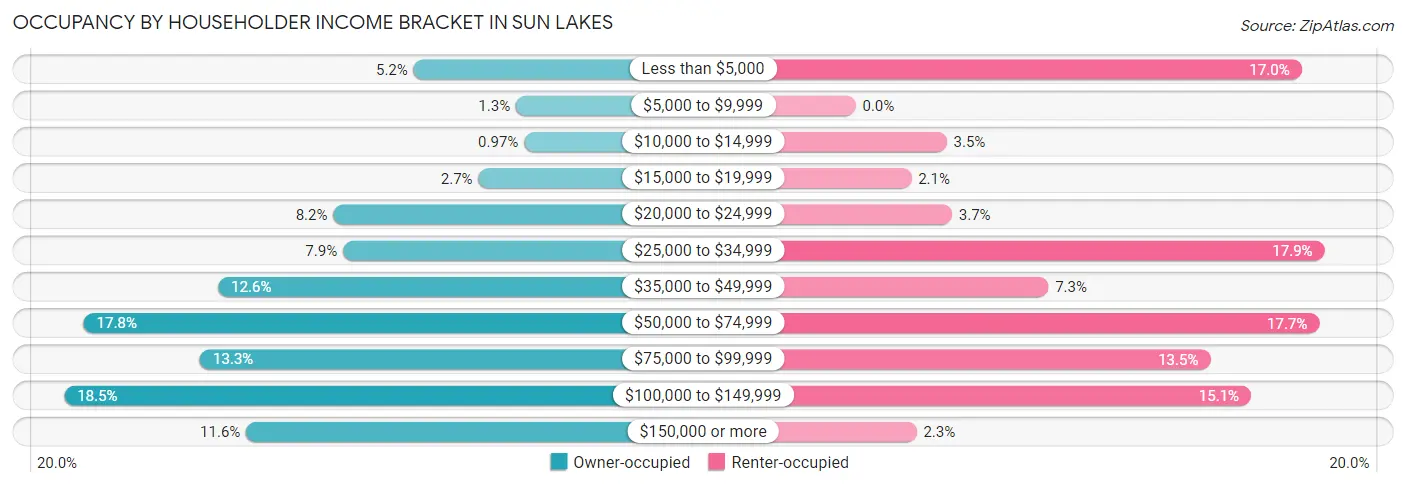
| Income Bracket | Owner-occupied | Renter-occupied |
| Less than $5,000 | 396 (5.2%) | 176 (17.0%) |
| $5,000 to $9,999 | 98 (1.3%) | 0 (0.0%) |
| $10,000 to $14,999 | 74 (1.0%) | 36 (3.5%) |
| $15,000 to $19,999 | 207 (2.7%) | 22 (2.1%) |
| $20,000 to $24,999 | 630 (8.2%) | 38 (3.7%) |
| $25,000 to $34,999 | 601 (7.9%) | 185 (17.9%) |
| $35,000 to $49,999 | 965 (12.6%) | 76 (7.3%) |
| $50,000 to $74,999 | 1,356 (17.7%) | 183 (17.7%) |
| $75,000 to $99,999 | 1,018 (13.3%) | 140 (13.5%) |
| $100,000 to $149,999 | 1,413 (18.5%) | 156 (15.1%) |
| $150,000 or more | 883 (11.6%) | 24 (2.3%) |
| Total | 7,641 (100.0%) | 1,036 (100.0%) |
Monthly Housing Cost Tiers in Sun Lakes
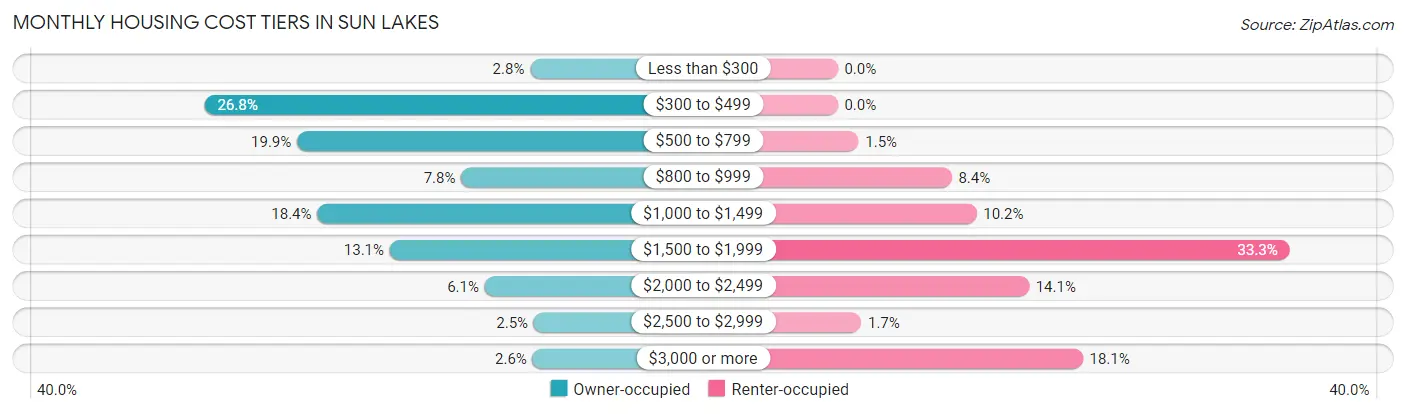
| Monthly Cost | Owner-occupied | Renter-occupied |
| Less than $300 | 211 (2.8%) | 0 (0.0%) |
| $300 to $499 | 2,044 (26.8%) | 0 (0.0%) |
| $500 to $799 | 1,523 (19.9%) | 16 (1.5%) |
| $800 to $999 | 599 (7.8%) | 87 (8.4%) |
| $1,000 to $1,499 | 1,409 (18.4%) | 106 (10.2%) |
| $1,500 to $1,999 | 1,001 (13.1%) | 345 (33.3%) |
| $2,000 to $2,499 | 467 (6.1%) | 146 (14.1%) |
| $2,500 to $2,999 | 190 (2.5%) | 18 (1.7%) |
| $3,000 or more | 197 (2.6%) | 187 (18.0%) |
| Total | 7,641 (100.0%) | 1,036 (100.0%) |
Physical Housing Characteristics in Sun Lakes
Housing Structures in Sun Lakes
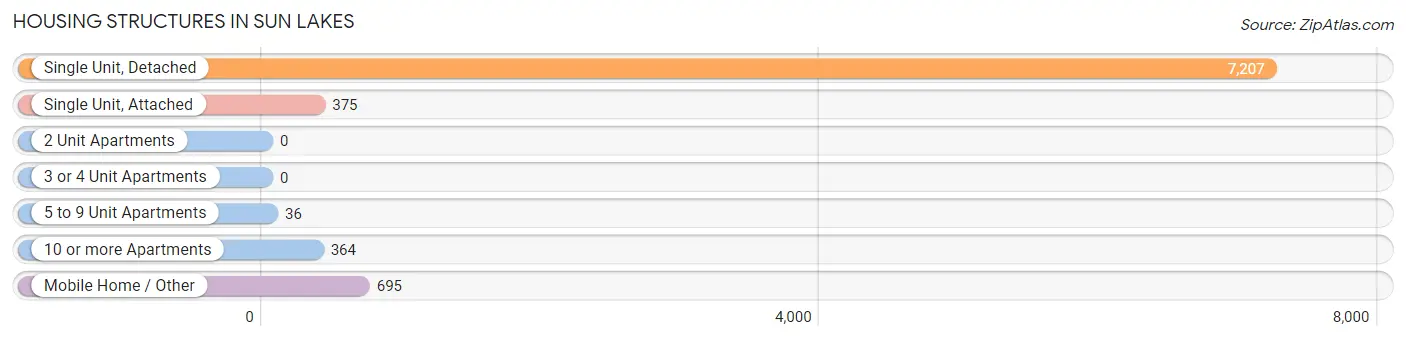
| Structure Type | # Housing Units | % Housing Units |
| Single Unit, Detached | 7,207 | 83.1% |
| Single Unit, Attached | 375 | 4.3% |
| 2 Unit Apartments | 0 | 0.0% |
| 3 or 4 Unit Apartments | 0 | 0.0% |
| 5 to 9 Unit Apartments | 36 | 0.4% |
| 10 or more Apartments | 364 | 4.2% |
| Mobile Home / Other | 695 | 8.0% |
| Total | 8,677 | 100.0% |
Housing Structures by Occupancy in Sun Lakes
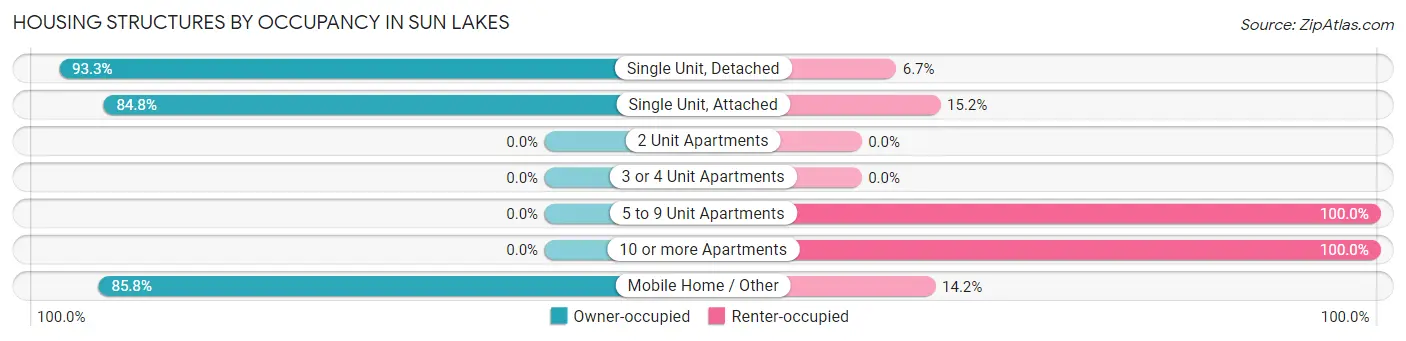
| Structure Type | Owner-occupied | Renter-occupied |
| Single Unit, Detached | 6,727 (93.3%) | 480 (6.7%) |
| Single Unit, Attached | 318 (84.8%) | 57 (15.2%) |
| 2 Unit Apartments | 0 (0.0%) | 0 (0.0%) |
| 3 or 4 Unit Apartments | 0 (0.0%) | 0 (0.0%) |
| 5 to 9 Unit Apartments | 0 (0.0%) | 36 (100.0%) |
| 10 or more Apartments | 0 (0.0%) | 364 (100.0%) |
| Mobile Home / Other | 596 (85.8%) | 99 (14.2%) |
| Total | 7,641 (88.1%) | 1,036 (11.9%) |
Housing Structures by Number of Rooms in Sun Lakes
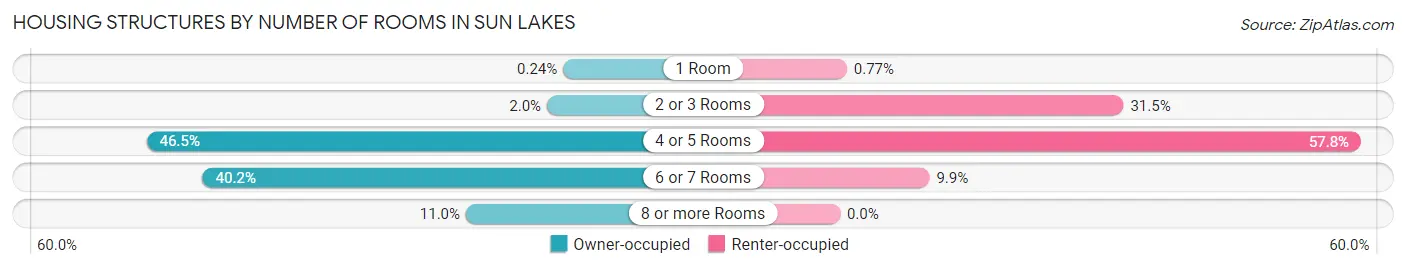
| Number of Rooms | Owner-occupied | Renter-occupied |
| 1 Room | 18 (0.2%) | 8 (0.8%) |
| 2 or 3 Rooms | 155 (2.0%) | 326 (31.5%) |
| 4 or 5 Rooms | 3,550 (46.5%) | 599 (57.8%) |
| 6 or 7 Rooms | 3,075 (40.2%) | 103 (9.9%) |
| 8 or more Rooms | 843 (11.0%) | 0 (0.0%) |
| Total | 7,641 (100.0%) | 1,036 (100.0%) |
Housing Structure by Heating Type in Sun Lakes
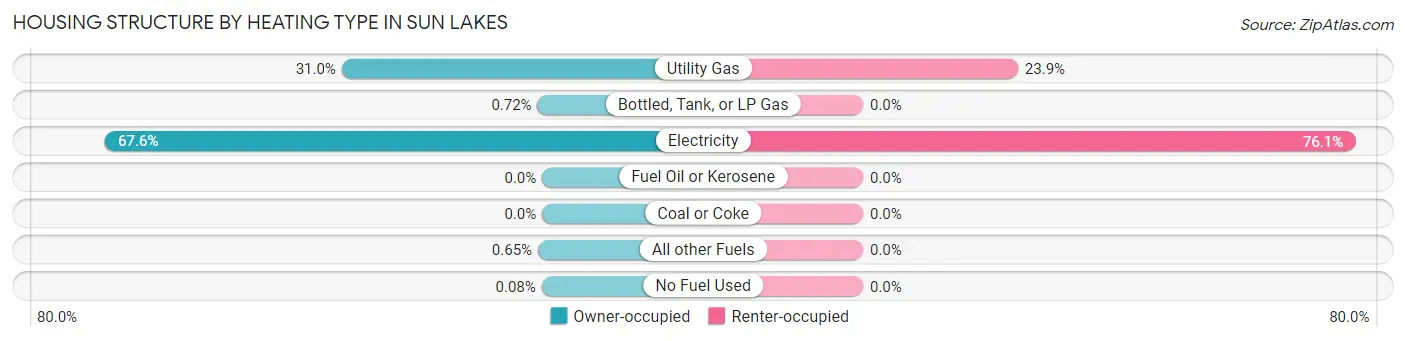
| Heating Type | Owner-occupied | Renter-occupied |
| Utility Gas | 2,367 (31.0%) | 248 (23.9%) |
| Bottled, Tank, or LP Gas | 55 (0.7%) | 0 (0.0%) |
| Electricity | 5,163 (67.6%) | 788 (76.1%) |
| Fuel Oil or Kerosene | 0 (0.0%) | 0 (0.0%) |
| Coal or Coke | 0 (0.0%) | 0 (0.0%) |
| All other Fuels | 50 (0.6%) | 0 (0.0%) |
| No Fuel Used | 6 (0.1%) | 0 (0.0%) |
| Total | 7,641 (100.0%) | 1,036 (100.0%) |
Household Vehicle Usage in Sun Lakes
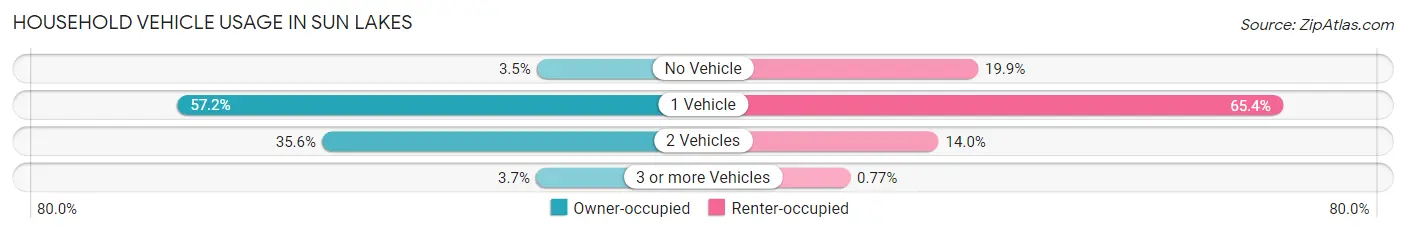
| Vehicles per Household | Owner-occupied | Renter-occupied |
| No Vehicle | 270 (3.5%) | 206 (19.9%) |
| 1 Vehicle | 4,370 (57.2%) | 677 (65.3%) |
| 2 Vehicles | 2,721 (35.6%) | 145 (14.0%) |
| 3 or more Vehicles | 280 (3.7%) | 8 (0.8%) |
| Total | 7,641 (100.0%) | 1,036 (100.0%) |
Real Estate & Mortgages in Sun Lakes
Real Estate and Mortgage Overview in Sun Lakes
| Characteristic | Without Mortgage | With Mortgage |
| Housing Units | 3,974 | 3,667 |
| Median Property Value | $376,100 | $384,100 |
| Median Household Income | $56,453 | $400 |
| Monthly Housing Costs | $480 | $188 |
| Real Estate Taxes | $2,439 | $34 |
Property Value by Mortgage Status in Sun Lakes
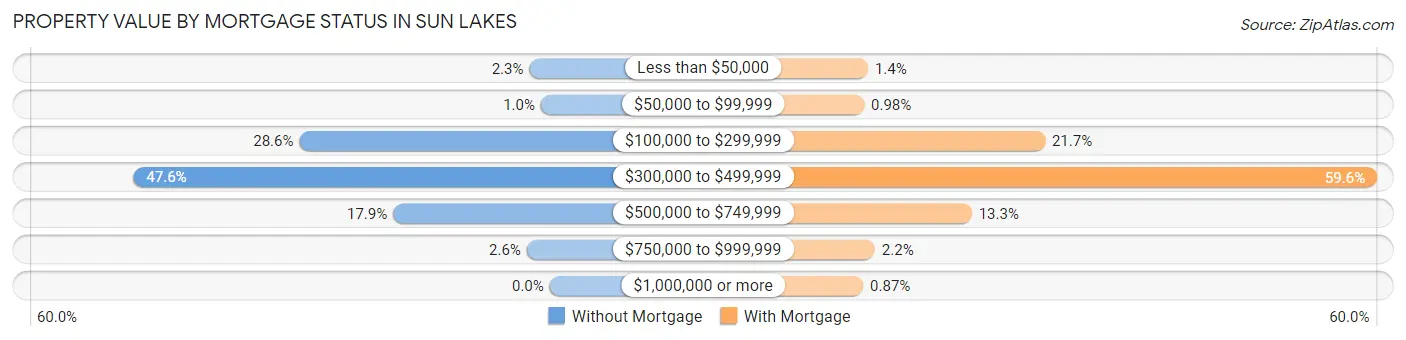
| Property Value | Without Mortgage | With Mortgage |
| Less than $50,000 | 92 (2.3%) | 52 (1.4%) |
| $50,000 to $99,999 | 40 (1.0%) | 36 (1.0%) |
| $100,000 to $299,999 | 1,137 (28.6%) | 794 (21.6%) |
| $300,000 to $499,999 | 1,890 (47.6%) | 2,185 (59.6%) |
| $500,000 to $749,999 | 711 (17.9%) | 487 (13.3%) |
| $750,000 to $999,999 | 104 (2.6%) | 81 (2.2%) |
| $1,000,000 or more | 0 (0.0%) | 32 (0.9%) |
| Total | 3,974 (100.0%) | 3,667 (100.0%) |
Household Income by Mortgage Status in Sun Lakes
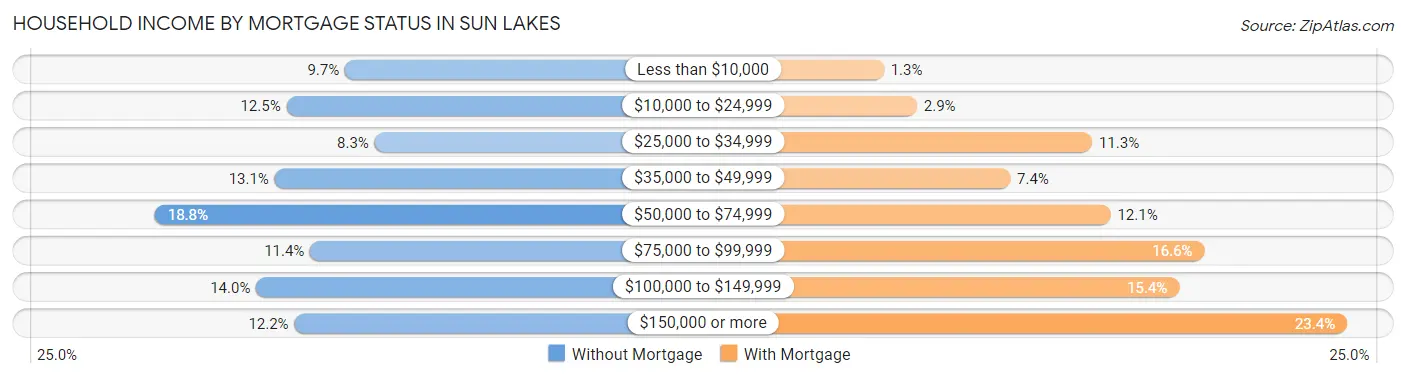
| Household Income | Without Mortgage | With Mortgage |
| Less than $10,000 | 387 (9.7%) | 49 (1.3%) |
| $10,000 to $24,999 | 498 (12.5%) | 107 (2.9%) |
| $25,000 to $34,999 | 331 (8.3%) | 413 (11.3%) |
| $35,000 to $49,999 | 520 (13.1%) | 270 (7.4%) |
| $50,000 to $74,999 | 747 (18.8%) | 445 (12.1%) |
| $75,000 to $99,999 | 453 (11.4%) | 609 (16.6%) |
| $100,000 to $149,999 | 555 (14.0%) | 565 (15.4%) |
| $150,000 or more | 483 (12.1%) | 858 (23.4%) |
| Total | 3,974 (100.0%) | 3,667 (100.0%) |
Property Value to Household Income Ratio in Sun Lakes
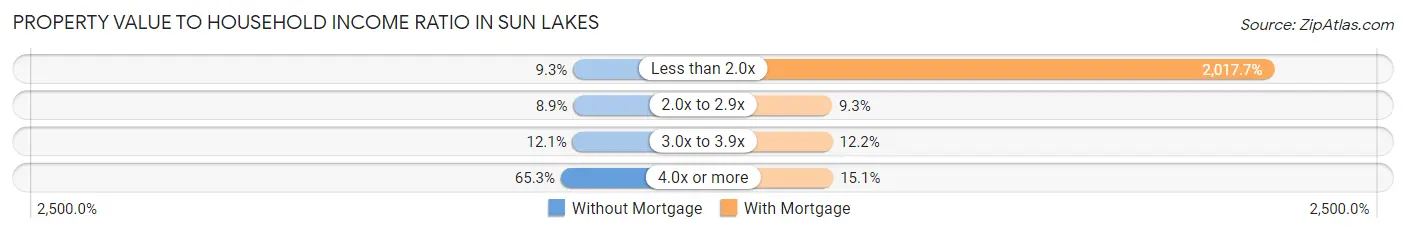
| Value-to-Income Ratio | Without Mortgage | With Mortgage |
| Less than 2.0x | 369 (9.3%) | 73,990 (2,017.7%) |
| 2.0x to 2.9x | 354 (8.9%) | 341 (9.3%) |
| 3.0x to 3.9x | 479 (12.0%) | 449 (12.2%) |
| 4.0x or more | 2,596 (65.3%) | 555 (15.1%) |
| Total | 3,974 (100.0%) | 3,667 (100.0%) |
Real Estate Taxes by Mortgage Status in Sun Lakes
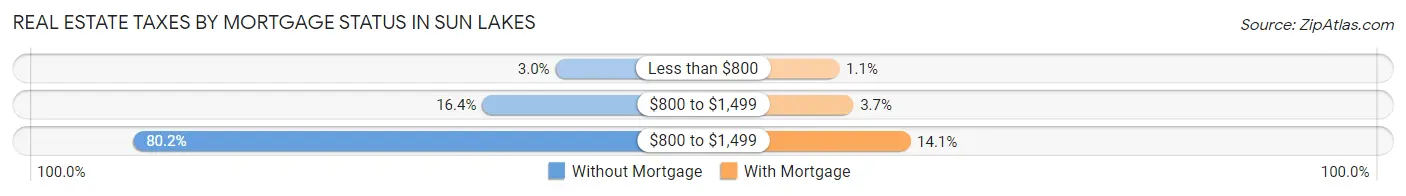
| Property Taxes | Without Mortgage | With Mortgage |
| Less than $800 | 121 (3.0%) | 41 (1.1%) |
| $800 to $1,499 | 652 (16.4%) | 135 (3.7%) |
| $800 to $1,499 | 3,185 (80.1%) | 516 (14.1%) |
| Total | 3,974 (100.0%) | 3,667 (100.0%) |
Health & Disability in Sun Lakes
Health Insurance Coverage by Age in Sun Lakes
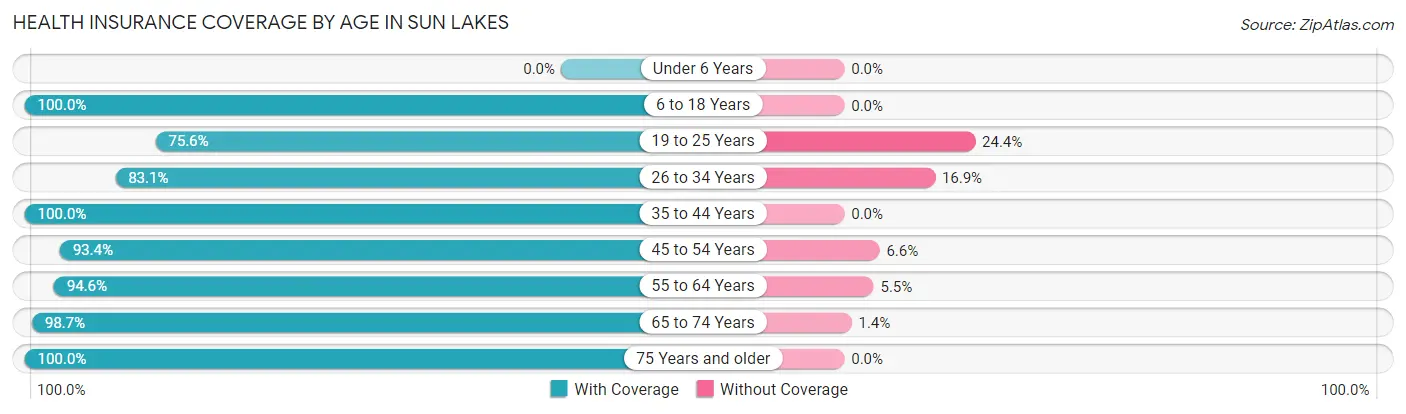
| Age Bracket | With Coverage | Without Coverage |
| Under 6 Years | 0 (0.0%) | 0 (0.0%) |
| 6 to 18 Years | 38 (100.0%) | 0 (0.0%) |
| 19 to 25 Years | 31 (75.6%) | 10 (24.4%) |
| 26 to 34 Years | 118 (83.1%) | 24 (16.9%) |
| 35 to 44 Years | 168 (100.0%) | 0 (0.0%) |
| 45 to 54 Years | 342 (93.4%) | 24 (6.6%) |
| 55 to 64 Years | 2,152 (94.6%) | 124 (5.4%) |
| 65 to 74 Years | 4,751 (98.7%) | 65 (1.3%) |
| 75 Years and older | 6,290 (100.0%) | 0 (0.0%) |
| Total | 13,890 (98.3%) | 247 (1.8%) |
Health Insurance Coverage by Citizenship Status in Sun Lakes
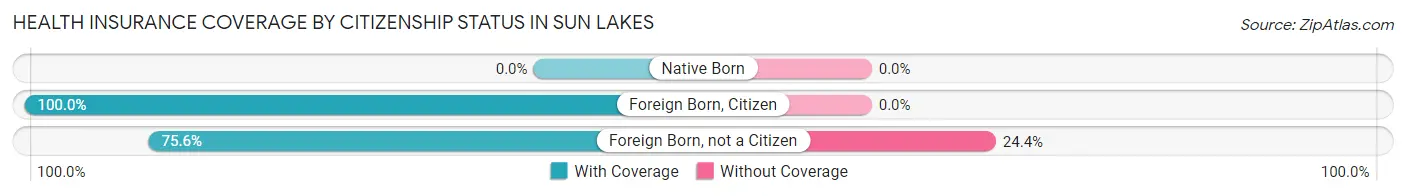
| Citizenship Status | With Coverage | Without Coverage |
| Native Born | 0 (0.0%) | 0 (0.0%) |
| Foreign Born, Citizen | 38 (100.0%) | 0 (0.0%) |
| Foreign Born, not a Citizen | 31 (75.6%) | 10 (24.4%) |
Health Insurance Coverage by Household Income in Sun Lakes
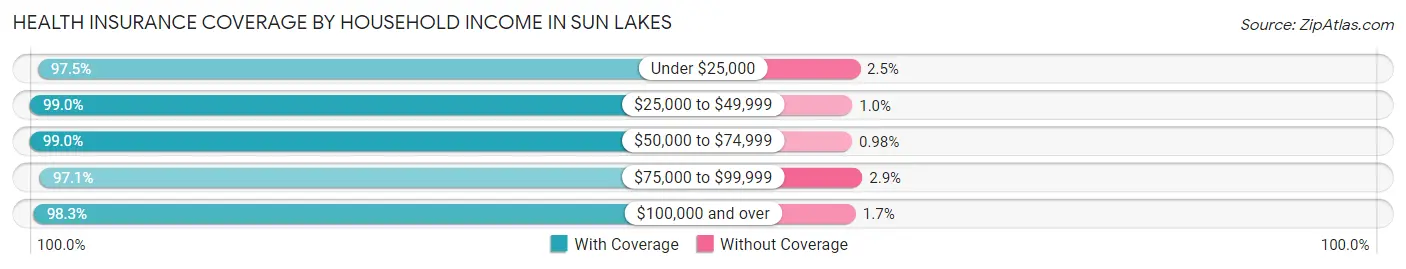
| Household Income | With Coverage | Without Coverage |
| Under $25,000 | 2,075 (97.5%) | 53 (2.5%) |
| $25,000 to $49,999 | 2,582 (99.0%) | 27 (1.0%) |
| $50,000 to $74,999 | 2,525 (99.0%) | 25 (1.0%) |
| $75,000 to $99,999 | 2,033 (97.1%) | 61 (2.9%) |
| $100,000 and over | 4,658 (98.3%) | 81 (1.7%) |
Public vs Private Health Insurance Coverage by Age in Sun Lakes
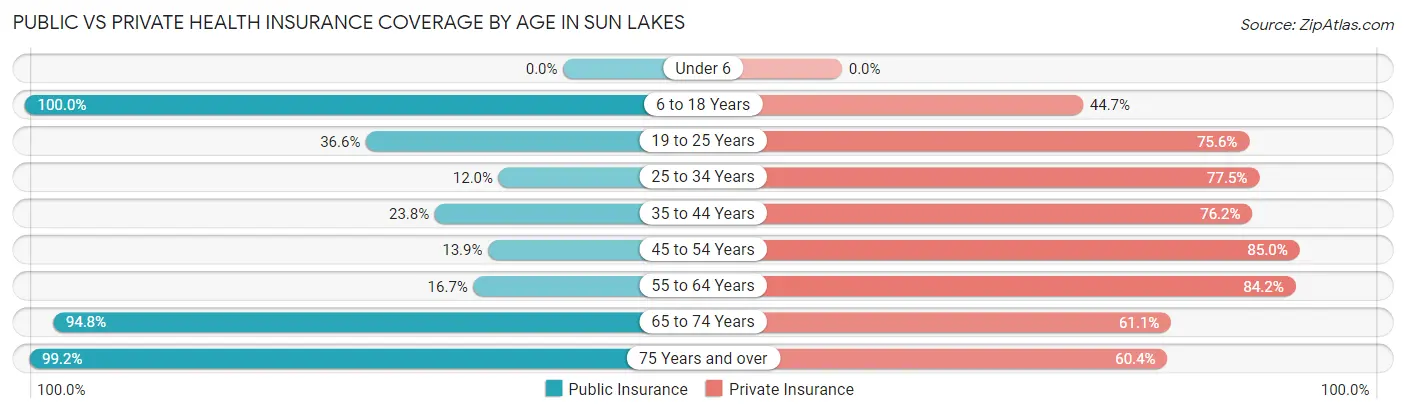
| Age Bracket | Public Insurance | Private Insurance |
| Under 6 | 0 (0.0%) | 0 (0.0%) |
| 6 to 18 Years | 38 (100.0%) | 17 (44.7%) |
| 19 to 25 Years | 15 (36.6%) | 31 (75.6%) |
| 25 to 34 Years | 17 (12.0%) | 110 (77.5%) |
| 35 to 44 Years | 40 (23.8%) | 128 (76.2%) |
| 45 to 54 Years | 51 (13.9%) | 311 (85.0%) |
| 55 to 64 Years | 379 (16.7%) | 1,917 (84.2%) |
| 65 to 74 Years | 4,563 (94.8%) | 2,944 (61.1%) |
| 75 Years and over | 6,238 (99.2%) | 3,801 (60.4%) |
| Total | 11,341 (80.2%) | 9,259 (65.5%) |
Disability Status by Sex by Age in Sun Lakes
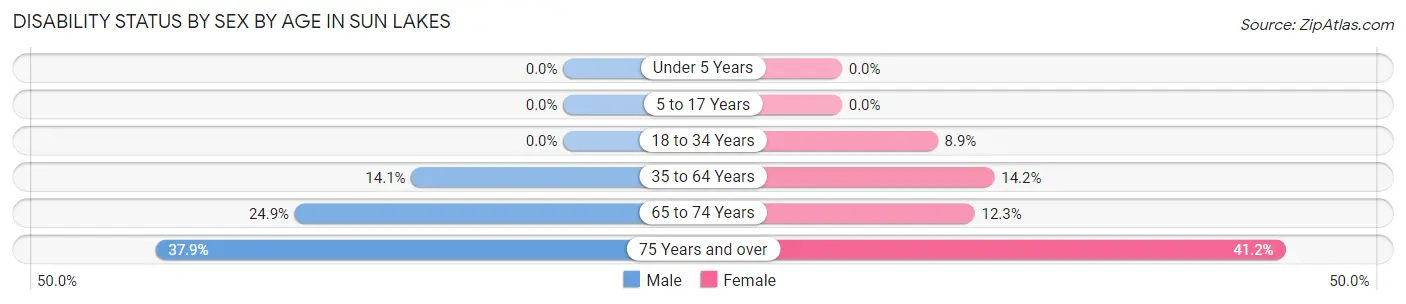
| Age Bracket | Male | Female |
| Under 5 Years | 0 (0.0%) | 0 (0.0%) |
| 5 to 17 Years | 0 (0.0%) | 0 (0.0%) |
| 18 to 34 Years | 0 (0.0%) | 8 (8.9%) |
| 35 to 64 Years | 163 (14.1%) | 234 (14.1%) |
| 65 to 74 Years | 484 (24.9%) | 354 (12.3%) |
| 75 Years and over | 1,112 (37.9%) | 1,381 (41.2%) |
Disability Class by Sex by Age in Sun Lakes
Disability Class: Hearing Difficulty
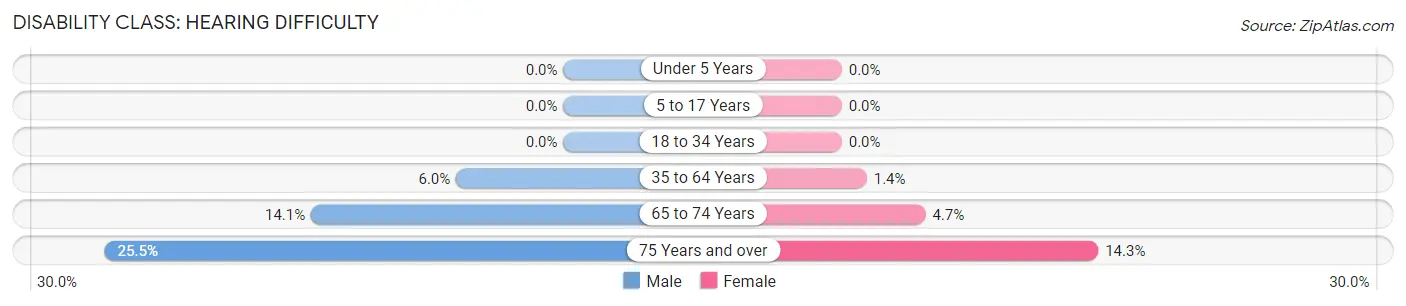
| Age Bracket | Male | Female |
| Under 5 Years | 0 (0.0%) | 0 (0.0%) |
| 5 to 17 Years | 0 (0.0%) | 0 (0.0%) |
| 18 to 34 Years | 0 (0.0%) | 0 (0.0%) |
| 35 to 64 Years | 69 (6.0%) | 23 (1.4%) |
| 65 to 74 Years | 273 (14.1%) | 134 (4.7%) |
| 75 Years and over | 750 (25.5%) | 479 (14.3%) |
Disability Class: Vision Difficulty
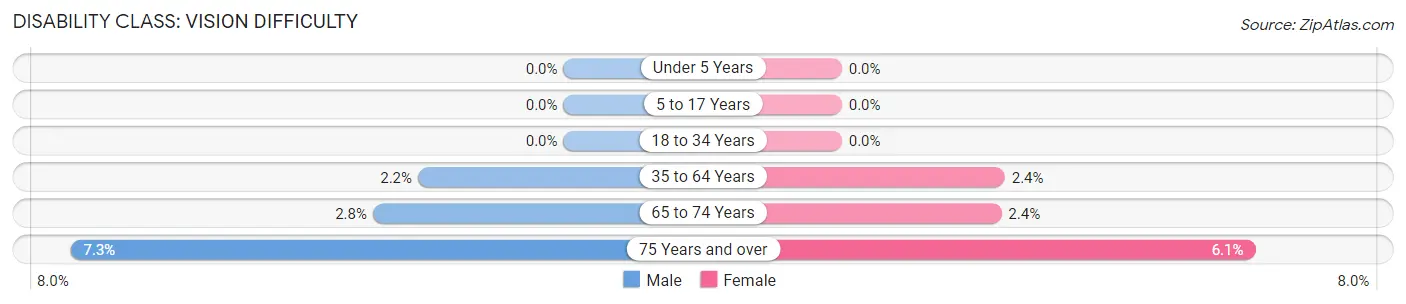
| Age Bracket | Male | Female |
| Under 5 Years | 0 (0.0%) | 0 (0.0%) |
| 5 to 17 Years | 0 (0.0%) | 0 (0.0%) |
| 18 to 34 Years | 0 (0.0%) | 0 (0.0%) |
| 35 to 64 Years | 25 (2.2%) | 40 (2.4%) |
| 65 to 74 Years | 55 (2.8%) | 68 (2.4%) |
| 75 Years and over | 215 (7.3%) | 206 (6.1%) |
Disability Class: Cognitive Difficulty
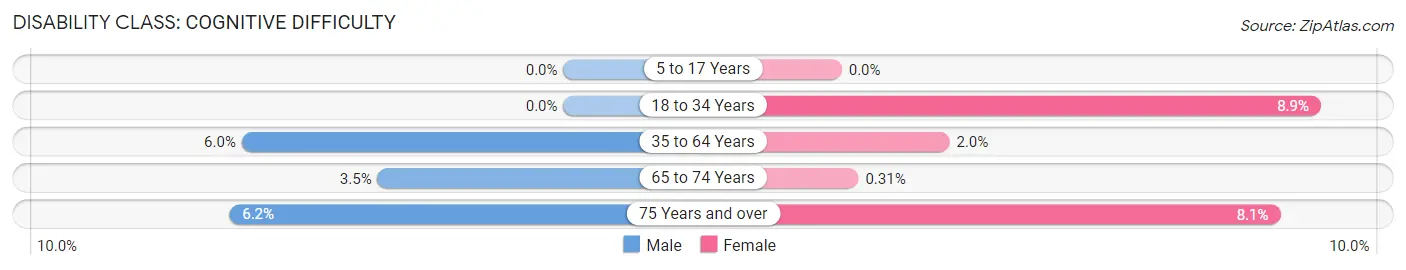
| Age Bracket | Male | Female |
| 5 to 17 Years | 0 (0.0%) | 0 (0.0%) |
| 18 to 34 Years | 0 (0.0%) | 8 (8.9%) |
| 35 to 64 Years | 69 (6.0%) | 33 (2.0%) |
| 65 to 74 Years | 67 (3.5%) | 9 (0.3%) |
| 75 Years and over | 182 (6.2%) | 273 (8.1%) |
Disability Class: Ambulatory Difficulty
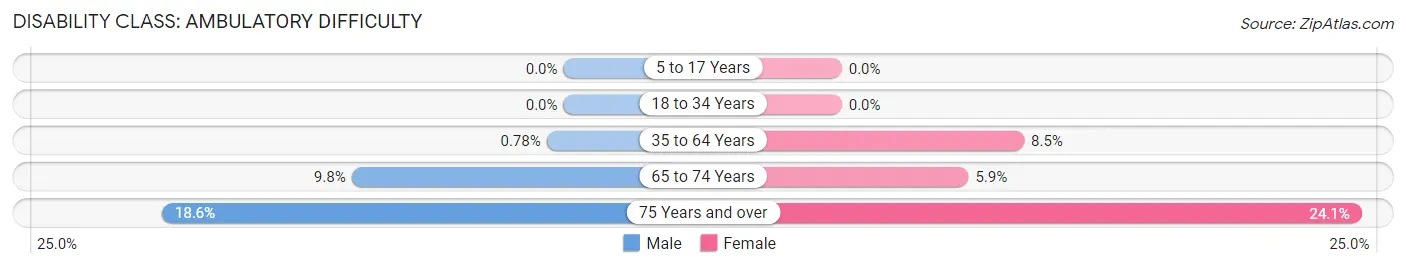
| Age Bracket | Male | Female |
| 5 to 17 Years | 0 (0.0%) | 0 (0.0%) |
| 18 to 34 Years | 0 (0.0%) | 0 (0.0%) |
| 35 to 64 Years | 9 (0.8%) | 140 (8.5%) |
| 65 to 74 Years | 191 (9.8%) | 169 (5.9%) |
| 75 Years and over | 547 (18.6%) | 809 (24.1%) |
Disability Class: Self-Care Difficulty
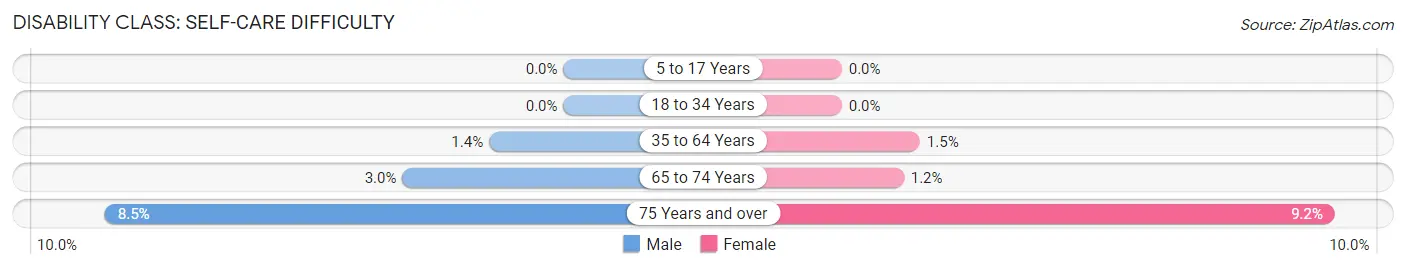
| Age Bracket | Male | Female |
| 5 to 17 Years | 0 (0.0%) | 0 (0.0%) |
| 18 to 34 Years | 0 (0.0%) | 0 (0.0%) |
| 35 to 64 Years | 16 (1.4%) | 24 (1.5%) |
| 65 to 74 Years | 58 (3.0%) | 33 (1.1%) |
| 75 Years and over | 250 (8.5%) | 307 (9.1%) |
Technology Access in Sun Lakes
Computing Device Access in Sun Lakes
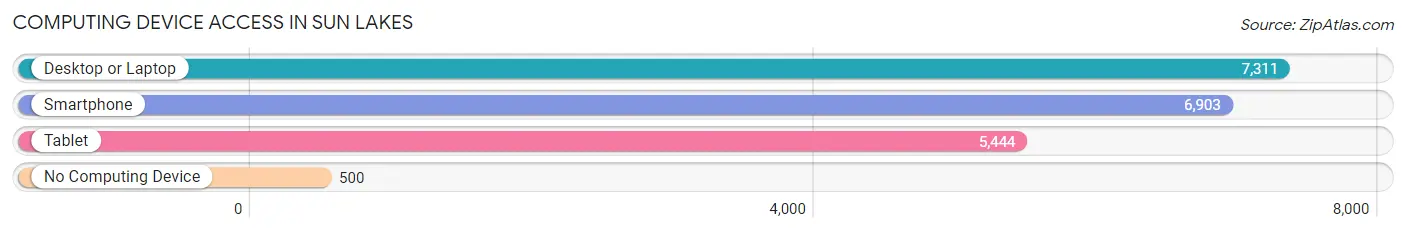
| Device Type | # Households | % Households |
| Desktop or Laptop | 7,311 | 84.3% |
| Smartphone | 6,903 | 79.6% |
| Tablet | 5,444 | 62.7% |
| No Computing Device | 500 | 5.8% |
| Total | 8,677 | 100.0% |
Internet Access in Sun Lakes
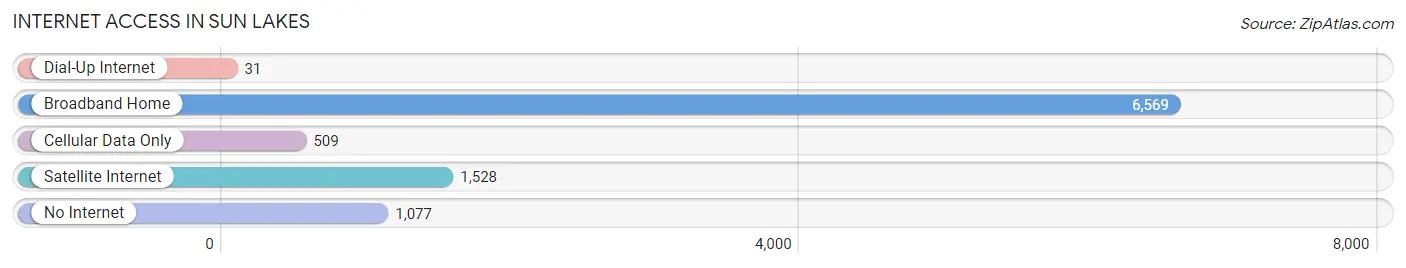
| Internet Type | # Households | % Households |
| Dial-Up Internet | 31 | 0.4% |
| Broadband Home | 6,569 | 75.7% |
| Cellular Data Only | 509 | 5.9% |
| Satellite Internet | 1,528 | 17.6% |
| No Internet | 1,077 | 12.4% |
| Total | 8,677 | 100.0% |
Sun Lakes Summary
History
Sun Lakes is a census-designated place (CDP) located in Maricopa County, Arizona. It is a retirement community located in the southeastern part of the Phoenix metropolitan area. The community was established in 1972 and has grown to become one of the most popular retirement communities in the state.
Sun Lakes was originally developed by Del Webb Corporation, a real estate development company that specializes in retirement communities. The community was designed to provide a safe and secure environment for retirees. The community was designed with a variety of amenities, including golf courses, swimming pools, tennis courts, and other recreational activities.
The community has grown steadily since its inception and now has a population of over 10,000 people. The majority of the population is over the age of 65, making it one of the oldest communities in the state.
Geography
Sun Lakes is located in Maricopa County, Arizona. It is situated in the southeastern part of the Phoenix metropolitan area. The community is bordered by the cities of Chandler, Gilbert, and Mesa.
The community is located in the Sonoran Desert, which is characterized by hot, dry summers and mild winters. The area receives an average of 8.5 inches of rain per year.
The community is located at an elevation of 1,200 feet above sea level. The area is surrounded by mountains, including the Superstition Mountains to the east and the White Tank Mountains to the west.
Economy
Sun Lakes is primarily a retirement community, and the majority of the population is over the age of 65. As such, the economy of the community is largely based on the services and amenities that cater to the needs of the elderly population.
The community is home to several golf courses, which provide employment opportunities for golf professionals and other staff. The community also has several restaurants, retail stores, and other businesses that cater to the needs of the elderly population.
The community is also home to several medical facilities, including a hospital, a nursing home, and several medical clinics. These facilities provide employment opportunities for medical professionals and other staff.
Demographics
As of the 2010 census, the population of Sun Lakes was 10,817. The population is predominantly white (93.3%), with a small percentage of African Americans (2.2%), Asians (1.7%), and other races (2.8%).
The median age of the population is 72.7 years, with the majority of the population being over the age of 65 (83.3%). The median household income is $50,945, and the median home value is $212,000.
Conclusion
Sun Lakes is a retirement community located in Maricopa County, Arizona. The community was established in 1972 and has grown to become one of the most popular retirement communities in the state. The community is characterized by hot, dry summers and mild winters, and is surrounded by mountains. The economy of the community is largely based on the services and amenities that cater to the needs of the elderly population. The population of Sun Lakes is predominantly white, with a median age of 72.7 years and a median household income of $50,945.
Common Questions
What is Per Capita Income in Sun Lakes?
Per Capita income in Sun Lakes is $51,559.
What is the Median Family Income in Sun Lakes?
Median Family Income in Sun Lakes is $84,182.
What is the Median Household income in Sun Lakes?
Median Household Income in Sun Lakes is $62,148.
What is Income or Wage Gap in Sun Lakes?
Income or Wage Gap in Sun Lakes is 11.8%.
Women in Sun Lakes earn 88.2 cents for every dollar earned by a man.
What is Family Income Deficit in Sun Lakes?
Family Income Deficit in Sun Lakes is $11,794.
Families that are below poverty line in Sun Lakes earn $11,794 less on average than the poverty threshold level.
What is Inequality or Gini Index in Sun Lakes?
Inequality or Gini Index in Sun Lakes is 0.47.
What is the Total Population of Sun Lakes?
Total Population of Sun Lakes is 14,147.
What is the Total Male Population of Sun Lakes?
Total Male Population of Sun Lakes is 6,166.
What is the Total Female Population of Sun Lakes?
Total Female Population of Sun Lakes is 7,981.
What is the Ratio of Males per 100 Females in Sun Lakes?
There are 77.26 Males per 100 Females in Sun Lakes.
What is the Ratio of Females per 100 Males in Sun Lakes?
There are 129.44 Females per 100 Males in Sun Lakes.
What is the Median Population Age in Sun Lakes?
Median Population Age in Sun Lakes is 73.6 Years.
What is the Average Family Size in Sun Lakes
Average Family Size in Sun Lakes is 2.1 People.
What is the Average Household Size in Sun Lakes
Average Household Size in Sun Lakes is 1.6 People.
How Large is the Labor Force in Sun Lakes?
There are 2,910 People in the Labor Forcein in Sun Lakes.
What is the Percentage of People in the Labor Force in Sun Lakes?
20.6% of People are in the Labor Force in Sun Lakes.
What is the Unemployment Rate in Sun Lakes?
Unemployment Rate in Sun Lakes is 6.1%.