Zip Codes with the Highest Percentage of Population Employed in Computer, Engineering & Science in Phoenix, AZ
RELATED REPORTS & OPTIONS
Computer, Engineering & Science
Phoenix
Compare Zip Codes
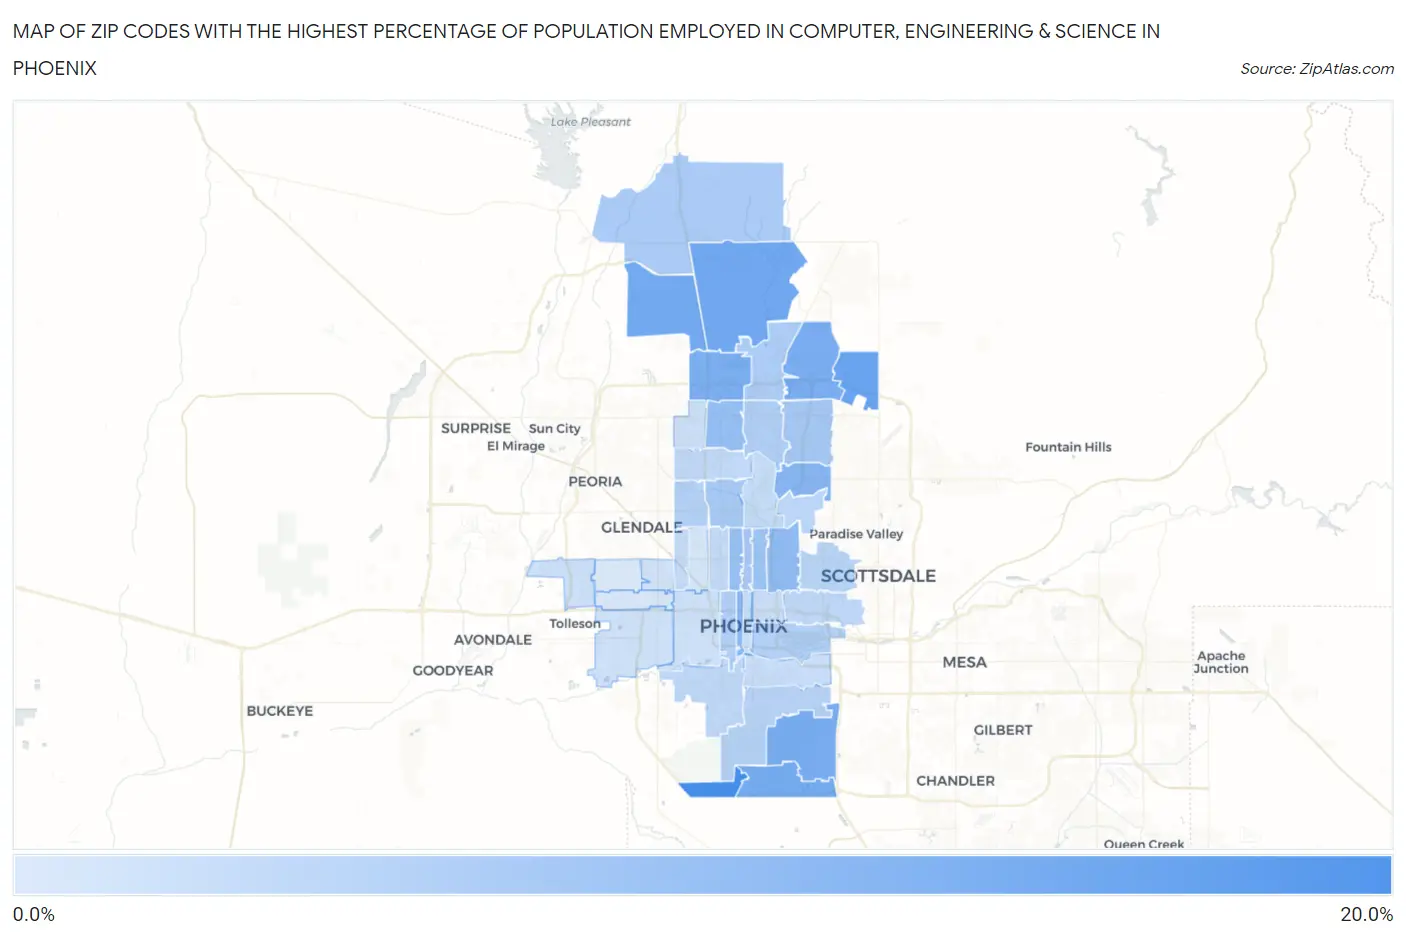
Map of Zip Codes with the Highest Percentage of Population Employed in Computer, Engineering & Science in Phoenix
2.1%
16.5%
Zip Codes with the Highest Percentage of Population Employed in Computer, Engineering & Science in Phoenix, AZ
| Zip Code | % Employed | vs State | vs National | |
| 1. | 85045 | 16.5% | 6.8%(+9.74)#7 | 6.8%(+9.76)#881 |
| 2. | 85054 | 13.1% | 6.8%(+6.32)#15 | 6.8%(+6.34)#1,606 |
| 3. | 85085 | 12.4% | 6.8%(+5.64)#21 | 6.8%(+5.66)#1,854 |
| 4. | 85083 | 12.1% | 6.8%(+5.32)#23 | 6.8%(+5.33)#1,991 |
| 5. | 85048 | 11.8% | 6.8%(+5.02)#28 | 6.8%(+5.04)#2,134 |
| 6. | 85044 | 11.4% | 6.8%(+4.67)#32 | 6.8%(+4.68)#2,326 |
| 7. | 85050 | 11.3% | 6.8%(+4.56)#33 | 6.8%(+4.58)#2,381 |
| 8. | 85027 | 11.3% | 6.8%(+4.50)#34 | 6.8%(+4.52)#2,422 |
| 9. | 85028 | 10.1% | 6.8%(+3.30)#49 | 6.8%(+3.31)#3,166 |
| 10. | 85003 | 9.6% | 6.8%(+2.87)#58 | 6.8%(+2.88)#3,486 |
| 11. | 85016 | 9.1% | 6.8%(+2.34)#64 | 6.8%(+2.36)#3,943 |
| 12. | 85023 | 8.8% | 6.8%(+2.05)#69 | 6.8%(+2.06)#4,232 |
| 13. | 85013 | 8.5% | 6.8%(+1.67)#77 | 6.8%(+1.69)#4,658 |
| 14. | 85014 | 8.0% | 6.8%(+1.17)#87 | 6.8%(+1.19)#5,334 |
| 15. | 85032 | 7.3% | 6.8%(+0.531)#97 | 6.8%(+0.548)#6,288 |
| 16. | 85012 | 7.1% | 6.8%(+0.362)#102 | 6.8%(+0.378)#6,545 |
| 17. | 85021 | 7.0% | 6.8%(+0.196)#105 | 6.8%(+0.212)#6,845 |
| 18. | 85086 | 6.7% | 6.8%(-0.062)#120 | 6.8%(-0.046)#7,313 |
| 19. | 85024 | 6.6% | 6.8%(-0.175)#124 | 6.8%(-0.159)#7,525 |
| 20. | 85007 | 6.1% | 6.8%(-0.638)#132 | 6.8%(-0.622)#8,481 |
| 21. | 85022 | 6.1% | 6.8%(-0.641)#133 | 6.8%(-0.625)#8,489 |
| 22. | 85034 | 6.0% | 6.8%(-0.801)#135 | 6.8%(-0.785)#8,883 |
| 23. | 85051 | 5.8% | 6.8%(-1.01)#139 | 6.8%(-0.995)#9,364 |
| 24. | 85042 | 5.5% | 6.8%(-1.26)#144 | 6.8%(-1.25)#10,017 |
| 25. | 85018 | 5.2% | 6.8%(-1.60)#158 | 6.8%(-1.58)#10,851 |
| 26. | 85041 | 4.8% | 6.8%(-1.94)#177 | 6.8%(-1.93)#11,845 |
| 27. | 85008 | 4.8% | 6.8%(-2.01)#181 | 6.8%(-1.99)#12,010 |
| 28. | 85029 | 4.7% | 6.8%(-2.09)#182 | 6.8%(-2.07)#12,219 |
| 29. | 85019 | 4.5% | 6.8%(-2.30)#192 | 6.8%(-2.28)#12,871 |
| 30. | 85015 | 4.4% | 6.8%(-2.42)#196 | 6.8%(-2.41)#13,302 |
| 31. | 85020 | 4.2% | 6.8%(-2.54)#203 | 6.8%(-2.53)#13,713 |
| 32. | 85004 | 4.2% | 6.8%(-2.60)#206 | 6.8%(-2.58)#13,908 |
| 33. | 85040 | 3.9% | 6.8%(-2.85)#218 | 6.8%(-2.83)#14,705 |
| 34. | 85006 | 3.8% | 6.8%(-2.94)#223 | 6.8%(-2.93)#15,026 |
| 35. | 85037 | 3.5% | 6.8%(-3.24)#233 | 6.8%(-3.23)#16,115 |
| 36. | 85053 | 3.5% | 6.8%(-3.29)#235 | 6.8%(-3.27)#16,294 |
| 37. | 85009 | 3.3% | 6.8%(-3.44)#242 | 6.8%(-3.43)#16,854 |
| 38. | 85043 | 3.3% | 6.8%(-3.48)#245 | 6.8%(-3.46)#16,998 |
| 39. | 85031 | 3.2% | 6.8%(-3.59)#247 | 6.8%(-3.57)#17,405 |
| 40. | 85017 | 2.8% | 6.8%(-4.01)#262 | 6.8%(-3.99)#18,960 |
| 41. | 85035 | 2.4% | 6.8%(-4.37)#275 | 6.8%(-4.35)#20,349 |
| 42. | 85033 | 2.1% | 6.8%(-4.68)#285 | 6.8%(-4.67)#21,488 |
1
Common Questions
What are the Top 10 Zip Codes with the Highest Percentage of Population Employed in Computer, Engineering & Science in Phoenix, AZ?
Top 10 Zip Codes with the Highest Percentage of Population Employed in Computer, Engineering & Science in Phoenix, AZ are:
What zip code has the Highest Percentage of Population Employed in Computer, Engineering & Science in Phoenix, AZ?
85045 has the Highest Percentage of Population Employed in Computer, Engineering & Science in Phoenix, AZ with 16.5%.
What is the Percentage of Population Employed in Computer, Engineering & Science in Phoenix, AZ?
Percentage of Population Employed in Computer, Engineering & Science in Phoenix is 6.5%.
What is the Percentage of Population Employed in Computer, Engineering & Science in Arizona?
Percentage of Population Employed in Computer, Engineering & Science in Arizona is 6.8%.
What is the Percentage of Population Employed in Computer, Engineering & Science in the United States?
Percentage of Population Employed in Computer, Engineering & Science in the United States is 6.8%.