Ash Fork, AZ Map & Demographics
Ash Fork Map
Ash Fork Overview
$26,200
PER CAPITA INCOME
$83,400
AVG FAMILY INCOME
$79,861
AVG HOUSEHOLD INCOME
0.31
INEQUALITY / GINI INDEX
466
TOTAL POPULATION
249
MALE POPULATION
217
FEMALE POPULATION
114.75
MALES / 100 FEMALES
87.15
FEMALES / 100 MALES
38.6
MEDIAN AGE
2.8
AVG FAMILY SIZE
2.7
AVG HOUSEHOLD SIZE
136
LABOR FORCE [ PEOPLE ]
40.2%
PERCENT IN LABOR FORCE
26.5%
UNEMPLOYMENT RATE
Ash Fork Zip Codes
Ash Fork Area Codes
Income in Ash Fork
Income Overview in Ash Fork
Per Capita Income in Ash Fork is $26,200, while median incomes of families and households are $83,400 and $79,861 respectively.
| Characteristic | Number | Measure |
| Per Capita Income | 466 | $26,200 |
| Median Family Income | 124 | $83,400 |
| Mean Family Income | 124 | $83,144 |
| Median Household Income | 171 | $79,861 |
| Mean Household Income | 171 | $73,102 |
| Income Deficit | 124 | $0 |
| Wage / Income Gap (%) | 466 | 0.00% |
| Wage / Income Gap ($) | 466 | 100.00¢ per $1 |
| Gini / Inequality Index | 466 | 0.31 |
Earnings by Sex in Ash Fork
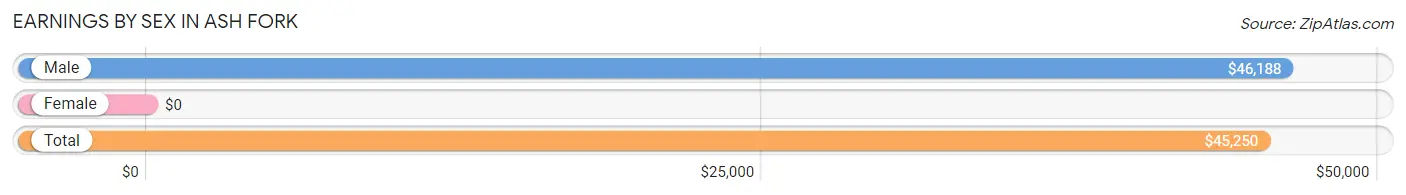
| Sex | Number | Average Earnings |
| Male | 99 (72.8%) | $46,188 |
| Female | 37 (27.2%) | $0 |
| Total | 136 (100.0%) | $45,250 |
Earnings by Sex by Income Bracket in Ash Fork
The most common earnings brackets in Ash Fork are $45,000 to $49,999 for men (20 | 20.2%) and $15,000 to $17,499 for women (14 | 37.8%).
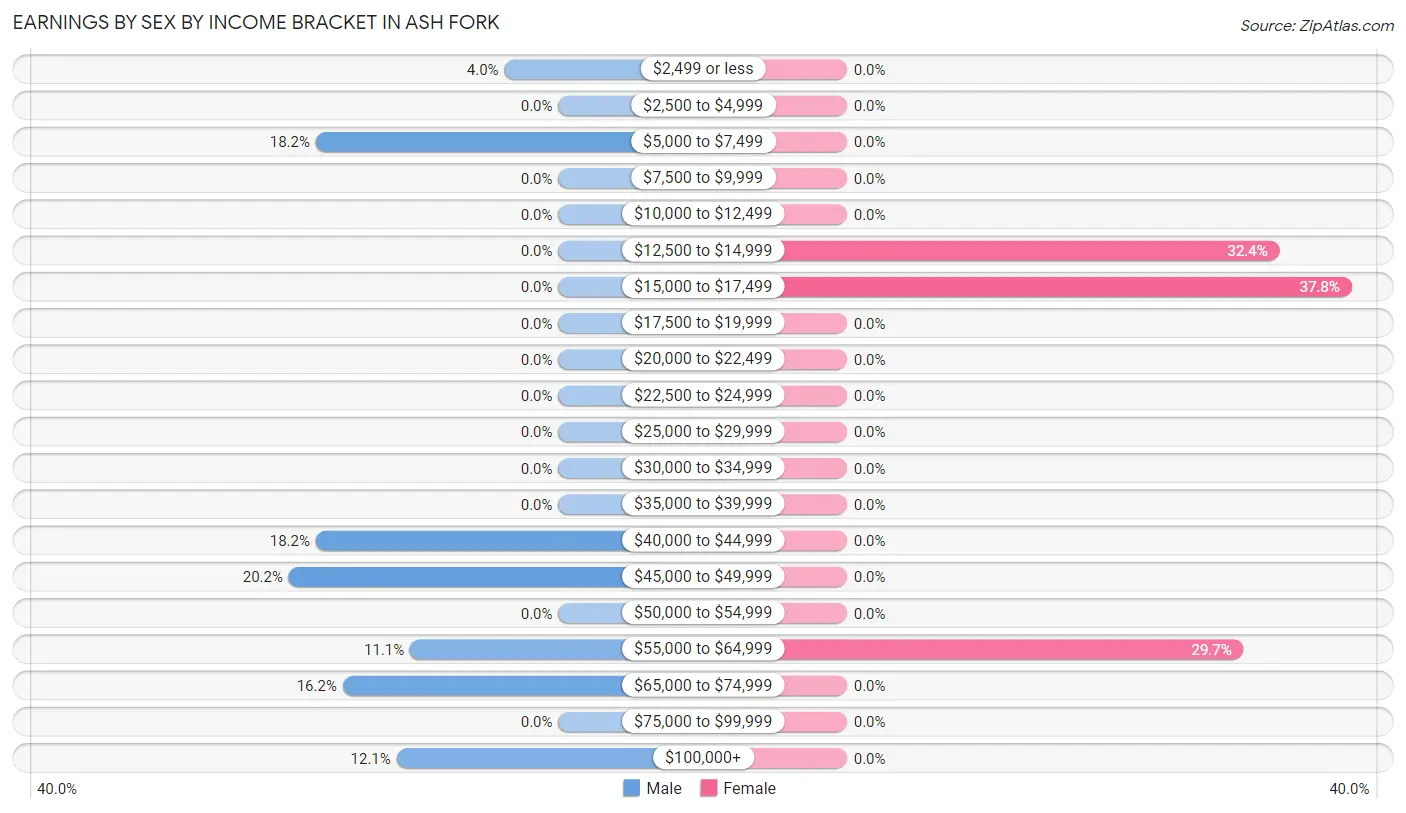
| Income | Male | Female |
| $2,499 or less | 4 (4.0%) | 0 (0.0%) |
| $2,500 to $4,999 | 0 (0.0%) | 0 (0.0%) |
| $5,000 to $7,499 | 18 (18.2%) | 0 (0.0%) |
| $7,500 to $9,999 | 0 (0.0%) | 0 (0.0%) |
| $10,000 to $12,499 | 0 (0.0%) | 0 (0.0%) |
| $12,500 to $14,999 | 0 (0.0%) | 12 (32.4%) |
| $15,000 to $17,499 | 0 (0.0%) | 14 (37.8%) |
| $17,500 to $19,999 | 0 (0.0%) | 0 (0.0%) |
| $20,000 to $22,499 | 0 (0.0%) | 0 (0.0%) |
| $22,500 to $24,999 | 0 (0.0%) | 0 (0.0%) |
| $25,000 to $29,999 | 0 (0.0%) | 0 (0.0%) |
| $30,000 to $34,999 | 0 (0.0%) | 0 (0.0%) |
| $35,000 to $39,999 | 0 (0.0%) | 0 (0.0%) |
| $40,000 to $44,999 | 18 (18.2%) | 0 (0.0%) |
| $45,000 to $49,999 | 20 (20.2%) | 0 (0.0%) |
| $50,000 to $54,999 | 0 (0.0%) | 0 (0.0%) |
| $55,000 to $64,999 | 11 (11.1%) | 11 (29.7%) |
| $65,000 to $74,999 | 16 (16.2%) | 0 (0.0%) |
| $75,000 to $99,999 | 0 (0.0%) | 0 (0.0%) |
| $100,000+ | 12 (12.1%) | 0 (0.0%) |
| Total | 99 (100.0%) | 37 (100.0%) |
Earnings by Sex by Educational Attainment in Ash Fork
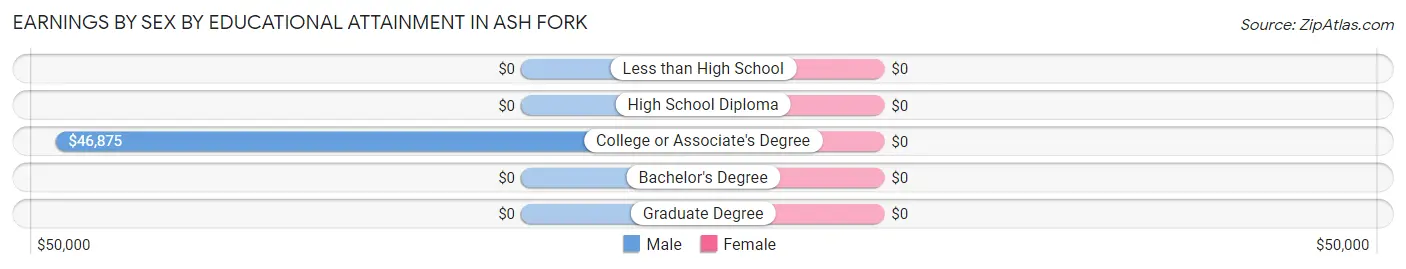
| Educational Attainment | Male Income | Female Income |
| Less than High School | - | - |
| High School Diploma | - | - |
| College or Associate's Degree | $46,875 | $0 |
| Bachelor's Degree | - | - |
| Graduate Degree | - | - |
| Total | $46,438 | $0 |
Family Income in Ash Fork
Family Income Brackets in Ash Fork
According to the Ash Fork family income data, there are 53 families falling into the $75,000 to $99,999 income range, which is the most common income bracket and makes up 42.7% of all families.
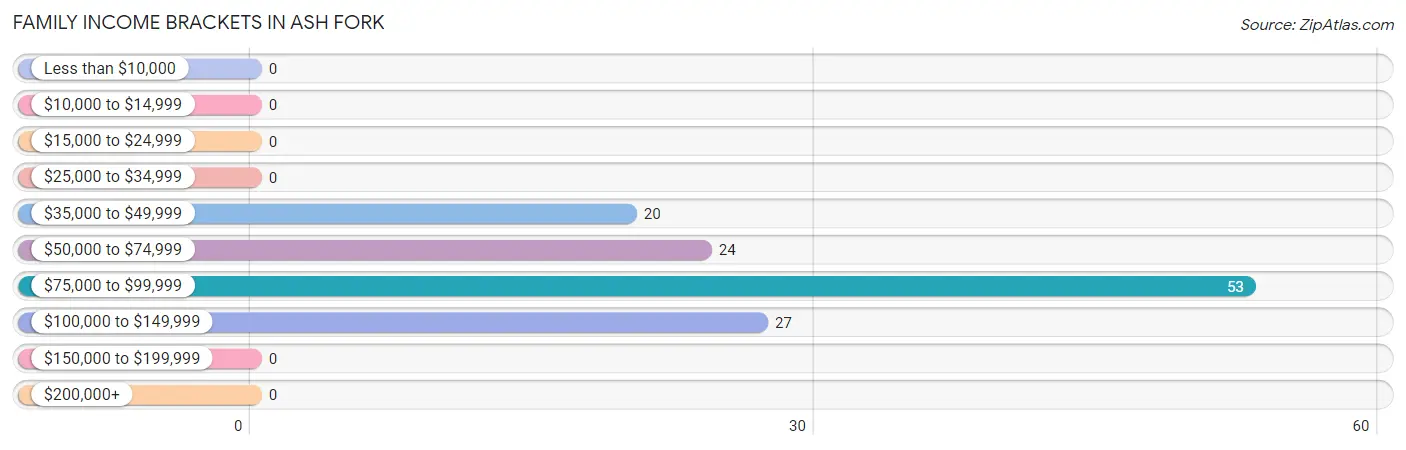
| Income Bracket | # Families | % Families |
| Less than $10,000 | 0 | 0.0% |
| $10,000 to $14,999 | 0 | 0.0% |
| $15,000 to $24,999 | 0 | 0.0% |
| $25,000 to $34,999 | 0 | 0.0% |
| $35,000 to $49,999 | 20 | 16.1% |
| $50,000 to $74,999 | 24 | 19.4% |
| $75,000 to $99,999 | 53 | 42.7% |
| $100,000 to $149,999 | 27 | 21.8% |
| $150,000 to $199,999 | 0 | 0.0% |
| $200,000+ | 0 | 0.0% |
Family Income by Famaliy Size in Ash Fork
2-person families (66 | 53.2%) account for the highest median family income in Ash Fork with $83,600 per family, while 2-person families (66 | 53.2%) have the highest median income of $41,800 per family member.
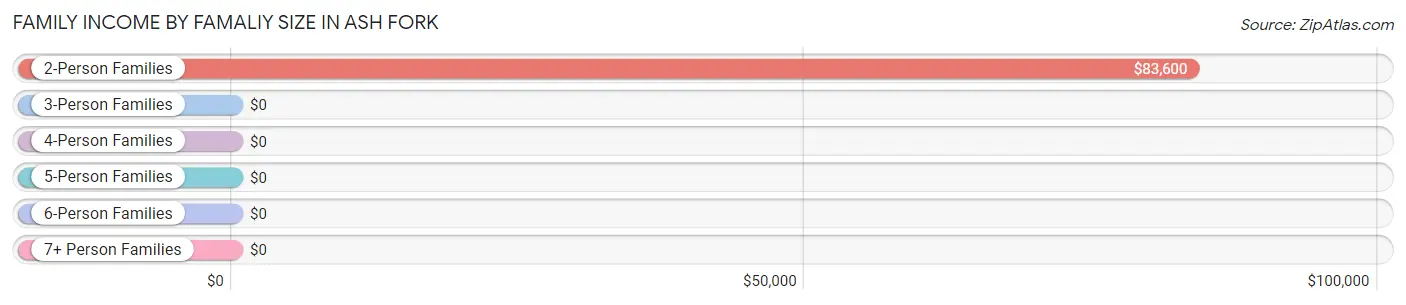
| Income Bracket | # Families | Median Income |
| 2-Person Families | 66 (53.2%) | $83,600 |
| 3-Person Families | 15 (12.1%) | $0 |
| 4-Person Families | 20 (16.1%) | $0 |
| 5-Person Families | 11 (8.9%) | $0 |
| 6-Person Families | 12 (9.7%) | $0 |
| 7+ Person Families | 0 (0.0%) | $0 |
| Total | 124 (100.0%) | $83,400 |
Family Income by Number of Earners in Ash Fork
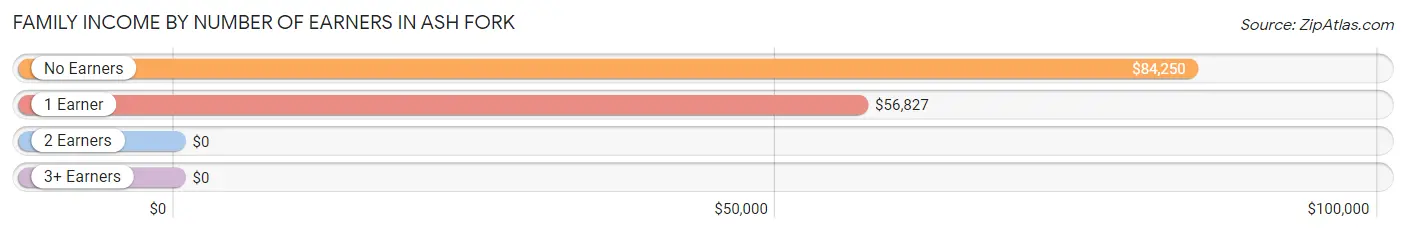
| Number of Earners | # Families | Median Income |
| No Earners | 53 (42.7%) | $84,250 |
| 1 Earner | 59 (47.6%) | $56,827 |
| 2 Earners | 0 (0.0%) | $0 |
| 3+ Earners | 12 (9.7%) | $0 |
| Total | 124 (100.0%) | $83,400 |
Household Income in Ash Fork
Household Income Brackets in Ash Fork
With 60 households falling in the category, the $100,000 to $149,999 income range is the most frequent in Ash Fork, accounting for 35.1% of all households.
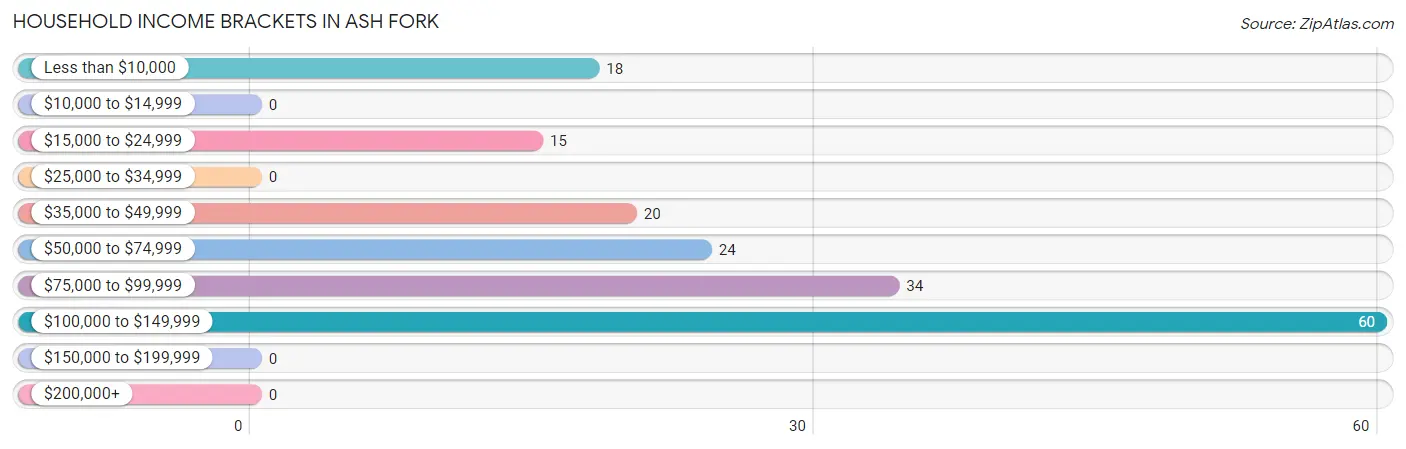
| Income Bracket | # Households | % Households |
| Less than $10,000 | 18 | 10.5% |
| $10,000 to $14,999 | 0 | 0.0% |
| $15,000 to $24,999 | 15 | 8.8% |
| $25,000 to $34,999 | 0 | 0.0% |
| $35,000 to $49,999 | 20 | 11.7% |
| $50,000 to $74,999 | 24 | 14.0% |
| $75,000 to $99,999 | 34 | 19.9% |
| $100,000 to $149,999 | 60 | 35.1% |
| $150,000 to $199,999 | 0 | 0.0% |
| $200,000+ | 0 | 0.0% |
Household Income by Householder Age in Ash Fork
The median household income in Ash Fork is $79,861, with the highest median household income of $84,000 found in the 65+ years age bracket for the primary householder. A total of 78 households (45.6%) fall into this category.
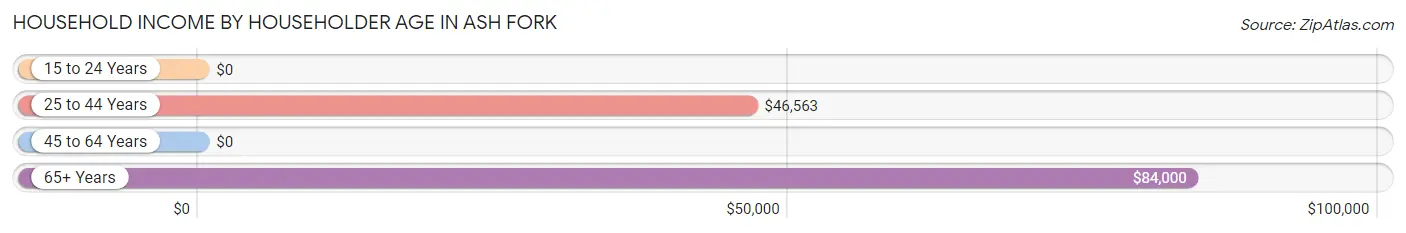
| Income Bracket | # Households | Median Income |
| 15 to 24 Years | 0 (0.0%) | $0 |
| 25 to 44 Years | 61 (35.7%) | $46,563 |
| 45 to 64 Years | 32 (18.7%) | $0 |
| 65+ Years | 78 (45.6%) | $84,000 |
| Total | 171 (100.0%) | $79,861 |
Poverty in Ash Fork
Income Below Poverty by Sex and Age in Ash Fork
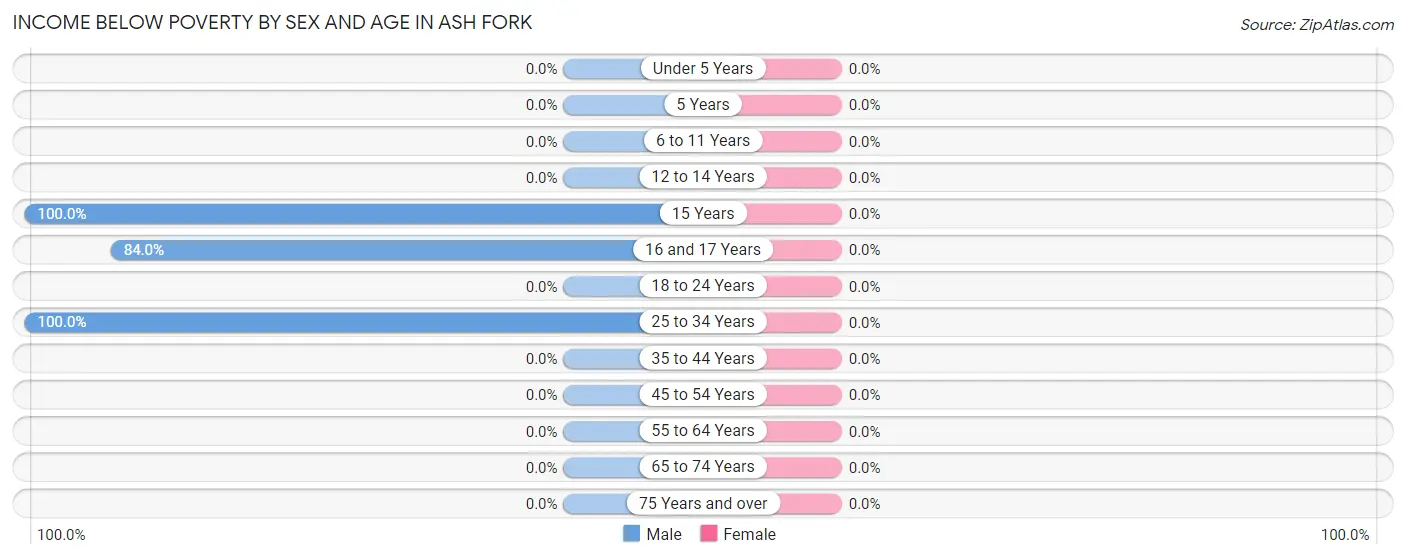
| Age Bracket | Male | Female |
| Under 5 Years | 0 (0.0%) | 0 (0.0%) |
| 5 Years | 0 (0.0%) | 0 (0.0%) |
| 6 to 11 Years | 0 (0.0%) | 0 (0.0%) |
| 12 to 14 Years | 0 (0.0%) | 0 (0.0%) |
| 15 Years | 12 (100.0%) | 0 (0.0%) |
| 16 and 17 Years | 21 (84.0%) | 0 (0.0%) |
| 18 to 24 Years | 0 (0.0%) | 0 (0.0%) |
| 25 to 34 Years | 18 (100.0%) | 0 (0.0%) |
| 35 to 44 Years | 0 (0.0%) | 0 (0.0%) |
| 45 to 54 Years | 0 (0.0%) | 0 (0.0%) |
| 55 to 64 Years | 0 (0.0%) | 0 (0.0%) |
| 65 to 74 Years | 0 (0.0%) | 0 (0.0%) |
| 75 Years and over | 0 (0.0%) | 0 (0.0%) |
| Total | 51 (22.1%) | 0 (0.0%) |
Income Above Poverty by Sex and Age in Ash Fork
According to the poverty statistics in Ash Fork, males aged under 5 years and females aged under 5 years are the age groups that are most secure financially, with 100.0% of males and 100.0% of females in these age groups living above the poverty line.
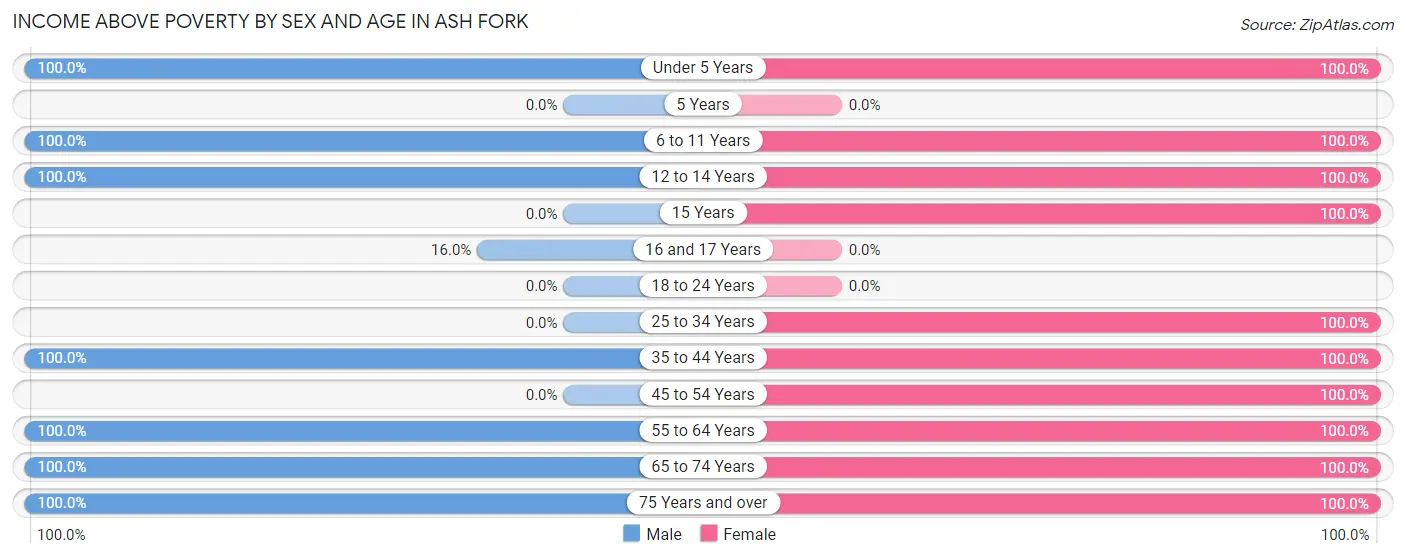
| Age Bracket | Male | Female |
| Under 5 Years | 20 (100.0%) | 31 (100.0%) |
| 5 Years | 0 (0.0%) | 0 (0.0%) |
| 6 to 11 Years | 10 (100.0%) | 11 (100.0%) |
| 12 to 14 Years | 7 (100.0%) | 16 (100.0%) |
| 15 Years | 0 (0.0%) | 3 (100.0%) |
| 16 and 17 Years | 4 (16.0%) | 0 (0.0%) |
| 18 to 24 Years | 0 (0.0%) | 0 (0.0%) |
| 25 to 34 Years | 0 (0.0%) | 10 (100.0%) |
| 35 to 44 Years | 61 (100.0%) | 28 (100.0%) |
| 45 to 54 Years | 0 (0.0%) | 27 (100.0%) |
| 55 to 64 Years | 35 (100.0%) | 28 (100.0%) |
| 65 to 74 Years | 15 (100.0%) | 23 (100.0%) |
| 75 Years and over | 28 (100.0%) | 40 (100.0%) |
| Total | 180 (77.9%) | 217 (100.0%) |
Income Below Poverty Among Married-Couple Families in Ash Fork
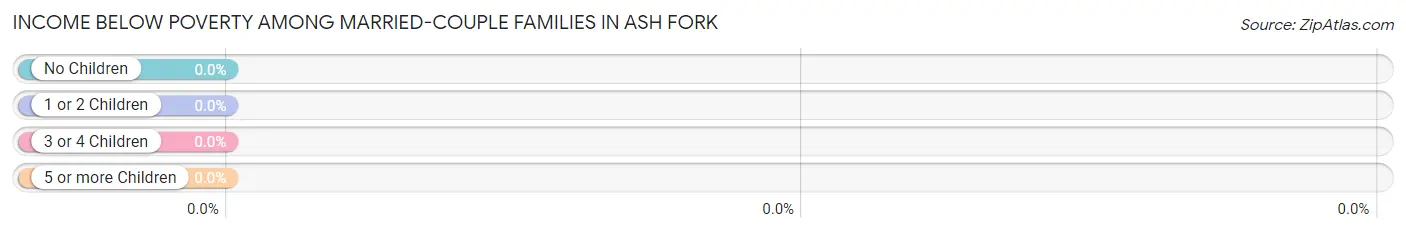
| Children | Above Poverty | Below Poverty |
| No Children | 81 (100.0%) | 0 (0.0%) |
| 1 or 2 Children | 20 (100.0%) | 0 (0.0%) |
| 3 or 4 Children | 23 (100.0%) | 0 (0.0%) |
| 5 or more Children | 0 (0.0%) | 0 (0.0%) |
| Total | 124 (100.0%) | 0 (0.0%) |
Income Below Poverty Among Single-Parent Households in Ash Fork
| Children | Single Father | Single Mother |
| No Children | 0 (0.0%) | 0 (0.0%) |
| 1 or 2 Children | 0 (0.0%) | 0 (0.0%) |
| 3 or 4 Children | 0 (0.0%) | 0 (0.0%) |
| 5 or more Children | 0 (0.0%) | 0 (0.0%) |
| Total | 0 (0.0%) | 0 (0.0%) |
Income Below Poverty Among Married-Couple vs Single-Parent Households in Ash Fork
| Children | Married-Couple Families | Single-Parent Households |
| No Children | 0 (0.0%) | 0 (0.0%) |
| 1 or 2 Children | 0 (0.0%) | 0 (0.0%) |
| 3 or 4 Children | 0 (0.0%) | 0 (0.0%) |
| 5 or more Children | 0 (0.0%) | 0 (0.0%) |
| Total | 0 (0.0%) | 0 (0.0%) |
Race in Ash Fork
The most populous races in Ash Fork are White / Caucasian (323 | 69.3%), Some other Race (75 | 16.1%), and Two or more Races (68 | 14.6%).
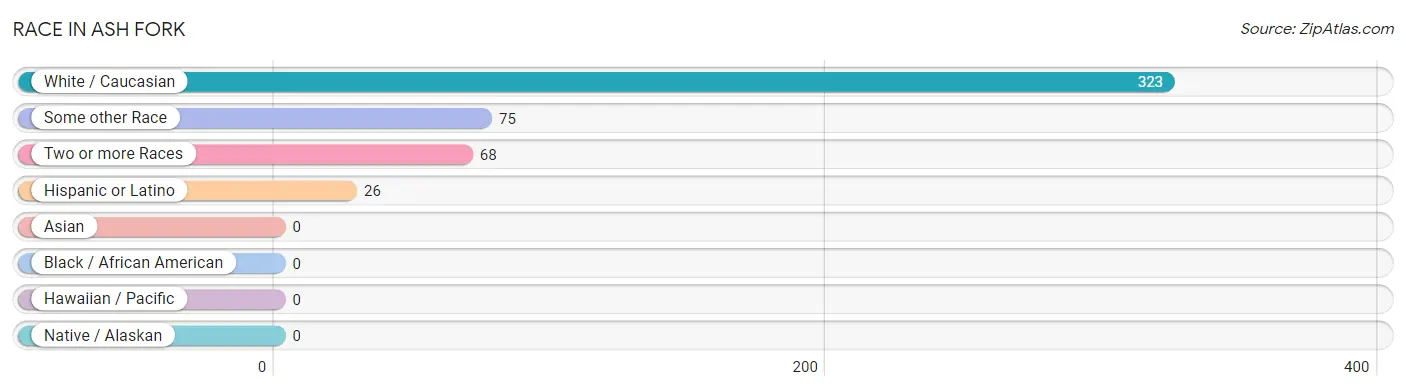
| Race | # Population | % Population |
| Asian | 0 | 0.0% |
| Black / African American | 0 | 0.0% |
| Hawaiian / Pacific | 0 | 0.0% |
| Hispanic or Latino | 26 | 5.6% |
| Native / Alaskan | 0 | 0.0% |
| White / Caucasian | 323 | 69.3% |
| Two or more Races | 68 | 14.6% |
| Some other Race | 75 | 16.1% |
| Total | 466 | 100.0% |
Ancestry in Ash Fork
The most populous ancestries reported in Ash Fork are English (118 | 25.3%), European (54 | 11.6%), Irish (41 | 8.8%), German (40 | 8.6%), and French (27 | 5.8%), together accounting for 60.1% of all Ash Fork residents.
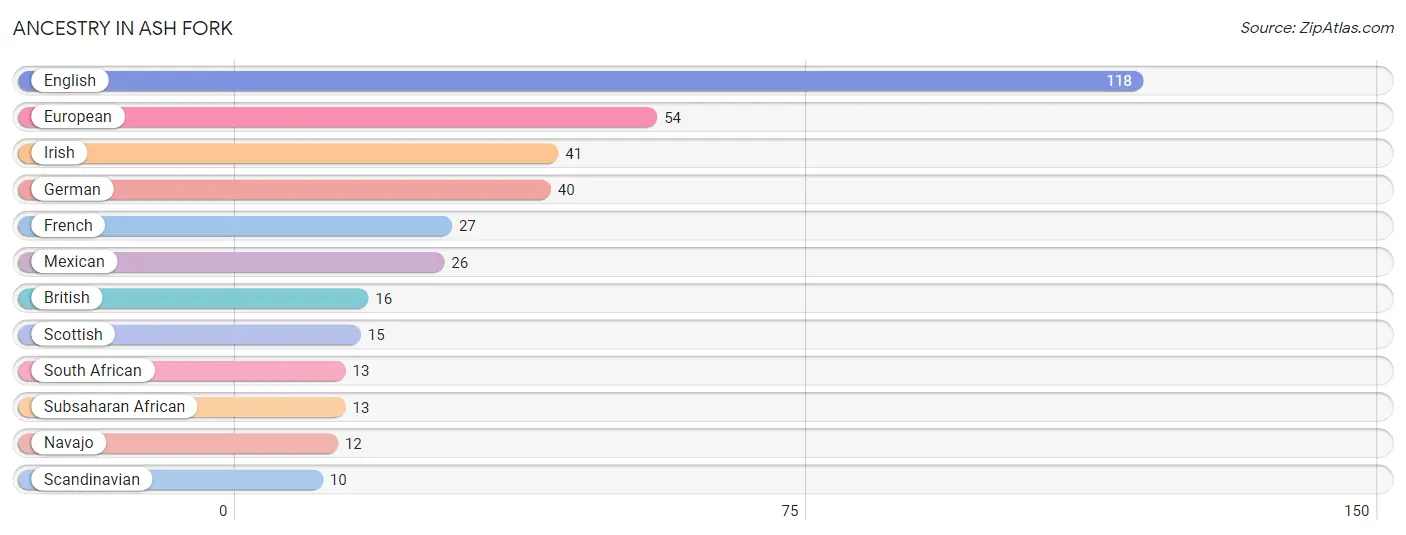
| Ancestry | # Population | % Population |
| British | 16 | 3.4% |
| English | 118 | 25.3% |
| European | 54 | 11.6% |
| French | 27 | 5.8% |
| German | 40 | 8.6% |
| Irish | 41 | 8.8% |
| Mexican | 26 | 5.6% |
| Navajo | 12 | 2.6% |
| Scandinavian | 10 | 2.1% |
| Scottish | 15 | 3.2% |
| South African | 13 | 2.8% |
| Subsaharan African | 13 | 2.8% | View All 12 Rows |
Immigrants in Ash Fork
The most numerous immigrant groups reported in Ash Fork came from Central America (36 | 7.7%), Latin America (36 | 7.7%), Mexico (36 | 7.7%), Africa (13 | 2.8%), and South Africa (13 | 2.8%), together accounting for 28.8% of all Ash Fork residents.
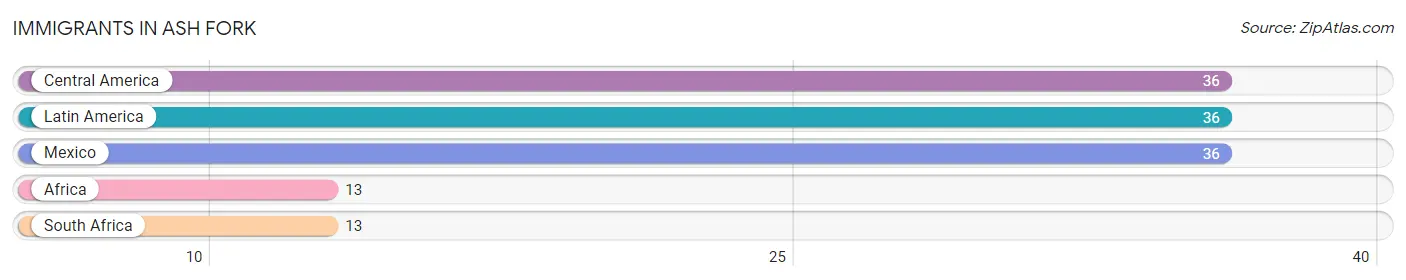
| Immigration Origin | # Population | % Population |
| Africa | 13 | 2.8% |
| Central America | 36 | 7.7% |
| Latin America | 36 | 7.7% |
| Mexico | 36 | 7.7% |
| South Africa | 13 | 2.8% | View All 5 Rows |
Sex and Age in Ash Fork
Sex and Age in Ash Fork
The most populous age groups in Ash Fork are 35 to 39 Years (43 | 17.3%) for men and Under 5 Years (31 | 14.3%) for women.
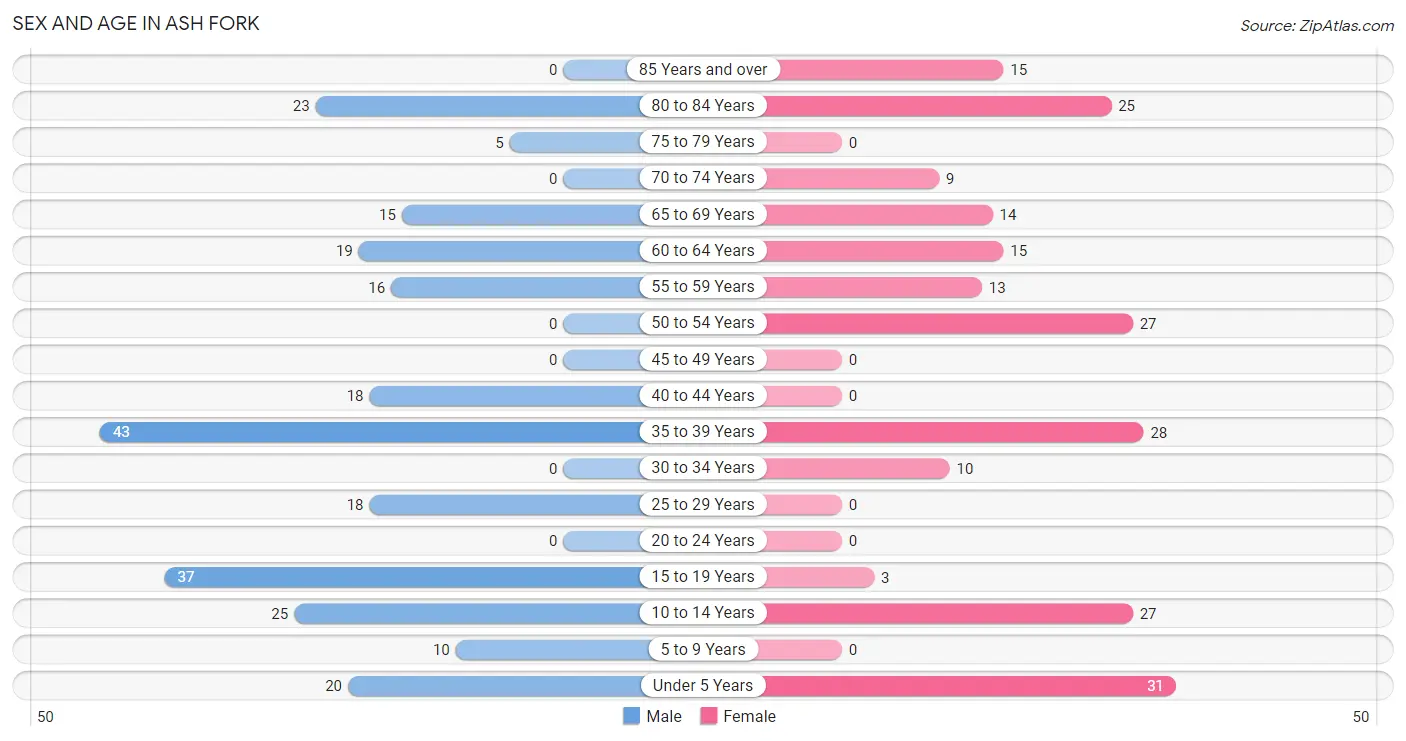
| Age Bracket | Male | Female |
| Under 5 Years | 20 (8.0%) | 31 (14.3%) |
| 5 to 9 Years | 10 (4.0%) | 0 (0.0%) |
| 10 to 14 Years | 25 (10.0%) | 27 (12.4%) |
| 15 to 19 Years | 37 (14.9%) | 3 (1.4%) |
| 20 to 24 Years | 0 (0.0%) | 0 (0.0%) |
| 25 to 29 Years | 18 (7.2%) | 0 (0.0%) |
| 30 to 34 Years | 0 (0.0%) | 10 (4.6%) |
| 35 to 39 Years | 43 (17.3%) | 28 (12.9%) |
| 40 to 44 Years | 18 (7.2%) | 0 (0.0%) |
| 45 to 49 Years | 0 (0.0%) | 0 (0.0%) |
| 50 to 54 Years | 0 (0.0%) | 27 (12.4%) |
| 55 to 59 Years | 16 (6.4%) | 13 (6.0%) |
| 60 to 64 Years | 19 (7.6%) | 15 (6.9%) |
| 65 to 69 Years | 15 (6.0%) | 14 (6.5%) |
| 70 to 74 Years | 0 (0.0%) | 9 (4.2%) |
| 75 to 79 Years | 5 (2.0%) | 0 (0.0%) |
| 80 to 84 Years | 23 (9.2%) | 25 (11.5%) |
| 85 Years and over | 0 (0.0%) | 15 (6.9%) |
| Total | 249 (100.0%) | 217 (100.0%) |
Families and Households in Ash Fork
Median Family Size in Ash Fork
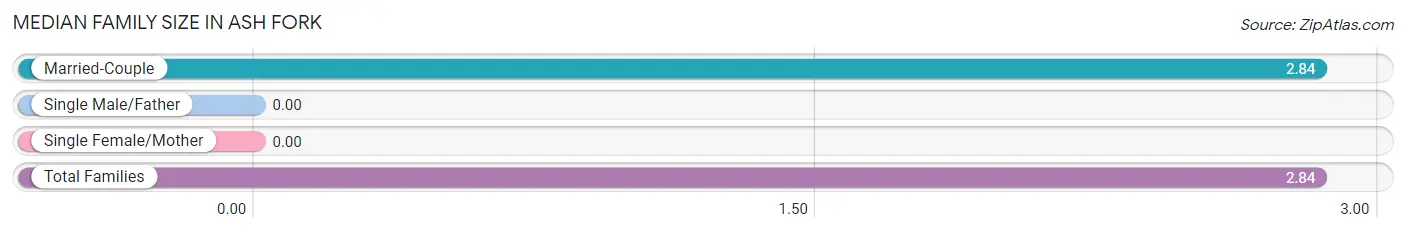
| Family Type | # Families | Family Size |
| Married-Couple | 124 (100.0%) | 2.84 |
| Single Male/Father | 0 (0.0%) | - |
| Single Female/Mother | 0 (0.0%) | - |
| Total Families | 124 (100.0%) | 2.84 |
Median Household Size in Ash Fork
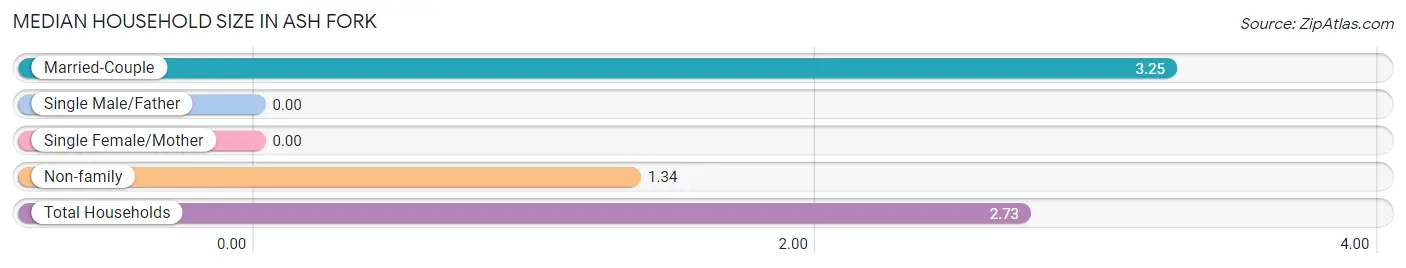
| Household Type | # Households | Household Size |
| Married-Couple | 124 (72.5%) | 3.25 |
| Single Male/Father | 0 (0.0%) | - |
| Single Female/Mother | 0 (0.0%) | - |
| Non-family | 47 (27.5%) | 1.34 |
| Total Households | 171 (100.0%) | 2.73 |
Household Size by Marriage Status in Ash Fork
Out of a total of 171 households in Ash Fork, 124 (72.5%) are family households, while 47 (27.5%) are nonfamily households. The most numerous type of family households are 2-person households, comprising 47, and the most common type of nonfamily households are 1-person households, comprising 33.

| Household Size | Family Households | Nonfamily Households |
| 1-Person Households | - | 33 (19.3%) |
| 2-Person Households | 47 (27.5%) | 14 (8.2%) |
| 3-Person Households | 15 (8.8%) | 0 (0.0%) |
| 4-Person Households | 20 (11.7%) | 0 (0.0%) |
| 5-Person Households | 30 (17.5%) | 0 (0.0%) |
| 6-Person Households | 12 (7.0%) | 0 (0.0%) |
| 7+ Person Households | 0 (0.0%) | 0 (0.0%) |
| Total | 124 (72.5%) | 47 (27.5%) |
Female Fertility in Ash Fork
Fertility by Age in Ash Fork
Average fertility rate in Ash Fork is 244.0 births per 1,000 women. Women in the age bracket of 20 to 34 years have the highest fertility rate with 1,000.0 births per 1,000 women. Women in the age bracket of 20 to 34 years acount for 100.0% of all women with births.
| Age Bracket | Women with Births | Births / 1,000 Women |
| 15 to 19 years | 0 (0.0%) | 0.0 |
| 20 to 34 years | 10 (100.0%) | 1,000.0 |
| 35 to 50 years | 0 (0.0%) | 0.0 |
| Total | 10 (100.0%) | 244.0 |
Fertility by Age by Marriage Status in Ash Fork
| Age Bracket | Married | Unmarried |
| 15 to 19 years | 0 (0.0%) | 0 (0.0%) |
| 20 to 34 years | 10 (100.0%) | 0 (0.0%) |
| 35 to 50 years | 0 (0.0%) | 0 (0.0%) |
| Total | 10 (100.0%) | 0 (0.0%) |
Fertility by Education in Ash Fork
| Educational Attainment | Women with Births | Births / 1,000 Women |
| Less than High School | 0 (0.0%) | 0.0 |
| High School Diploma | 10 (100.0%) | 1,000.0 |
| College or Associate's Degree | 0 (0.0%) | 0.0 |
| Bachelor's Degree | 0 (0.0%) | 0.0 |
| Graduate Degree | 0 (0.0%) | 0.0 |
| Total | 10 (100.0%) | 244.0 |
Fertility by Education by Marriage Status in Ash Fork
| Educational Attainment | Married | Unmarried |
| Less than High School | 0 (0.0%) | 0 (0.0%) |
| High School Diploma | 10 (100.0%) | 0 (0.0%) |
| College or Associate's Degree | 0 (0.0%) | 0 (0.0%) |
| Bachelor's Degree | 0 (0.0%) | 0 (0.0%) |
| Graduate Degree | 0 (0.0%) | 0 (0.0%) |
| Total | 10 (100.0%) | 0 (0.0%) |
Employment Characteristics in Ash Fork
Employment by Class of Employer in Ash Fork
Among the 86 employed individuals in Ash Fork, private company employees (48 | 55.8%), self-employed (not incorporated) (16 | 18.6%), and local government employees (11 | 12.8%) make up the most common classes of employment.
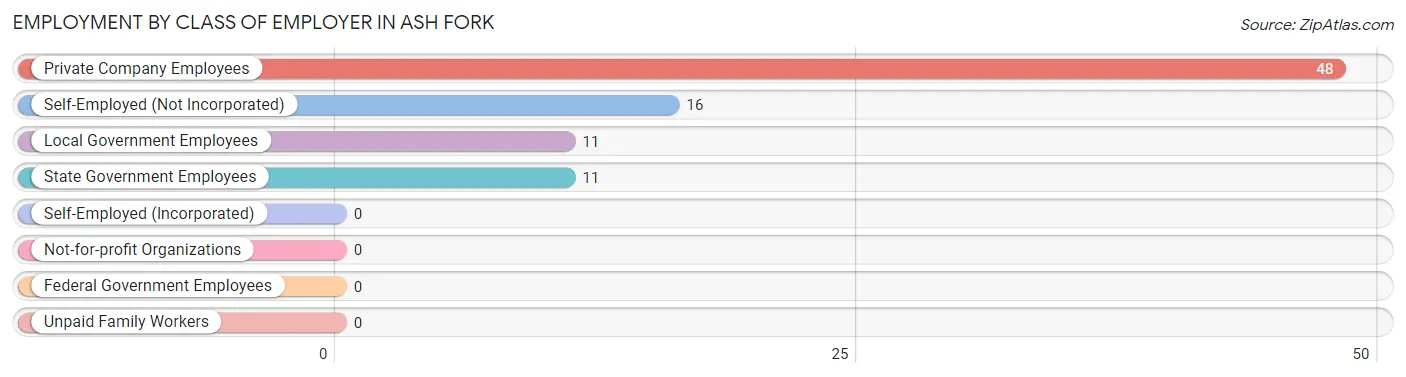
| Employer Class | # Employees | % Employees |
| Private Company Employees | 48 | 55.8% |
| Self-Employed (Incorporated) | 0 | 0.0% |
| Self-Employed (Not Incorporated) | 16 | 18.6% |
| Not-for-profit Organizations | 0 | 0.0% |
| Local Government Employees | 11 | 12.8% |
| State Government Employees | 11 | 12.8% |
| Federal Government Employees | 0 | 0.0% |
| Unpaid Family Workers | 0 | 0.0% |
| Total | 86 | 100.0% |
Employment Status by Age in Ash Fork
According to the labor force statistics for Ash Fork, out of the total population over 16 years of age (338), 40.2% or 136 individuals are in the labor force, with 26.5% or 36 of them unemployed. The age group with the highest labor force participation rate is 25 to 29 years, with 100.0% or 18 individuals in the labor force. Within the labor force, the 25 to 29 years age range has the highest percentage of unemployed individuals, with 100.0% or 18 of them being unemployed.
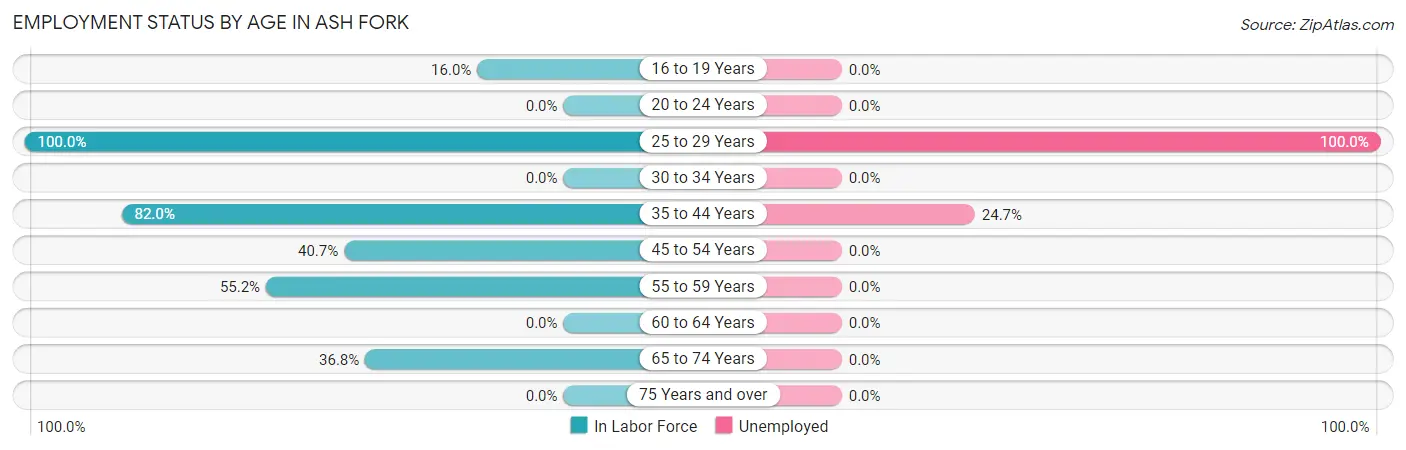
| Age Bracket | In Labor Force | Unemployed |
| 16 to 19 Years | 4 (16.0%) | 0 (0.0%) |
| 20 to 24 Years | 0 (0.0%) | 0 (0.0%) |
| 25 to 29 Years | 18 (100.0%) | 18 (100.0%) |
| 30 to 34 Years | 0 (0.0%) | 0 (0.0%) |
| 35 to 44 Years | 73 (82.0%) | 18 (24.7%) |
| 45 to 54 Years | 11 (40.7%) | 0 (0.0%) |
| 55 to 59 Years | 16 (55.2%) | 0 (0.0%) |
| 60 to 64 Years | 0 (0.0%) | 0 (0.0%) |
| 65 to 74 Years | 14 (36.8%) | 0 (0.0%) |
| 75 Years and over | 0 (0.0%) | 0 (0.0%) |
| Total | 136 (40.2%) | 36 (26.5%) |
Employment Status by Educational Attainment in Ash Fork
According to labor force statistics for Ash Fork, 57.0% of individuals (118) out of the total population between 25 and 64 years of age (207) are in the labor force, with 30.5% or 36 of them being unemployed. The group with the highest labor force participation rate are those with the educational attainment of college / associate degree, with 69.0% or 78 individuals in the labor force. Within the labor force, individuals with high school diploma education have the highest percentage of unemployment, with 62.1% or 18 of them being unemployed.
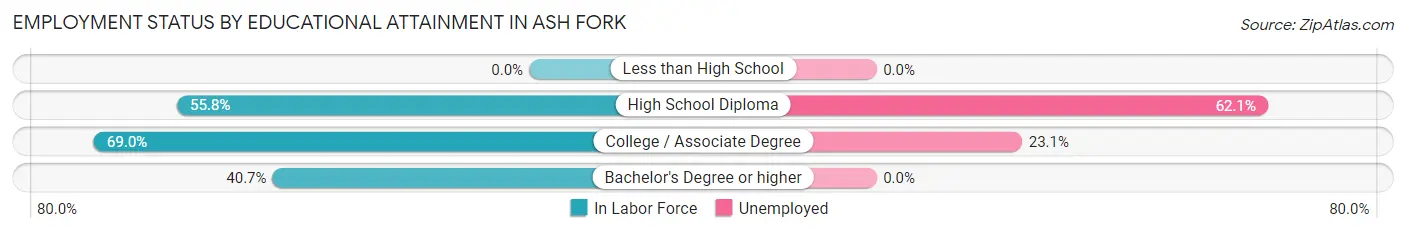
| Educational Attainment | In Labor Force | Unemployed |
| Less than High School | 0 (0.0%) | 0 (0.0%) |
| High School Diploma | 29 (55.8%) | 32 (62.1%) |
| College / Associate Degree | 78 (69.0%) | 26 (23.1%) |
| Bachelor's Degree or higher | 11 (40.7%) | 0 (0.0%) |
| Total | 118 (57.0%) | 63 (30.5%) |
Employment Occupations by Sex in Ash Fork
Management, Business, Science and Arts Occupations
The most common Management, Business, Science and Arts occupations in Ash Fork are Community & Social Service (14 | 14.0%), Education Instruction & Library (14 | 14.0%), Computers, Engineering & Science (12 | 12.0%), Architecture & Engineering (12 | 12.0%), and Health Diagnosing & Treating (11 | 11.0%).
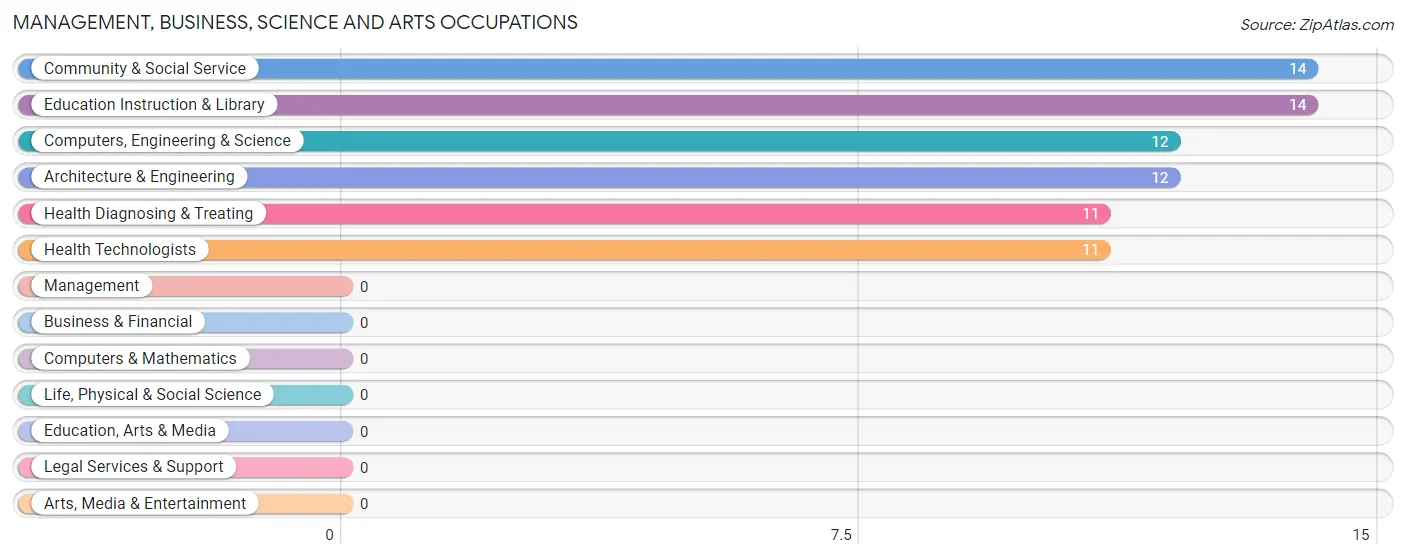
Management, Business, Science and Arts Occupations by Sex
Within the Management, Business, Science and Arts occupations in Ash Fork, the most male-oriented occupations are Computers, Engineering & Science (100.0%), and Architecture & Engineering (100.0%), while the most female-oriented occupations are Community & Social Service (100.0%), Education Instruction & Library (100.0%), and Health Diagnosing & Treating (100.0%).
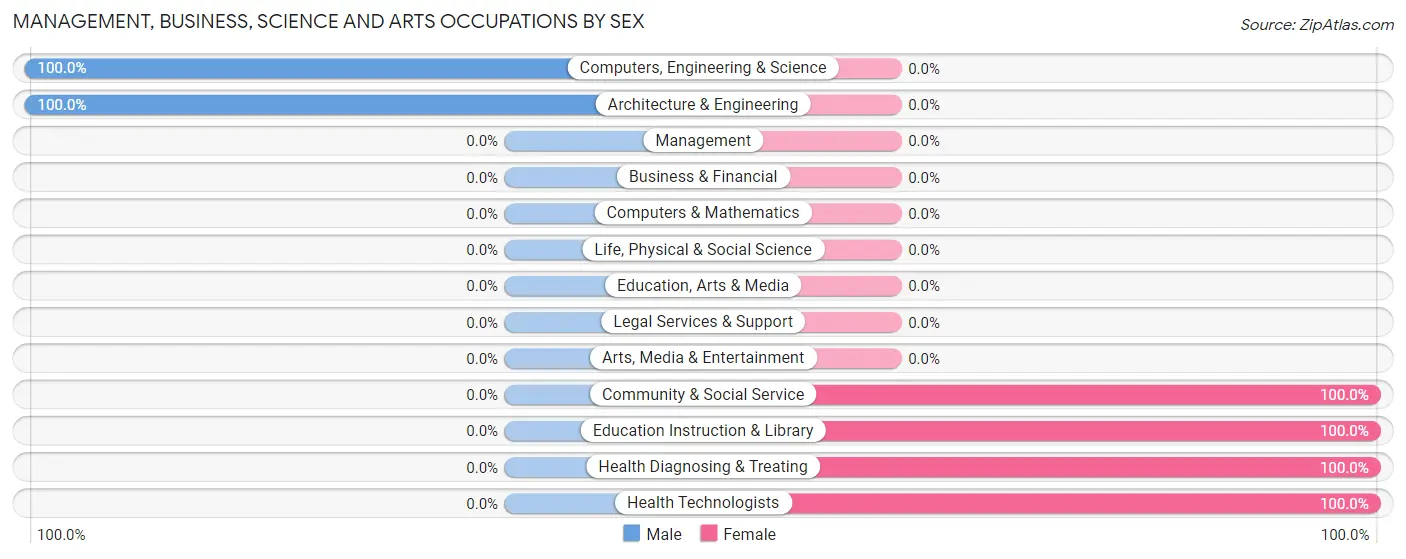
| Occupation | Male | Female |
| Management | 0 (0.0%) | 0 (0.0%) |
| Business & Financial | 0 (0.0%) | 0 (0.0%) |
| Computers, Engineering & Science | 12 (100.0%) | 0 (0.0%) |
| Computers & Mathematics | 0 (0.0%) | 0 (0.0%) |
| Architecture & Engineering | 12 (100.0%) | 0 (0.0%) |
| Life, Physical & Social Science | 0 (0.0%) | 0 (0.0%) |
| Community & Social Service | 0 (0.0%) | 14 (100.0%) |
| Education, Arts & Media | 0 (0.0%) | 0 (0.0%) |
| Legal Services & Support | 0 (0.0%) | 0 (0.0%) |
| Education Instruction & Library | 0 (0.0%) | 14 (100.0%) |
| Arts, Media & Entertainment | 0 (0.0%) | 0 (0.0%) |
| Health Diagnosing & Treating | 0 (0.0%) | 11 (100.0%) |
| Health Technologists | 0 (0.0%) | 11 (100.0%) |
| Total (Category) | 12 (32.4%) | 25 (67.6%) |
| Total (Overall) | 63 (63.0%) | 37 (37.0%) |
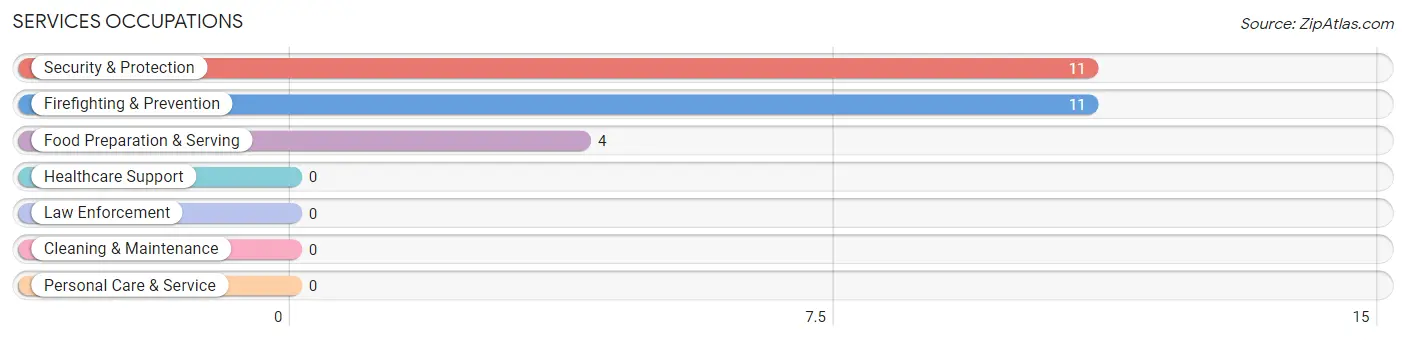
Services Occupations
The most common Services occupations in Ash Fork are Security & Protection (11 | 11.0%), Firefighting & Prevention (11 | 11.0%), and Food Preparation & Serving (4 | 4.0%).
Services Occupations by Sex
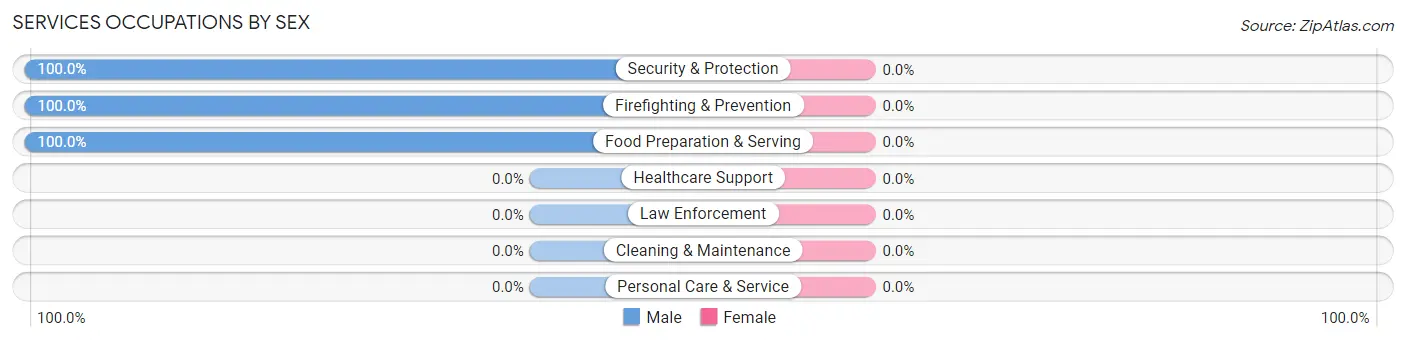
| Occupation | Male | Female |
| Healthcare Support | 0 (0.0%) | 0 (0.0%) |
| Security & Protection | 11 (100.0%) | 0 (0.0%) |
| Firefighting & Prevention | 11 (100.0%) | 0 (0.0%) |
| Law Enforcement | 0 (0.0%) | 0 (0.0%) |
| Food Preparation & Serving | 4 (100.0%) | 0 (0.0%) |
| Cleaning & Maintenance | 0 (0.0%) | 0 (0.0%) |
| Personal Care & Service | 0 (0.0%) | 0 (0.0%) |
| Total (Category) | 15 (100.0%) | 0 (0.0%) |
| Total (Overall) | 63 (63.0%) | 37 (37.0%) |
Sales and Office Occupations
The most common Sales and Office occupations in Ash Fork are , and Sales & Related (12 | 12.0%).
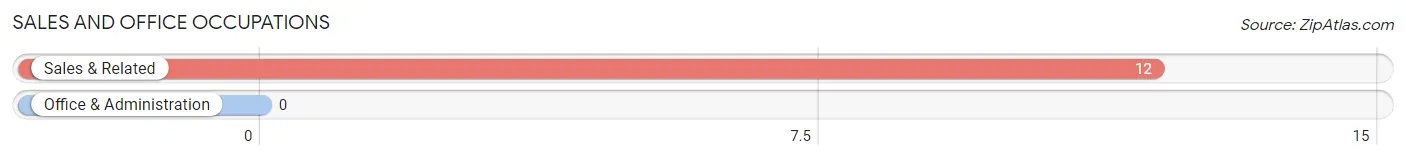
Sales and Office Occupations by Sex
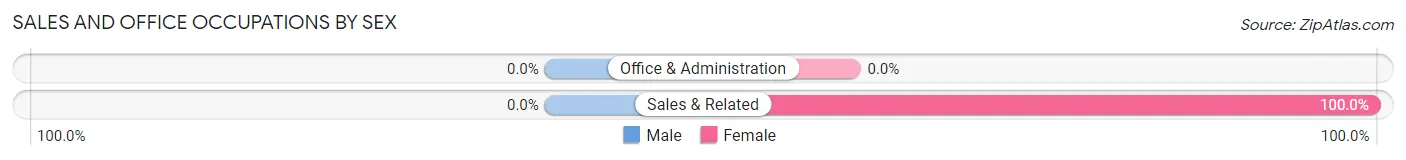
| Occupation | Male | Female |
| Sales & Related | 0 (0.0%) | 12 (100.0%) |
| Office & Administration | 0 (0.0%) | 0 (0.0%) |
| Total (Category) | 0 (0.0%) | 12 (100.0%) |
| Total (Overall) | 63 (63.0%) | 37 (37.0%) |
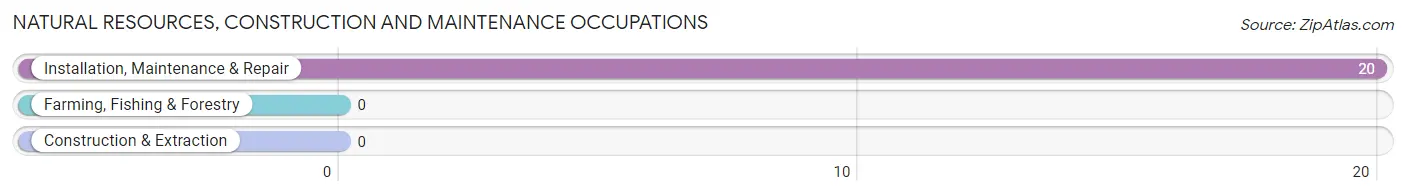
Natural Resources, Construction and Maintenance Occupations
The most common Natural Resources, Construction and Maintenance occupations in Ash Fork are , and Installation, Maintenance & Repair (20 | 20.0%).
Natural Resources, Construction and Maintenance Occupations by Sex
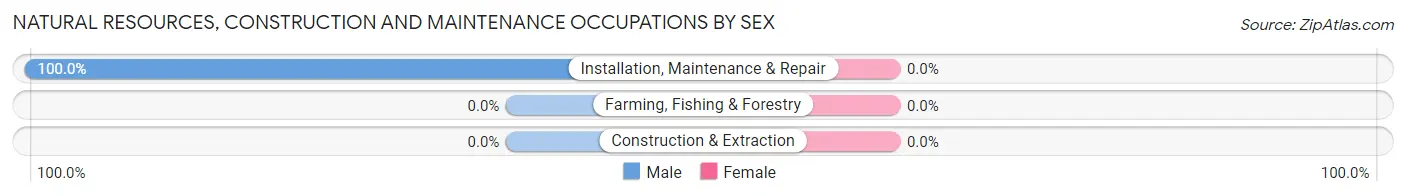
| Occupation | Male | Female |
| Farming, Fishing & Forestry | 0 (0.0%) | 0 (0.0%) |
| Construction & Extraction | 0 (0.0%) | 0 (0.0%) |
| Installation, Maintenance & Repair | 20 (100.0%) | 0 (0.0%) |
| Total (Category) | 20 (100.0%) | 0 (0.0%) |
| Total (Overall) | 63 (63.0%) | 37 (37.0%) |
Production, Transportation and Moving Occupations
The most common Production, Transportation and Moving occupations in Ash Fork are , and Transportation (16 | 16.0%).
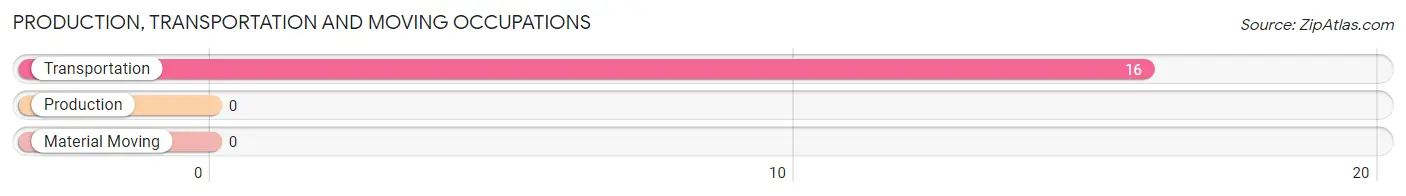
Production, Transportation and Moving Occupations by Sex
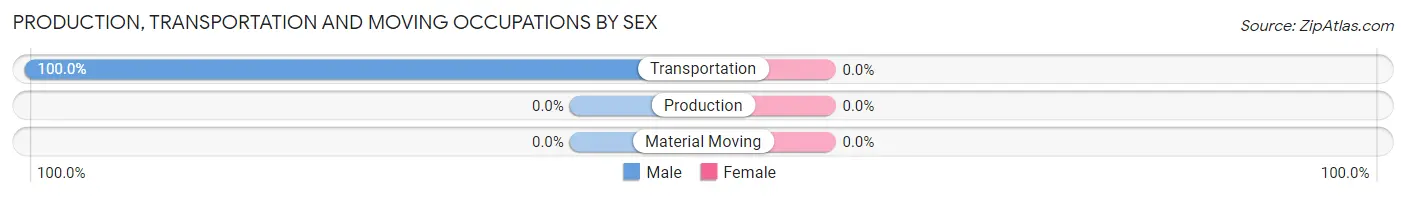
| Occupation | Male | Female |
| Production | 0 (0.0%) | 0 (0.0%) |
| Transportation | 16 (100.0%) | 0 (0.0%) |
| Material Moving | 0 (0.0%) | 0 (0.0%) |
| Total (Category) | 16 (100.0%) | 0 (0.0%) |
| Total (Overall) | 63 (63.0%) | 37 (37.0%) |
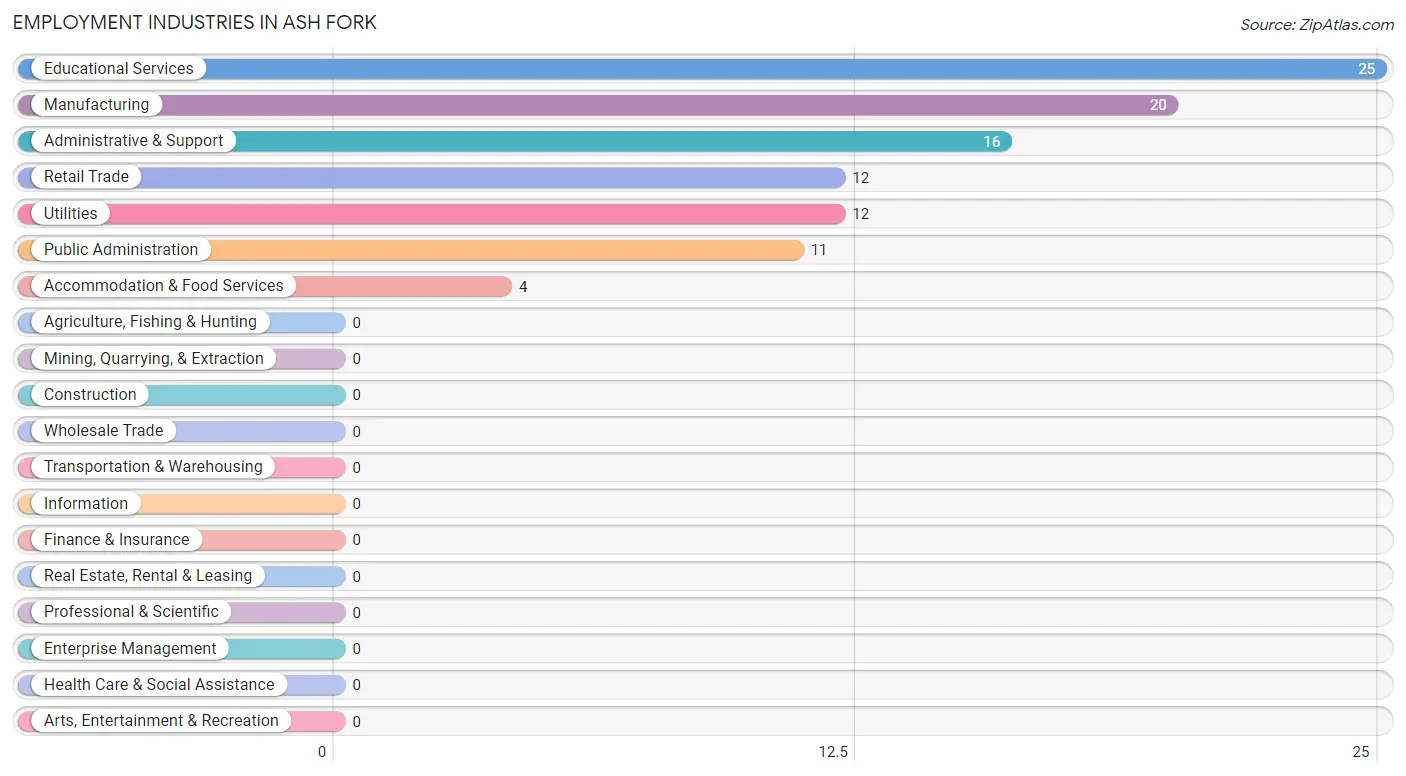
Employment Industries by Sex in Ash Fork
Employment Industries in Ash Fork
The major employment industries in Ash Fork include Educational Services (25 | 25.0%), Manufacturing (20 | 20.0%), Administrative & Support (16 | 16.0%), Retail Trade (12 | 12.0%), and Utilities (12 | 12.0%).
Employment Industries by Sex in Ash Fork
The Ash Fork industries that see more men than women are Manufacturing (100.0%), Utilities (100.0%), and Administrative & Support (100.0%), whereas the industries that tend to have a higher number of women are Retail Trade (100.0%), and Educational Services (100.0%).
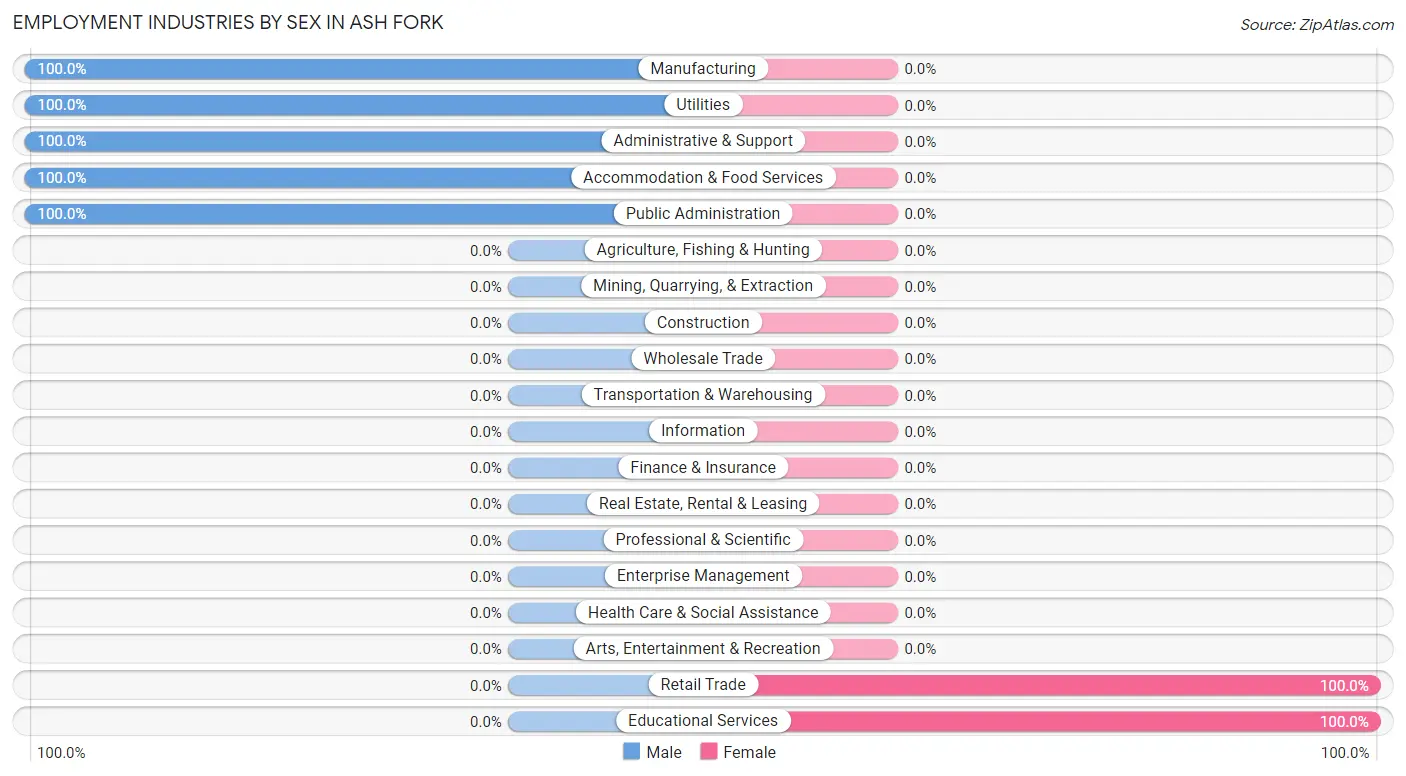
| Industry | Male | Female |
| Agriculture, Fishing & Hunting | 0 (0.0%) | 0 (0.0%) |
| Mining, Quarrying, & Extraction | 0 (0.0%) | 0 (0.0%) |
| Construction | 0 (0.0%) | 0 (0.0%) |
| Manufacturing | 20 (100.0%) | 0 (0.0%) |
| Wholesale Trade | 0 (0.0%) | 0 (0.0%) |
| Retail Trade | 0 (0.0%) | 12 (100.0%) |
| Transportation & Warehousing | 0 (0.0%) | 0 (0.0%) |
| Utilities | 12 (100.0%) | 0 (0.0%) |
| Information | 0 (0.0%) | 0 (0.0%) |
| Finance & Insurance | 0 (0.0%) | 0 (0.0%) |
| Real Estate, Rental & Leasing | 0 (0.0%) | 0 (0.0%) |
| Professional & Scientific | 0 (0.0%) | 0 (0.0%) |
| Enterprise Management | 0 (0.0%) | 0 (0.0%) |
| Administrative & Support | 16 (100.0%) | 0 (0.0%) |
| Educational Services | 0 (0.0%) | 25 (100.0%) |
| Health Care & Social Assistance | 0 (0.0%) | 0 (0.0%) |
| Arts, Entertainment & Recreation | 0 (0.0%) | 0 (0.0%) |
| Accommodation & Food Services | 4 (100.0%) | 0 (0.0%) |
| Public Administration | 11 (100.0%) | 0 (0.0%) |
| Total | 63 (63.0%) | 37 (37.0%) |
Education in Ash Fork
School Enrollment in Ash Fork
The most common levels of schooling among the 102 students in Ash Fork are high school (58 | 56.9%), middle school (34 | 33.3%), and elementary school (10 | 9.8%).
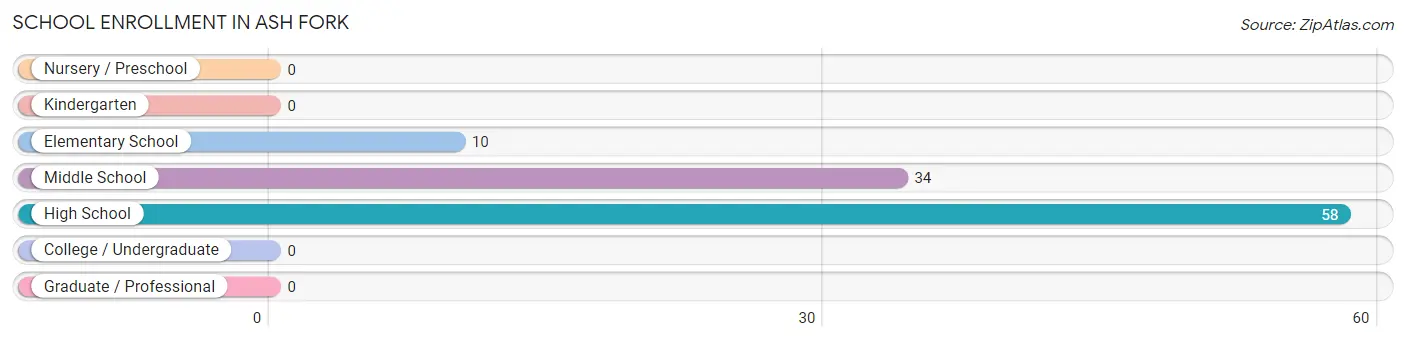
| School Level | # Students | % Students |
| Nursery / Preschool | 0 | 0.0% |
| Kindergarten | 0 | 0.0% |
| Elementary School | 10 | 9.8% |
| Middle School | 34 | 33.3% |
| High School | 58 | 56.9% |
| College / Undergraduate | 0 | 0.0% |
| Graduate / Professional | 0 | 0.0% |
| Total | 102 | 100.0% |
School Enrollment by Age by Funding Source in Ash Fork
Out of a total of 102 students who are enrolled in schools in Ash Fork, 10 (9.8%) attend a private institution, while the remaining 92 (90.2%) are enrolled in public schools. The age group of 5 to 9 year old has the highest likelihood of being enrolled in private schools, with 10 (100.0% in the age bracket) enrolled. Conversely, the age group of 10 to 14 year olds has the lowest likelihood of being enrolled in a private school, with 52 (100.0% in the age bracket) attending a public institution.
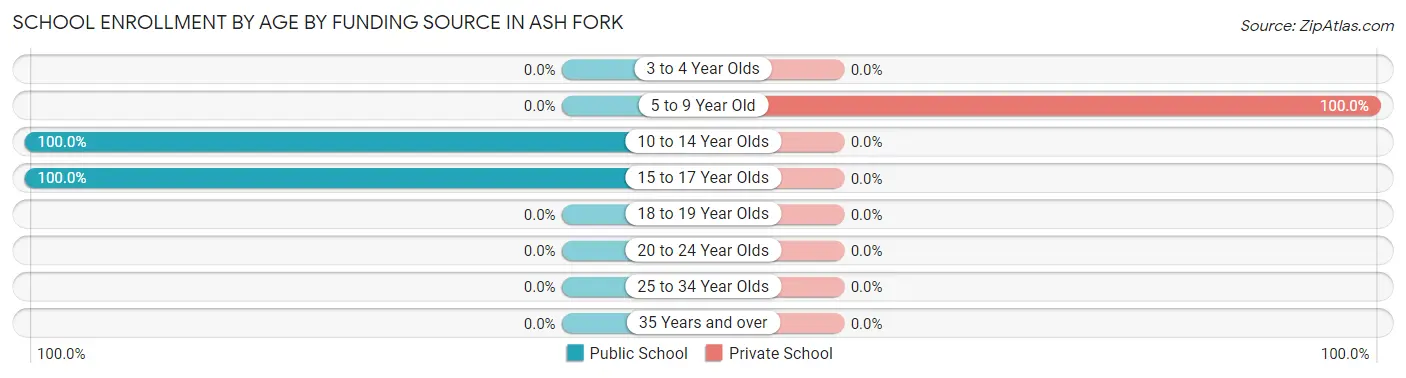
| Age Bracket | Public School | Private School |
| 3 to 4 Year Olds | 0 (0.0%) | 0 (0.0%) |
| 5 to 9 Year Old | 0 (0.0%) | 10 (100.0%) |
| 10 to 14 Year Olds | 52 (100.0%) | 0 (0.0%) |
| 15 to 17 Year Olds | 40 (100.0%) | 0 (0.0%) |
| 18 to 19 Year Olds | 0 (0.0%) | 0 (0.0%) |
| 20 to 24 Year Olds | 0 (0.0%) | 0 (0.0%) |
| 25 to 34 Year Olds | 0 (0.0%) | 0 (0.0%) |
| 35 Years and over | 0 (0.0%) | 0 (0.0%) |
| Total | 92 (90.2%) | 10 (9.8%) |
Educational Attainment by Field of Study in Ash Fork
Business (16 | 39.0%), bio, nature & agricultural (14 | 34.2%), and science & technology (11 | 26.8%) are the most common fields of study among 41 individuals in Ash Fork who have obtained a bachelor's degree or higher.
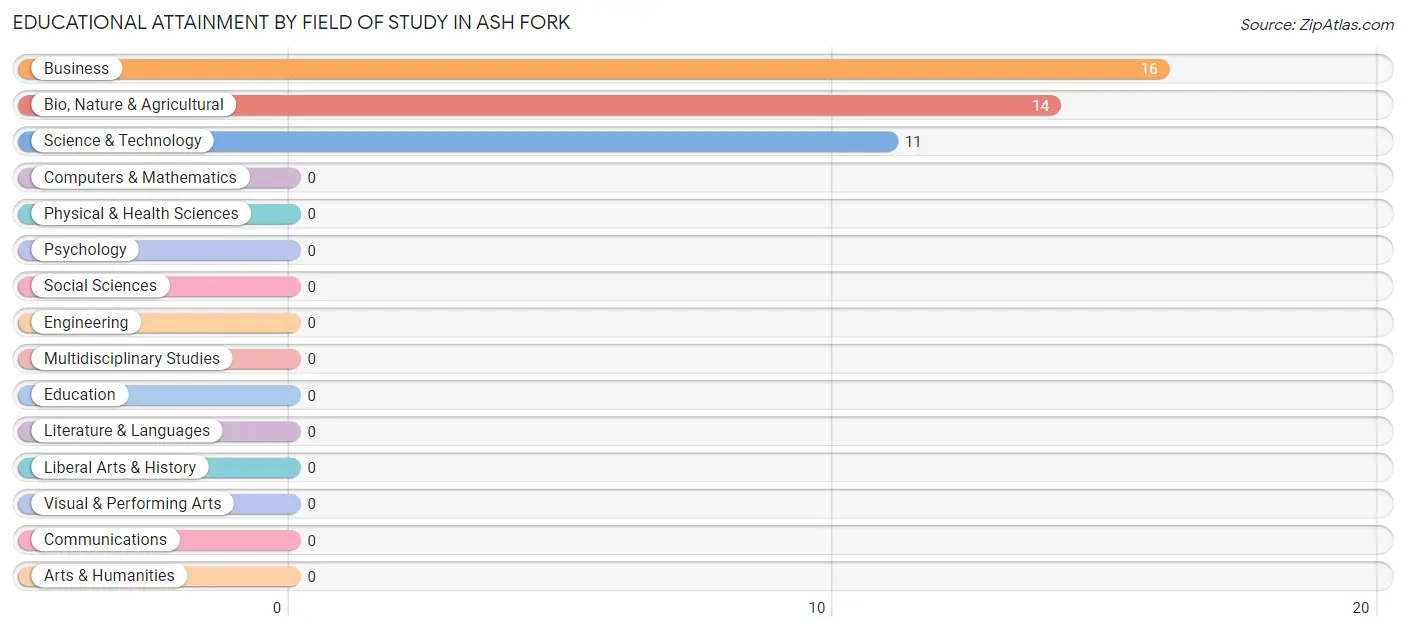
| Field of Study | # Graduates | % Graduates |
| Computers & Mathematics | 0 | 0.0% |
| Bio, Nature & Agricultural | 14 | 34.2% |
| Physical & Health Sciences | 0 | 0.0% |
| Psychology | 0 | 0.0% |
| Social Sciences | 0 | 0.0% |
| Engineering | 0 | 0.0% |
| Multidisciplinary Studies | 0 | 0.0% |
| Science & Technology | 11 | 26.8% |
| Business | 16 | 39.0% |
| Education | 0 | 0.0% |
| Literature & Languages | 0 | 0.0% |
| Liberal Arts & History | 0 | 0.0% |
| Visual & Performing Arts | 0 | 0.0% |
| Communications | 0 | 0.0% |
| Arts & Humanities | 0 | 0.0% |
| Total | 41 | 100.0% |
Transportation & Commute in Ash Fork
Vehicle Availability by Sex in Ash Fork
The most prevalent vehicle ownership categories in Ash Fork are males with 4 vehicles (36, accounting for 57.1%) and females with 4 vehicles (11, making up 156.5%).
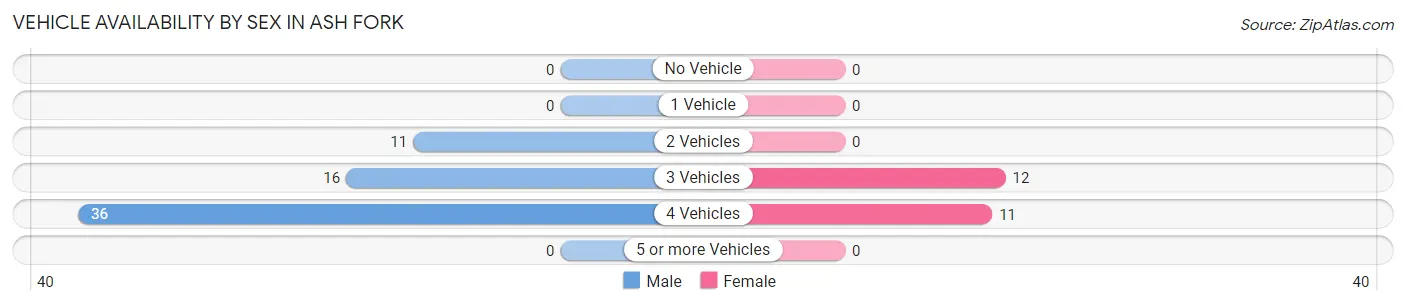
| Vehicles Available | Male | Female |
| No Vehicle | 0 (0.0%) | 0 (0.0%) |
| 1 Vehicle | 0 (0.0%) | 0 (0.0%) |
| 2 Vehicles | 11 (17.5%) | 0 (0.0%) |
| 3 Vehicles | 16 (25.4%) | 12 (52.2%) |
| 4 Vehicles | 36 (57.1%) | 11 (47.8%) |
| 5 or more Vehicles | 0 (0.0%) | 0 (0.0%) |
| Total | 63 (100.0%) | 23 (100.0%) |
Commute Time in Ash Fork
The most frequently occuring commute durations in Ash Fork are 10 to 14 minutes (24 commuters, 38.1%), less than 5 minutes (16 commuters, 25.4%), and 35 to 39 minutes (12 commuters, 19.1%).
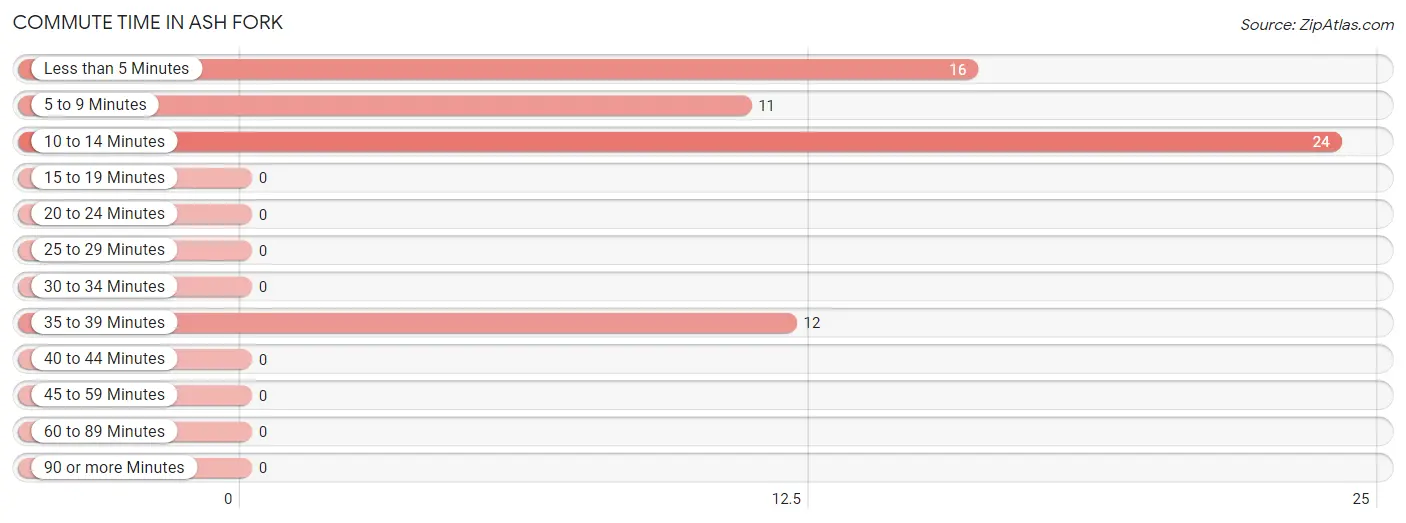
| Commute Time | # Commuters | % Commuters |
| Less than 5 Minutes | 16 | 25.4% |
| 5 to 9 Minutes | 11 | 17.5% |
| 10 to 14 Minutes | 24 | 38.1% |
| 15 to 19 Minutes | 0 | 0.0% |
| 20 to 24 Minutes | 0 | 0.0% |
| 25 to 29 Minutes | 0 | 0.0% |
| 30 to 34 Minutes | 0 | 0.0% |
| 35 to 39 Minutes | 12 | 19.1% |
| 40 to 44 Minutes | 0 | 0.0% |
| 45 to 59 Minutes | 0 | 0.0% |
| 60 to 89 Minutes | 0 | 0.0% |
| 90 or more Minutes | 0 | 0.0% |
Commute Time by Sex in Ash Fork
The most common commute times in Ash Fork are 10 to 14 minutes (24 commuters, 47.1%) for males and 35 to 39 minutes (12 commuters, 100.0%) for females.
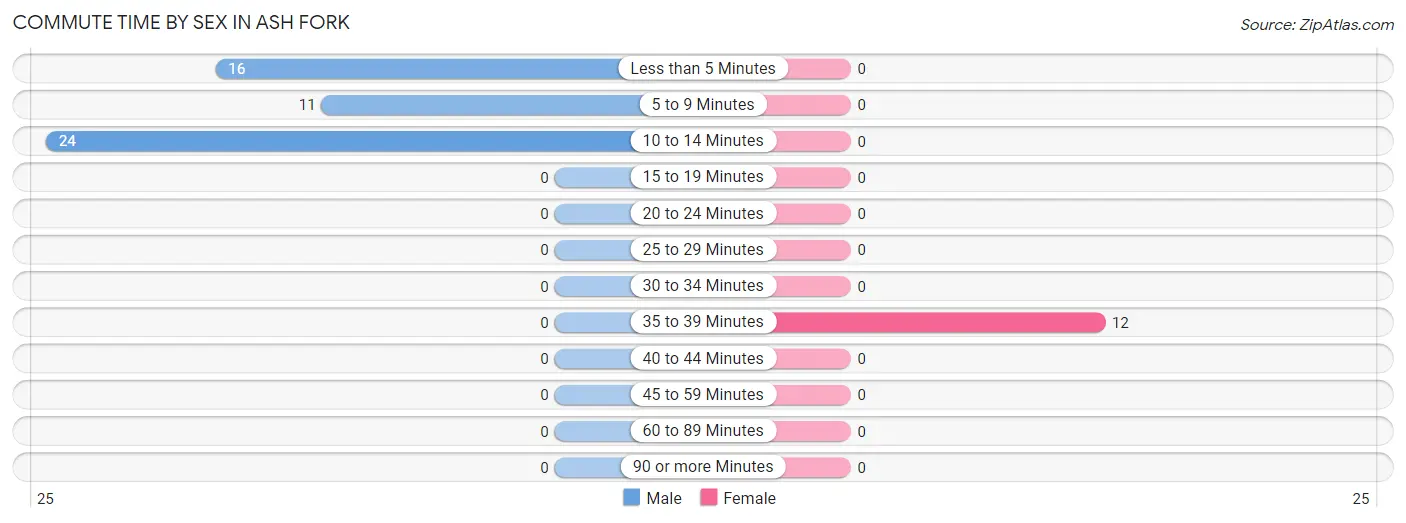
| Commute Time | Male | Female |
| Less than 5 Minutes | 16 (31.4%) | 0 (0.0%) |
| 5 to 9 Minutes | 11 (21.6%) | 0 (0.0%) |
| 10 to 14 Minutes | 24 (47.1%) | 0 (0.0%) |
| 15 to 19 Minutes | 0 (0.0%) | 0 (0.0%) |
| 20 to 24 Minutes | 0 (0.0%) | 0 (0.0%) |
| 25 to 29 Minutes | 0 (0.0%) | 0 (0.0%) |
| 30 to 34 Minutes | 0 (0.0%) | 0 (0.0%) |
| 35 to 39 Minutes | 0 (0.0%) | 12 (100.0%) |
| 40 to 44 Minutes | 0 (0.0%) | 0 (0.0%) |
| 45 to 59 Minutes | 0 (0.0%) | 0 (0.0%) |
| 60 to 89 Minutes | 0 (0.0%) | 0 (0.0%) |
| 90 or more Minutes | 0 (0.0%) | 0 (0.0%) |
Time of Departure to Work by Sex in Ash Fork
The most frequent times of departure to work in Ash Fork are 7:30 AM to 7:59 AM (20, 39.2%) for males and 8:00 AM to 8:29 AM (12, 100.0%) for females.
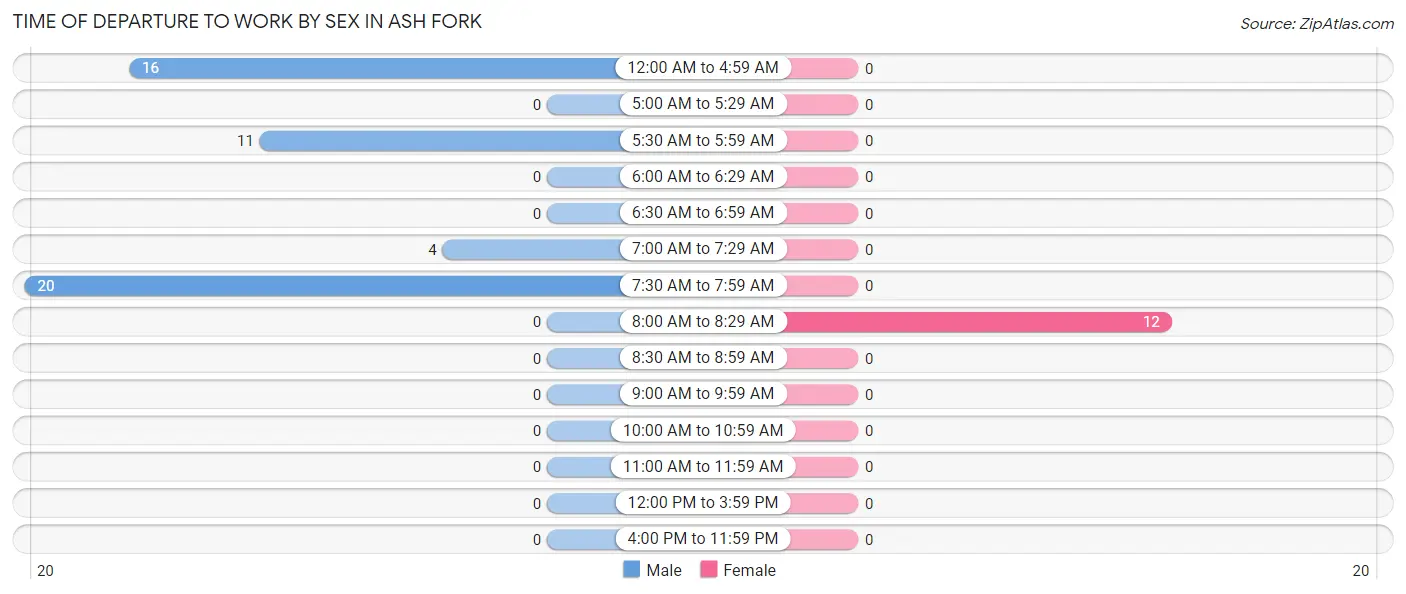
| Time of Departure | Male | Female |
| 12:00 AM to 4:59 AM | 16 (31.4%) | 0 (0.0%) |
| 5:00 AM to 5:29 AM | 0 (0.0%) | 0 (0.0%) |
| 5:30 AM to 5:59 AM | 11 (21.6%) | 0 (0.0%) |
| 6:00 AM to 6:29 AM | 0 (0.0%) | 0 (0.0%) |
| 6:30 AM to 6:59 AM | 0 (0.0%) | 0 (0.0%) |
| 7:00 AM to 7:29 AM | 4 (7.8%) | 0 (0.0%) |
| 7:30 AM to 7:59 AM | 20 (39.2%) | 0 (0.0%) |
| 8:00 AM to 8:29 AM | 0 (0.0%) | 12 (100.0%) |
| 8:30 AM to 8:59 AM | 0 (0.0%) | 0 (0.0%) |
| 9:00 AM to 9:59 AM | 0 (0.0%) | 0 (0.0%) |
| 10:00 AM to 10:59 AM | 0 (0.0%) | 0 (0.0%) |
| 11:00 AM to 11:59 AM | 0 (0.0%) | 0 (0.0%) |
| 12:00 PM to 3:59 PM | 0 (0.0%) | 0 (0.0%) |
| 4:00 PM to 11:59 PM | 0 (0.0%) | 0 (0.0%) |
| Total | 51 (100.0%) | 12 (100.0%) |
Housing Occupancy in Ash Fork
Occupancy by Ownership in Ash Fork
Of the total 171 dwellings in Ash Fork, owner-occupied units account for 115 (67.2%), while renter-occupied units make up 56 (32.8%).
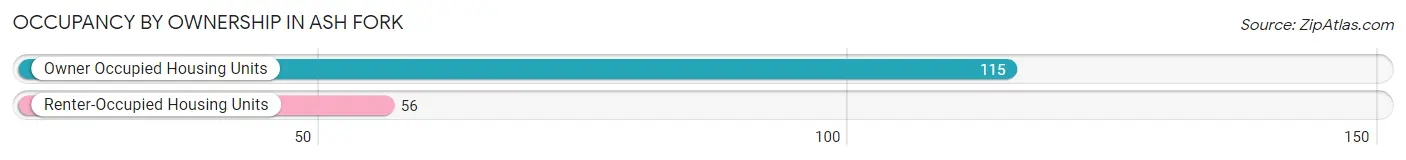
| Occupancy | # Housing Units | % Housing Units |
| Owner Occupied Housing Units | 115 | 67.2% |
| Renter-Occupied Housing Units | 56 | 32.8% |
| Total Occupied Housing Units | 171 | 100.0% |
Occupancy by Household Size in Ash Fork
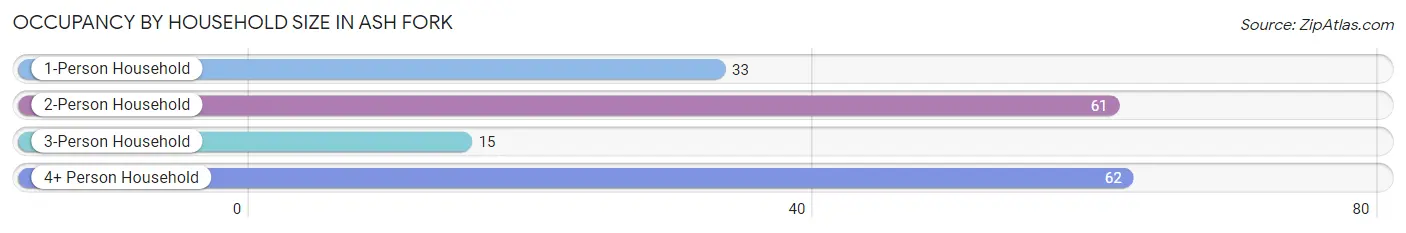
| Household Size | # Housing Units | % Housing Units |
| 1-Person Household | 33 | 19.3% |
| 2-Person Household | 61 | 35.7% |
| 3-Person Household | 15 | 8.8% |
| 4+ Person Household | 62 | 36.3% |
| Total Housing Units | 171 | 100.0% |
Occupancy by Ownership by Household Size in Ash Fork
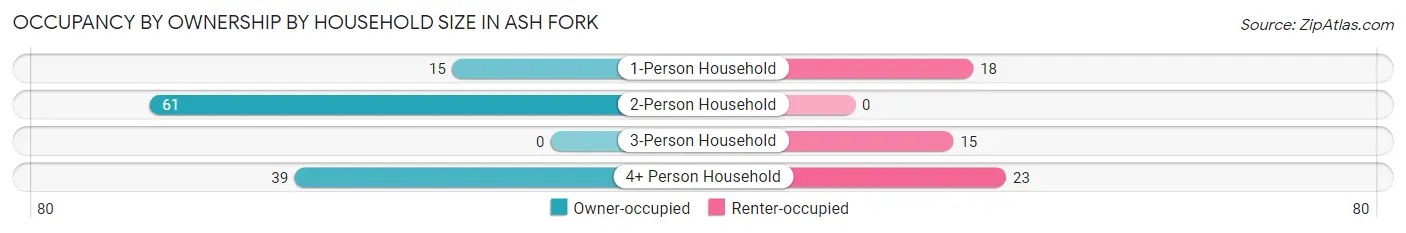
| Household Size | Owner-occupied | Renter-occupied |
| 1-Person Household | 15 (45.5%) | 18 (54.5%) |
| 2-Person Household | 61 (100.0%) | 0 (0.0%) |
| 3-Person Household | 0 (0.0%) | 15 (100.0%) |
| 4+ Person Household | 39 (62.9%) | 23 (37.1%) |
| Total Housing Units | 115 (67.2%) | 56 (32.8%) |
Occupancy by Educational Attainment in Ash Fork
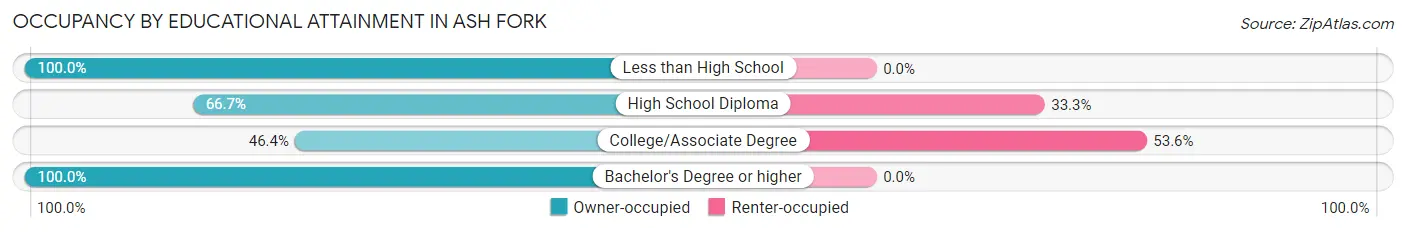
| Household Size | Owner-occupied | Renter-occupied |
| Less than High School | 40 (100.0%) | 0 (0.0%) |
| High School Diploma | 22 (66.7%) | 11 (33.3%) |
| College/Associate Degree | 39 (46.4%) | 45 (53.6%) |
| Bachelor's Degree or higher | 14 (100.0%) | 0 (0.0%) |
Occupancy by Age of Householder in Ash Fork
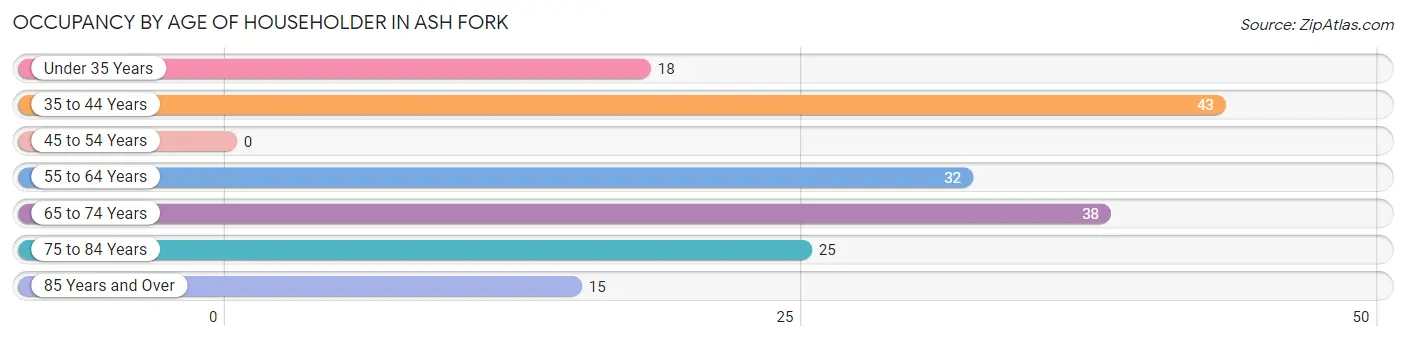
| Age Bracket | # Households | % Households |
| Under 35 Years | 18 | 10.5% |
| 35 to 44 Years | 43 | 25.2% |
| 45 to 54 Years | 0 | 0.0% |
| 55 to 64 Years | 32 | 18.7% |
| 65 to 74 Years | 38 | 22.2% |
| 75 to 84 Years | 25 | 14.6% |
| 85 Years and Over | 15 | 8.8% |
| Total | 171 | 100.0% |
Housing Finances in Ash Fork
Median Income by Occupancy in Ash Fork
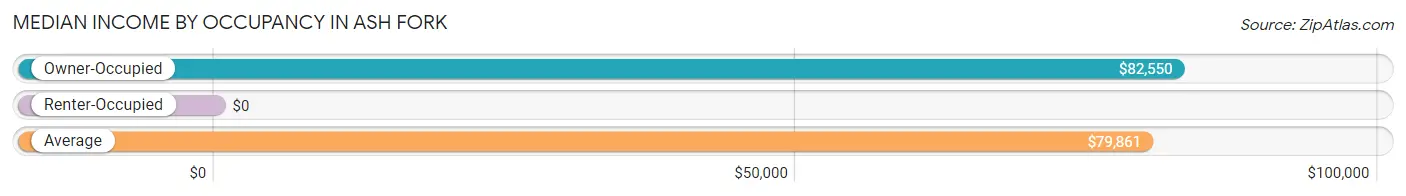
| Occupancy Type | # Households | Median Income |
| Owner-Occupied | 115 (67.2%) | $82,550 |
| Renter-Occupied | 56 (32.8%) | $0 |
| Average | 171 (100.0%) | $79,861 |
Occupancy by Householder Income Bracket in Ash Fork
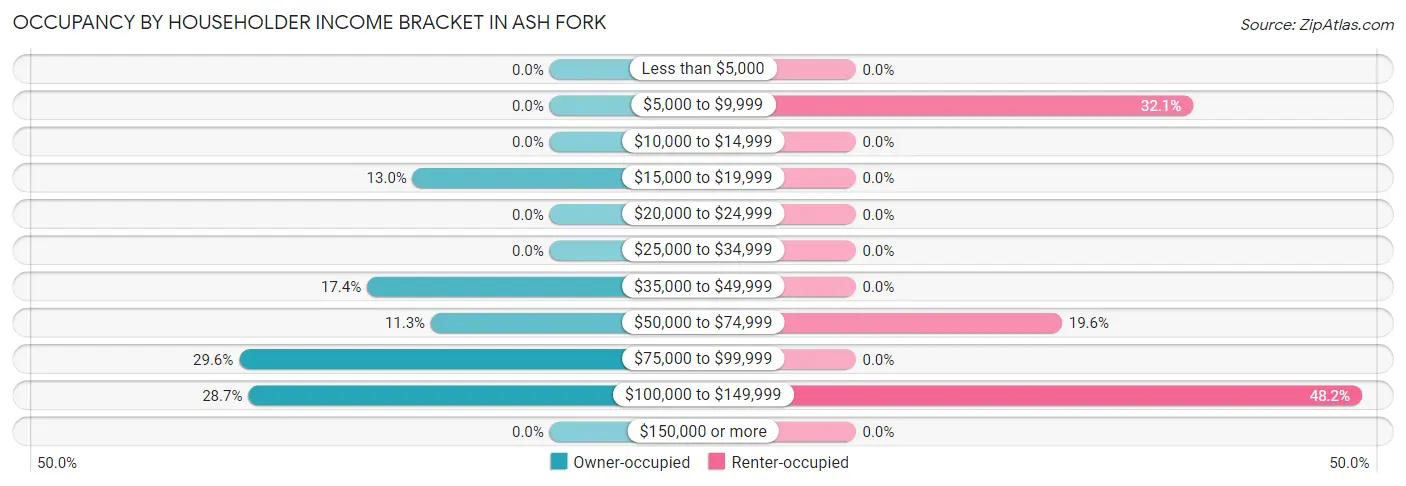
| Income Bracket | Owner-occupied | Renter-occupied |
| Less than $5,000 | 0 (0.0%) | 0 (0.0%) |
| $5,000 to $9,999 | 0 (0.0%) | 18 (32.1%) |
| $10,000 to $14,999 | 0 (0.0%) | 0 (0.0%) |
| $15,000 to $19,999 | 15 (13.0%) | 0 (0.0%) |
| $20,000 to $24,999 | 0 (0.0%) | 0 (0.0%) |
| $25,000 to $34,999 | 0 (0.0%) | 0 (0.0%) |
| $35,000 to $49,999 | 20 (17.4%) | 0 (0.0%) |
| $50,000 to $74,999 | 13 (11.3%) | 11 (19.6%) |
| $75,000 to $99,999 | 34 (29.6%) | 0 (0.0%) |
| $100,000 to $149,999 | 33 (28.7%) | 27 (48.2%) |
| $150,000 or more | 0 (0.0%) | 0 (0.0%) |
| Total | 115 (100.0%) | 56 (100.0%) |
Monthly Housing Cost Tiers in Ash Fork
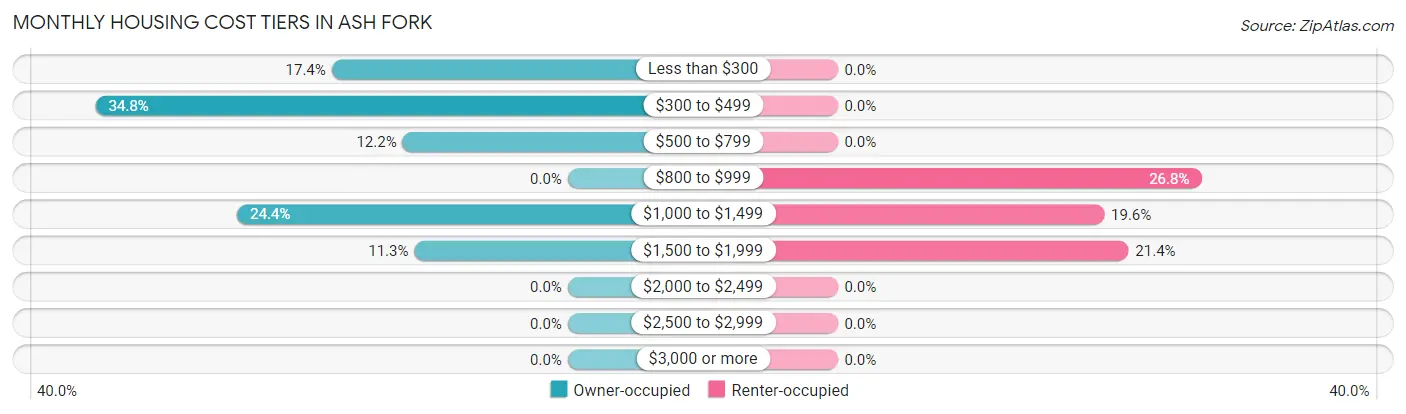
| Monthly Cost | Owner-occupied | Renter-occupied |
| Less than $300 | 20 (17.4%) | 0 (0.0%) |
| $300 to $499 | 40 (34.8%) | 0 (0.0%) |
| $500 to $799 | 14 (12.2%) | 0 (0.0%) |
| $800 to $999 | 0 (0.0%) | 15 (26.8%) |
| $1,000 to $1,499 | 28 (24.3%) | 11 (19.6%) |
| $1,500 to $1,999 | 13 (11.3%) | 12 (21.4%) |
| $2,000 to $2,499 | 0 (0.0%) | 0 (0.0%) |
| $2,500 to $2,999 | 0 (0.0%) | 0 (0.0%) |
| $3,000 or more | 0 (0.0%) | 0 (0.0%) |
| Total | 115 (100.0%) | 56 (100.0%) |
Physical Housing Characteristics in Ash Fork
Housing Structures in Ash Fork
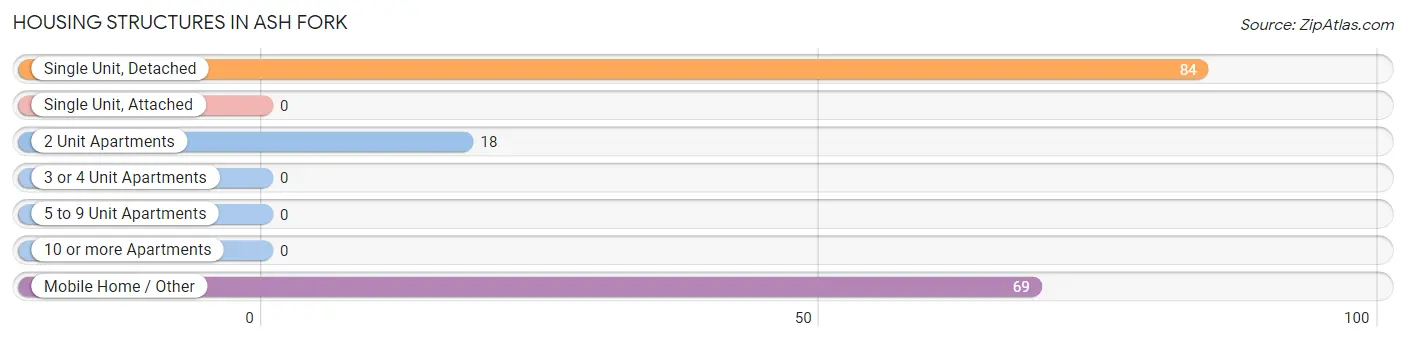
| Structure Type | # Housing Units | % Housing Units |
| Single Unit, Detached | 84 | 49.1% |
| Single Unit, Attached | 0 | 0.0% |
| 2 Unit Apartments | 18 | 10.5% |
| 3 or 4 Unit Apartments | 0 | 0.0% |
| 5 to 9 Unit Apartments | 0 | 0.0% |
| 10 or more Apartments | 0 | 0.0% |
| Mobile Home / Other | 69 | 40.4% |
| Total | 171 | 100.0% |
Housing Structures by Occupancy in Ash Fork
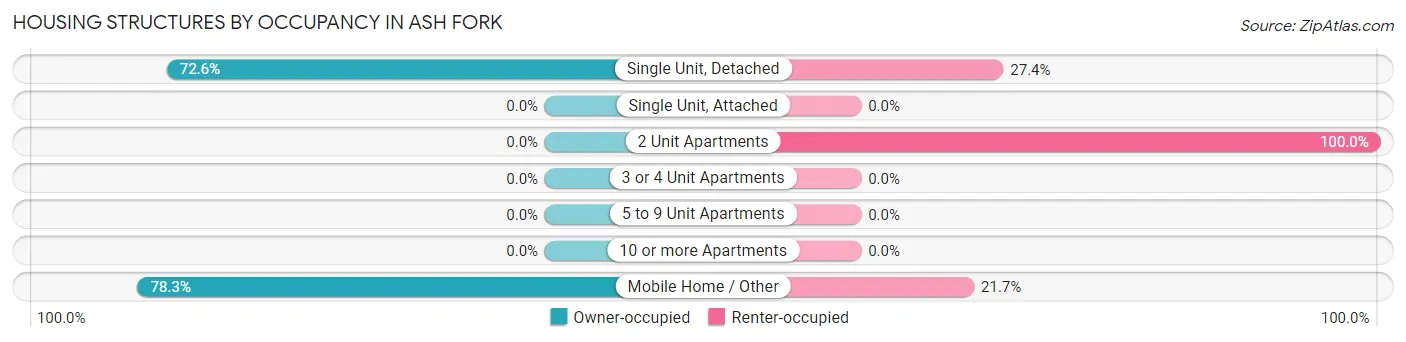
| Structure Type | Owner-occupied | Renter-occupied |
| Single Unit, Detached | 61 (72.6%) | 23 (27.4%) |
| Single Unit, Attached | 0 (0.0%) | 0 (0.0%) |
| 2 Unit Apartments | 0 (0.0%) | 18 (100.0%) |
| 3 or 4 Unit Apartments | 0 (0.0%) | 0 (0.0%) |
| 5 to 9 Unit Apartments | 0 (0.0%) | 0 (0.0%) |
| 10 or more Apartments | 0 (0.0%) | 0 (0.0%) |
| Mobile Home / Other | 54 (78.3%) | 15 (21.7%) |
| Total | 115 (67.2%) | 56 (32.8%) |
Housing Structures by Number of Rooms in Ash Fork
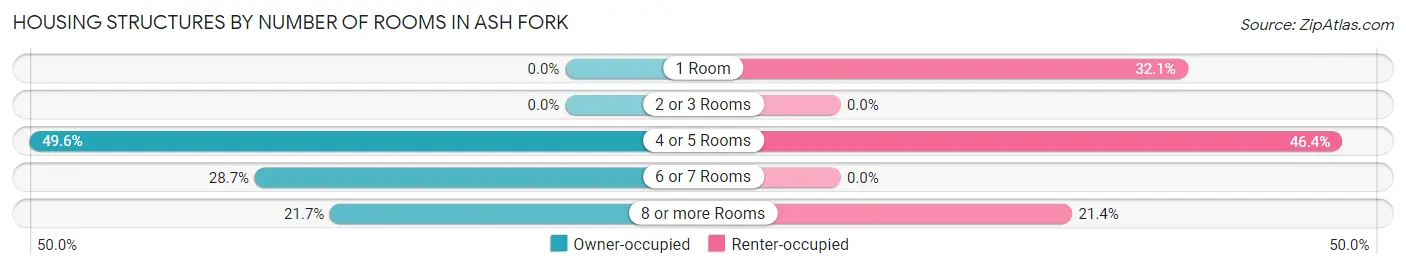
| Number of Rooms | Owner-occupied | Renter-occupied |
| 1 Room | 0 (0.0%) | 18 (32.1%) |
| 2 or 3 Rooms | 0 (0.0%) | 0 (0.0%) |
| 4 or 5 Rooms | 57 (49.6%) | 26 (46.4%) |
| 6 or 7 Rooms | 33 (28.7%) | 0 (0.0%) |
| 8 or more Rooms | 25 (21.7%) | 12 (21.4%) |
| Total | 115 (100.0%) | 56 (100.0%) |
Housing Structure by Heating Type in Ash Fork
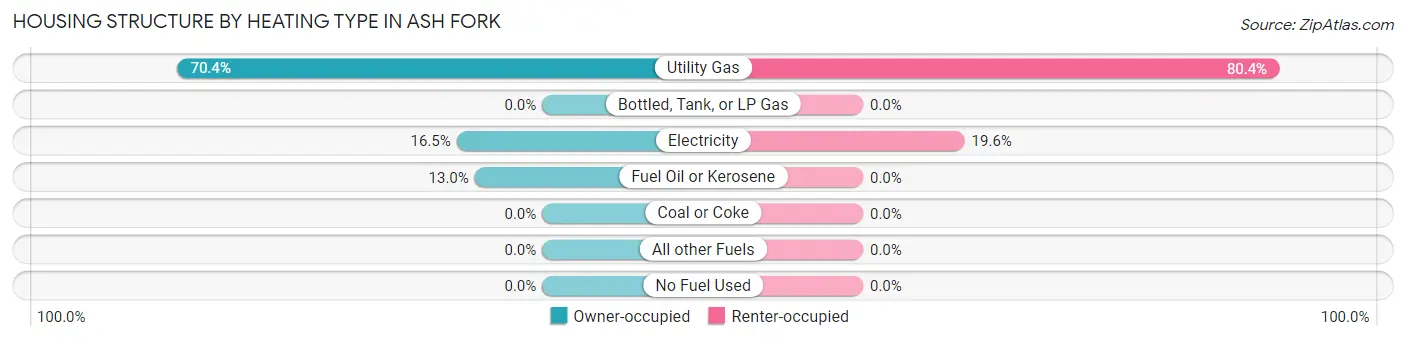
| Heating Type | Owner-occupied | Renter-occupied |
| Utility Gas | 81 (70.4%) | 45 (80.4%) |
| Bottled, Tank, or LP Gas | 0 (0.0%) | 0 (0.0%) |
| Electricity | 19 (16.5%) | 11 (19.6%) |
| Fuel Oil or Kerosene | 15 (13.0%) | 0 (0.0%) |
| Coal or Coke | 0 (0.0%) | 0 (0.0%) |
| All other Fuels | 0 (0.0%) | 0 (0.0%) |
| No Fuel Used | 0 (0.0%) | 0 (0.0%) |
| Total | 115 (100.0%) | 56 (100.0%) |
Household Vehicle Usage in Ash Fork

| Vehicles per Household | Owner-occupied | Renter-occupied |
| No Vehicle | 0 (0.0%) | 0 (0.0%) |
| 1 Vehicle | 15 (13.0%) | 18 (32.1%) |
| 2 Vehicles | 28 (24.3%) | 11 (19.6%) |
| 3 or more Vehicles | 72 (62.6%) | 27 (48.2%) |
| Total | 115 (100.0%) | 56 (100.0%) |
Real Estate & Mortgages in Ash Fork
Real Estate and Mortgage Overview in Ash Fork
| Characteristic | Without Mortgage | With Mortgage |
| Housing Units | 60 | 55 |
| Median Property Value | $97,500 | $192,800 |
| Median Household Income | - | - |
| Monthly Housing Costs | $425 | $0 |
| Real Estate Taxes | - | - |
Property Value by Mortgage Status in Ash Fork
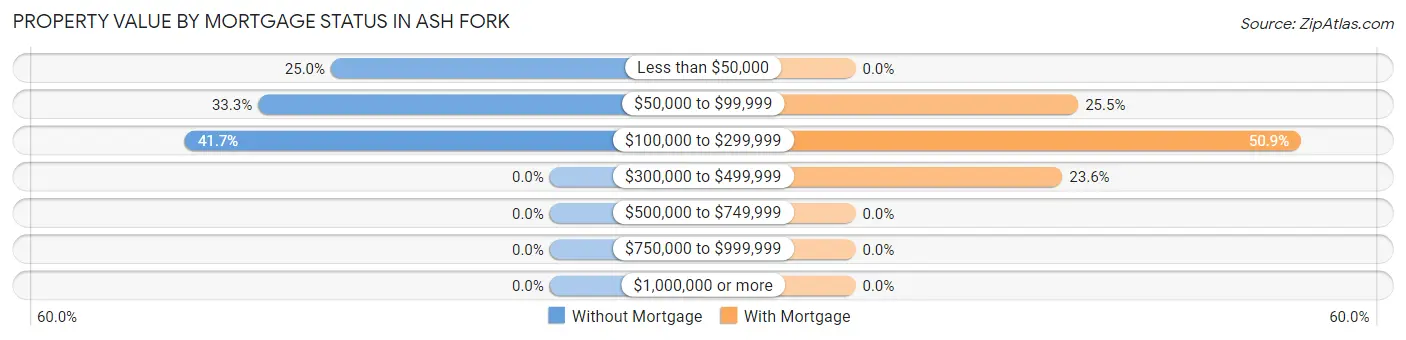
| Property Value | Without Mortgage | With Mortgage |
| Less than $50,000 | 15 (25.0%) | 0 (0.0%) |
| $50,000 to $99,999 | 20 (33.3%) | 14 (25.5%) |
| $100,000 to $299,999 | 25 (41.7%) | 28 (50.9%) |
| $300,000 to $499,999 | 0 (0.0%) | 13 (23.6%) |
| $500,000 to $749,999 | 0 (0.0%) | 0 (0.0%) |
| $750,000 to $999,999 | 0 (0.0%) | 0 (0.0%) |
| $1,000,000 or more | 0 (0.0%) | 0 (0.0%) |
| Total | 60 (100.0%) | 55 (100.0%) |
Household Income by Mortgage Status in Ash Fork
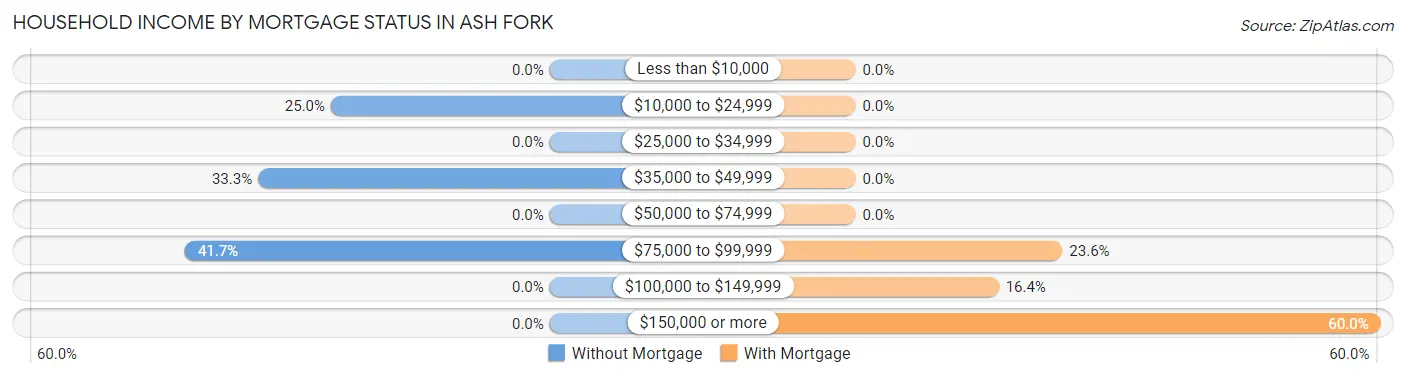
| Household Income | Without Mortgage | With Mortgage |
| Less than $10,000 | 0 (0.0%) | 0 (0.0%) |
| $10,000 to $24,999 | 15 (25.0%) | 0 (0.0%) |
| $25,000 to $34,999 | 0 (0.0%) | 0 (0.0%) |
| $35,000 to $49,999 | 20 (33.3%) | 0 (0.0%) |
| $50,000 to $74,999 | 0 (0.0%) | 0 (0.0%) |
| $75,000 to $99,999 | 25 (41.7%) | 13 (23.6%) |
| $100,000 to $149,999 | 0 (0.0%) | 9 (16.4%) |
| $150,000 or more | 0 (0.0%) | 33 (60.0%) |
| Total | 60 (100.0%) | 55 (100.0%) |
Property Value to Household Income Ratio in Ash Fork
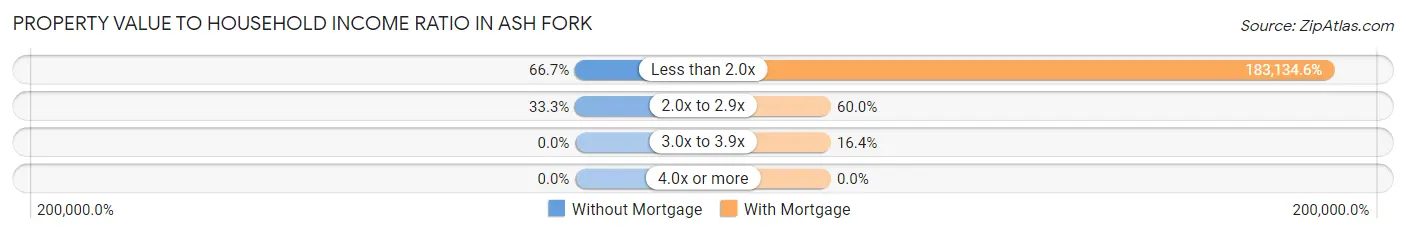
| Value-to-Income Ratio | Without Mortgage | With Mortgage |
| Less than 2.0x | 40 (66.7%) | 100,724 (183,134.5%) |
| 2.0x to 2.9x | 20 (33.3%) | 33 (60.0%) |
| 3.0x to 3.9x | 0 (0.0%) | 9 (16.4%) |
| 4.0x or more | 0 (0.0%) | 0 (0.0%) |
| Total | 60 (100.0%) | 55 (100.0%) |
Real Estate Taxes by Mortgage Status in Ash Fork
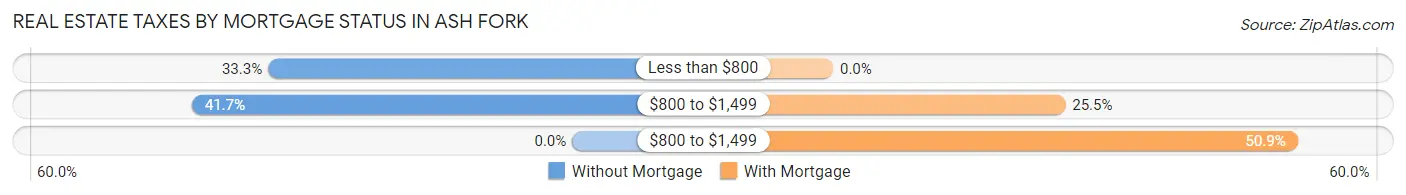
| Property Taxes | Without Mortgage | With Mortgage |
| Less than $800 | 20 (33.3%) | 0 (0.0%) |
| $800 to $1,499 | 25 (41.7%) | 14 (25.5%) |
| $800 to $1,499 | 0 (0.0%) | 28 (50.9%) |
| Total | 60 (100.0%) | 55 (100.0%) |
Health & Disability in Ash Fork
Health Insurance Coverage by Age in Ash Fork
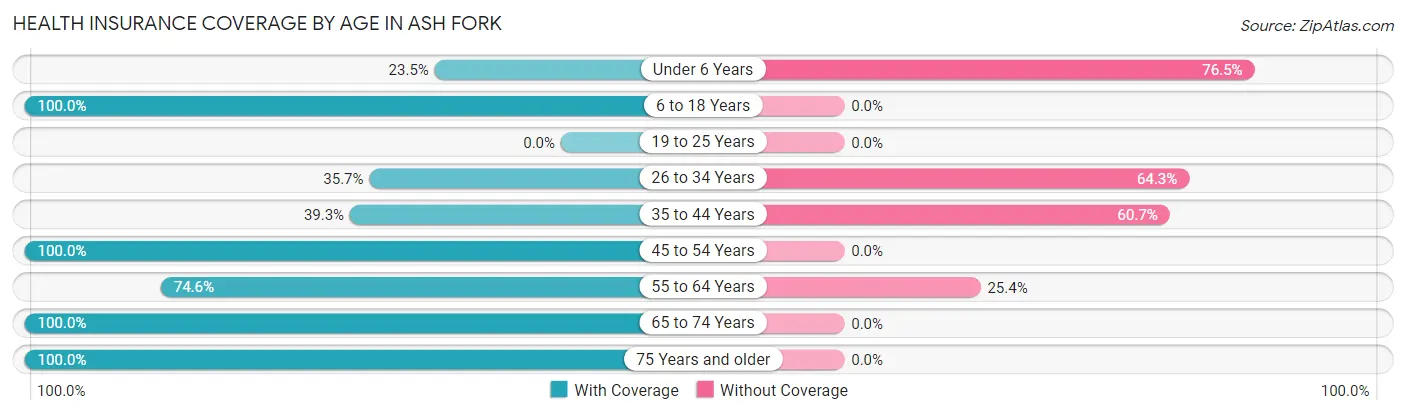
| Age Bracket | With Coverage | Without Coverage |
| Under 6 Years | 12 (23.5%) | 39 (76.5%) |
| 6 to 18 Years | 102 (100.0%) | 0 (0.0%) |
| 19 to 25 Years | 0 (0.0%) | 0 (0.0%) |
| 26 to 34 Years | 10 (35.7%) | 18 (64.3%) |
| 35 to 44 Years | 35 (39.3%) | 54 (60.7%) |
| 45 to 54 Years | 27 (100.0%) | 0 (0.0%) |
| 55 to 64 Years | 47 (74.6%) | 16 (25.4%) |
| 65 to 74 Years | 38 (100.0%) | 0 (0.0%) |
| 75 Years and older | 68 (100.0%) | 0 (0.0%) |
| Total | 339 (72.8%) | 127 (27.3%) |
Health Insurance Coverage by Citizenship Status in Ash Fork
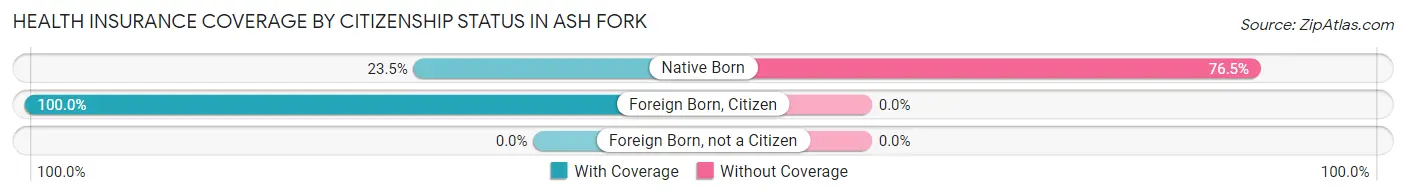
| Citizenship Status | With Coverage | Without Coverage |
| Native Born | 12 (23.5%) | 39 (76.5%) |
| Foreign Born, Citizen | 102 (100.0%) | 0 (0.0%) |
| Foreign Born, not a Citizen | 0 (0.0%) | 0 (0.0%) |
Health Insurance Coverage by Household Income in Ash Fork
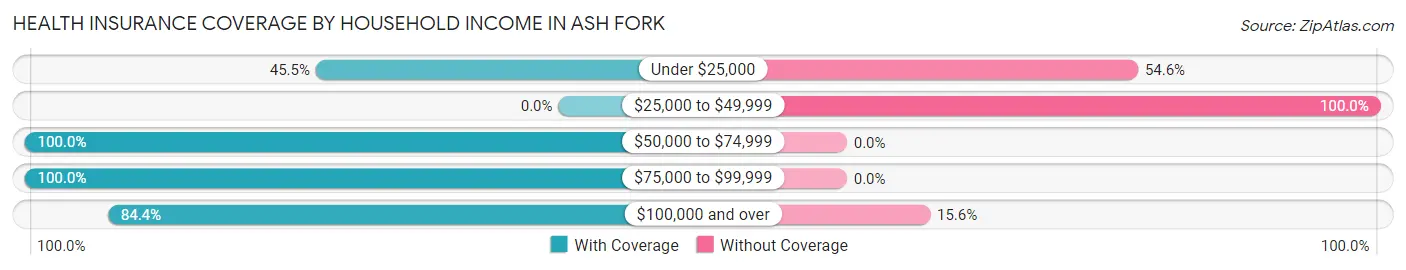
| Household Income | With Coverage | Without Coverage |
| Under $25,000 | 15 (45.5%) | 18 (54.5%) |
| $25,000 to $49,999 | 0 (0.0%) | 75 (100.0%) |
| $50,000 to $74,999 | 78 (100.0%) | 0 (0.0%) |
| $75,000 to $99,999 | 62 (100.0%) | 0 (0.0%) |
| $100,000 and over | 184 (84.4%) | 34 (15.6%) |
Public vs Private Health Insurance Coverage by Age in Ash Fork
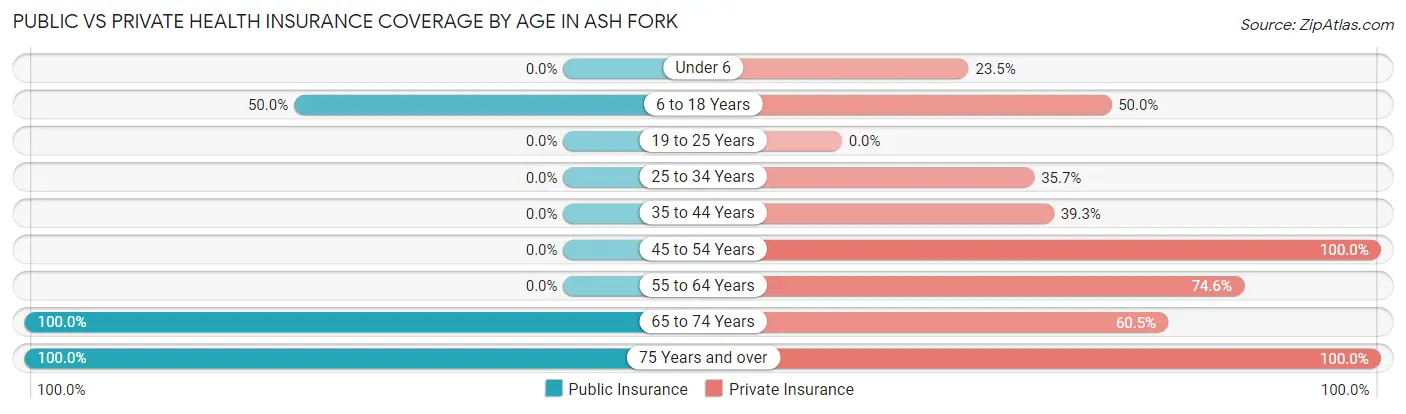
| Age Bracket | Public Insurance | Private Insurance |
| Under 6 | 0 (0.0%) | 12 (23.5%) |
| 6 to 18 Years | 51 (50.0%) | 51 (50.0%) |
| 19 to 25 Years | 0 (0.0%) | 0 (0.0%) |
| 25 to 34 Years | 0 (0.0%) | 10 (35.7%) |
| 35 to 44 Years | 0 (0.0%) | 35 (39.3%) |
| 45 to 54 Years | 0 (0.0%) | 27 (100.0%) |
| 55 to 64 Years | 0 (0.0%) | 47 (74.6%) |
| 65 to 74 Years | 38 (100.0%) | 23 (60.5%) |
| 75 Years and over | 68 (100.0%) | 68 (100.0%) |
| Total | 157 (33.7%) | 273 (58.6%) |
Disability Status by Sex by Age in Ash Fork
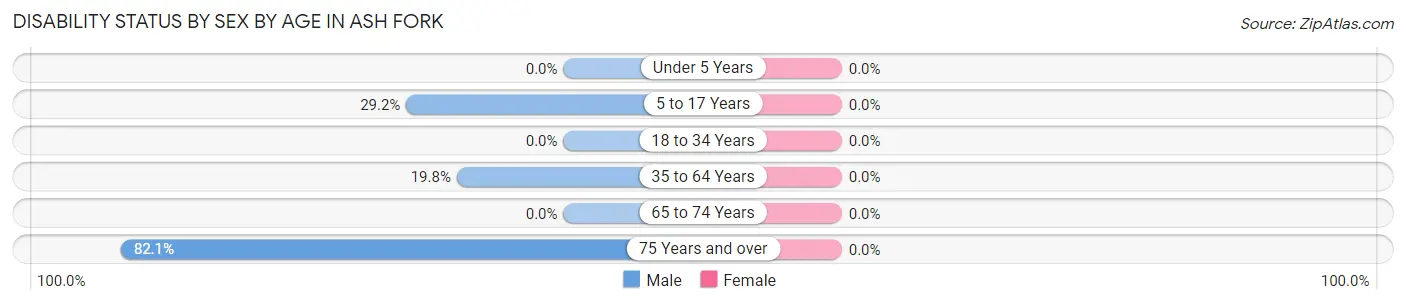
| Age Bracket | Male | Female |
| Under 5 Years | 0 (0.0%) | 0 (0.0%) |
| 5 to 17 Years | 21 (29.2%) | 0 (0.0%) |
| 18 to 34 Years | 0 (0.0%) | 0 (0.0%) |
| 35 to 64 Years | 19 (19.8%) | 0 (0.0%) |
| 65 to 74 Years | 0 (0.0%) | 0 (0.0%) |
| 75 Years and over | 23 (82.1%) | 0 (0.0%) |
Disability Class by Sex by Age in Ash Fork
Disability Class: Hearing Difficulty
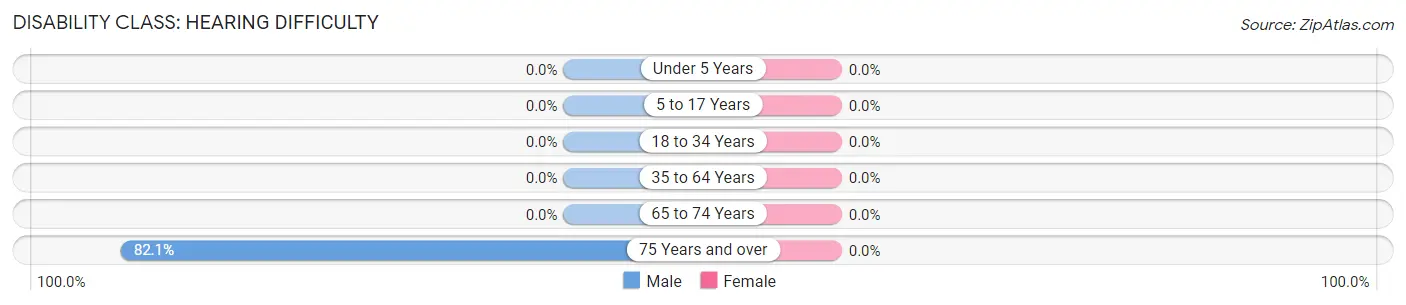
| Age Bracket | Male | Female |
| Under 5 Years | 0 (0.0%) | 0 (0.0%) |
| 5 to 17 Years | 0 (0.0%) | 0 (0.0%) |
| 18 to 34 Years | 0 (0.0%) | 0 (0.0%) |
| 35 to 64 Years | 0 (0.0%) | 0 (0.0%) |
| 65 to 74 Years | 0 (0.0%) | 0 (0.0%) |
| 75 Years and over | 23 (82.1%) | 0 (0.0%) |
Disability Class: Vision Difficulty
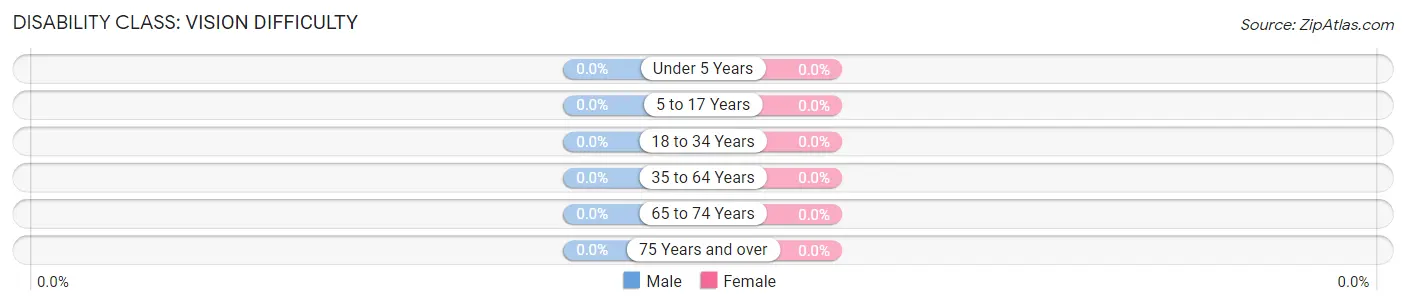
| Age Bracket | Male | Female |
| Under 5 Years | 0 (0.0%) | 0 (0.0%) |
| 5 to 17 Years | 0 (0.0%) | 0 (0.0%) |
| 18 to 34 Years | 0 (0.0%) | 0 (0.0%) |
| 35 to 64 Years | 0 (0.0%) | 0 (0.0%) |
| 65 to 74 Years | 0 (0.0%) | 0 (0.0%) |
| 75 Years and over | 0 (0.0%) | 0 (0.0%) |
Disability Class: Cognitive Difficulty

| Age Bracket | Male | Female |
| 5 to 17 Years | 21 (29.2%) | 0 (0.0%) |
| 18 to 34 Years | 0 (0.0%) | 0 (0.0%) |
| 35 to 64 Years | 0 (0.0%) | 0 (0.0%) |
| 65 to 74 Years | 0 (0.0%) | 0 (0.0%) |
| 75 Years and over | 0 (0.0%) | 0 (0.0%) |
Disability Class: Ambulatory Difficulty
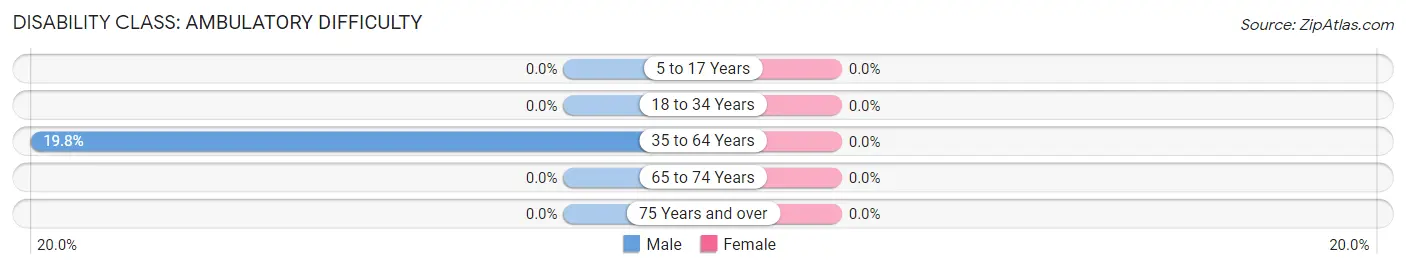
| Age Bracket | Male | Female |
| 5 to 17 Years | 0 (0.0%) | 0 (0.0%) |
| 18 to 34 Years | 0 (0.0%) | 0 (0.0%) |
| 35 to 64 Years | 19 (19.8%) | 0 (0.0%) |
| 65 to 74 Years | 0 (0.0%) | 0 (0.0%) |
| 75 Years and over | 0 (0.0%) | 0 (0.0%) |
Disability Class: Self-Care Difficulty
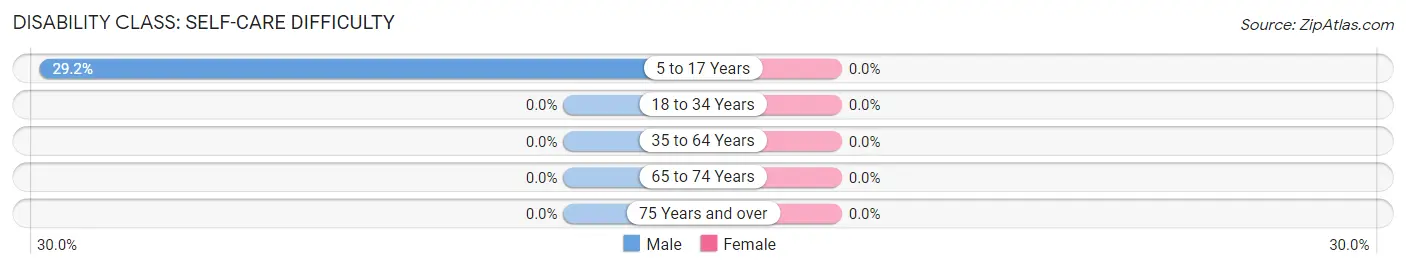
| Age Bracket | Male | Female |
| 5 to 17 Years | 21 (29.2%) | 0 (0.0%) |
| 18 to 34 Years | 0 (0.0%) | 0 (0.0%) |
| 35 to 64 Years | 0 (0.0%) | 0 (0.0%) |
| 65 to 74 Years | 0 (0.0%) | 0 (0.0%) |
| 75 Years and over | 0 (0.0%) | 0 (0.0%) |
Technology Access in Ash Fork
Computing Device Access in Ash Fork
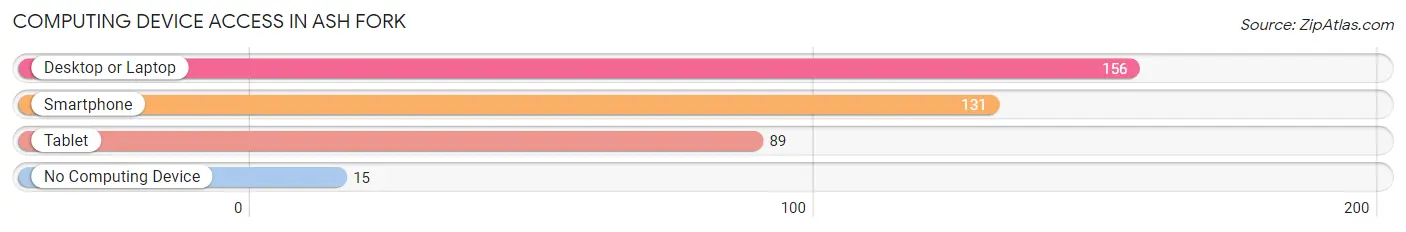
| Device Type | # Households | % Households |
| Desktop or Laptop | 156 | 91.2% |
| Smartphone | 131 | 76.6% |
| Tablet | 89 | 52.0% |
| No Computing Device | 15 | 8.8% |
| Total | 171 | 100.0% |
Internet Access in Ash Fork
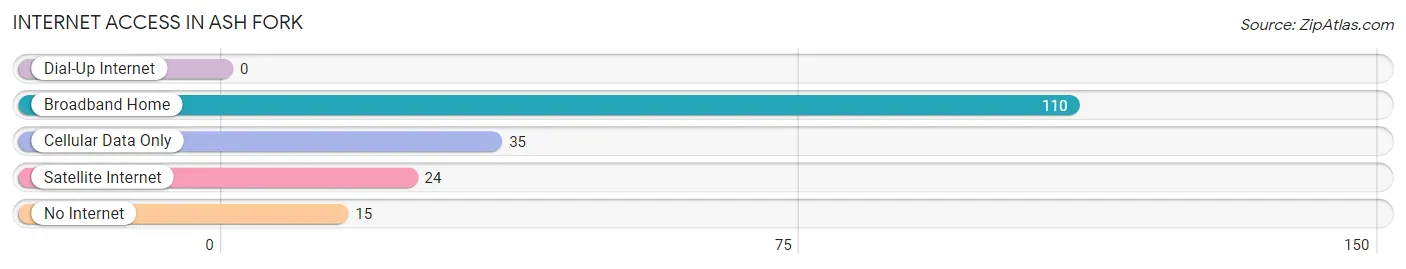
| Internet Type | # Households | % Households |
| Dial-Up Internet | 0 | 0.0% |
| Broadband Home | 110 | 64.3% |
| Cellular Data Only | 35 | 20.5% |
| Satellite Internet | 24 | 14.0% |
| No Internet | 15 | 8.8% |
| Total | 171 | 100.0% |
Ash Fork Summary
History
Ash Fork is a small unincorporated community located in Yavapai County, Arizona. It is situated along Interstate 40, approximately halfway between Flagstaff and Seligman. The town was founded in 1882 as a railroad siding for the Atlantic and Pacific Railroad. The town was named after a nearby stand of ash trees.
The town was initially a supply center for the railroad, but it soon became a popular stop for travelers. In the early 1900s, the town was home to a number of businesses, including a hotel, saloon, general store, and livery stable. The town also had a post office, which opened in 1883.
In the 1920s, the town began to experience a decline in population as the railroad industry began to decline. However, the town was revitalized in the 1940s when the U.S. government began construction of the Seligman-Ash Fork Highway, which connected the town to Flagstaff and other nearby towns.
The town continued to grow in the 1950s and 1960s, and by the 1970s, it had become a popular tourist destination. The town was home to a number of tourist attractions, including the Ash Fork Trading Post, which was a popular stop for travelers.
In the 1980s, the town began to experience a decline in population as the railroad industry continued to decline. However, the town was revitalized in the 1990s when the U.S. government began construction of the Grand Canyon Railway, which connected the town to Williams and other nearby towns.
Geography
Ash Fork is located in Yavapai County, Arizona, approximately halfway between Flagstaff and Seligman. The town is situated along Interstate 40, and is surrounded by the Coconino National Forest. The town is located at an elevation of 5,000 feet, and has a semi-arid climate with hot summers and cold winters.
The town is located in the Verde Valley, which is a region of Arizona known for its scenic beauty. The area is home to a number of natural attractions, including the Grand Canyon, the San Francisco Peaks, and the Red Rock Country.
Economy
The economy of Ash Fork is largely based on tourism. The town is home to a number of tourist attractions, including the Ash Fork Trading Post, which is a popular stop for travelers. The town is also home to a number of restaurants, hotels, and other businesses that cater to tourists.
The town is also home to a number of manufacturing and industrial businesses. The town is home to a number of companies that produce a variety of products, including furniture, clothing, and electronics.
Demographics
As of the 2010 census, the population of Ash Fork was 1,077. The town has a population that is predominantly white (94.3%), with a small percentage of Hispanic (2.7%) and Native American (1.7%) residents. The median household income in the town is $35,000, and the median age is 44.
Conclusion
Ash Fork is a small unincorporated community located in Yavapai County, Arizona. It is situated along Interstate 40, approximately halfway between Flagstaff and Seligman. The town was founded in 1882 as a railroad siding for the Atlantic and Pacific Railroad. The town has experienced a number of ups and downs over the years, but it has remained a popular tourist destination due to its proximity to the Grand Canyon and other natural attractions. The town has a population that is predominantly white, with a median household income of $35,000 and a median age of 44. The economy of the town is largely based on tourism, and it is home to a number of businesses that cater to tourists.
Common Questions
What is Per Capita Income in Ash Fork?
Per Capita income in Ash Fork is $26,200.
What is the Median Family Income in Ash Fork?
Median Family Income in Ash Fork is $83,400.
What is the Median Household income in Ash Fork?
Median Household Income in Ash Fork is $79,861.
What is Inequality or Gini Index in Ash Fork?
Inequality or Gini Index in Ash Fork is 0.31.
What is the Total Population of Ash Fork?
Total Population of Ash Fork is 466.
What is the Total Male Population of Ash Fork?
Total Male Population of Ash Fork is 249.
What is the Total Female Population of Ash Fork?
Total Female Population of Ash Fork is 217.
What is the Ratio of Males per 100 Females in Ash Fork?
There are 114.75 Males per 100 Females in Ash Fork.
What is the Ratio of Females per 100 Males in Ash Fork?
There are 87.15 Females per 100 Males in Ash Fork.
What is the Median Population Age in Ash Fork?
Median Population Age in Ash Fork is 38.6 Years.
What is the Average Family Size in Ash Fork
Average Family Size in Ash Fork is 2.8 People.
What is the Average Household Size in Ash Fork
Average Household Size in Ash Fork is 2.7 People.
How Large is the Labor Force in Ash Fork?
There are 136 People in the Labor Forcein in Ash Fork.
What is the Percentage of People in the Labor Force in Ash Fork?
40.2% of People are in the Labor Force in Ash Fork.
What is the Unemployment Rate in Ash Fork?
Unemployment Rate in Ash Fork is 26.5%.