Litchfield Park, AZ Map & Demographics
Litchfield Park Map
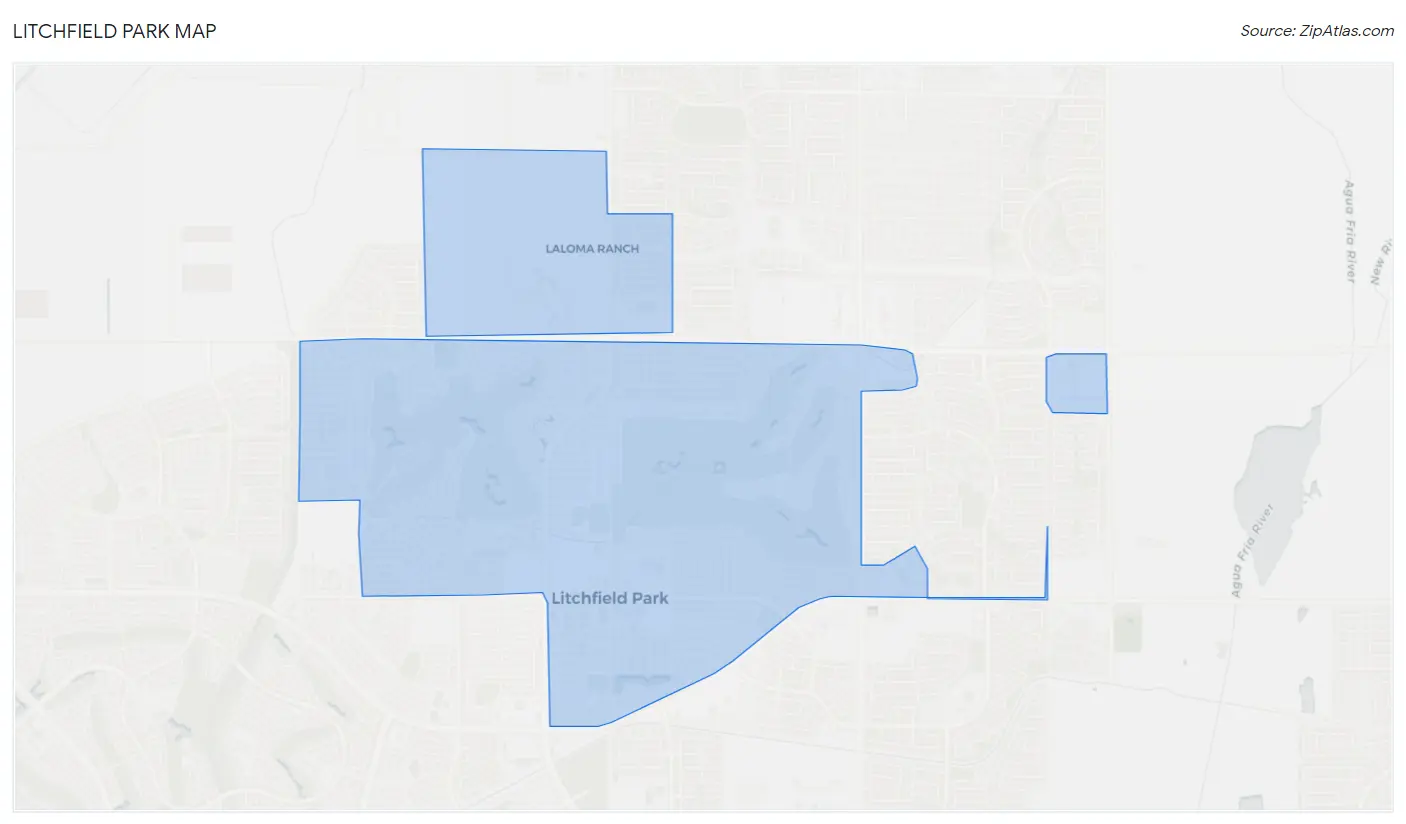
Litchfield Park Overview
$53,025
PER CAPITA INCOME
$123,358
AVG FAMILY INCOME
$117,601
AVG HOUSEHOLD INCOME
34.7%
WAGE / INCOME GAP [ % ]
65.3¢/ $1
WAGE / INCOME GAP [ $ ]
0.40
INEQUALITY / GINI INDEX
6,794
TOTAL POPULATION
3,370
MALE POPULATION
3,424
FEMALE POPULATION
98.42
MALES / 100 FEMALES
101.60
FEMALES / 100 MALES
47.7
MEDIAN AGE
2.9
AVG FAMILY SIZE
2.4
AVG HOUSEHOLD SIZE
3,446
LABOR FORCE [ PEOPLE ]
60.3%
PERCENT IN LABOR FORCE
2.1%
UNEMPLOYMENT RATE
Litchfield Park Zip Codes
Litchfield Park Area Codes
Income in Litchfield Park
Income Overview in Litchfield Park
Per Capita Income in Litchfield Park is $53,025, while median incomes of families and households are $123,358 and $117,601 respectively.
| Characteristic | Number | Measure |
| Per Capita Income | 6,794 | $53,025 |
| Median Family Income | 1,948 | $123,358 |
| Mean Family Income | 1,948 | $140,248 |
| Median Household Income | 2,780 | $117,601 |
| Mean Household Income | 2,780 | $129,281 |
| Income Deficit | 1,948 | $0 |
| Wage / Income Gap (%) | 6,794 | 34.71% |
| Wage / Income Gap ($) | 6,794 | 65.29¢ per $1 |
| Gini / Inequality Index | 6,794 | 0.40 |
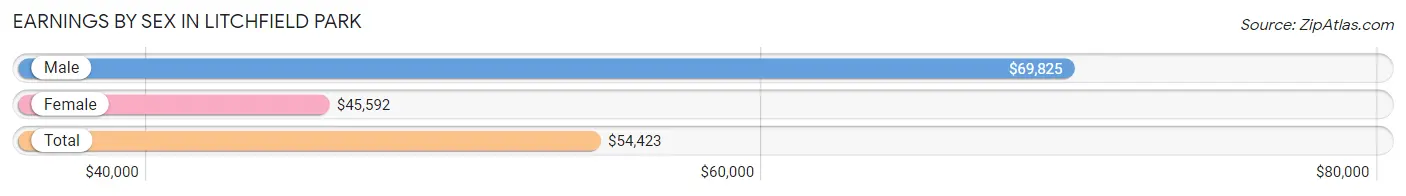
Earnings by Sex in Litchfield Park
Average Earnings in Litchfield Park are $54,423, $69,825 for men and $45,592 for women, a difference of 34.7%.
| Sex | Number | Average Earnings |
| Male | 1,974 (53.5%) | $69,825 |
| Female | 1,716 (46.5%) | $45,592 |
| Total | 3,690 (100.0%) | $54,423 |
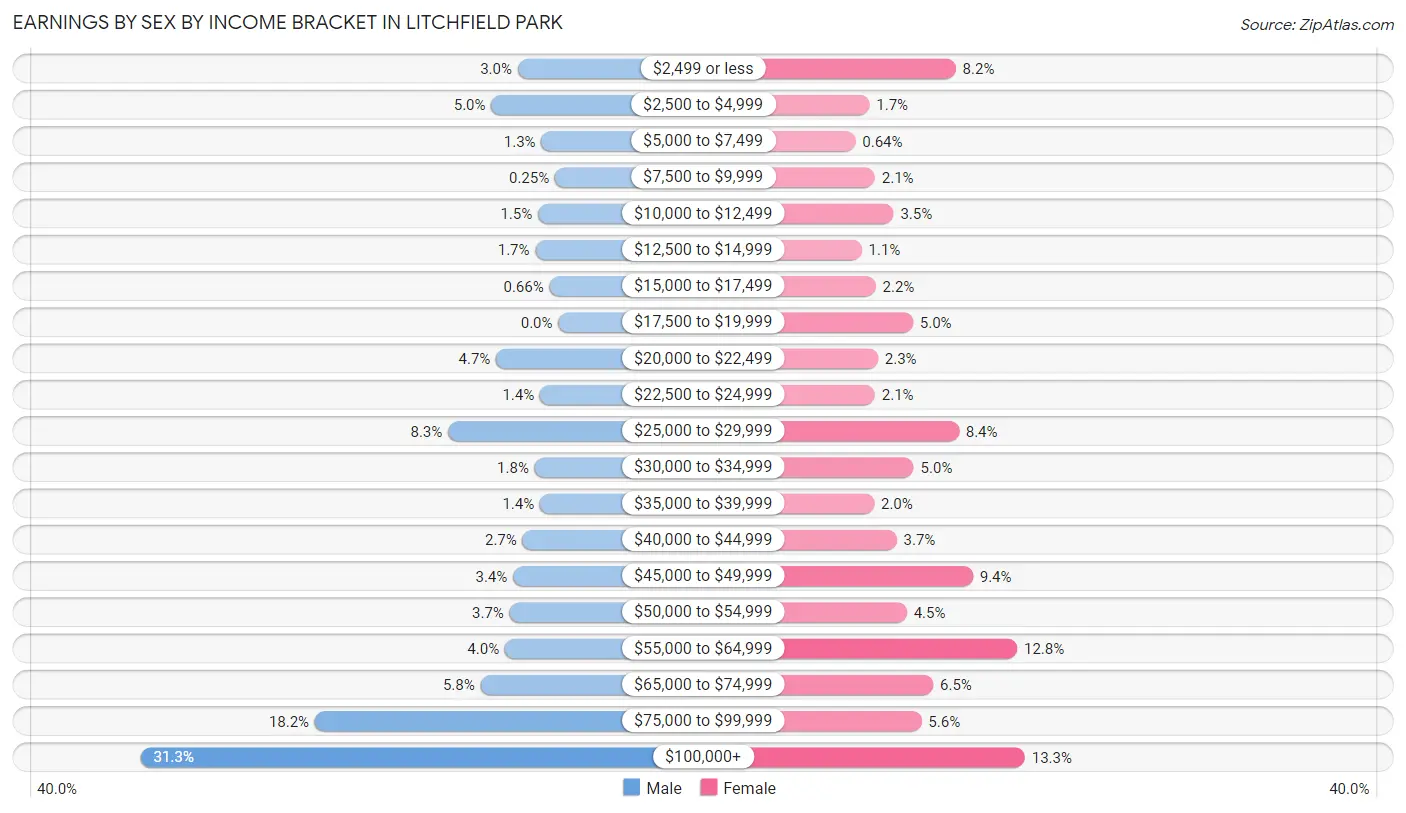
Earnings by Sex by Income Bracket in Litchfield Park
The most common earnings brackets in Litchfield Park are $100,000+ for men (618 | 31.3%) and $100,000+ for women (229 | 13.3%).
| Income | Male | Female |
| $2,499 or less | 60 (3.0%) | 140 (8.2%) |
| $2,500 to $4,999 | 99 (5.0%) | 29 (1.7%) |
| $5,000 to $7,499 | 25 (1.3%) | 11 (0.6%) |
| $7,500 to $9,999 | 5 (0.3%) | 36 (2.1%) |
| $10,000 to $12,499 | 30 (1.5%) | 60 (3.5%) |
| $12,500 to $14,999 | 34 (1.7%) | 19 (1.1%) |
| $15,000 to $17,499 | 13 (0.7%) | 37 (2.2%) |
| $17,500 to $19,999 | 0 (0.0%) | 85 (5.0%) |
| $20,000 to $22,499 | 92 (4.7%) | 40 (2.3%) |
| $22,500 to $24,999 | 27 (1.4%) | 36 (2.1%) |
| $25,000 to $29,999 | 163 (8.3%) | 144 (8.4%) |
| $30,000 to $34,999 | 35 (1.8%) | 86 (5.0%) |
| $35,000 to $39,999 | 27 (1.4%) | 35 (2.0%) |
| $40,000 to $44,999 | 53 (2.7%) | 64 (3.7%) |
| $45,000 to $49,999 | 67 (3.4%) | 162 (9.4%) |
| $50,000 to $54,999 | 72 (3.6%) | 77 (4.5%) |
| $55,000 to $64,999 | 79 (4.0%) | 219 (12.8%) |
| $65,000 to $74,999 | 115 (5.8%) | 111 (6.5%) |
| $75,000 to $99,999 | 360 (18.2%) | 96 (5.6%) |
| $100,000+ | 618 (31.3%) | 229 (13.3%) |
| Total | 1,974 (100.0%) | 1,716 (100.0%) |
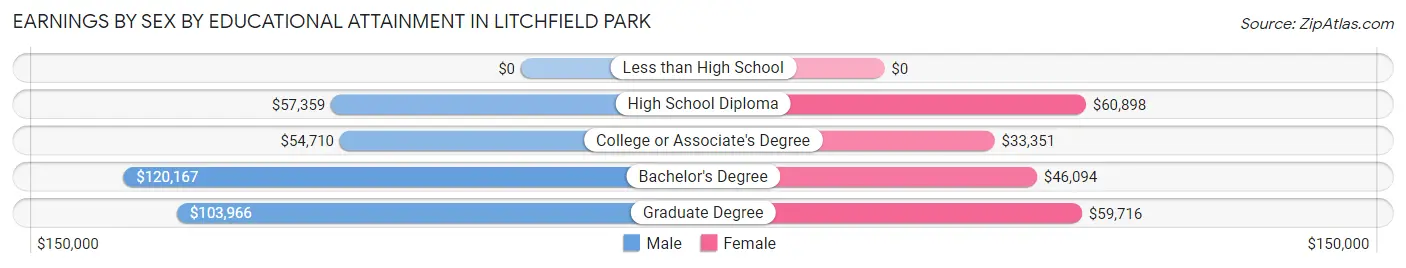
Earnings by Sex by Educational Attainment in Litchfield Park
Average earnings in Litchfield Park are $80,266 for men and $47,056 for women, a difference of 41.4%. Men with an educational attainment of bachelor's degree enjoy the highest average annual earnings of $120,167, while those with college or associate's degree education earn the least with $54,710. Women with an educational attainment of high school diploma earn the most with the average annual earnings of $60,898, while those with college or associate's degree education have the smallest earnings of $33,351.
| Educational Attainment | Male Income | Female Income |
| Less than High School | - | - |
| High School Diploma | $57,359 | $60,898 |
| College or Associate's Degree | $54,710 | $33,351 |
| Bachelor's Degree | $120,167 | $46,094 |
| Graduate Degree | $103,966 | $59,716 |
| Total | $80,266 | $47,056 |
Family Income in Litchfield Park
Family Income Brackets in Litchfield Park
According to the Litchfield Park family income data, there are 493 families falling into the $100,000 to $149,999 income range, which is the most common income bracket and makes up 25.3% of all families.
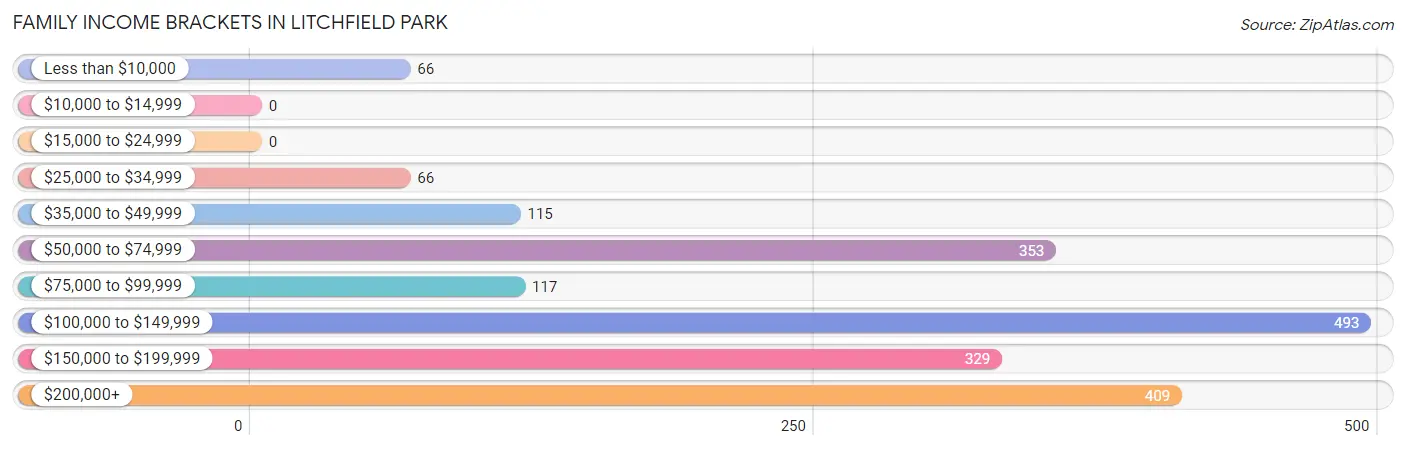
| Income Bracket | # Families | % Families |
| Less than $10,000 | 66 | 3.4% |
| $10,000 to $14,999 | 0 | 0.0% |
| $15,000 to $24,999 | 0 | 0.0% |
| $25,000 to $34,999 | 66 | 3.4% |
| $35,000 to $49,999 | 115 | 5.9% |
| $50,000 to $74,999 | 353 | 18.1% |
| $75,000 to $99,999 | 117 | 6.0% |
| $100,000 to $149,999 | 493 | 25.3% |
| $150,000 to $199,999 | 329 | 16.9% |
| $200,000+ | 409 | 21.0% |
Family Income by Famaliy Size in Litchfield Park
6-person families (61 | 3.1%) account for the highest median family income in Litchfield Park with $250,001 per family, while 2-person families (1,071 | 55.0%) have the highest median income of $46,168 per family member.
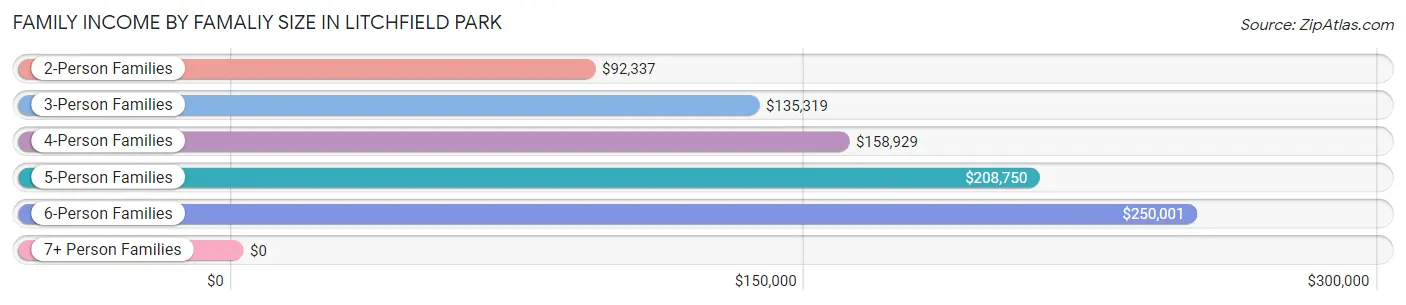
| Income Bracket | # Families | Median Income |
| 2-Person Families | 1,071 (55.0%) | $92,337 |
| 3-Person Families | 317 (16.3%) | $135,319 |
| 4-Person Families | 396 (20.3%) | $158,929 |
| 5-Person Families | 92 (4.7%) | $208,750 |
| 6-Person Families | 61 (3.1%) | $250,001 |
| 7+ Person Families | 11 (0.6%) | $0 |
| Total | 1,948 (100.0%) | $123,358 |
Family Income by Number of Earners in Litchfield Park
The median family income in Litchfield Park is $123,358, with families comprising 3+ earners (182) having the highest median family income of $198,676, while families with no earners (248) have the lowest median family income of $66,129, accounting for 9.3% and 12.7% of families, respectively.
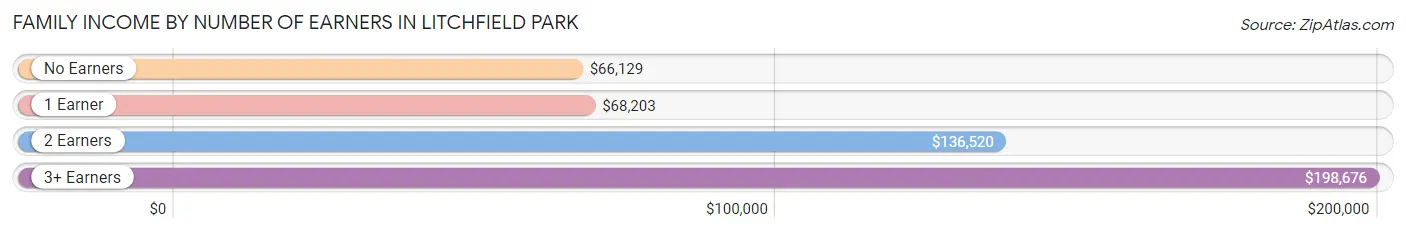
| Number of Earners | # Families | Median Income |
| No Earners | 248 (12.7%) | $66,129 |
| 1 Earner | 693 (35.6%) | $68,203 |
| 2 Earners | 825 (42.3%) | $136,520 |
| 3+ Earners | 182 (9.3%) | $198,676 |
| Total | 1,948 (100.0%) | $123,358 |
Household Income in Litchfield Park
Household Income Brackets in Litchfield Park
With 581 households falling in the category, the $100,000 to $149,999 income range is the most frequent in Litchfield Park, accounting for 20.9% of all households. In contrast, only 28 households (1.0%) fall into the $15,000 to $24,999 income bracket, making it the least populous group.
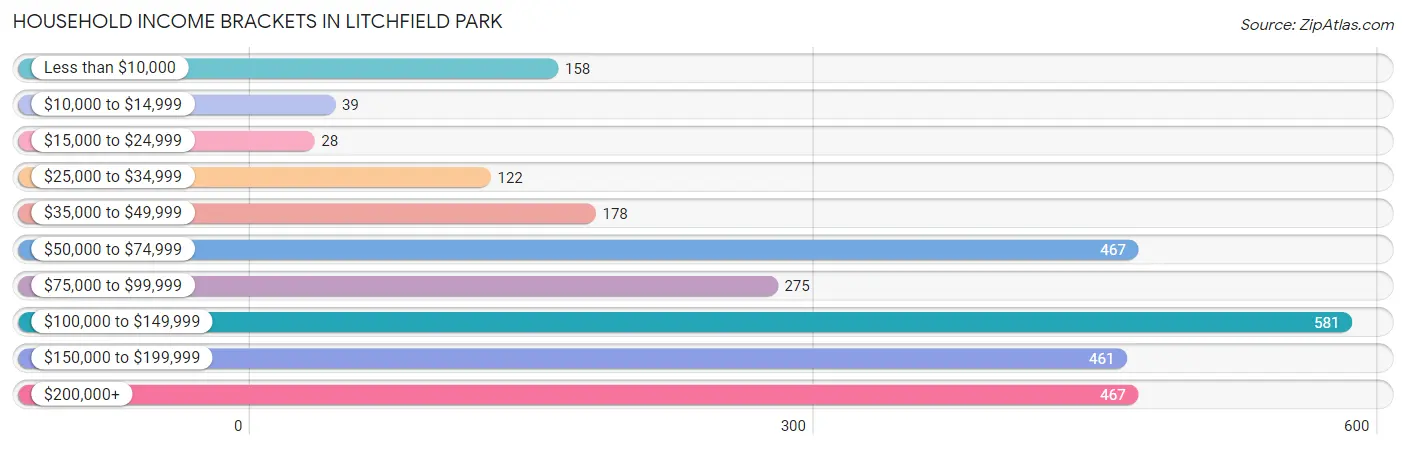
| Income Bracket | # Households | % Households |
| Less than $10,000 | 158 | 5.7% |
| $10,000 to $14,999 | 39 | 1.4% |
| $15,000 to $24,999 | 28 | 1.0% |
| $25,000 to $34,999 | 122 | 4.4% |
| $35,000 to $49,999 | 178 | 6.4% |
| $50,000 to $74,999 | 467 | 16.8% |
| $75,000 to $99,999 | 275 | 9.9% |
| $100,000 to $149,999 | 581 | 20.9% |
| $150,000 to $199,999 | 461 | 16.6% |
| $200,000+ | 467 | 16.8% |
Household Income by Householder Age in Litchfield Park
The median household income in Litchfield Park is $117,601, with the highest median household income of $148,393 found in the 45 to 64 years age bracket for the primary householder. A total of 1,138 households (40.9%) fall into this category. Meanwhile, the 15 to 24 years age bracket for the primary householder has the lowest median household income of $0, with 17 households (0.6%) in this group.
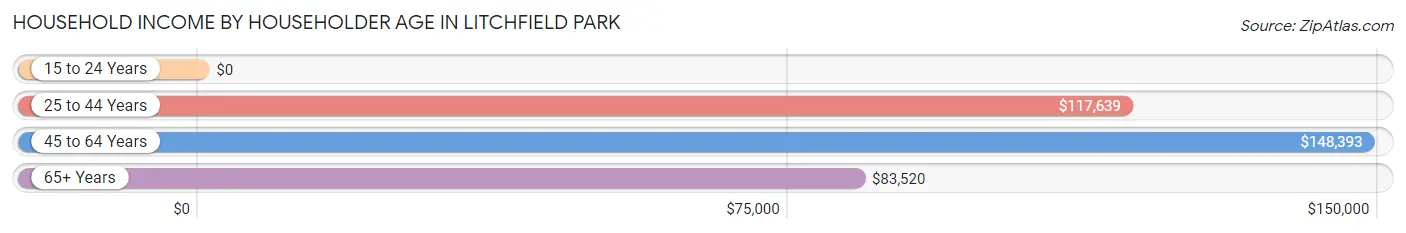
| Income Bracket | # Households | Median Income |
| 15 to 24 Years | 17 (0.6%) | $0 |
| 25 to 44 Years | 742 (26.7%) | $117,639 |
| 45 to 64 Years | 1,138 (40.9%) | $148,393 |
| 65+ Years | 883 (31.8%) | $83,520 |
| Total | 2,780 (100.0%) | $117,601 |
Poverty in Litchfield Park
Income Below Poverty by Sex and Age in Litchfield Park
With 4.3% poverty level for males and 6.2% for females among the residents of Litchfield Park, 18 to 24 year old males and 75 year old and over females are the most vulnerable to poverty, with 41 males (22.2%) and 72 females (20.3%) in their respective age groups living below the poverty level.
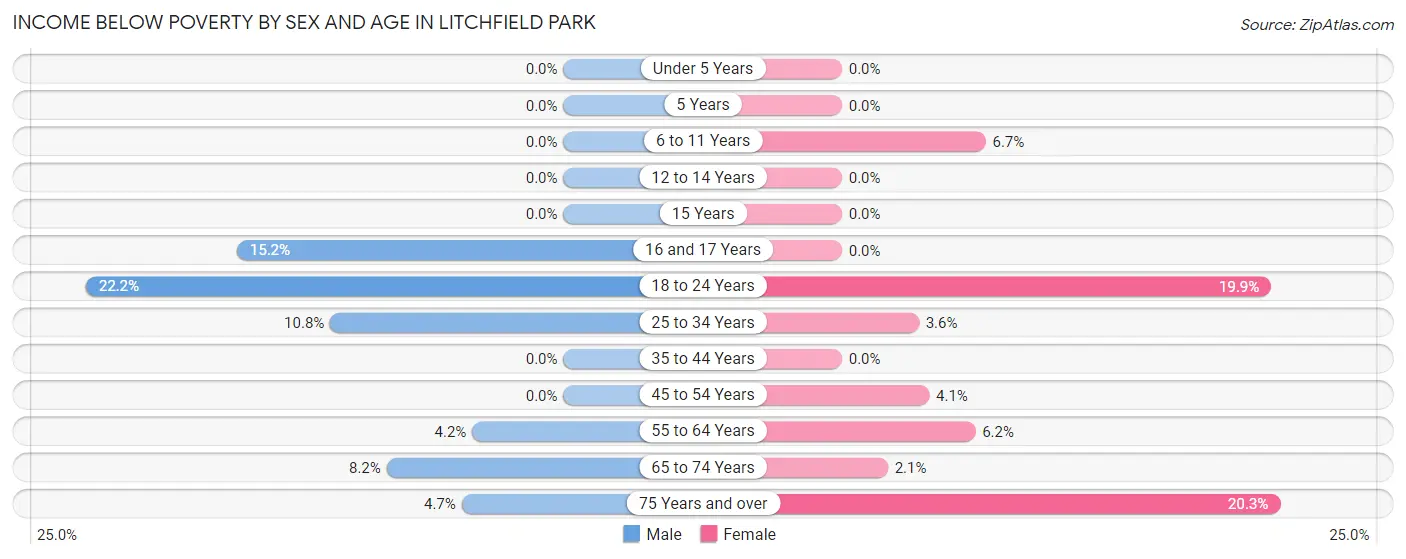
| Age Bracket | Male | Female |
| Under 5 Years | 0 (0.0%) | 0 (0.0%) |
| 5 Years | 0 (0.0%) | 0 (0.0%) |
| 6 to 11 Years | 0 (0.0%) | 12 (6.7%) |
| 12 to 14 Years | 0 (0.0%) | 0 (0.0%) |
| 15 Years | 0 (0.0%) | 0 (0.0%) |
| 16 and 17 Years | 20 (15.1%) | 0 (0.0%) |
| 18 to 24 Years | 41 (22.2%) | 52 (19.9%) |
| 25 to 34 Years | 25 (10.8%) | 12 (3.6%) |
| 35 to 44 Years | 0 (0.0%) | 0 (0.0%) |
| 45 to 54 Years | 0 (0.0%) | 21 (4.1%) |
| 55 to 64 Years | 22 (4.2%) | 30 (6.2%) |
| 65 to 74 Years | 25 (8.2%) | 11 (2.1%) |
| 75 Years and over | 12 (4.7%) | 72 (20.3%) |
| Total | 145 (4.3%) | 210 (6.2%) |
Income Above Poverty by Sex and Age in Litchfield Park
According to the poverty statistics in Litchfield Park, males aged under 5 years and females aged under 5 years are the age groups that are most secure financially, with 100.0% of males and 100.0% of females in these age groups living above the poverty line.
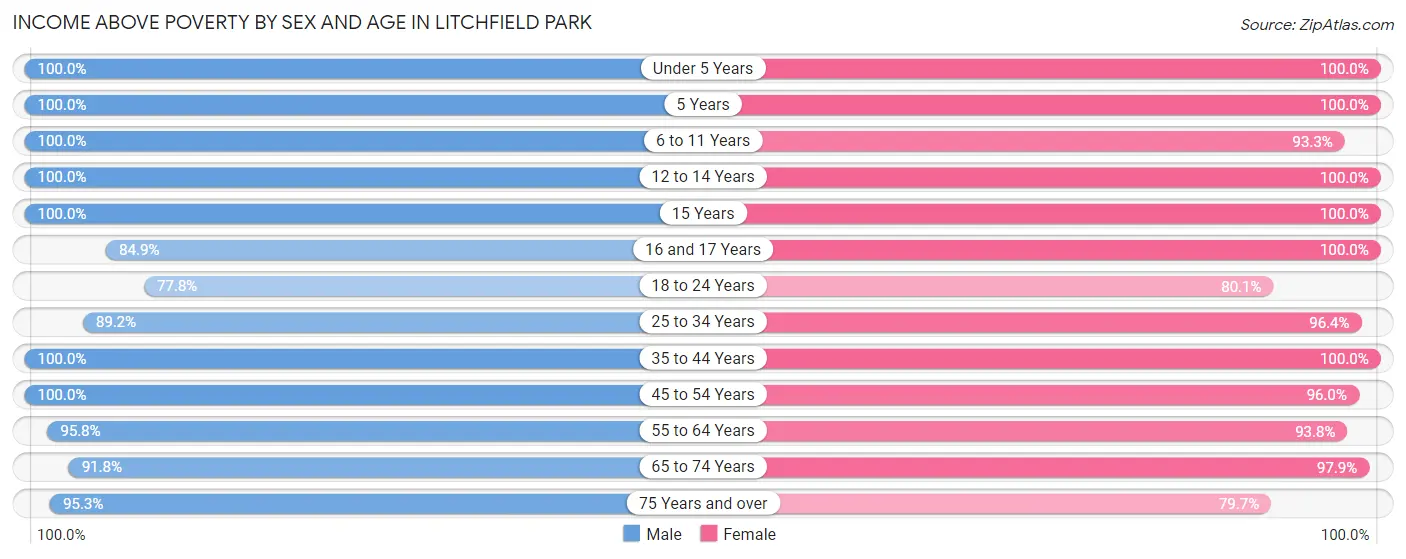
| Age Bracket | Male | Female |
| Under 5 Years | 164 (100.0%) | 99 (100.0%) |
| 5 Years | 99 (100.0%) | 14 (100.0%) |
| 6 to 11 Years | 225 (100.0%) | 168 (93.3%) |
| 12 to 14 Years | 55 (100.0%) | 118 (100.0%) |
| 15 Years | 82 (100.0%) | 43 (100.0%) |
| 16 and 17 Years | 112 (84.9%) | 50 (100.0%) |
| 18 to 24 Years | 144 (77.8%) | 209 (80.1%) |
| 25 to 34 Years | 206 (89.2%) | 324 (96.4%) |
| 35 to 44 Years | 442 (100.0%) | 424 (100.0%) |
| 45 to 54 Years | 655 (100.0%) | 498 (96.0%) |
| 55 to 64 Years | 498 (95.8%) | 455 (93.8%) |
| 65 to 74 Years | 280 (91.8%) | 505 (97.9%) |
| 75 Years and over | 242 (95.3%) | 282 (79.7%) |
| Total | 3,204 (95.7%) | 3,189 (93.8%) |
Income Below Poverty Among Married-Couple Families in Litchfield Park
The poverty statistics for married-couple families in Litchfield Park show that 2.0% or 33 of the total 1,656 families live below the poverty line. Families with no children have the highest poverty rate of 3.1%, comprising of 33 families. On the other hand, families with 1 or 2 children have the lowest poverty rate of 0.0%, which includes 0 families.
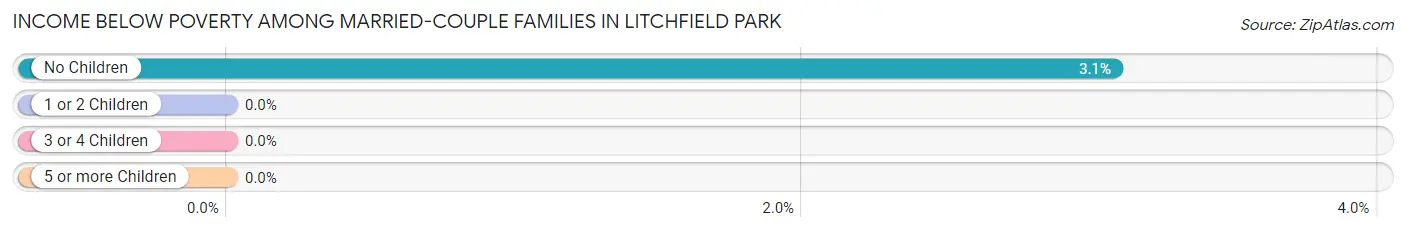
| Children | Above Poverty | Below Poverty |
| No Children | 1,038 (96.9%) | 33 (3.1%) |
| 1 or 2 Children | 527 (100.0%) | 0 (0.0%) |
| 3 or 4 Children | 58 (100.0%) | 0 (0.0%) |
| 5 or more Children | 0 (0.0%) | 0 (0.0%) |
| Total | 1,623 (98.0%) | 33 (2.0%) |
Income Below Poverty Among Single-Parent Households in Litchfield Park
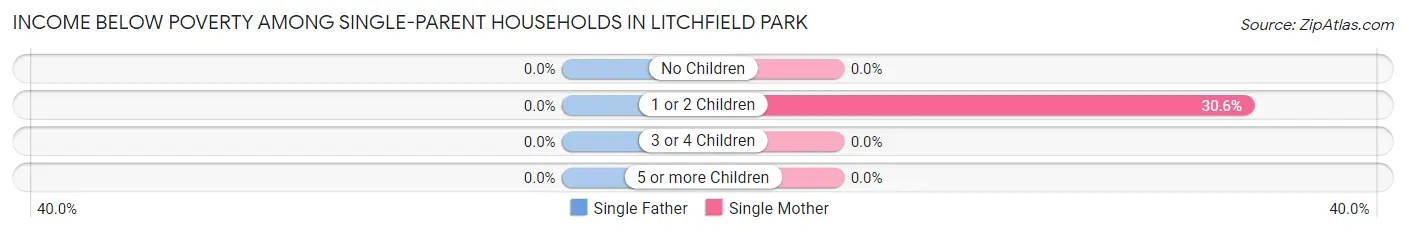
| Children | Single Father | Single Mother |
| No Children | 0 (0.0%) | 0 (0.0%) |
| 1 or 2 Children | 0 (0.0%) | 33 (30.6%) |
| 3 or 4 Children | 0 (0.0%) | 0 (0.0%) |
| 5 or more Children | 0 (0.0%) | 0 (0.0%) |
| Total | 0 (0.0%) | 33 (18.3%) |
Income Below Poverty Among Married-Couple vs Single-Parent Households in Litchfield Park
The poverty data for Litchfield Park shows that 33 of the married-couple family households (2.0%) and 33 of the single-parent households (11.3%) are living below the poverty level. Within the married-couple family households, those with no children have the highest poverty rate, with 33 households (3.1%) falling below the poverty line. Among the single-parent households, those with 1 or 2 children have the highest poverty rate, with 33 household (16.8%) living below poverty.
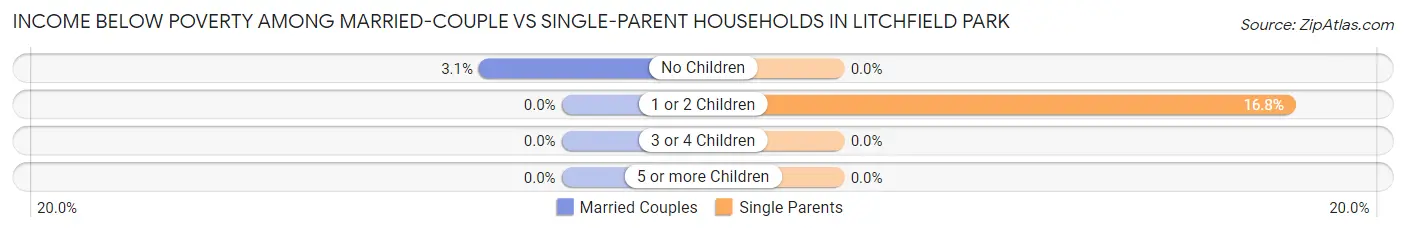
| Children | Married-Couple Families | Single-Parent Households |
| No Children | 33 (3.1%) | 0 (0.0%) |
| 1 or 2 Children | 0 (0.0%) | 33 (16.8%) |
| 3 or 4 Children | 0 (0.0%) | 0 (0.0%) |
| 5 or more Children | 0 (0.0%) | 0 (0.0%) |
| Total | 33 (2.0%) | 33 (11.3%) |
Race in Litchfield Park
The most populous races in Litchfield Park are White / Caucasian (5,071 | 74.6%), Hispanic or Latino (1,615 | 23.8%), and Two or more Races (861 | 12.7%).
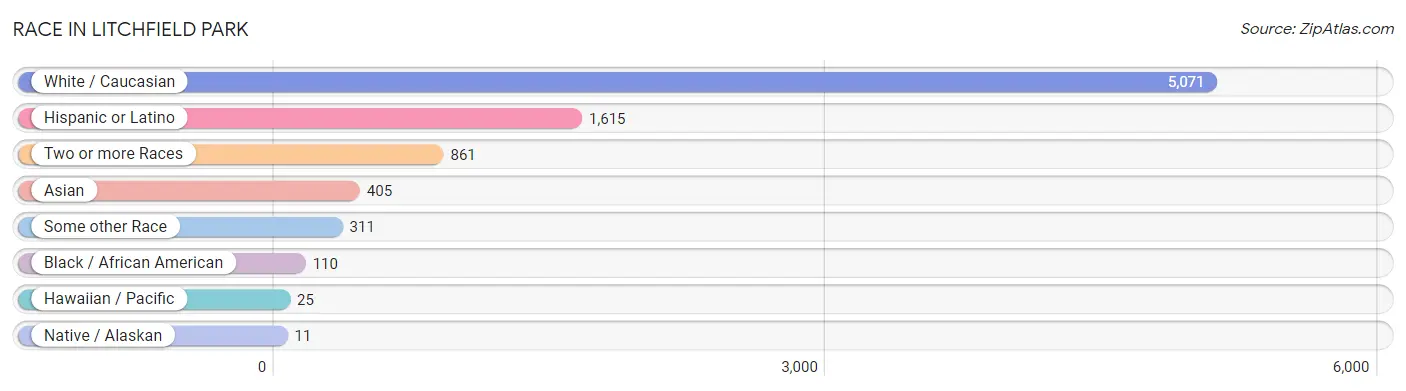
| Race | # Population | % Population |
| Asian | 405 | 6.0% |
| Black / African American | 110 | 1.6% |
| Hawaiian / Pacific | 25 | 0.4% |
| Hispanic or Latino | 1,615 | 23.8% |
| Native / Alaskan | 11 | 0.2% |
| White / Caucasian | 5,071 | 74.6% |
| Two or more Races | 861 | 12.7% |
| Some other Race | 311 | 4.6% |
| Total | 6,794 | 100.0% |
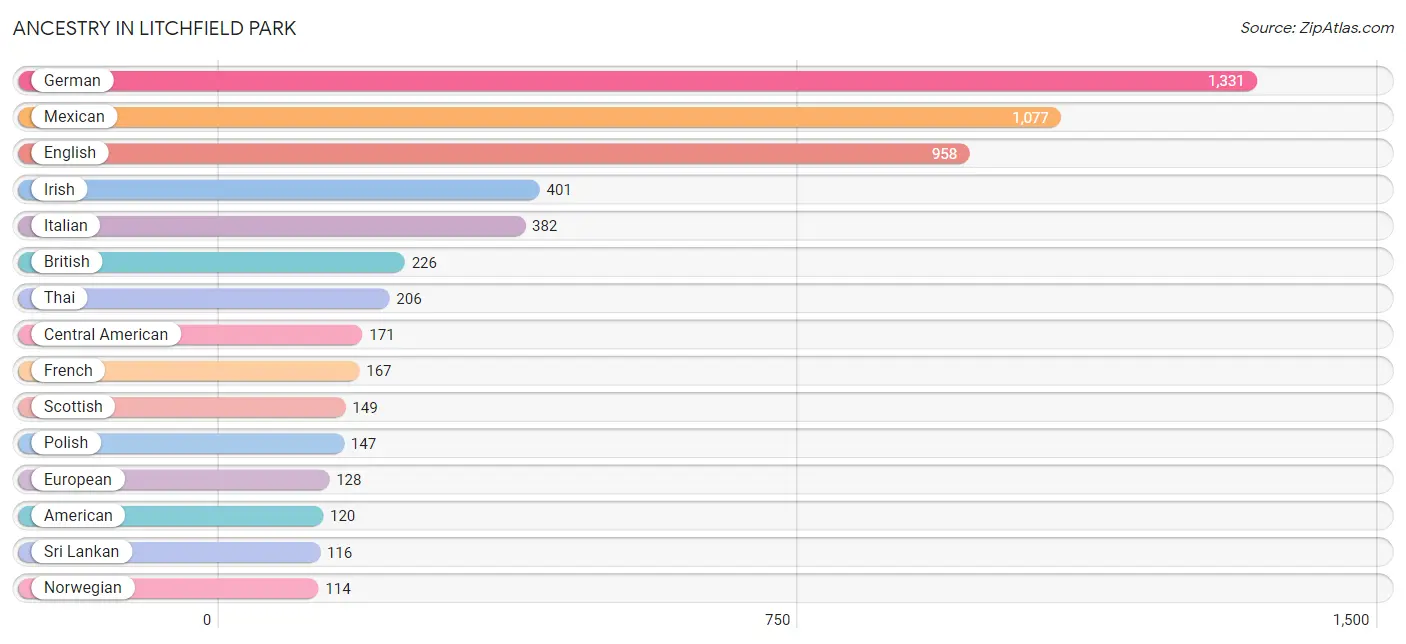
Ancestry in Litchfield Park
The most populous ancestries reported in Litchfield Park are German (1,331 | 19.6%), Mexican (1,077 | 15.9%), English (958 | 14.1%), Irish (401 | 5.9%), and Italian (382 | 5.6%), together accounting for 61.1% of all Litchfield Park residents.
| Ancestry | # Population | % Population |
| American | 120 | 1.8% |
| Arab | 51 | 0.7% |
| Belgian | 34 | 0.5% |
| Bhutanese | 27 | 0.4% |
| British | 226 | 3.3% |
| Burmese | 17 | 0.3% |
| Canadian | 31 | 0.5% |
| Central American | 171 | 2.5% |
| Central American Indian | 5 | 0.1% |
| Cherokee | 5 | 0.1% |
| Chippewa | 6 | 0.1% |
| Colombian | 14 | 0.2% |
| Croatian | 12 | 0.2% |
| Czech | 79 | 1.2% |
| Danish | 26 | 0.4% |
| Dutch | 102 | 1.5% |
| Eastern European | 39 | 0.6% |
| English | 958 | 14.1% |
| Estonian | 12 | 0.2% |
| European | 128 | 1.9% |
| Finnish | 27 | 0.4% |
| French | 167 | 2.5% |
| French Canadian | 39 | 0.6% |
| German | 1,331 | 19.6% |
| Greek | 11 | 0.2% |
| Guatemalan | 102 | 1.5% |
| Hungarian | 14 | 0.2% |
| Irish | 401 | 5.9% |
| Italian | 382 | 5.6% |
| Korean | 104 | 1.5% |
| Laotian | 50 | 0.7% |
| Lebanese | 37 | 0.5% |
| Lithuanian | 20 | 0.3% |
| Marshallese | 25 | 0.4% |
| Mexican | 1,077 | 15.9% |
| Norwegian | 114 | 1.7% |
| Peruvian | 24 | 0.4% |
| Polish | 147 | 2.2% |
| Portuguese | 35 | 0.5% |
| Puerto Rican | 5 | 0.1% |
| Russian | 28 | 0.4% |
| Salvadoran | 69 | 1.0% |
| Scandinavian | 96 | 1.4% |
| Scotch-Irish | 103 | 1.5% |
| Scottish | 149 | 2.2% |
| South American | 38 | 0.6% |
| Spaniard | 97 | 1.4% |
| Spanish | 85 | 1.3% |
| Sri Lankan | 116 | 1.7% |
| Swedish | 34 | 0.5% |
| Thai | 206 | 3.0% |
| Ukrainian | 27 | 0.4% |
| Welsh | 73 | 1.1% |
| Yugoslavian | 20 | 0.3% | View All 54 Rows |
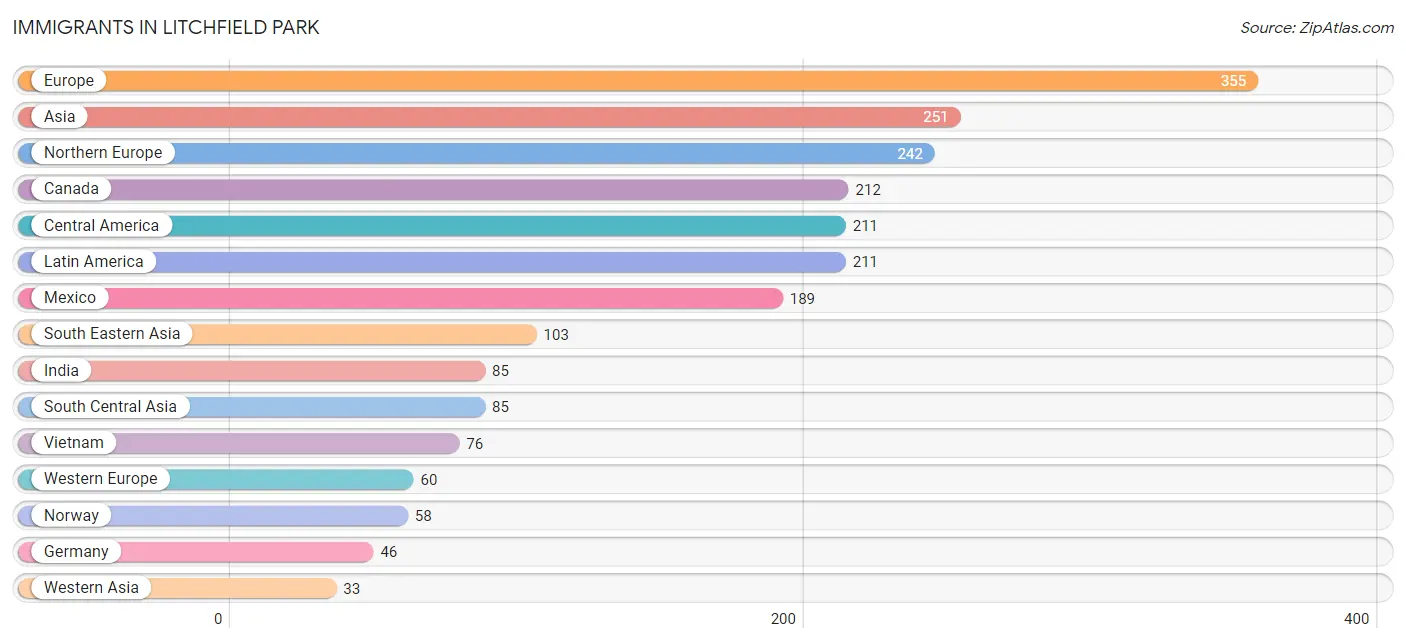
Immigrants in Litchfield Park
The most numerous immigrant groups reported in Litchfield Park came from Europe (355 | 5.2%), Asia (251 | 3.7%), Northern Europe (242 | 3.6%), Canada (212 | 3.1%), and Central America (211 | 3.1%), together accounting for 18.7% of all Litchfield Park residents.
| Immigration Origin | # Population | % Population |
| Asia | 251 | 3.7% |
| Belgium | 14 | 0.2% |
| Canada | 212 | 3.1% |
| Central America | 211 | 3.1% |
| Croatia | 12 | 0.2% |
| Denmark | 16 | 0.2% |
| Eastern Asia | 30 | 0.4% |
| Eastern Europe | 23 | 0.3% |
| El Salvador | 22 | 0.3% |
| England | 28 | 0.4% |
| Europe | 355 | 5.2% |
| Germany | 46 | 0.7% |
| India | 85 | 1.3% |
| Iraq | 9 | 0.1% |
| Japan | 13 | 0.2% |
| Korea | 17 | 0.3% |
| Latin America | 211 | 3.1% |
| Mexico | 189 | 2.8% |
| Micronesia | 25 | 0.4% |
| Northern Europe | 242 | 3.6% |
| Norway | 58 | 0.9% |
| Oceania | 25 | 0.4% |
| Philippines | 27 | 0.4% |
| Poland | 11 | 0.2% |
| South Central Asia | 85 | 1.3% |
| South Eastern Asia | 103 | 1.5% |
| Southern Europe | 30 | 0.4% |
| Spain | 30 | 0.4% |
| Vietnam | 76 | 1.1% |
| Western Asia | 33 | 0.5% |
| Western Europe | 60 | 0.9% | View All 31 Rows |
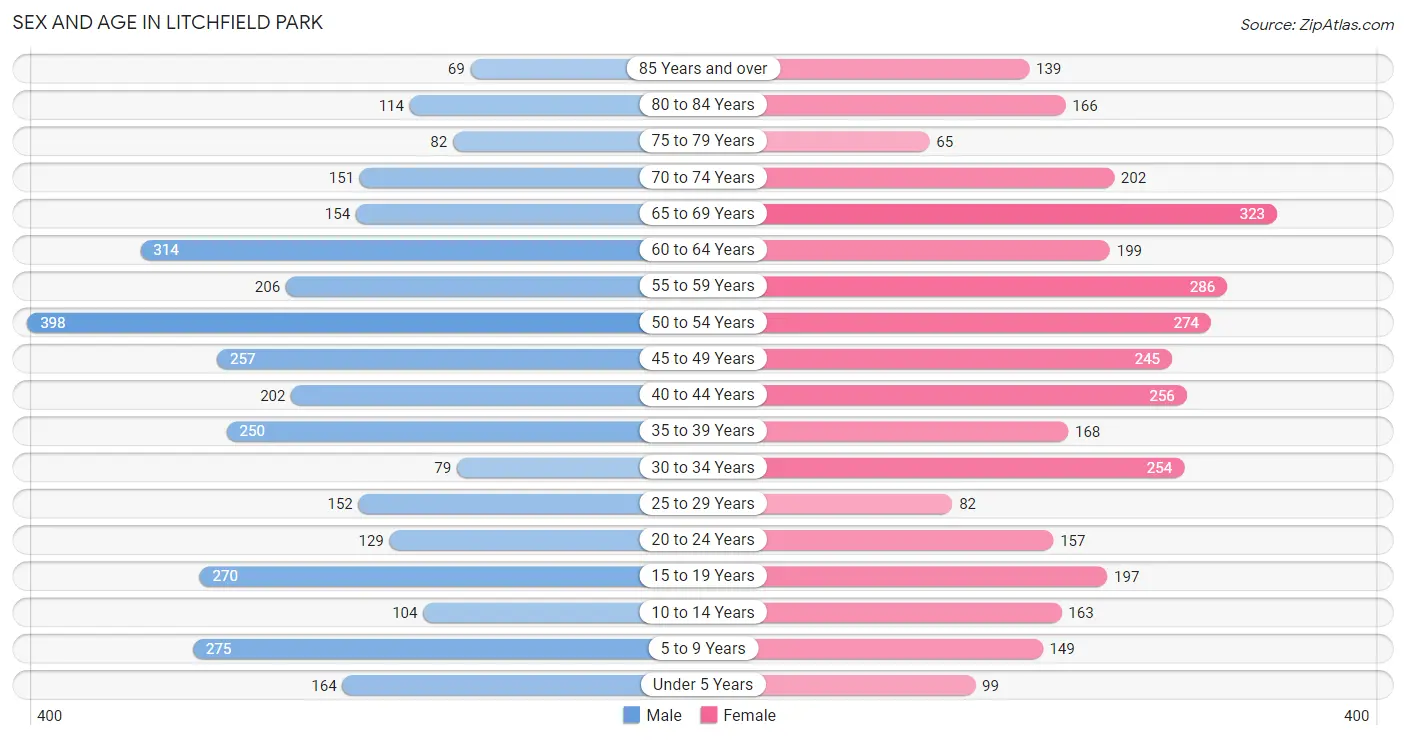
Sex and Age in Litchfield Park
Sex and Age in Litchfield Park
The most populous age groups in Litchfield Park are 50 to 54 Years (398 | 11.8%) for men and 65 to 69 Years (323 | 9.4%) for women.
| Age Bracket | Male | Female |
| Under 5 Years | 164 (4.9%) | 99 (2.9%) |
| 5 to 9 Years | 275 (8.2%) | 149 (4.3%) |
| 10 to 14 Years | 104 (3.1%) | 163 (4.8%) |
| 15 to 19 Years | 270 (8.0%) | 197 (5.8%) |
| 20 to 24 Years | 129 (3.8%) | 157 (4.6%) |
| 25 to 29 Years | 152 (4.5%) | 82 (2.4%) |
| 30 to 34 Years | 79 (2.3%) | 254 (7.4%) |
| 35 to 39 Years | 250 (7.4%) | 168 (4.9%) |
| 40 to 44 Years | 202 (6.0%) | 256 (7.5%) |
| 45 to 49 Years | 257 (7.6%) | 245 (7.2%) |
| 50 to 54 Years | 398 (11.8%) | 274 (8.0%) |
| 55 to 59 Years | 206 (6.1%) | 286 (8.4%) |
| 60 to 64 Years | 314 (9.3%) | 199 (5.8%) |
| 65 to 69 Years | 154 (4.6%) | 323 (9.4%) |
| 70 to 74 Years | 151 (4.5%) | 202 (5.9%) |
| 75 to 79 Years | 82 (2.4%) | 65 (1.9%) |
| 80 to 84 Years | 114 (3.4%) | 166 (4.9%) |
| 85 Years and over | 69 (2.1%) | 139 (4.1%) |
| Total | 3,370 (100.0%) | 3,424 (100.0%) |
Families and Households in Litchfield Park
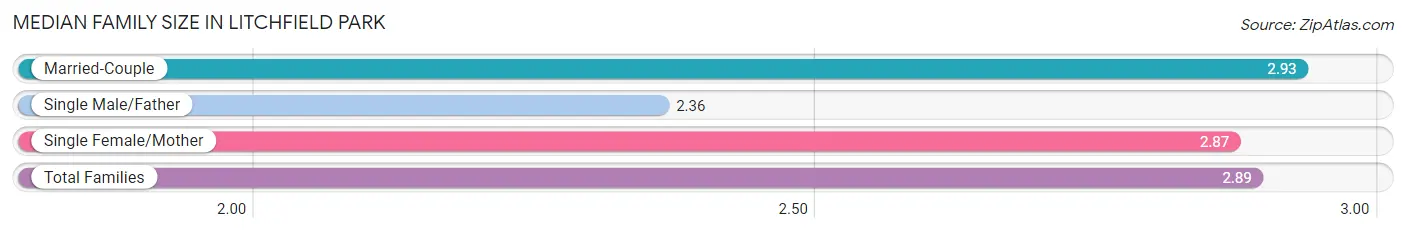
Median Family Size in Litchfield Park
The median family size in Litchfield Park is 2.89 persons per family, with married-couple families (1,656 | 85.0%) accounting for the largest median family size of 2.93 persons per family. On the other hand, single male/father families (112 | 5.8%) represent the smallest median family size with 2.36 persons per family.
| Family Type | # Families | Family Size |
| Married-Couple | 1,656 (85.0%) | 2.93 |
| Single Male/Father | 112 (5.8%) | 2.36 |
| Single Female/Mother | 180 (9.2%) | 2.87 |
| Total Families | 1,948 (100.0%) | 2.89 |
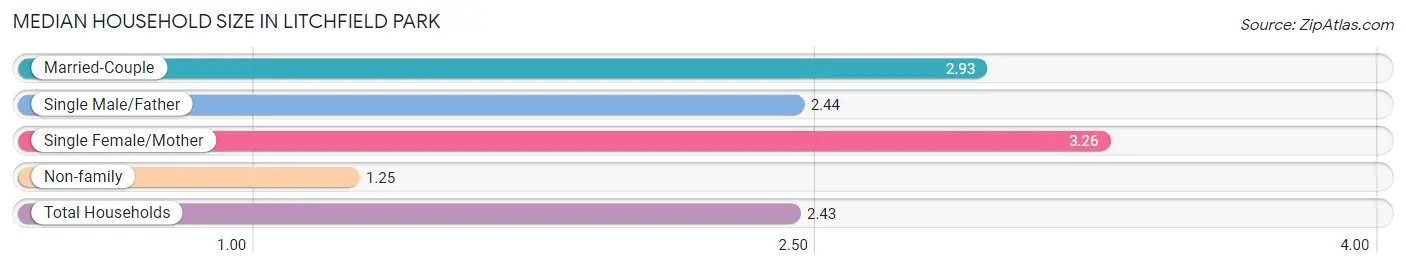
Median Household Size in Litchfield Park
The median household size in Litchfield Park is 2.43 persons per household, with single female/mother households (180 | 6.5%) accounting for the largest median household size of 3.26 persons per household. non-family households (832 | 29.9%) represent the smallest median household size with 1.25 persons per household.
| Household Type | # Households | Household Size |
| Married-Couple | 1,656 (59.6%) | 2.93 |
| Single Male/Father | 112 (4.0%) | 2.44 |
| Single Female/Mother | 180 (6.5%) | 3.26 |
| Non-family | 832 (29.9%) | 1.25 |
| Total Households | 2,780 (100.0%) | 2.43 |
Household Size by Marriage Status in Litchfield Park
Out of a total of 2,780 households in Litchfield Park, 1,948 (70.1%) are family households, while 832 (29.9%) are nonfamily households. The most numerous type of family households are 2-person households, comprising 1,048, and the most common type of nonfamily households are 1-person households, comprising 735.
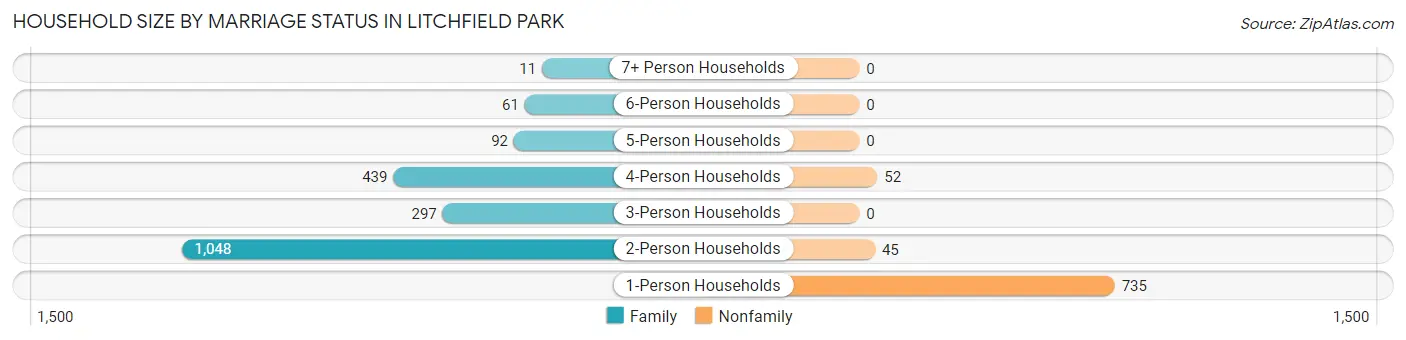
| Household Size | Family Households | Nonfamily Households |
| 1-Person Households | - | 735 (26.4%) |
| 2-Person Households | 1,048 (37.7%) | 45 (1.6%) |
| 3-Person Households | 297 (10.7%) | 0 (0.0%) |
| 4-Person Households | 439 (15.8%) | 52 (1.9%) |
| 5-Person Households | 92 (3.3%) | 0 (0.0%) |
| 6-Person Households | 61 (2.2%) | 0 (0.0%) |
| 7+ Person Households | 11 (0.4%) | 0 (0.0%) |
| Total | 1,948 (70.1%) | 832 (29.9%) |
Female Fertility in Litchfield Park
Fertility by Age in Litchfield Park
Average fertility rate in Litchfield Park is 48.0 births per 1,000 women. Women in the age bracket of 20 to 34 years have the highest fertility rate with 95.0 births per 1,000 women. Women in the age bracket of 20 to 34 years acount for 68.1% of all women with births.
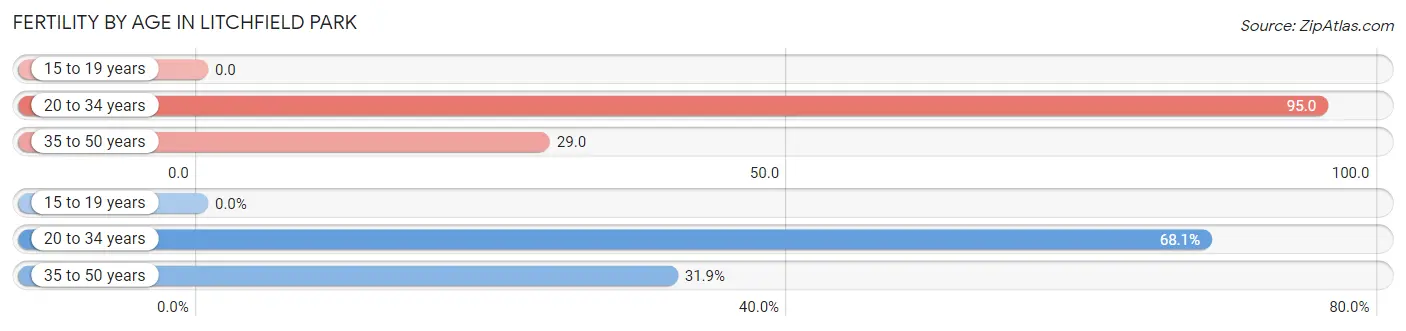
| Age Bracket | Women with Births | Births / 1,000 Women |
| 15 to 19 years | 0 (0.0%) | 0.0 |
| 20 to 34 years | 47 (68.1%) | 95.0 |
| 35 to 50 years | 22 (31.9%) | 29.0 |
| Total | 69 (100.0%) | 48.0 |
Fertility by Age by Marriage Status in Litchfield Park
75.4% of women with births (69) in Litchfield Park are married. The highest percentage of unmarried women with births falls into 20 to 34 years age bracket with 36.2% of them unmarried at the time of birth, while the lowest percentage of unmarried women with births belong to 35 to 50 years age bracket with 0.0% of them unmarried.
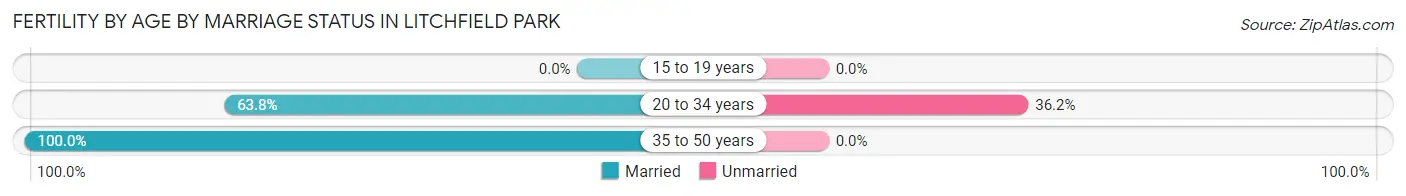
| Age Bracket | Married | Unmarried |
| 15 to 19 years | 0 (0.0%) | 0 (0.0%) |
| 20 to 34 years | 30 (63.8%) | 17 (36.2%) |
| 35 to 50 years | 22 (100.0%) | 0 (0.0%) |
| Total | 52 (75.4%) | 17 (24.6%) |
Fertility by Education in Litchfield Park
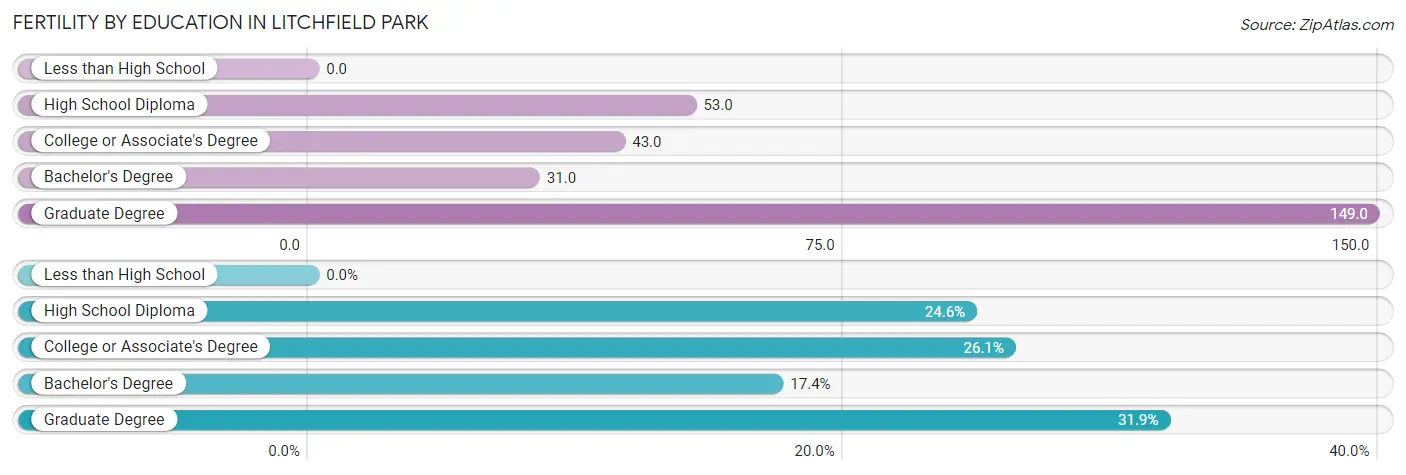
| Educational Attainment | Women with Births | Births / 1,000 Women |
| Less than High School | 0 (0.0%) | 0.0 |
| High School Diploma | 17 (24.6%) | 53.0 |
| College or Associate's Degree | 18 (26.1%) | 43.0 |
| Bachelor's Degree | 12 (17.4%) | 31.0 |
| Graduate Degree | 22 (31.9%) | 149.0 |
| Total | 69 (100.0%) | 48.0 |
Fertility by Education by Marriage Status in Litchfield Park
24.6% of women with births in Litchfield Park are unmarried. Women with the educational attainment of college or associate's degree are most likely to be married with 100.0% of them married at childbirth, while women with the educational attainment of high school diploma are least likely to be married with 100.0% of them unmarried at childbirth.
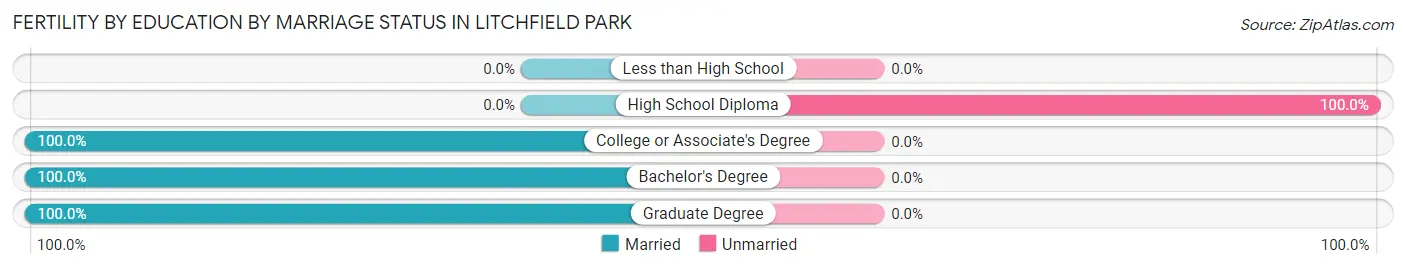
| Educational Attainment | Married | Unmarried |
| Less than High School | 0 (0.0%) | 0 (0.0%) |
| High School Diploma | 0 (0.0%) | 17 (100.0%) |
| College or Associate's Degree | 18 (100.0%) | 0 (0.0%) |
| Bachelor's Degree | 12 (100.0%) | 0 (0.0%) |
| Graduate Degree | 22 (100.0%) | 0 (0.0%) |
| Total | 52 (75.4%) | 17 (24.6%) |
Employment Characteristics in Litchfield Park
Employment by Class of Employer in Litchfield Park
Among the 3,286 employed individuals in Litchfield Park, private company employees (1,869 | 56.9%), self-employed (not incorporated) (311 | 9.5%), and local government employees (272 | 8.3%) make up the most common classes of employment.
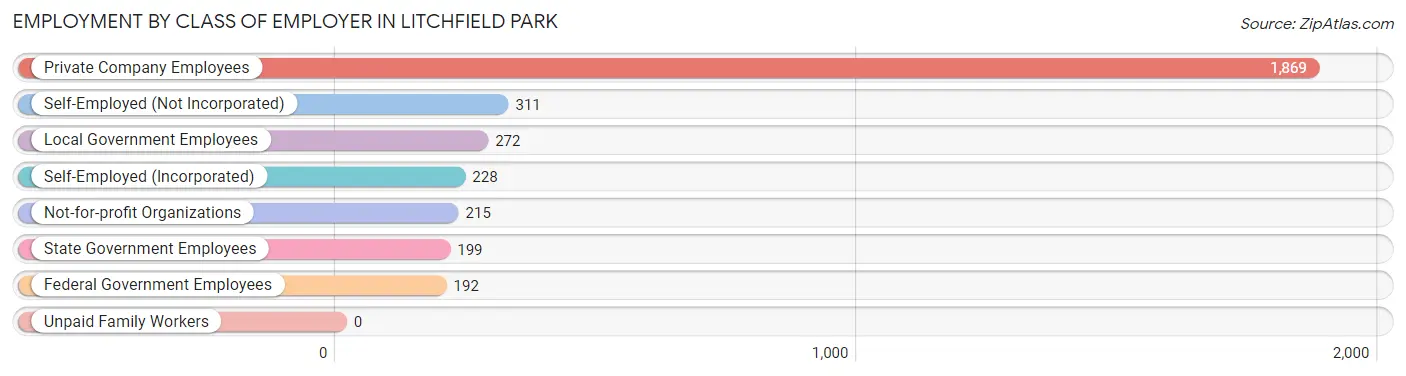
| Employer Class | # Employees | % Employees |
| Private Company Employees | 1,869 | 56.9% |
| Self-Employed (Incorporated) | 228 | 6.9% |
| Self-Employed (Not Incorporated) | 311 | 9.5% |
| Not-for-profit Organizations | 215 | 6.5% |
| Local Government Employees | 272 | 8.3% |
| State Government Employees | 199 | 6.1% |
| Federal Government Employees | 192 | 5.8% |
| Unpaid Family Workers | 0 | 0.0% |
| Total | 3,286 | 100.0% |
Employment Status by Age in Litchfield Park
According to the labor force statistics for Litchfield Park, out of the total population over 16 years of age (5,715), 60.3% or 3,446 individuals are in the labor force, with 2.1% or 72 of them unemployed. The age group with the highest labor force participation rate is 35 to 44 years, with 86.9% or 761 individuals in the labor force. Within the labor force, the 20 to 24 years age range has the highest percentage of unemployed individuals, with 11.0% or 16 of them being unemployed.
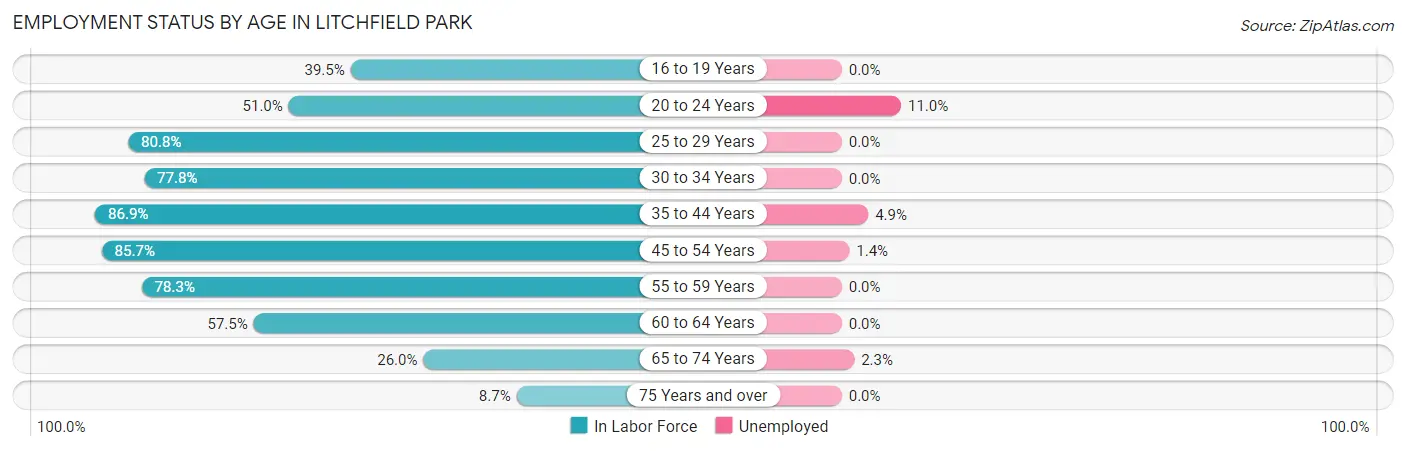
| Age Bracket | In Labor Force | Unemployed |
| 16 to 19 Years | 135 (39.5%) | 0 (0.0%) |
| 20 to 24 Years | 146 (51.0%) | 16 (11.0%) |
| 25 to 29 Years | 189 (80.8%) | 0 (0.0%) |
| 30 to 34 Years | 259 (77.8%) | 0 (0.0%) |
| 35 to 44 Years | 761 (86.9%) | 37 (4.9%) |
| 45 to 54 Years | 1,006 (85.7%) | 14 (1.4%) |
| 55 to 59 Years | 385 (78.3%) | 0 (0.0%) |
| 60 to 64 Years | 295 (57.5%) | 0 (0.0%) |
| 65 to 74 Years | 216 (26.0%) | 5 (2.3%) |
| 75 Years and over | 55 (8.7%) | 0 (0.0%) |
| Total | 3,446 (60.3%) | 72 (2.1%) |
Employment Status by Educational Attainment in Litchfield Park
According to labor force statistics for Litchfield Park, 79.9% of individuals (2,894) out of the total population between 25 and 64 years of age (3,622) are in the labor force, with 1.7% or 49 of them being unemployed. The group with the highest labor force participation rate are those with the educational attainment of high school diploma, with 84.3% or 489 individuals in the labor force. Within the labor force, individuals with high school diploma education have the highest percentage of unemployment, with 1.8% or 9 of them being unemployed.
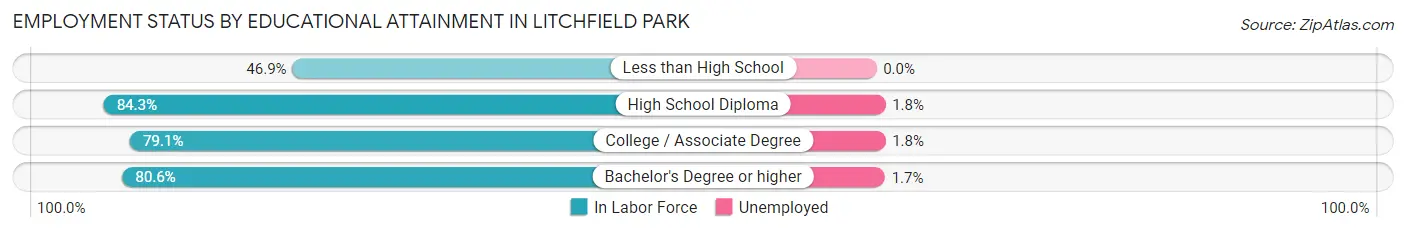
| Educational Attainment | In Labor Force | Unemployed |
| Less than High School | 38 (46.9%) | 0 (0.0%) |
| High School Diploma | 489 (84.3%) | 10 (1.8%) |
| College / Associate Degree | 985 (79.1%) | 22 (1.8%) |
| Bachelor's Degree or higher | 1,383 (80.6%) | 29 (1.7%) |
| Total | 2,894 (79.9%) | 62 (1.7%) |
Employment Occupations by Sex in Litchfield Park
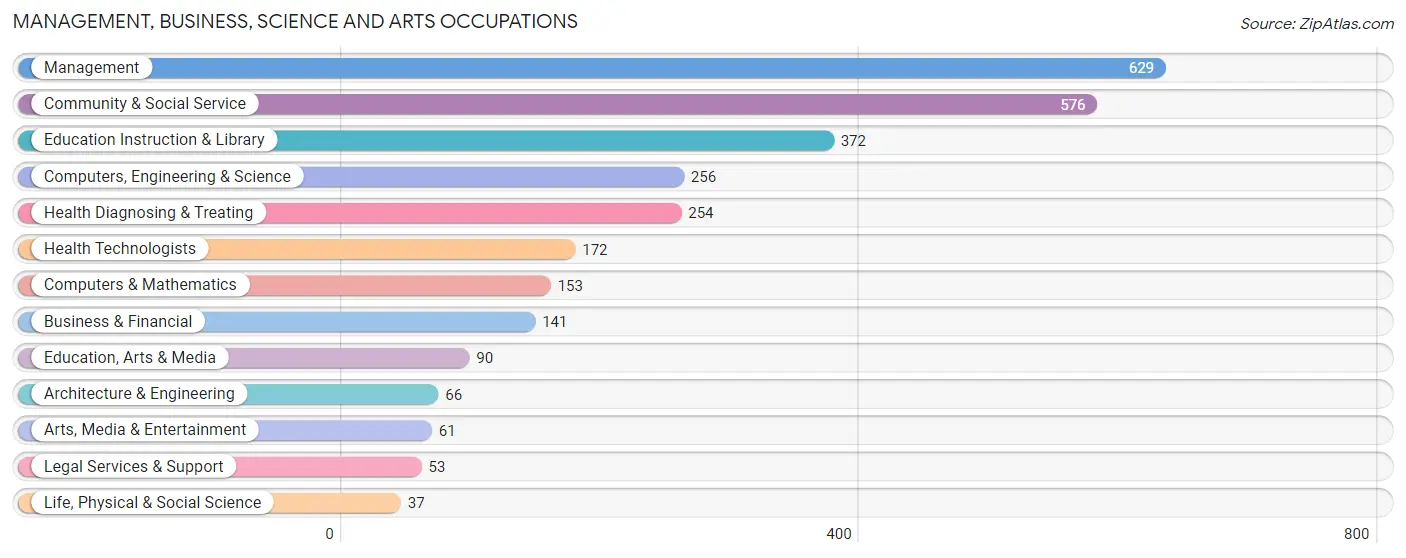
Management, Business, Science and Arts Occupations
The most common Management, Business, Science and Arts occupations in Litchfield Park are Management (629 | 18.9%), Community & Social Service (576 | 17.3%), Education Instruction & Library (372 | 11.2%), Computers, Engineering & Science (256 | 7.7%), and Health Diagnosing & Treating (254 | 7.6%).
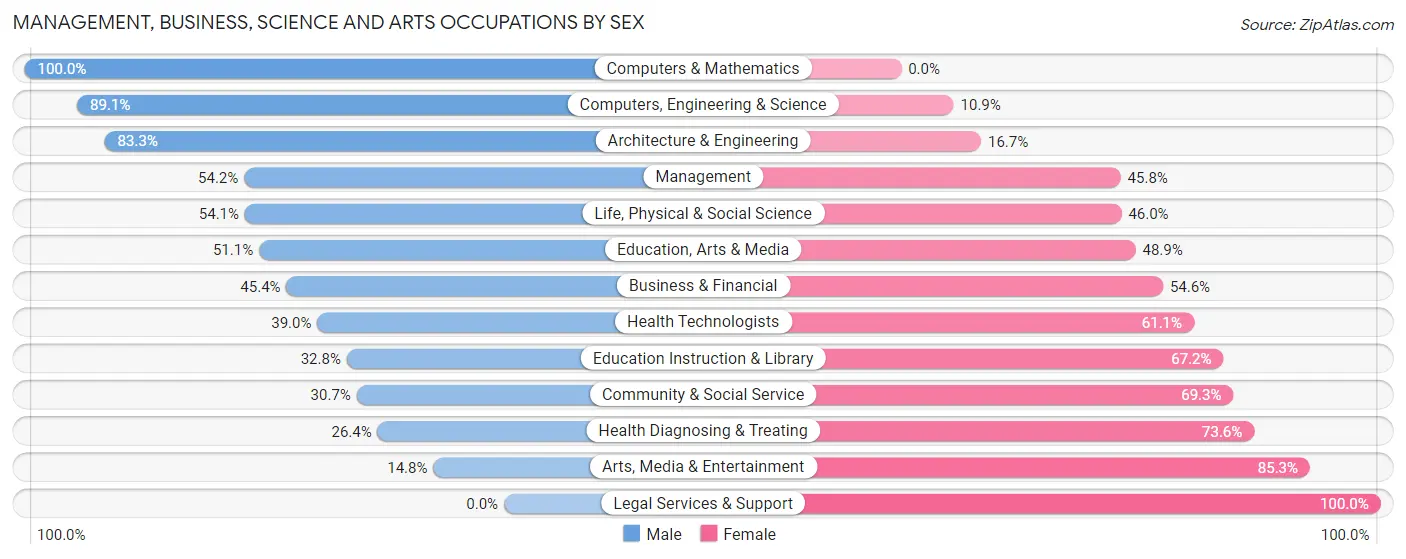
Management, Business, Science and Arts Occupations by Sex
Within the Management, Business, Science and Arts occupations in Litchfield Park, the most male-oriented occupations are Computers & Mathematics (100.0%), Computers, Engineering & Science (89.1%), and Architecture & Engineering (83.3%), while the most female-oriented occupations are Legal Services & Support (100.0%), Arts, Media & Entertainment (85.3%), and Health Diagnosing & Treating (73.6%).
| Occupation | Male | Female |
| Management | 341 (54.2%) | 288 (45.8%) |
| Business & Financial | 64 (45.4%) | 77 (54.6%) |
| Computers, Engineering & Science | 228 (89.1%) | 28 (10.9%) |
| Computers & Mathematics | 153 (100.0%) | 0 (0.0%) |
| Architecture & Engineering | 55 (83.3%) | 11 (16.7%) |
| Life, Physical & Social Science | 20 (54.0%) | 17 (46.0%) |
| Community & Social Service | 177 (30.7%) | 399 (69.3%) |
| Education, Arts & Media | 46 (51.1%) | 44 (48.9%) |
| Legal Services & Support | 0 (0.0%) | 53 (100.0%) |
| Education Instruction & Library | 122 (32.8%) | 250 (67.2%) |
| Arts, Media & Entertainment | 9 (14.7%) | 52 (85.3%) |
| Health Diagnosing & Treating | 67 (26.4%) | 187 (73.6%) |
| Health Technologists | 67 (39.0%) | 105 (61.1%) |
| Total (Category) | 877 (47.2%) | 979 (52.7%) |
| Total (Overall) | 1,792 (53.8%) | 1,539 (46.2%) |
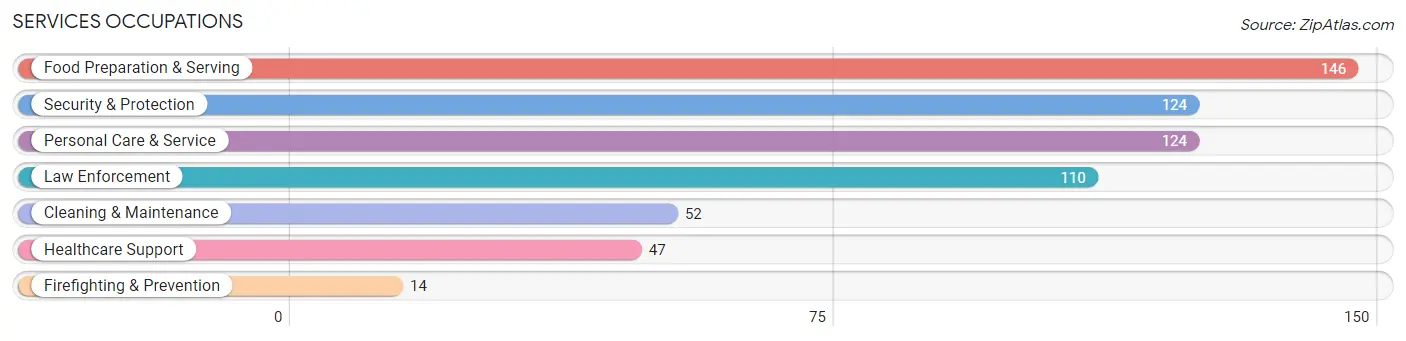
Services Occupations
The most common Services occupations in Litchfield Park are Food Preparation & Serving (146 | 4.4%), Security & Protection (124 | 3.7%), Personal Care & Service (124 | 3.7%), Law Enforcement (110 | 3.3%), and Cleaning & Maintenance (52 | 1.6%).
Services Occupations by Sex
Within the Services occupations in Litchfield Park, the most male-oriented occupations are Firefighting & Prevention (100.0%), Food Preparation & Serving (81.5%), and Security & Protection (74.2%), while the most female-oriented occupations are Healthcare Support (100.0%), Personal Care & Service (55.6%), and Cleaning & Maintenance (34.6%).

| Occupation | Male | Female |
| Healthcare Support | 0 (0.0%) | 47 (100.0%) |
| Security & Protection | 92 (74.2%) | 32 (25.8%) |
| Firefighting & Prevention | 14 (100.0%) | 0 (0.0%) |
| Law Enforcement | 78 (70.9%) | 32 (29.1%) |
| Food Preparation & Serving | 119 (81.5%) | 27 (18.5%) |
| Cleaning & Maintenance | 34 (65.4%) | 18 (34.6%) |
| Personal Care & Service | 55 (44.4%) | 69 (55.6%) |
| Total (Category) | 300 (60.9%) | 193 (39.2%) |
| Total (Overall) | 1,792 (53.8%) | 1,539 (46.2%) |
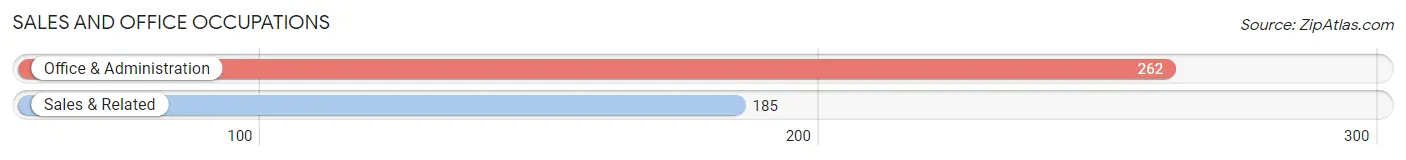
Sales and Office Occupations
The most common Sales and Office occupations in Litchfield Park are Office & Administration (262 | 7.9%), and Sales & Related (185 | 5.6%).
Sales and Office Occupations by Sex
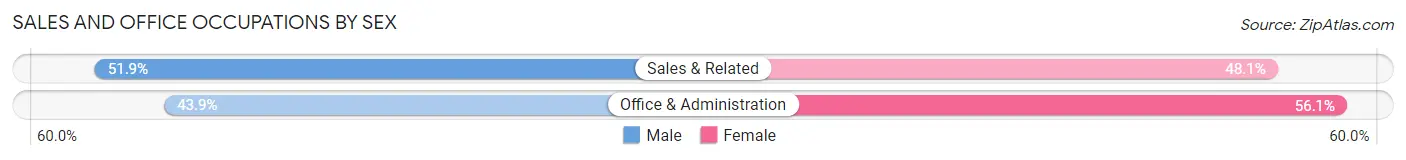
| Occupation | Male | Female |
| Sales & Related | 96 (51.9%) | 89 (48.1%) |
| Office & Administration | 115 (43.9%) | 147 (56.1%) |
| Total (Category) | 211 (47.2%) | 236 (52.8%) |
| Total (Overall) | 1,792 (53.8%) | 1,539 (46.2%) |
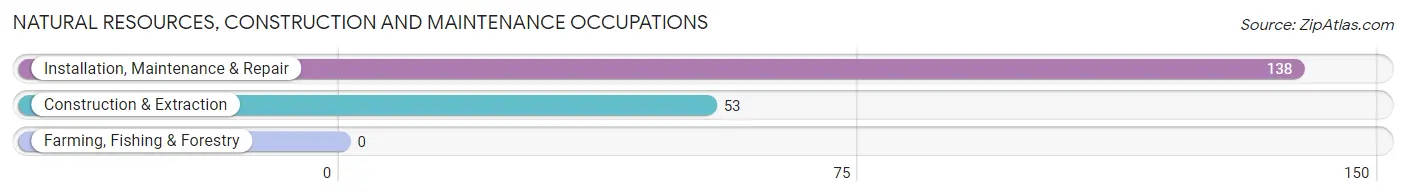
Natural Resources, Construction and Maintenance Occupations
The most common Natural Resources, Construction and Maintenance occupations in Litchfield Park are Installation, Maintenance & Repair (138 | 4.1%), and Construction & Extraction (53 | 1.6%).
Natural Resources, Construction and Maintenance Occupations by Sex
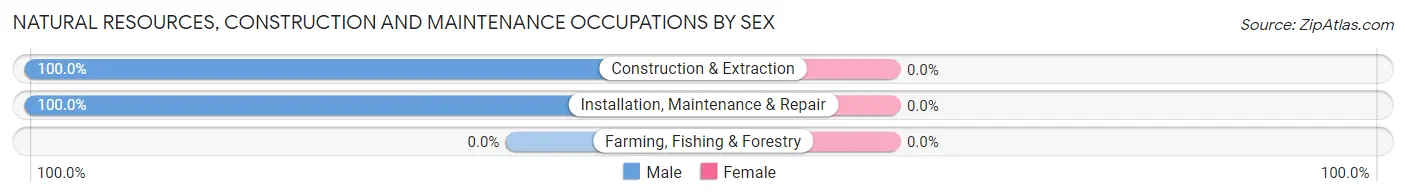
| Occupation | Male | Female |
| Farming, Fishing & Forestry | 0 (0.0%) | 0 (0.0%) |
| Construction & Extraction | 53 (100.0%) | 0 (0.0%) |
| Installation, Maintenance & Repair | 138 (100.0%) | 0 (0.0%) |
| Total (Category) | 191 (100.0%) | 0 (0.0%) |
| Total (Overall) | 1,792 (53.8%) | 1,539 (46.2%) |
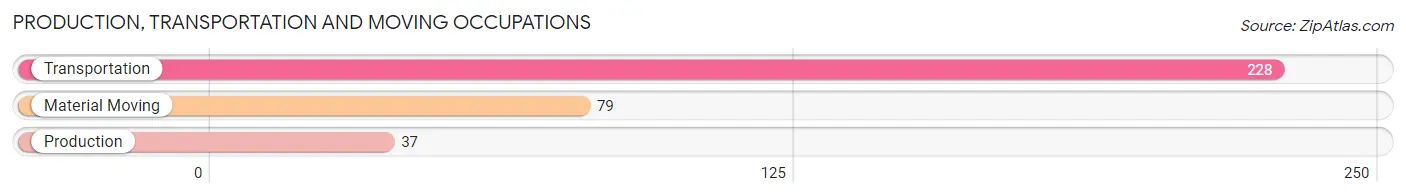
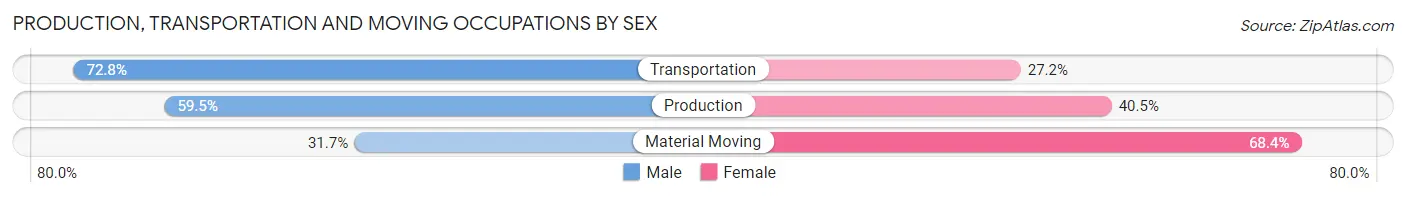
Production, Transportation and Moving Occupations
The most common Production, Transportation and Moving occupations in Litchfield Park are Transportation (228 | 6.8%), Material Moving (79 | 2.4%), and Production (37 | 1.1%).
Production, Transportation and Moving Occupations by Sex
| Occupation | Male | Female |
| Production | 22 (59.5%) | 15 (40.5%) |
| Transportation | 166 (72.8%) | 62 (27.2%) |
| Material Moving | 25 (31.7%) | 54 (68.3%) |
| Total (Category) | 213 (61.9%) | 131 (38.1%) |
| Total (Overall) | 1,792 (53.8%) | 1,539 (46.2%) |
Employment Industries by Sex in Litchfield Park
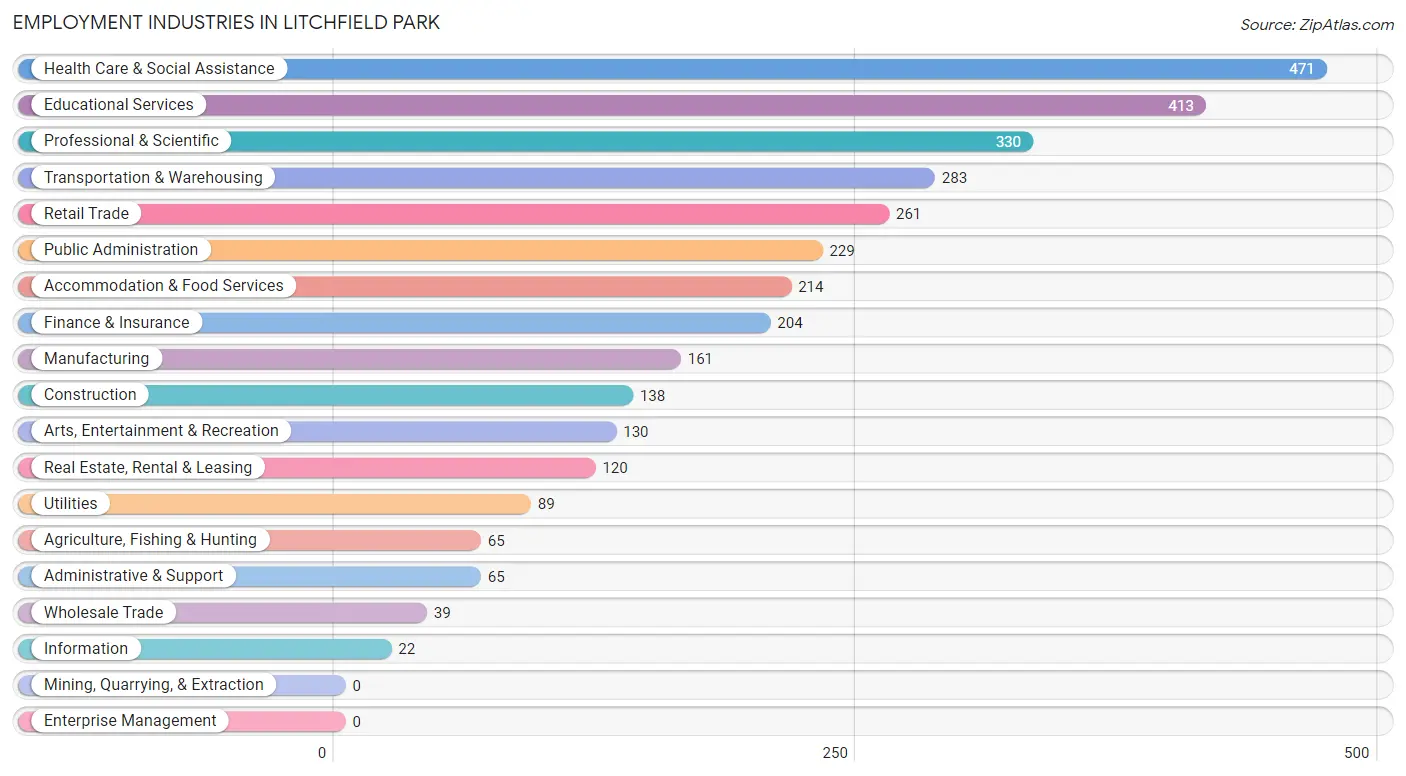
Employment Industries in Litchfield Park
The major employment industries in Litchfield Park include Health Care & Social Assistance (471 | 14.1%), Educational Services (413 | 12.4%), Professional & Scientific (330 | 9.9%), Transportation & Warehousing (283 | 8.5%), and Retail Trade (261 | 7.8%).
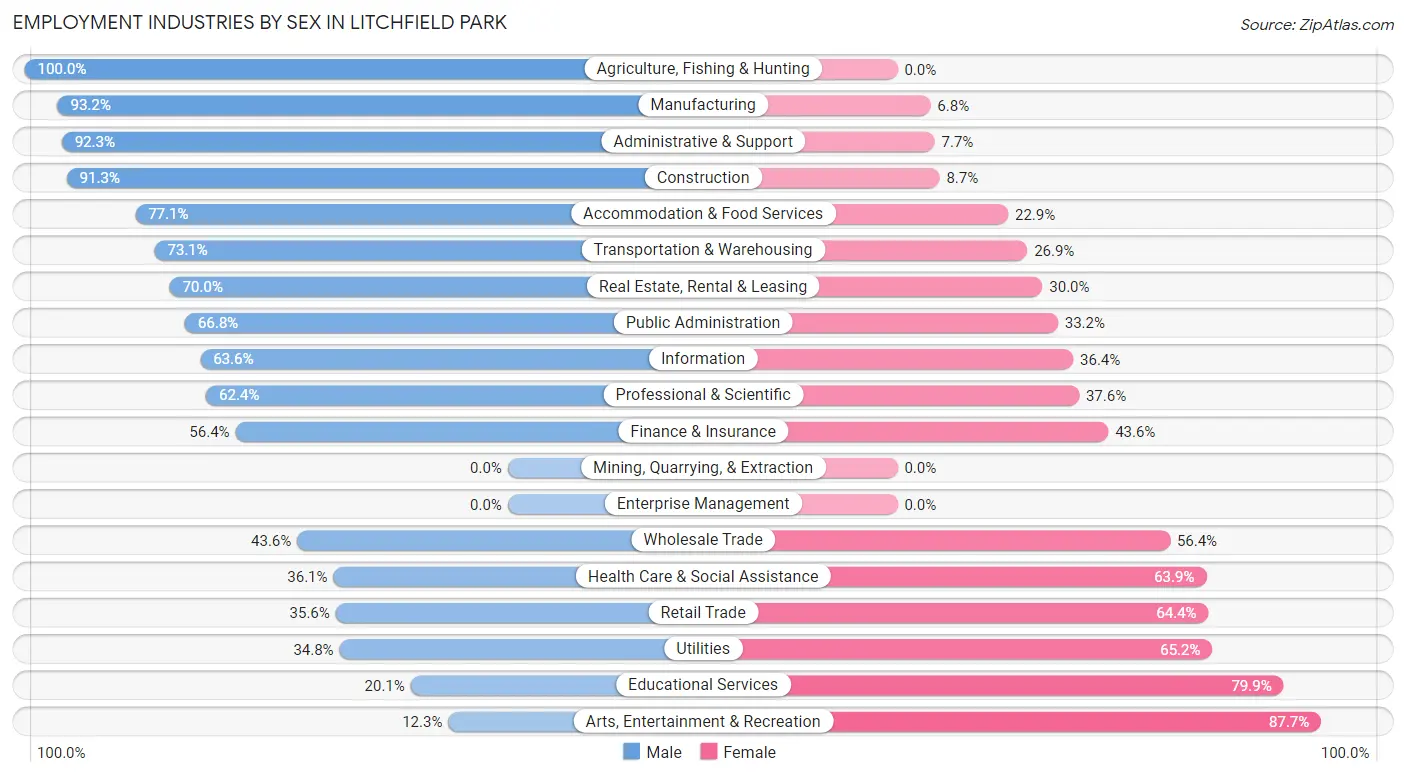
Employment Industries by Sex in Litchfield Park
The Litchfield Park industries that see more men than women are Agriculture, Fishing & Hunting (100.0%), Manufacturing (93.2%), and Administrative & Support (92.3%), whereas the industries that tend to have a higher number of women are Arts, Entertainment & Recreation (87.7%), Educational Services (79.9%), and Utilities (65.2%).
| Industry | Male | Female |
| Agriculture, Fishing & Hunting | 65 (100.0%) | 0 (0.0%) |
| Mining, Quarrying, & Extraction | 0 (0.0%) | 0 (0.0%) |
| Construction | 126 (91.3%) | 12 (8.7%) |
| Manufacturing | 150 (93.2%) | 11 (6.8%) |
| Wholesale Trade | 17 (43.6%) | 22 (56.4%) |
| Retail Trade | 93 (35.6%) | 168 (64.4%) |
| Transportation & Warehousing | 207 (73.1%) | 76 (26.9%) |
| Utilities | 31 (34.8%) | 58 (65.2%) |
| Information | 14 (63.6%) | 8 (36.4%) |
| Finance & Insurance | 115 (56.4%) | 89 (43.6%) |
| Real Estate, Rental & Leasing | 84 (70.0%) | 36 (30.0%) |
| Professional & Scientific | 206 (62.4%) | 124 (37.6%) |
| Enterprise Management | 0 (0.0%) | 0 (0.0%) |
| Administrative & Support | 60 (92.3%) | 5 (7.7%) |
| Educational Services | 83 (20.1%) | 330 (79.9%) |
| Health Care & Social Assistance | 170 (36.1%) | 301 (63.9%) |
| Arts, Entertainment & Recreation | 16 (12.3%) | 114 (87.7%) |
| Accommodation & Food Services | 165 (77.1%) | 49 (22.9%) |
| Public Administration | 153 (66.8%) | 76 (33.2%) |
| Total | 1,792 (53.8%) | 1,539 (46.2%) |
Education in Litchfield Park
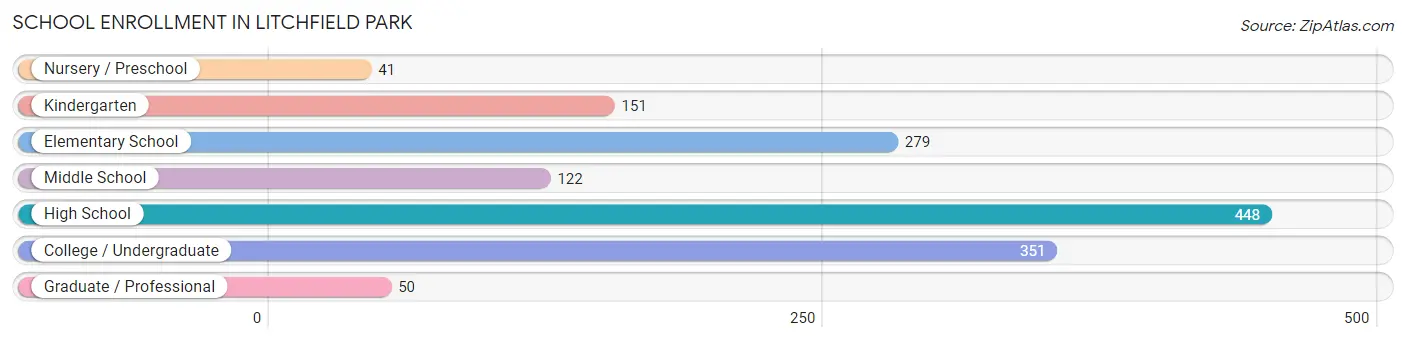
School Enrollment in Litchfield Park
The most common levels of schooling among the 1,442 students in Litchfield Park are high school (448 | 31.1%), college / undergraduate (351 | 24.3%), and elementary school (279 | 19.4%).
| School Level | # Students | % Students |
| Nursery / Preschool | 41 | 2.8% |
| Kindergarten | 151 | 10.5% |
| Elementary School | 279 | 19.4% |
| Middle School | 122 | 8.5% |
| High School | 448 | 31.1% |
| College / Undergraduate | 351 | 24.3% |
| Graduate / Professional | 50 | 3.5% |
| Total | 1,442 | 100.0% |
School Enrollment by Age by Funding Source in Litchfield Park
Out of a total of 1,442 students who are enrolled in schools in Litchfield Park, 159 (11.0%) attend a private institution, while the remaining 1,283 (89.0%) are enrolled in public schools. The age group of 35 years and over has the highest likelihood of being enrolled in private schools, with 33 (47.8% in the age bracket) enrolled. Conversely, the age group of 3 to 4 year olds has the lowest likelihood of being enrolled in a private school, with 15 (100.0% in the age bracket) attending a public institution.
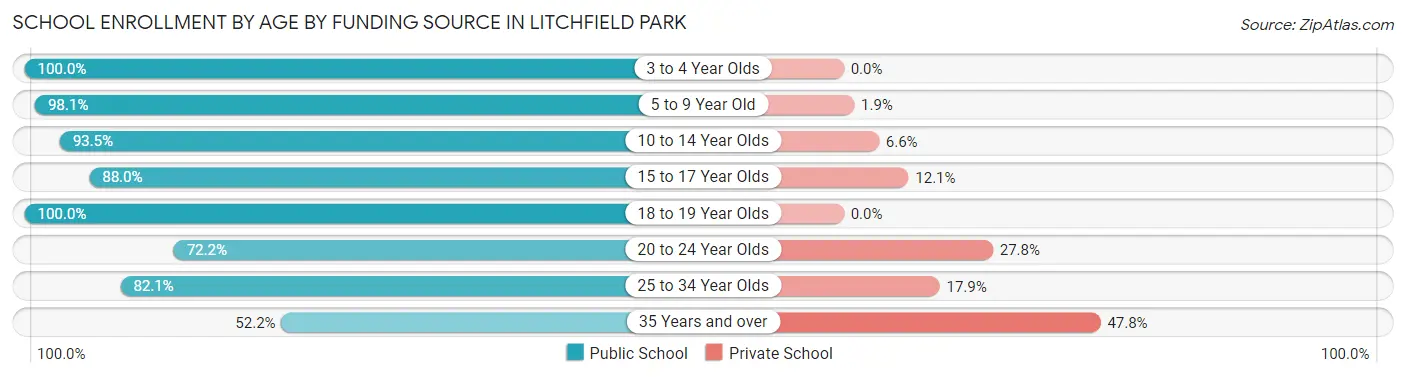
| Age Bracket | Public School | Private School |
| 3 to 4 Year Olds | 15 (100.0%) | 0 (0.0%) |
| 5 to 9 Year Old | 405 (98.1%) | 8 (1.9%) |
| 10 to 14 Year Olds | 214 (93.4%) | 15 (6.6%) |
| 15 to 17 Year Olds | 270 (87.9%) | 37 (12.0%) |
| 18 to 19 Year Olds | 145 (100.0%) | 0 (0.0%) |
| 20 to 24 Year Olds | 130 (72.2%) | 50 (27.8%) |
| 25 to 34 Year Olds | 69 (82.1%) | 15 (17.9%) |
| 35 Years and over | 36 (52.2%) | 33 (47.8%) |
| Total | 1,283 (89.0%) | 159 (11.0%) |
Educational Attainment by Field of Study in Litchfield Park
Education (671 | 25.2%), business (453 | 17.0%), social sciences (236 | 8.9%), arts & humanities (211 | 7.9%), and computers & mathematics (204 | 7.7%) are the most common fields of study among 2,660 individuals in Litchfield Park who have obtained a bachelor's degree or higher.
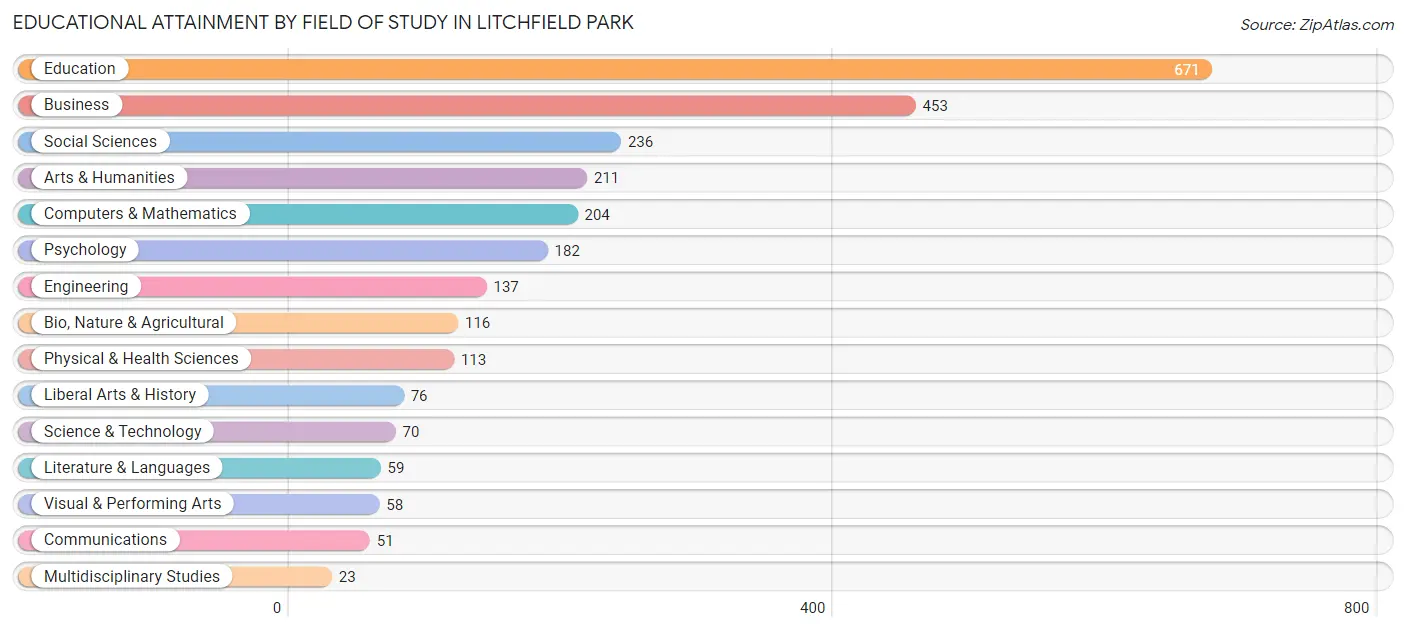
| Field of Study | # Graduates | % Graduates |
| Computers & Mathematics | 204 | 7.7% |
| Bio, Nature & Agricultural | 116 | 4.4% |
| Physical & Health Sciences | 113 | 4.3% |
| Psychology | 182 | 6.8% |
| Social Sciences | 236 | 8.9% |
| Engineering | 137 | 5.1% |
| Multidisciplinary Studies | 23 | 0.9% |
| Science & Technology | 70 | 2.6% |
| Business | 453 | 17.0% |
| Education | 671 | 25.2% |
| Literature & Languages | 59 | 2.2% |
| Liberal Arts & History | 76 | 2.9% |
| Visual & Performing Arts | 58 | 2.2% |
| Communications | 51 | 1.9% |
| Arts & Humanities | 211 | 7.9% |
| Total | 2,660 | 100.0% |
Transportation & Commute in Litchfield Park
Vehicle Availability by Sex in Litchfield Park
The most prevalent vehicle ownership categories in Litchfield Park are males with 3 vehicles (655, accounting for 37.2%) and females with 3 vehicles (541, making up 42.9%).
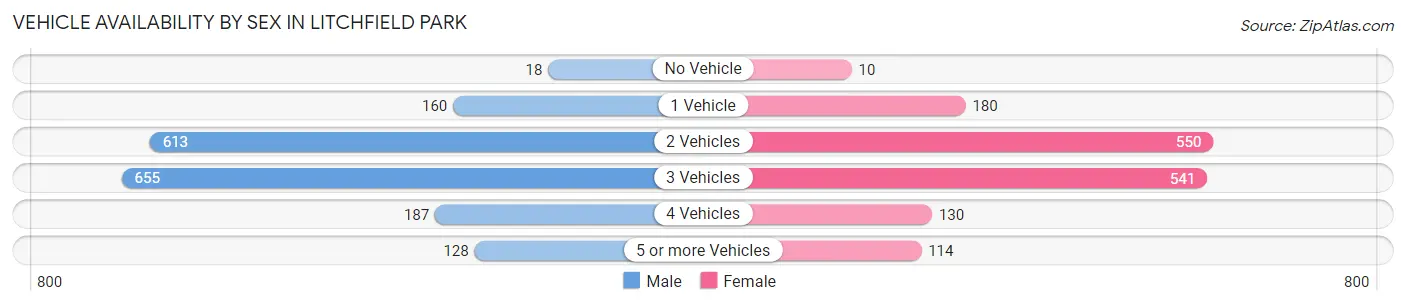
| Vehicles Available | Male | Female |
| No Vehicle | 18 (1.0%) | 10 (0.7%) |
| 1 Vehicle | 160 (9.1%) | 180 (11.8%) |
| 2 Vehicles | 613 (34.8%) | 550 (36.1%) |
| 3 Vehicles | 655 (37.2%) | 541 (35.5%) |
| 4 Vehicles | 187 (10.6%) | 130 (8.5%) |
| 5 or more Vehicles | 128 (7.3%) | 114 (7.5%) |
| Total | 1,761 (100.0%) | 1,525 (100.0%) |
Commute Time in Litchfield Park
The most frequently occuring commute durations in Litchfield Park are 5 to 9 minutes (418 commuters, 16.5%), 15 to 19 minutes (354 commuters, 14.0%), and 30 to 34 minutes (351 commuters, 13.9%).
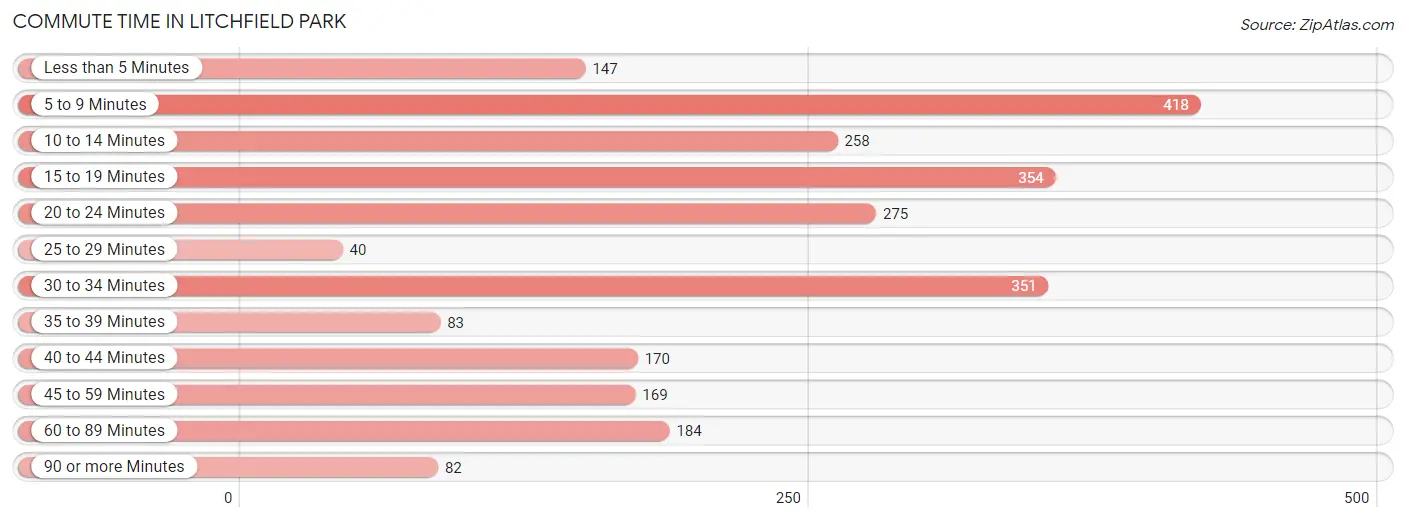
| Commute Time | # Commuters | % Commuters |
| Less than 5 Minutes | 147 | 5.8% |
| 5 to 9 Minutes | 418 | 16.5% |
| 10 to 14 Minutes | 258 | 10.2% |
| 15 to 19 Minutes | 354 | 14.0% |
| 20 to 24 Minutes | 275 | 10.9% |
| 25 to 29 Minutes | 40 | 1.6% |
| 30 to 34 Minutes | 351 | 13.9% |
| 35 to 39 Minutes | 83 | 3.3% |
| 40 to 44 Minutes | 170 | 6.7% |
| 45 to 59 Minutes | 169 | 6.7% |
| 60 to 89 Minutes | 184 | 7.3% |
| 90 or more Minutes | 82 | 3.2% |
Commute Time by Sex in Litchfield Park
The most common commute times in Litchfield Park are 15 to 19 minutes (218 commuters, 16.0%) for males and 5 to 9 minutes (209 commuters, 17.9%) for females.
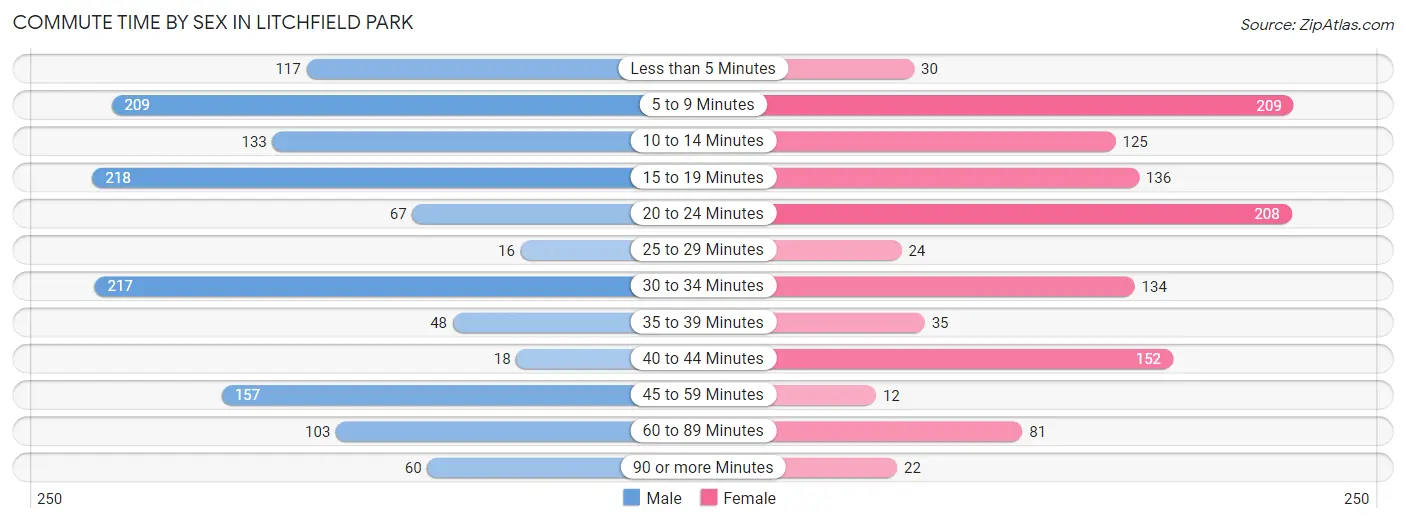
| Commute Time | Male | Female |
| Less than 5 Minutes | 117 (8.6%) | 30 (2.6%) |
| 5 to 9 Minutes | 209 (15.3%) | 209 (17.9%) |
| 10 to 14 Minutes | 133 (9.8%) | 125 (10.7%) |
| 15 to 19 Minutes | 218 (16.0%) | 136 (11.6%) |
| 20 to 24 Minutes | 67 (4.9%) | 208 (17.8%) |
| 25 to 29 Minutes | 16 (1.2%) | 24 (2.1%) |
| 30 to 34 Minutes | 217 (15.9%) | 134 (11.5%) |
| 35 to 39 Minutes | 48 (3.5%) | 35 (3.0%) |
| 40 to 44 Minutes | 18 (1.3%) | 152 (13.0%) |
| 45 to 59 Minutes | 157 (11.5%) | 12 (1.0%) |
| 60 to 89 Minutes | 103 (7.6%) | 81 (6.9%) |
| 90 or more Minutes | 60 (4.4%) | 22 (1.9%) |
Time of Departure to Work by Sex in Litchfield Park
The most frequent times of departure to work in Litchfield Park are 7:30 AM to 7:59 AM (189, 13.9%) for males and 5:30 AM to 5:59 AM (171, 14.6%) for females.
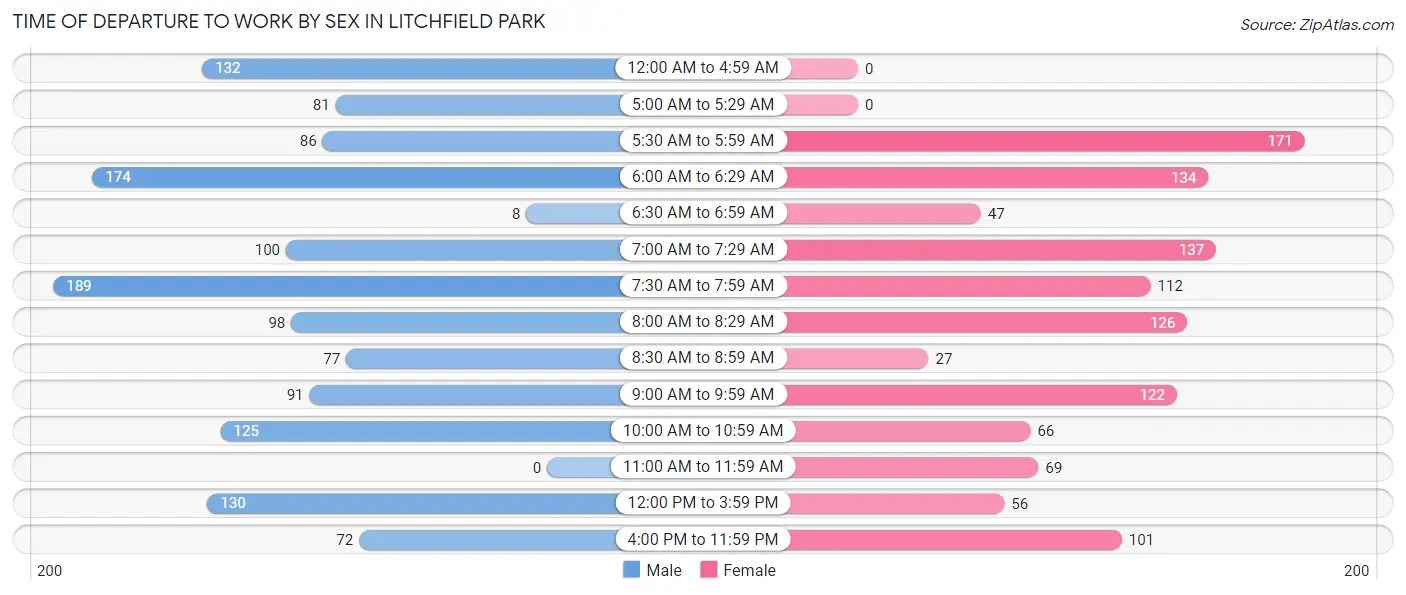
| Time of Departure | Male | Female |
| 12:00 AM to 4:59 AM | 132 (9.7%) | 0 (0.0%) |
| 5:00 AM to 5:29 AM | 81 (5.9%) | 0 (0.0%) |
| 5:30 AM to 5:59 AM | 86 (6.3%) | 171 (14.6%) |
| 6:00 AM to 6:29 AM | 174 (12.8%) | 134 (11.5%) |
| 6:30 AM to 6:59 AM | 8 (0.6%) | 47 (4.0%) |
| 7:00 AM to 7:29 AM | 100 (7.3%) | 137 (11.7%) |
| 7:30 AM to 7:59 AM | 189 (13.9%) | 112 (9.6%) |
| 8:00 AM to 8:29 AM | 98 (7.2%) | 126 (10.8%) |
| 8:30 AM to 8:59 AM | 77 (5.7%) | 27 (2.3%) |
| 9:00 AM to 9:59 AM | 91 (6.7%) | 122 (10.4%) |
| 10:00 AM to 10:59 AM | 125 (9.2%) | 66 (5.7%) |
| 11:00 AM to 11:59 AM | 0 (0.0%) | 69 (5.9%) |
| 12:00 PM to 3:59 PM | 130 (9.5%) | 56 (4.8%) |
| 4:00 PM to 11:59 PM | 72 (5.3%) | 101 (8.6%) |
| Total | 1,363 (100.0%) | 1,168 (100.0%) |
Housing Occupancy in Litchfield Park
Occupancy by Ownership in Litchfield Park
Of the total 2,780 dwellings in Litchfield Park, owner-occupied units account for 2,326 (83.7%), while renter-occupied units make up 454 (16.3%).
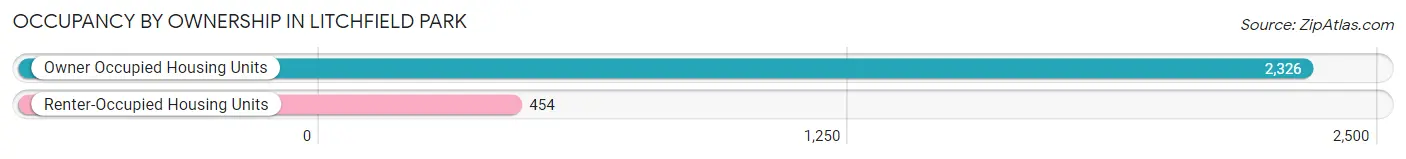
| Occupancy | # Housing Units | % Housing Units |
| Owner Occupied Housing Units | 2,326 | 83.7% |
| Renter-Occupied Housing Units | 454 | 16.3% |
| Total Occupied Housing Units | 2,780 | 100.0% |
Occupancy by Household Size in Litchfield Park
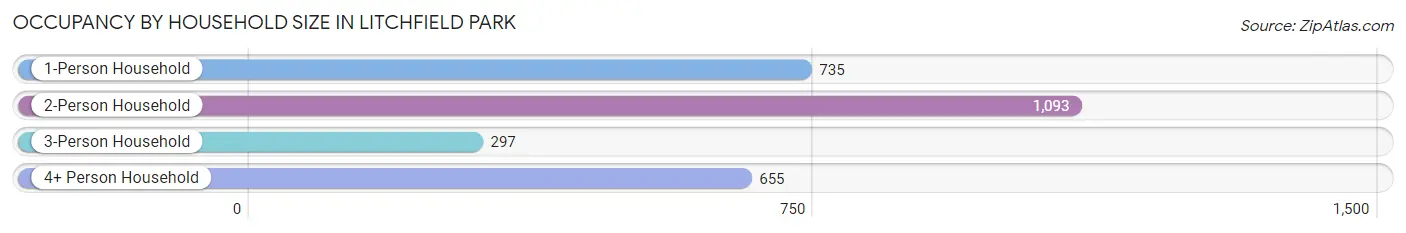
| Household Size | # Housing Units | % Housing Units |
| 1-Person Household | 735 | 26.4% |
| 2-Person Household | 1,093 | 39.3% |
| 3-Person Household | 297 | 10.7% |
| 4+ Person Household | 655 | 23.6% |
| Total Housing Units | 2,780 | 100.0% |
Occupancy by Ownership by Household Size in Litchfield Park
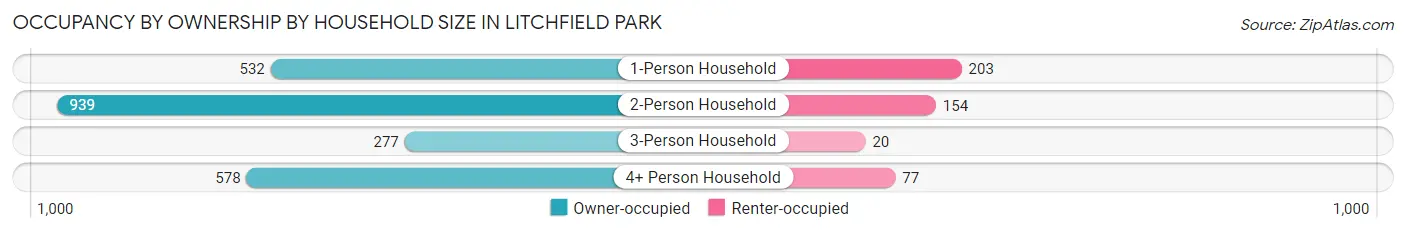
| Household Size | Owner-occupied | Renter-occupied |
| 1-Person Household | 532 (72.4%) | 203 (27.6%) |
| 2-Person Household | 939 (85.9%) | 154 (14.1%) |
| 3-Person Household | 277 (93.3%) | 20 (6.7%) |
| 4+ Person Household | 578 (88.2%) | 77 (11.8%) |
| Total Housing Units | 2,326 (83.7%) | 454 (16.3%) |
Occupancy by Educational Attainment in Litchfield Park
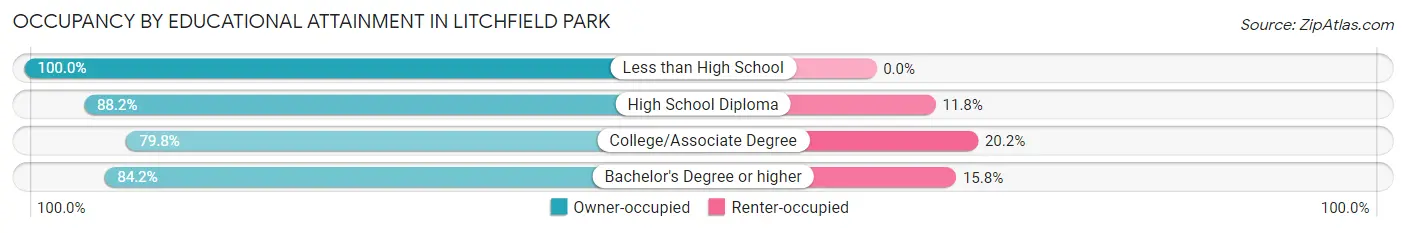
| Household Size | Owner-occupied | Renter-occupied |
| Less than High School | 31 (100.0%) | 0 (0.0%) |
| High School Diploma | 382 (88.2%) | 51 (11.8%) |
| College/Associate Degree | 668 (79.8%) | 169 (20.2%) |
| Bachelor's Degree or higher | 1,245 (84.2%) | 234 (15.8%) |
Occupancy by Age of Householder in Litchfield Park
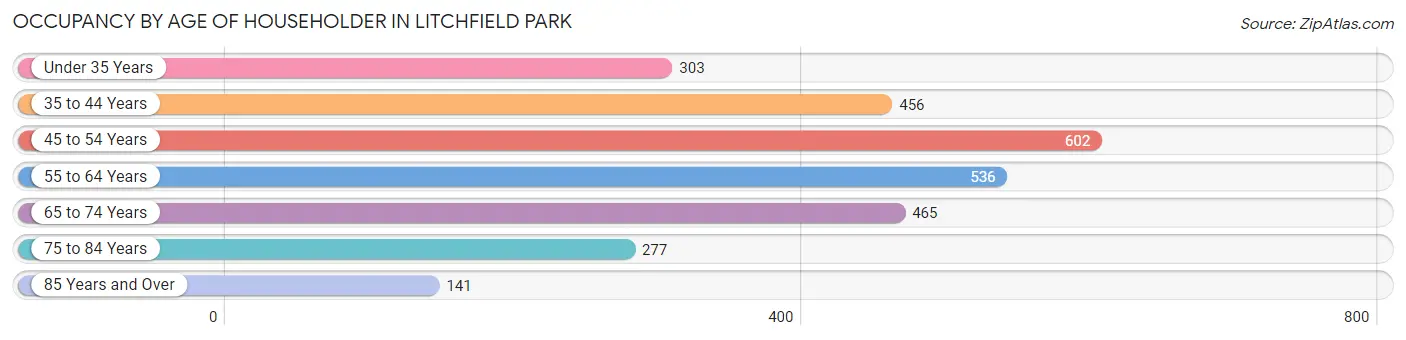
| Age Bracket | # Households | % Households |
| Under 35 Years | 303 | 10.9% |
| 35 to 44 Years | 456 | 16.4% |
| 45 to 54 Years | 602 | 21.6% |
| 55 to 64 Years | 536 | 19.3% |
| 65 to 74 Years | 465 | 16.7% |
| 75 to 84 Years | 277 | 10.0% |
| 85 Years and Over | 141 | 5.1% |
| Total | 2,780 | 100.0% |
Housing Finances in Litchfield Park
Median Income by Occupancy in Litchfield Park
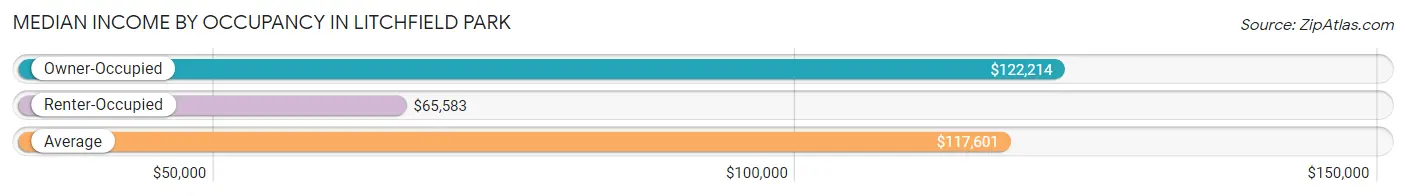
| Occupancy Type | # Households | Median Income |
| Owner-Occupied | 2,326 (83.7%) | $122,214 |
| Renter-Occupied | 454 (16.3%) | $65,583 |
| Average | 2,780 (100.0%) | $117,601 |
Occupancy by Householder Income Bracket in Litchfield Park
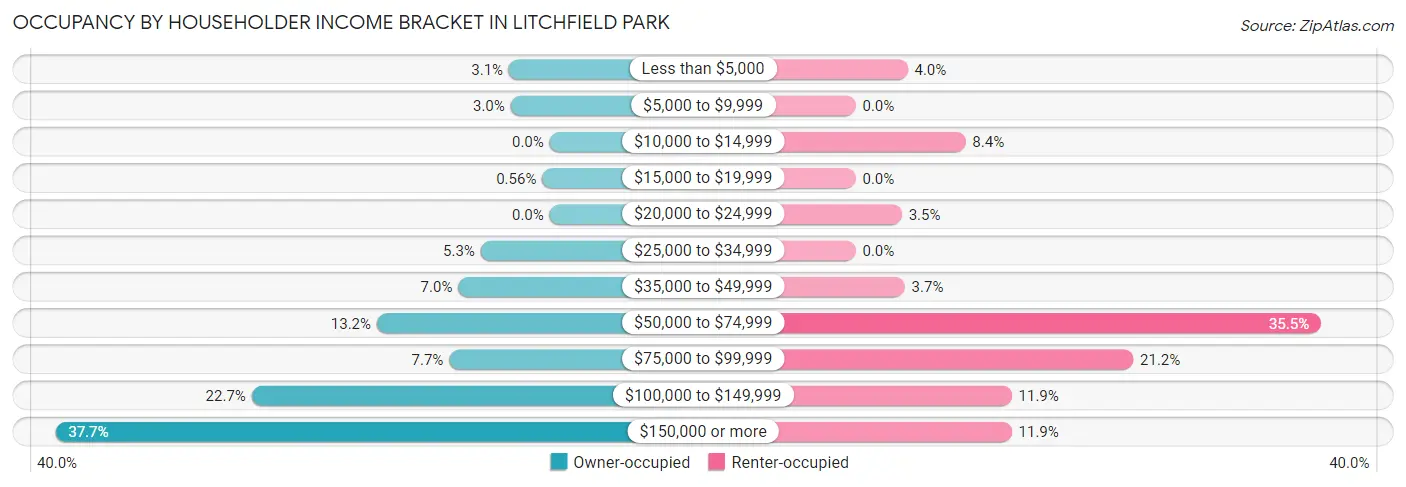
| Income Bracket | Owner-occupied | Renter-occupied |
| Less than $5,000 | 72 (3.1%) | 18 (4.0%) |
| $5,000 to $9,999 | 69 (3.0%) | 0 (0.0%) |
| $10,000 to $14,999 | 0 (0.0%) | 38 (8.4%) |
| $15,000 to $19,999 | 13 (0.6%) | 0 (0.0%) |
| $20,000 to $24,999 | 0 (0.0%) | 16 (3.5%) |
| $25,000 to $34,999 | 122 (5.2%) | 0 (0.0%) |
| $35,000 to $49,999 | 162 (7.0%) | 17 (3.7%) |
| $50,000 to $74,999 | 306 (13.2%) | 161 (35.5%) |
| $75,000 to $99,999 | 178 (7.6%) | 96 (21.1%) |
| $100,000 to $149,999 | 528 (22.7%) | 54 (11.9%) |
| $150,000 or more | 876 (37.7%) | 54 (11.9%) |
| Total | 2,326 (100.0%) | 454 (100.0%) |
Monthly Housing Cost Tiers in Litchfield Park
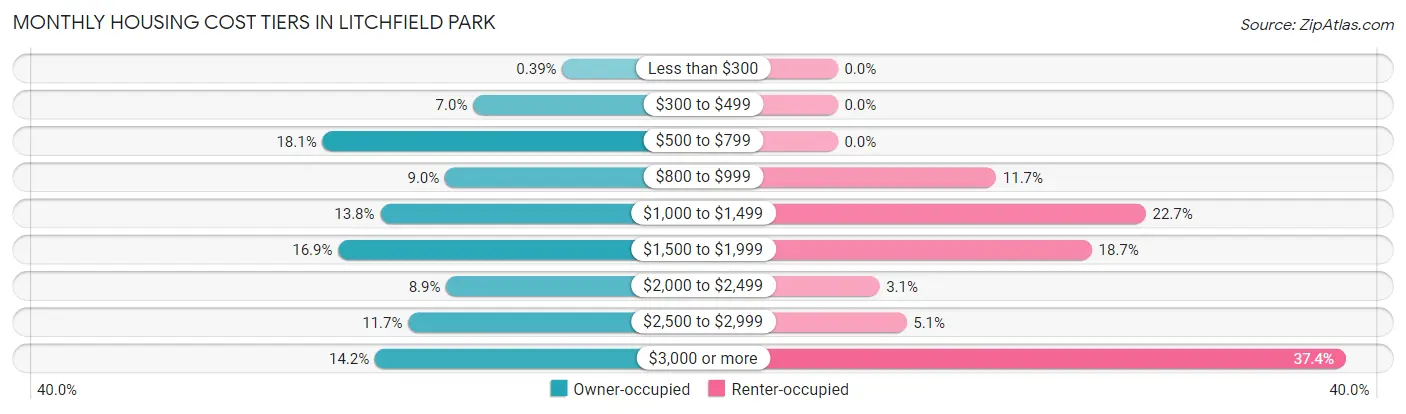
| Monthly Cost | Owner-occupied | Renter-occupied |
| Less than $300 | 9 (0.4%) | 0 (0.0%) |
| $300 to $499 | 162 (7.0%) | 0 (0.0%) |
| $500 to $799 | 420 (18.1%) | 0 (0.0%) |
| $800 to $999 | 210 (9.0%) | 53 (11.7%) |
| $1,000 to $1,499 | 321 (13.8%) | 103 (22.7%) |
| $1,500 to $1,999 | 393 (16.9%) | 85 (18.7%) |
| $2,000 to $2,499 | 208 (8.9%) | 14 (3.1%) |
| $2,500 to $2,999 | 273 (11.7%) | 23 (5.1%) |
| $3,000 or more | 330 (14.2%) | 170 (37.4%) |
| Total | 2,326 (100.0%) | 454 (100.0%) |
Physical Housing Characteristics in Litchfield Park
Housing Structures in Litchfield Park
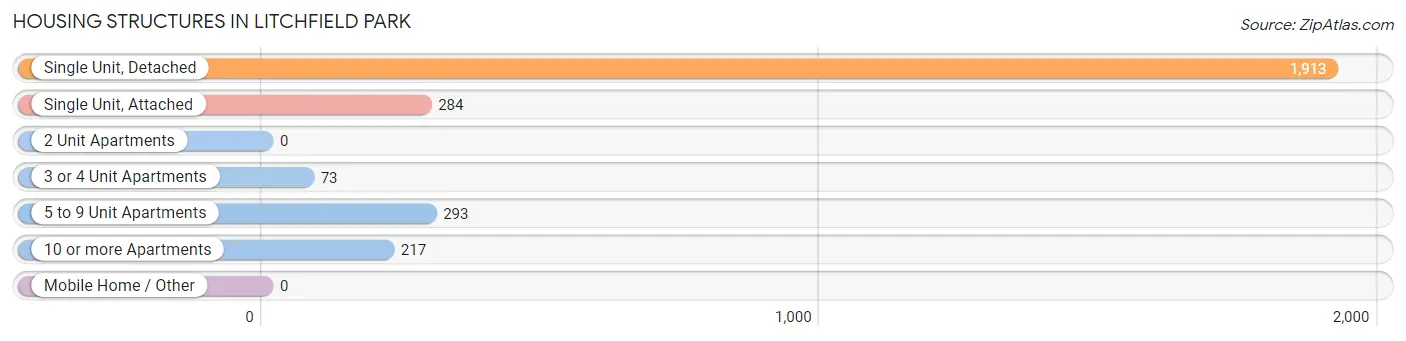
| Structure Type | # Housing Units | % Housing Units |
| Single Unit, Detached | 1,913 | 68.8% |
| Single Unit, Attached | 284 | 10.2% |
| 2 Unit Apartments | 0 | 0.0% |
| 3 or 4 Unit Apartments | 73 | 2.6% |
| 5 to 9 Unit Apartments | 293 | 10.5% |
| 10 or more Apartments | 217 | 7.8% |
| Mobile Home / Other | 0 | 0.0% |
| Total | 2,780 | 100.0% |
Housing Structures by Occupancy in Litchfield Park
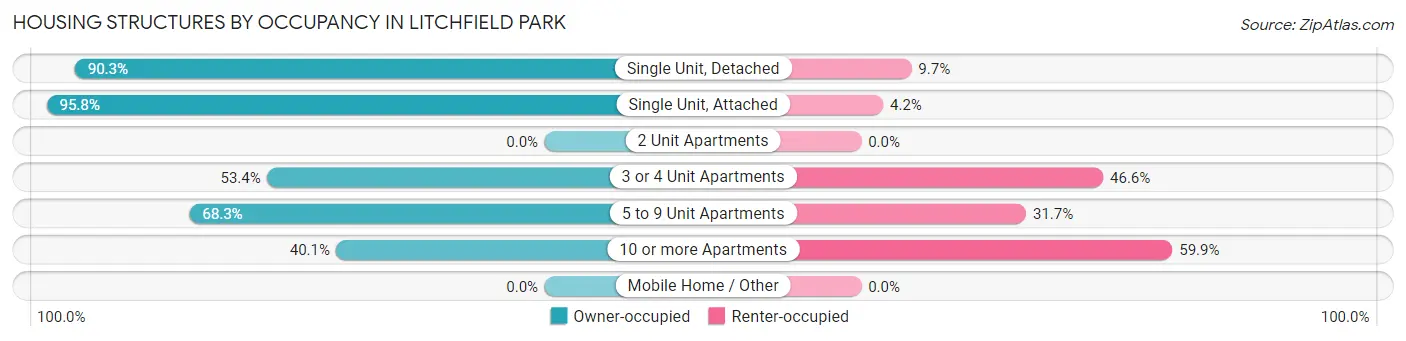
| Structure Type | Owner-occupied | Renter-occupied |
| Single Unit, Detached | 1,728 (90.3%) | 185 (9.7%) |
| Single Unit, Attached | 272 (95.8%) | 12 (4.2%) |
| 2 Unit Apartments | 0 (0.0%) | 0 (0.0%) |
| 3 or 4 Unit Apartments | 39 (53.4%) | 34 (46.6%) |
| 5 to 9 Unit Apartments | 200 (68.3%) | 93 (31.7%) |
| 10 or more Apartments | 87 (40.1%) | 130 (59.9%) |
| Mobile Home / Other | 0 (0.0%) | 0 (0.0%) |
| Total | 2,326 (83.7%) | 454 (16.3%) |
Housing Structures by Number of Rooms in Litchfield Park
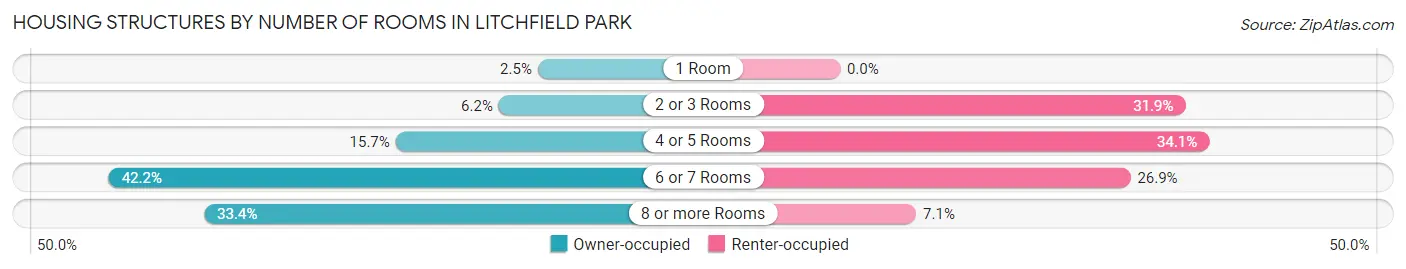
| Number of Rooms | Owner-occupied | Renter-occupied |
| 1 Room | 59 (2.5%) | 0 (0.0%) |
| 2 or 3 Rooms | 143 (6.1%) | 145 (31.9%) |
| 4 or 5 Rooms | 365 (15.7%) | 155 (34.1%) |
| 6 or 7 Rooms | 982 (42.2%) | 122 (26.9%) |
| 8 or more Rooms | 777 (33.4%) | 32 (7.0%) |
| Total | 2,326 (100.0%) | 454 (100.0%) |
Housing Structure by Heating Type in Litchfield Park
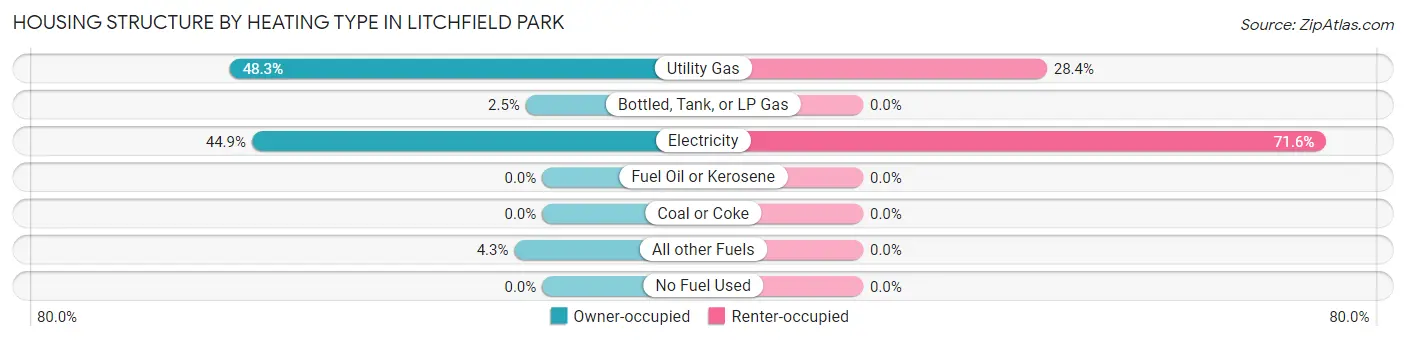
| Heating Type | Owner-occupied | Renter-occupied |
| Utility Gas | 1,123 (48.3%) | 129 (28.4%) |
| Bottled, Tank, or LP Gas | 59 (2.5%) | 0 (0.0%) |
| Electricity | 1,044 (44.9%) | 325 (71.6%) |
| Fuel Oil or Kerosene | 0 (0.0%) | 0 (0.0%) |
| Coal or Coke | 0 (0.0%) | 0 (0.0%) |
| All other Fuels | 100 (4.3%) | 0 (0.0%) |
| No Fuel Used | 0 (0.0%) | 0 (0.0%) |
| Total | 2,326 (100.0%) | 454 (100.0%) |
Household Vehicle Usage in Litchfield Park
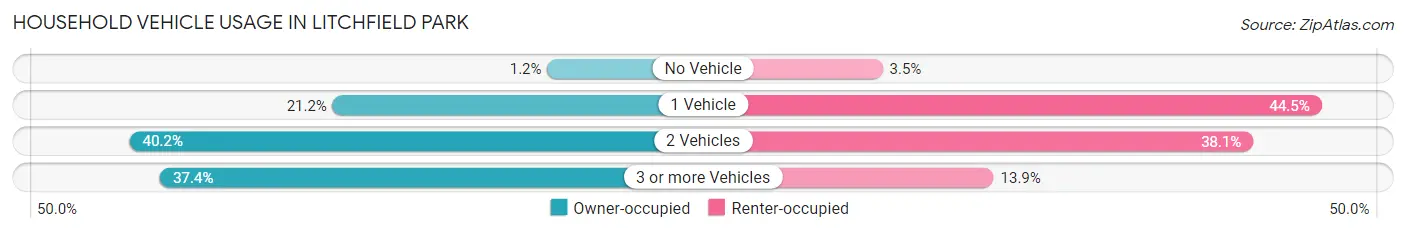
| Vehicles per Household | Owner-occupied | Renter-occupied |
| No Vehicle | 28 (1.2%) | 16 (3.5%) |
| 1 Vehicle | 494 (21.2%) | 202 (44.5%) |
| 2 Vehicles | 935 (40.2%) | 173 (38.1%) |
| 3 or more Vehicles | 869 (37.4%) | 63 (13.9%) |
| Total | 2,326 (100.0%) | 454 (100.0%) |
Real Estate & Mortgages in Litchfield Park
Real Estate and Mortgage Overview in Litchfield Park
| Characteristic | Without Mortgage | With Mortgage |
| Housing Units | 799 | 1,527 |
| Median Property Value | $485,600 | $466,500 |
| Median Household Income | $118,729 | $634 |
| Monthly Housing Costs | $689 | $330 |
| Real Estate Taxes | $2,628 | $8 |
Property Value by Mortgage Status in Litchfield Park
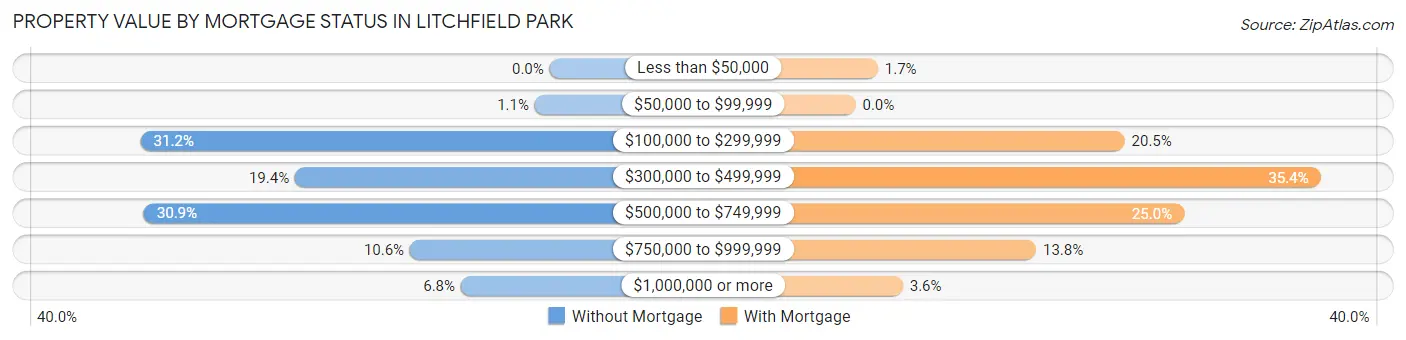
| Property Value | Without Mortgage | With Mortgage |
| Less than $50,000 | 0 (0.0%) | 26 (1.7%) |
| $50,000 to $99,999 | 9 (1.1%) | 0 (0.0%) |
| $100,000 to $299,999 | 249 (31.2%) | 313 (20.5%) |
| $300,000 to $499,999 | 155 (19.4%) | 541 (35.4%) |
| $500,000 to $749,999 | 247 (30.9%) | 382 (25.0%) |
| $750,000 to $999,999 | 85 (10.6%) | 210 (13.8%) |
| $1,000,000 or more | 54 (6.8%) | 55 (3.6%) |
| Total | 799 (100.0%) | 1,527 (100.0%) |
Household Income by Mortgage Status in Litchfield Park
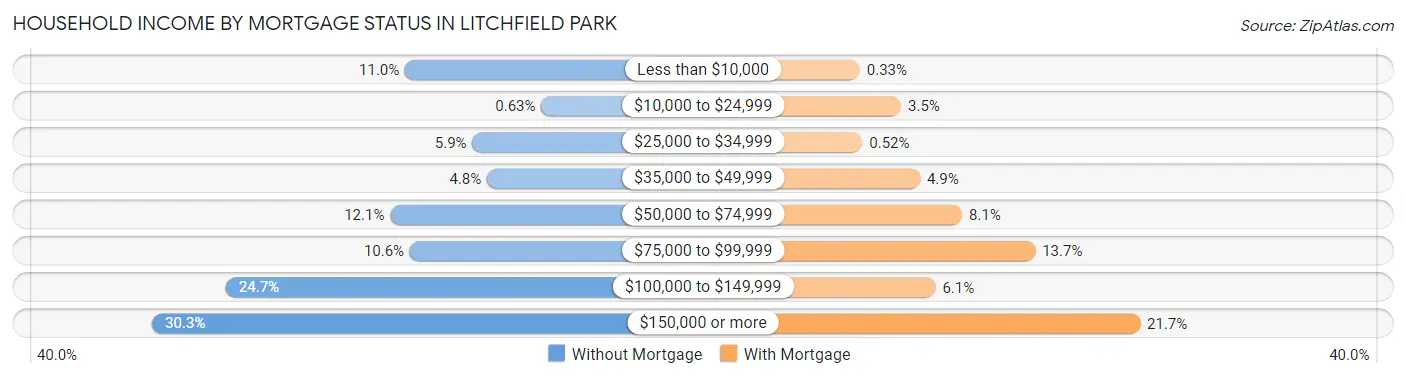
| Household Income | Without Mortgage | With Mortgage |
| Less than $10,000 | 88 (11.0%) | 5 (0.3%) |
| $10,000 to $24,999 | 5 (0.6%) | 53 (3.5%) |
| $25,000 to $34,999 | 47 (5.9%) | 8 (0.5%) |
| $35,000 to $49,999 | 38 (4.8%) | 75 (4.9%) |
| $50,000 to $74,999 | 97 (12.1%) | 124 (8.1%) |
| $75,000 to $99,999 | 85 (10.6%) | 209 (13.7%) |
| $100,000 to $149,999 | 197 (24.7%) | 93 (6.1%) |
| $150,000 or more | 242 (30.3%) | 331 (21.7%) |
| Total | 799 (100.0%) | 1,527 (100.0%) |
Property Value to Household Income Ratio in Litchfield Park
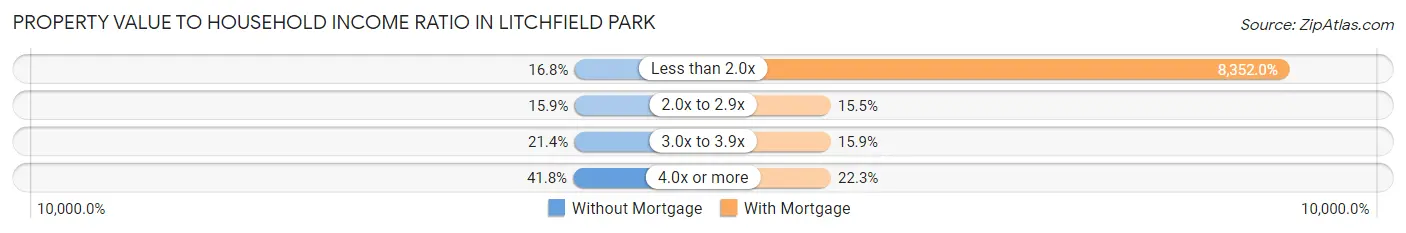
| Value-to-Income Ratio | Without Mortgage | With Mortgage |
| Less than 2.0x | 134 (16.8%) | 127,535 (8,352.0%) |
| 2.0x to 2.9x | 127 (15.9%) | 237 (15.5%) |
| 3.0x to 3.9x | 171 (21.4%) | 243 (15.9%) |
| 4.0x or more | 334 (41.8%) | 340 (22.3%) |
| Total | 799 (100.0%) | 1,527 (100.0%) |
Real Estate Taxes by Mortgage Status in Litchfield Park
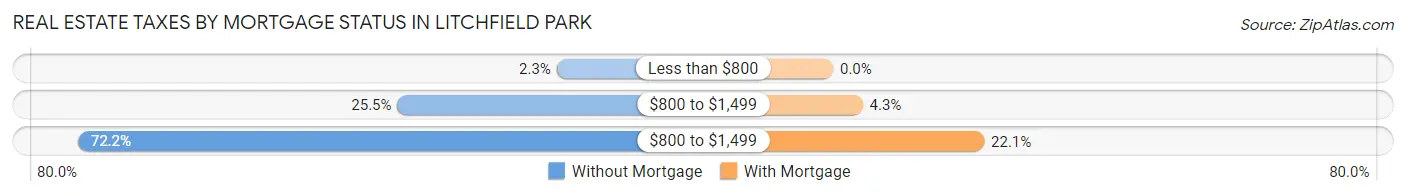
| Property Taxes | Without Mortgage | With Mortgage |
| Less than $800 | 18 (2.2%) | 0 (0.0%) |
| $800 to $1,499 | 204 (25.5%) | 66 (4.3%) |
| $800 to $1,499 | 577 (72.2%) | 337 (22.1%) |
| Total | 799 (100.0%) | 1,527 (100.0%) |
Health & Disability in Litchfield Park
Health Insurance Coverage by Age in Litchfield Park
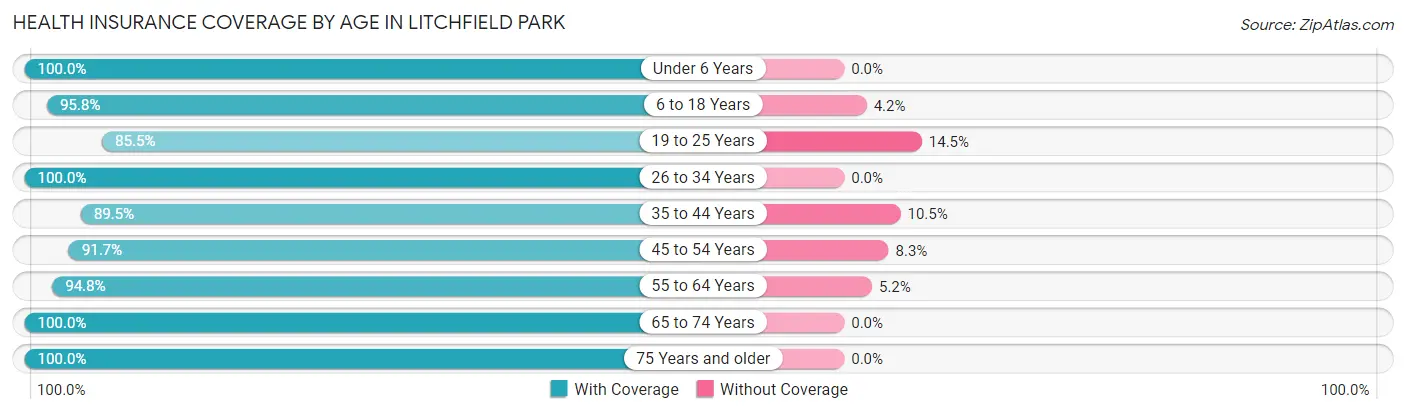
| Age Bracket | With Coverage | Without Coverage |
| Under 6 Years | 376 (100.0%) | 0 (0.0%) |
| 6 to 18 Years | 963 (95.8%) | 42 (4.2%) |
| 19 to 25 Years | 337 (85.5%) | 57 (14.5%) |
| 26 to 34 Years | 499 (100.0%) | 0 (0.0%) |
| 35 to 44 Years | 734 (89.5%) | 86 (10.5%) |
| 45 to 54 Years | 1,077 (91.7%) | 97 (8.3%) |
| 55 to 64 Years | 953 (94.8%) | 52 (5.2%) |
| 65 to 74 Years | 821 (100.0%) | 0 (0.0%) |
| 75 Years and older | 608 (100.0%) | 0 (0.0%) |
| Total | 6,368 (95.0%) | 334 (5.0%) |
Health Insurance Coverage by Citizenship Status in Litchfield Park
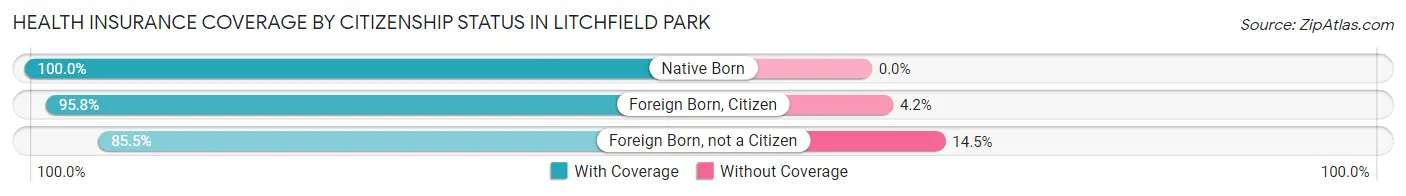
| Citizenship Status | With Coverage | Without Coverage |
| Native Born | 376 (100.0%) | 0 (0.0%) |
| Foreign Born, Citizen | 963 (95.8%) | 42 (4.2%) |
| Foreign Born, not a Citizen | 337 (85.5%) | 57 (14.5%) |
Health Insurance Coverage by Household Income in Litchfield Park
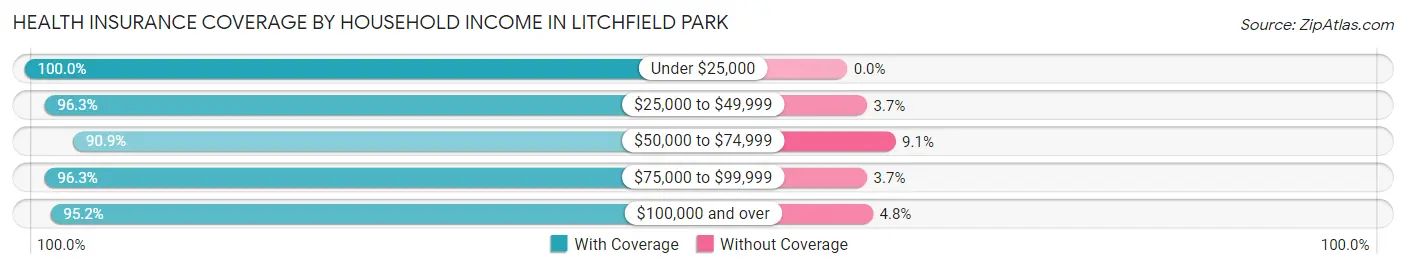
| Household Income | With Coverage | Without Coverage |
| Under $25,000 | 314 (100.0%) | 0 (0.0%) |
| $25,000 to $49,999 | 469 (96.3%) | 18 (3.7%) |
| $50,000 to $74,999 | 793 (90.9%) | 79 (9.1%) |
| $75,000 to $99,999 | 569 (96.3%) | 22 (3.7%) |
| $100,000 and over | 4,223 (95.2%) | 215 (4.8%) |
Public vs Private Health Insurance Coverage by Age in Litchfield Park
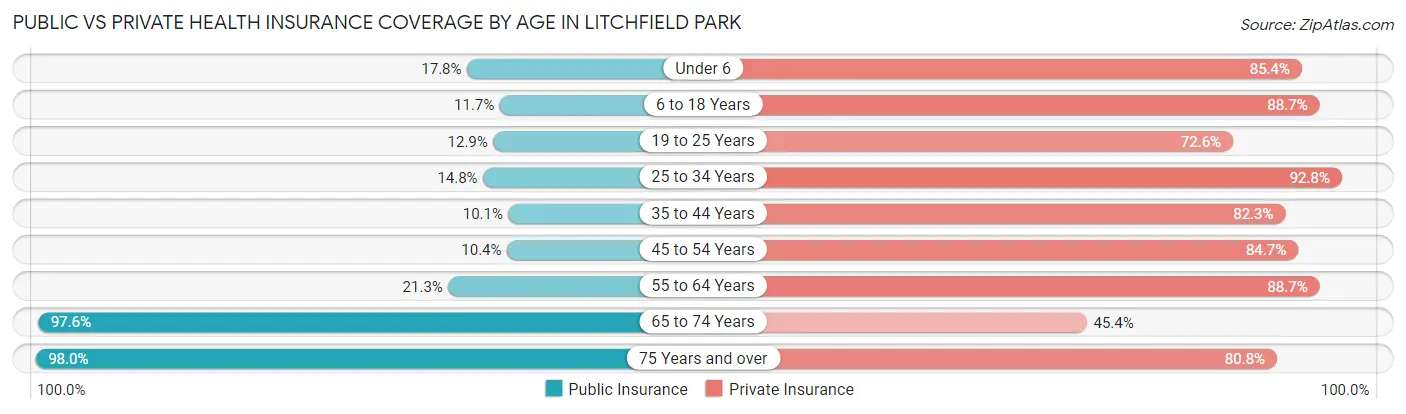
| Age Bracket | Public Insurance | Private Insurance |
| Under 6 | 67 (17.8%) | 321 (85.4%) |
| 6 to 18 Years | 118 (11.7%) | 891 (88.7%) |
| 19 to 25 Years | 51 (12.9%) | 286 (72.6%) |
| 25 to 34 Years | 74 (14.8%) | 463 (92.8%) |
| 35 to 44 Years | 83 (10.1%) | 675 (82.3%) |
| 45 to 54 Years | 122 (10.4%) | 994 (84.7%) |
| 55 to 64 Years | 214 (21.3%) | 891 (88.7%) |
| 65 to 74 Years | 801 (97.6%) | 373 (45.4%) |
| 75 Years and over | 596 (98.0%) | 491 (80.8%) |
| Total | 2,126 (31.7%) | 5,385 (80.3%) |
Disability Status by Sex by Age in Litchfield Park
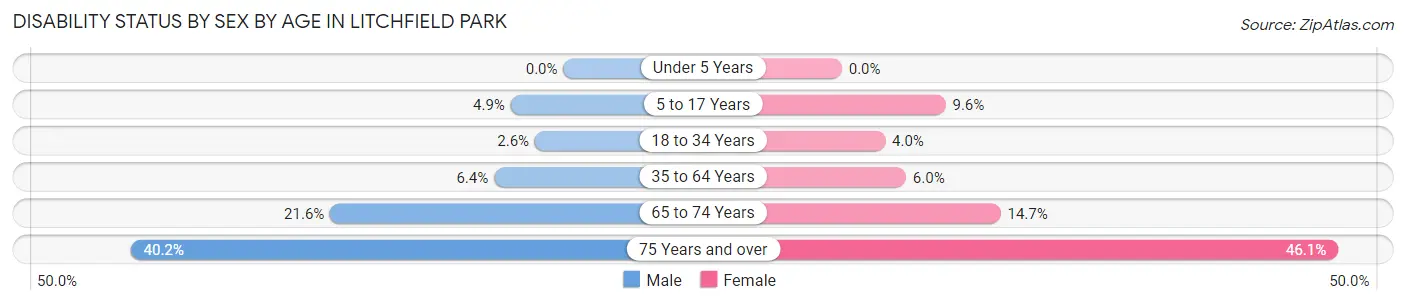
| Age Bracket | Male | Female |
| Under 5 Years | 0 (0.0%) | 0 (0.0%) |
| 5 to 17 Years | 29 (4.9%) | 39 (9.6%) |
| 18 to 34 Years | 11 (2.6%) | 24 (4.0%) |
| 35 to 64 Years | 101 (6.4%) | 85 (5.9%) |
| 65 to 74 Years | 66 (21.6%) | 76 (14.7%) |
| 75 Years and over | 102 (40.2%) | 163 (46.1%) |
Disability Class by Sex by Age in Litchfield Park
Disability Class: Hearing Difficulty
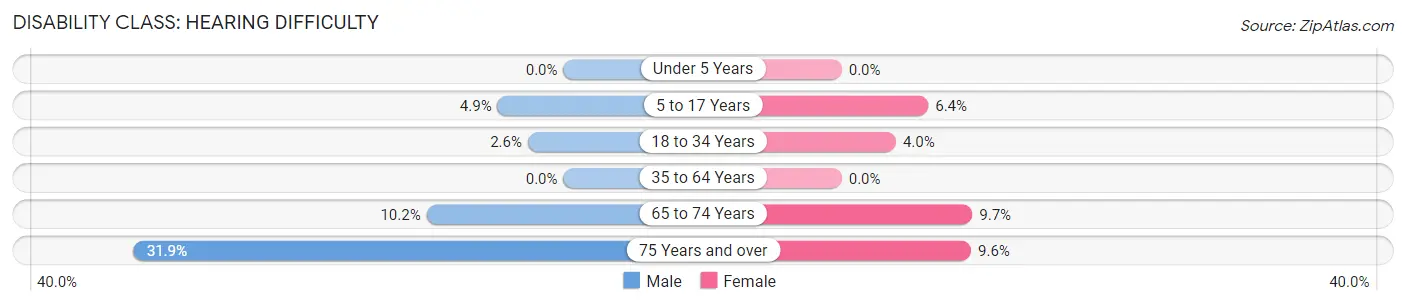
| Age Bracket | Male | Female |
| Under 5 Years | 0 (0.0%) | 0 (0.0%) |
| 5 to 17 Years | 29 (4.9%) | 26 (6.4%) |
| 18 to 34 Years | 11 (2.6%) | 24 (4.0%) |
| 35 to 64 Years | 0 (0.0%) | 0 (0.0%) |
| 65 to 74 Years | 31 (10.2%) | 50 (9.7%) |
| 75 Years and over | 81 (31.9%) | 34 (9.6%) |
Disability Class: Vision Difficulty
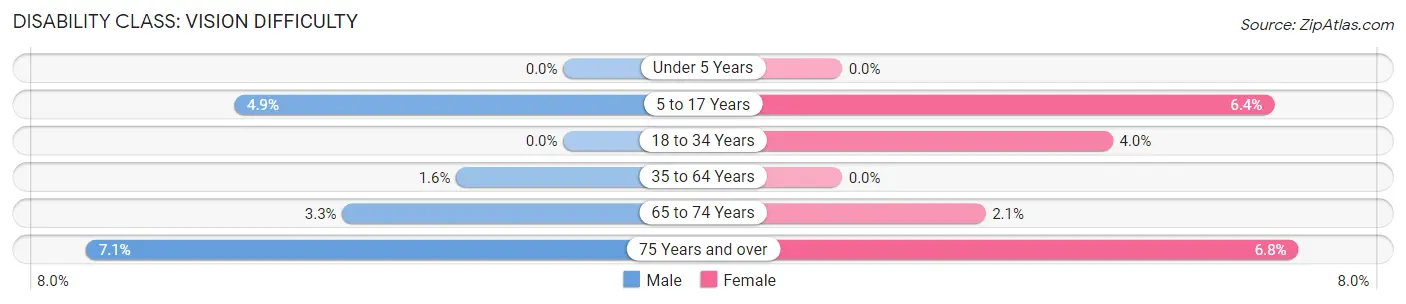
| Age Bracket | Male | Female |
| Under 5 Years | 0 (0.0%) | 0 (0.0%) |
| 5 to 17 Years | 29 (4.9%) | 26 (6.4%) |
| 18 to 34 Years | 0 (0.0%) | 24 (4.0%) |
| 35 to 64 Years | 25 (1.6%) | 0 (0.0%) |
| 65 to 74 Years | 10 (3.3%) | 11 (2.1%) |
| 75 Years and over | 18 (7.1%) | 24 (6.8%) |
Disability Class: Cognitive Difficulty
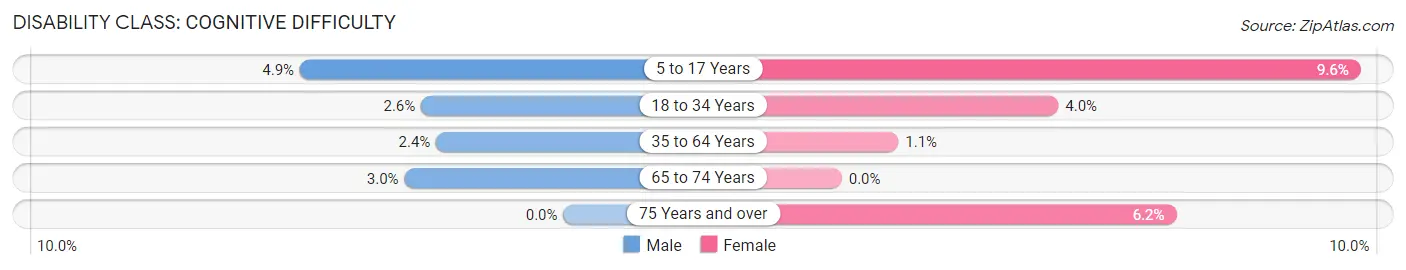
| Age Bracket | Male | Female |
| 5 to 17 Years | 29 (4.9%) | 39 (9.6%) |
| 18 to 34 Years | 11 (2.6%) | 24 (4.0%) |
| 35 to 64 Years | 37 (2.4%) | 15 (1.1%) |
| 65 to 74 Years | 9 (2.9%) | 0 (0.0%) |
| 75 Years and over | 0 (0.0%) | 22 (6.2%) |
Disability Class: Ambulatory Difficulty
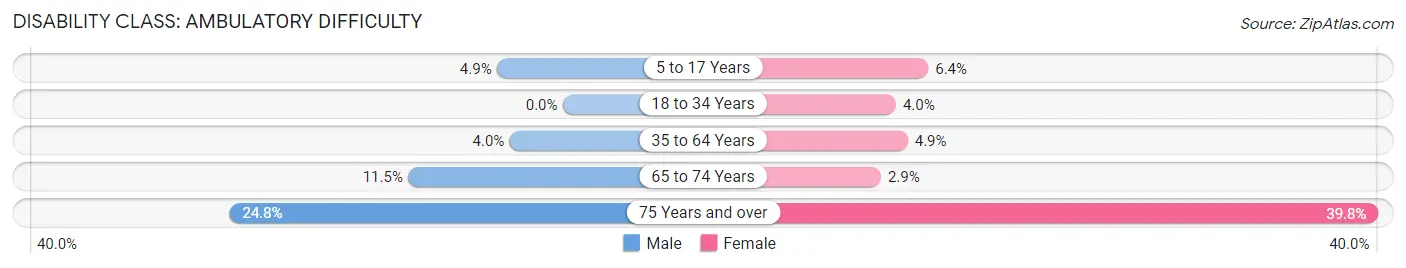
| Age Bracket | Male | Female |
| 5 to 17 Years | 29 (4.9%) | 26 (6.4%) |
| 18 to 34 Years | 0 (0.0%) | 24 (4.0%) |
| 35 to 64 Years | 62 (4.0%) | 70 (4.9%) |
| 65 to 74 Years | 35 (11.5%) | 15 (2.9%) |
| 75 Years and over | 63 (24.8%) | 141 (39.8%) |
Disability Class: Self-Care Difficulty
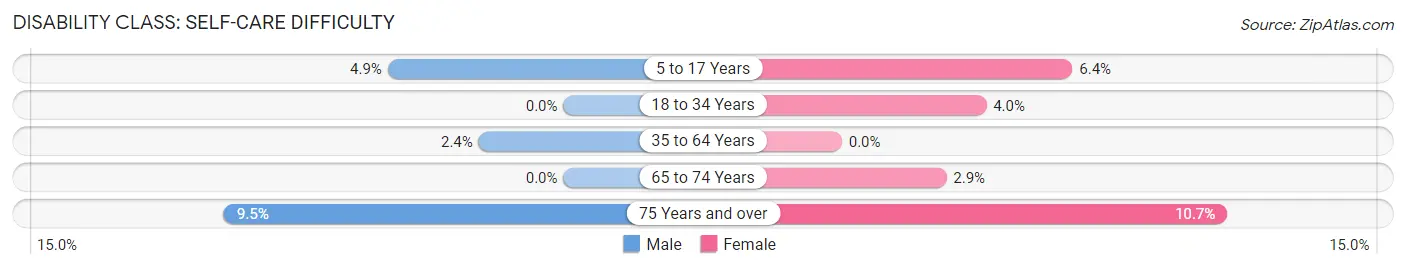
| Age Bracket | Male | Female |
| 5 to 17 Years | 29 (4.9%) | 26 (6.4%) |
| 18 to 34 Years | 0 (0.0%) | 24 (4.0%) |
| 35 to 64 Years | 37 (2.4%) | 0 (0.0%) |
| 65 to 74 Years | 0 (0.0%) | 15 (2.9%) |
| 75 Years and over | 24 (9.5%) | 38 (10.7%) |
Technology Access in Litchfield Park
Computing Device Access in Litchfield Park
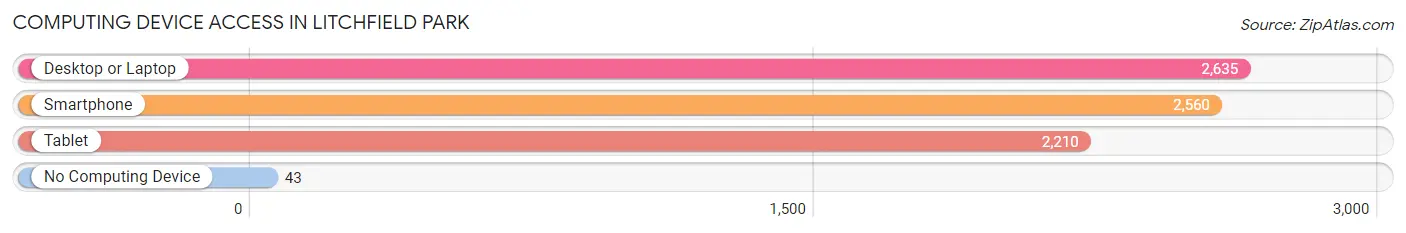
| Device Type | # Households | % Households |
| Desktop or Laptop | 2,635 | 94.8% |
| Smartphone | 2,560 | 92.1% |
| Tablet | 2,210 | 79.5% |
| No Computing Device | 43 | 1.5% |
| Total | 2,780 | 100.0% |
Internet Access in Litchfield Park
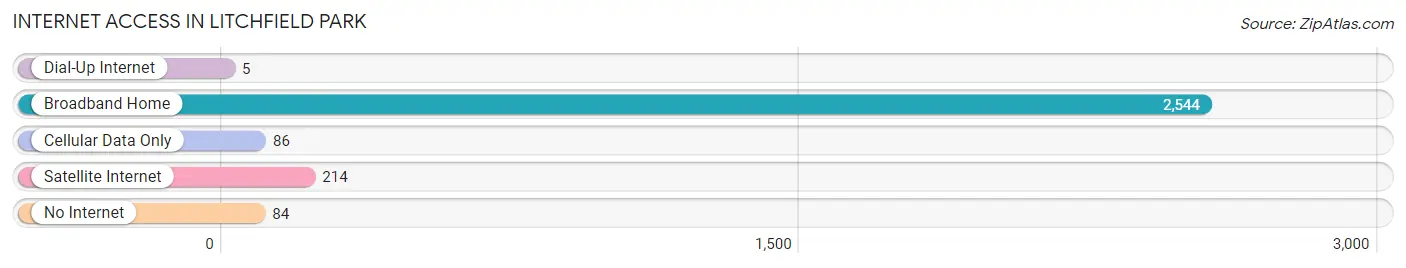
| Internet Type | # Households | % Households |
| Dial-Up Internet | 5 | 0.2% |
| Broadband Home | 2,544 | 91.5% |
| Cellular Data Only | 86 | 3.1% |
| Satellite Internet | 214 | 7.7% |
| No Internet | 84 | 3.0% |
| Total | 2,780 | 100.0% |
Litchfield Park Summary
Litchfield Park is a small city located in Maricopa County, Arizona. It is located about 20 miles west of downtown Phoenix and is part of the Phoenix metropolitan area. The city was founded in 1916 by Paul Litchfield, an executive of the Goodyear Tire and Rubber Company. The city has a population of 5,476 as of the 2010 census.
Geography
Litchfield Park is located at 33°27'17" North, 112°22'17" West (33.454722, -112.371389). It is situated in the Sonoran Desert, at an elevation of 1,092 feet (333 m). The city covers an area of 4.2 square miles (10.8 km2).
The city is bordered by the cities of Goodyear to the north, Avondale to the east, and Buckeye to the south and west. The Gila River Indian Community is located to the west of the city. The White Tank Mountains are located to the northwest of the city.
Climate
Litchfield Park has a hot desert climate, with hot summers and mild winters. The average high temperature in July is 106°F (41°C), and the average low temperature in January is 44°F (7°C). The average annual precipitation is 8.2 inches (210 mm).
Demographics
As of the 2010 census, there were 5,476 people, 1,945 households, and 1,541 families residing in the city. The population density was 1,310.3 people per square mile (505.3/km2). There were 2,093 housing units at an average density of 498.3 per square mile (192.3/km2). The racial makeup of the city was 87.2% White, 2.2% African American, 0.7% Native American, 2.2% Asian, 0.1% Pacific Islander, 5.2% from other races, and 2.6% from two or more races. Hispanic or Latino of any race were 16.2% of the population.
Economy
Litchfield Park is home to several businesses, including the Wigwam Resort and Spa, a golf resort and spa. The city is also home to several corporate headquarters, including the headquarters of the Arizona Public Service Company, the largest electric utility in Arizona.
The city is served by the Litchfield Park Airport, a general aviation airport located just outside the city limits. The airport is home to several corporate aircraft and is used for private and business aviation.
Education
Litchfield Park is served by the Litchfield Elementary School District. The district operates four elementary schools, one middle school, and one high school. The city is also home to several private schools, including the Litchfield Park Preparatory Academy, a K-8 school.
Conclusion
Litchfield Park is a small city located in Maricopa County, Arizona. It is situated in the Sonoran Desert, at an elevation of 1,092 feet (333 m). The city has a population of 5,476 as of the 2010 census. It is home to several businesses, including the Wigwam Resort and Spa, and several corporate headquarters. The city is served by the Litchfield Elementary School District, as well as several private schools. Litchfield Park is a great place to live, work, and play.
Common Questions
What is Per Capita Income in Litchfield Park?
Per Capita income in Litchfield Park is $53,025.
What is the Median Family Income in Litchfield Park?
Median Family Income in Litchfield Park is $123,358.
What is the Median Household income in Litchfield Park?
Median Household Income in Litchfield Park is $117,601.
What is Income or Wage Gap in Litchfield Park?
Income or Wage Gap in Litchfield Park is 34.7%.
Women in Litchfield Park earn 65.3 cents for every dollar earned by a man.
What is Inequality or Gini Index in Litchfield Park?
Inequality or Gini Index in Litchfield Park is 0.40.
What is the Total Population of Litchfield Park?
Total Population of Litchfield Park is 6,794.
What is the Total Male Population of Litchfield Park?
Total Male Population of Litchfield Park is 3,370.
What is the Total Female Population of Litchfield Park?
Total Female Population of Litchfield Park is 3,424.
What is the Ratio of Males per 100 Females in Litchfield Park?
There are 98.42 Males per 100 Females in Litchfield Park.
What is the Ratio of Females per 100 Males in Litchfield Park?
There are 101.60 Females per 100 Males in Litchfield Park.
What is the Median Population Age in Litchfield Park?
Median Population Age in Litchfield Park is 47.7 Years.
What is the Average Family Size in Litchfield Park
Average Family Size in Litchfield Park is 2.9 People.
What is the Average Household Size in Litchfield Park
Average Household Size in Litchfield Park is 2.4 People.
How Large is the Labor Force in Litchfield Park?
There are 3,446 People in the Labor Forcein in Litchfield Park.
What is the Percentage of People in the Labor Force in Litchfield Park?
60.3% of People are in the Labor Force in Litchfield Park.
What is the Unemployment Rate in Litchfield Park?
Unemployment Rate in Litchfield Park is 2.1%.