Topawa, AZ Map & Demographics
Topawa Map
Topawa Overview
$10,397
PER CAPITA INCOME
$26,100
AVG FAMILY INCOME
$25,050
AVG HOUSEHOLD INCOME
0.50
INEQUALITY / GINI INDEX
441
TOTAL POPULATION
254
MALE POPULATION
187
FEMALE POPULATION
135.83
MALES / 100 FEMALES
73.62
FEMALES / 100 MALES
26.1
MEDIAN AGE
4.2
AVG FAMILY SIZE
3.9
AVG HOUSEHOLD SIZE
67
LABOR FORCE [ PEOPLE ]
18.9%
PERCENT IN LABOR FORCE
Topawa Zip Codes
Topawa Area Codes
Income in Topawa
Income Overview in Topawa
Per Capita Income in Topawa is $10,397, while median incomes of families and households are $26,100 and $25,050 respectively.
| Characteristic | Number | Measure |
| Per Capita Income | 441 | $10,397 |
| Median Family Income | 92 | $26,100 |
| Mean Family Income | 92 | $34,403 |
| Median Household Income | 113 | $25,050 |
| Mean Household Income | 113 | $29,953 |
| Income Deficit | 92 | $0 |
| Wage / Income Gap (%) | 441 | 0.00% |
| Wage / Income Gap ($) | 441 | 100.00¢ per $1 |
| Gini / Inequality Index | 441 | 0.50 |
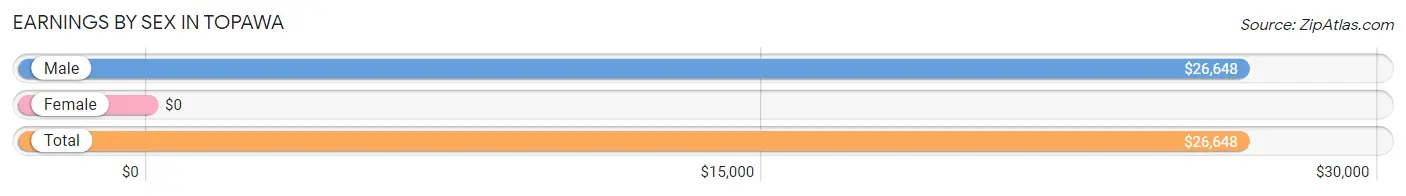
Earnings by Sex in Topawa
| Sex | Number | Average Earnings |
| Male | 76 (100.0%) | $26,648 |
| Female | 0 (0.0%) | $0 |
| Total | 76 (100.0%) | $26,648 |
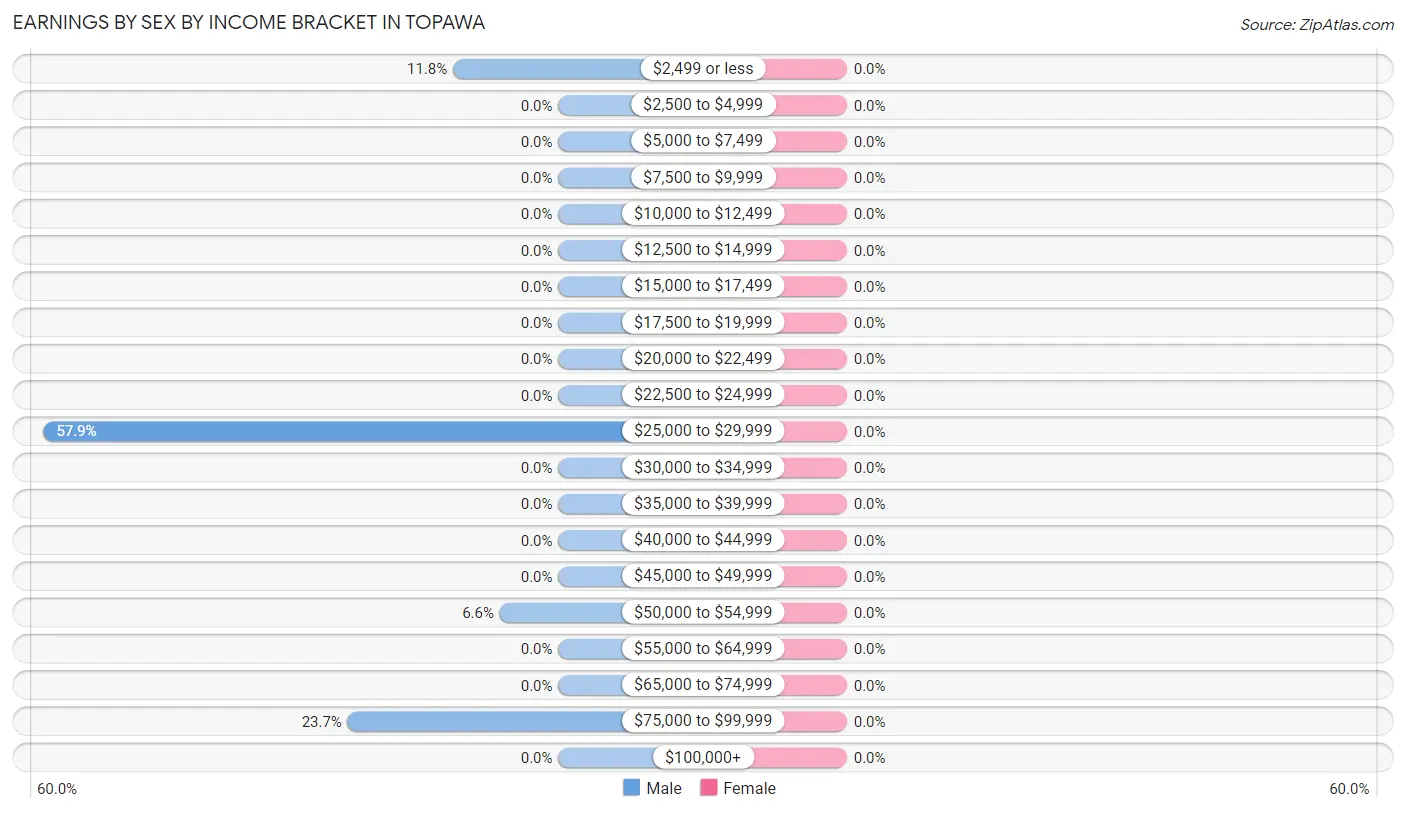
Earnings by Sex by Income Bracket in Topawa
| Income | Male | Female |
| $2,499 or less | 9 (11.8%) | 0 (0.0%) |
| $2,500 to $4,999 | 0 (0.0%) | 0 (0.0%) |
| $5,000 to $7,499 | 0 (0.0%) | 0 (0.0%) |
| $7,500 to $9,999 | 0 (0.0%) | 0 (0.0%) |
| $10,000 to $12,499 | 0 (0.0%) | 0 (0.0%) |
| $12,500 to $14,999 | 0 (0.0%) | 0 (0.0%) |
| $15,000 to $17,499 | 0 (0.0%) | 0 (0.0%) |
| $17,500 to $19,999 | 0 (0.0%) | 0 (0.0%) |
| $20,000 to $22,499 | 0 (0.0%) | 0 (0.0%) |
| $22,500 to $24,999 | 0 (0.0%) | 0 (0.0%) |
| $25,000 to $29,999 | 44 (57.9%) | 0 (0.0%) |
| $30,000 to $34,999 | 0 (0.0%) | 0 (0.0%) |
| $35,000 to $39,999 | 0 (0.0%) | 0 (0.0%) |
| $40,000 to $44,999 | 0 (0.0%) | 0 (0.0%) |
| $45,000 to $49,999 | 0 (0.0%) | 0 (0.0%) |
| $50,000 to $54,999 | 5 (6.6%) | 0 (0.0%) |
| $55,000 to $64,999 | 0 (0.0%) | 0 (0.0%) |
| $65,000 to $74,999 | 0 (0.0%) | 0 (0.0%) |
| $75,000 to $99,999 | 18 (23.7%) | 0 (0.0%) |
| $100,000+ | 0 (0.0%) | 0 (0.0%) |
| Total | 76 (100.0%) | 0 (0.0%) |
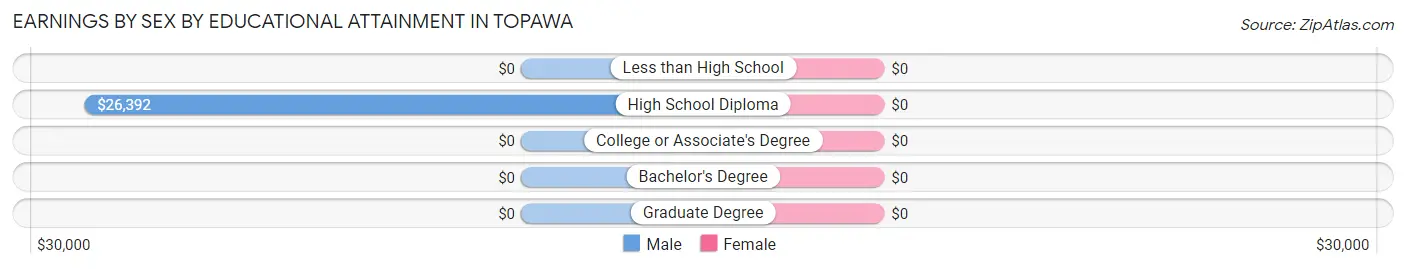
Earnings by Sex by Educational Attainment in Topawa
| Educational Attainment | Male Income | Female Income |
| Less than High School | - | - |
| High School Diploma | $26,392 | $0 |
| College or Associate's Degree | - | - |
| Bachelor's Degree | - | - |
| Graduate Degree | - | - |
| Total | $26,648 | $0 |
Family Income in Topawa
Family Income Brackets in Topawa
According to the Topawa family income data, there are 25 families falling into the less than $10,000 income range, which is the most common income bracket and makes up 27.2% of all families.
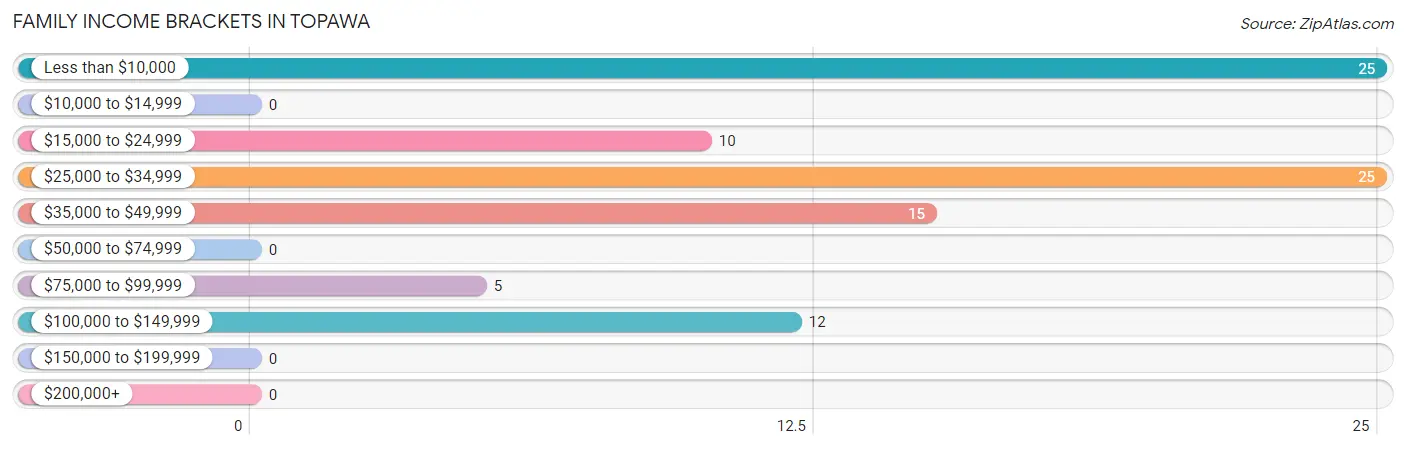
| Income Bracket | # Families | % Families |
| Less than $10,000 | 25 | 27.2% |
| $10,000 to $14,999 | 0 | 0.0% |
| $15,000 to $24,999 | 10 | 10.9% |
| $25,000 to $34,999 | 25 | 27.2% |
| $35,000 to $49,999 | 15 | 16.3% |
| $50,000 to $74,999 | 0 | 0.0% |
| $75,000 to $99,999 | 5 | 5.4% |
| $100,000 to $149,999 | 12 | 13.0% |
| $150,000 to $199,999 | 0 | 0.0% |
| $200,000+ | 0 | 0.0% |
Family Income by Famaliy Size in Topawa
| Income Bracket | # Families | Median Income |
| 2-Person Families | 36 (39.1%) | $0 |
| 3-Person Families | 19 (20.6%) | $0 |
| 4-Person Families | 12 (13.0%) | $0 |
| 5-Person Families | 15 (16.3%) | $0 |
| 6-Person Families | 10 (10.9%) | $0 |
| 7+ Person Families | 0 (0.0%) | $0 |
| Total | 92 (100.0%) | $26,100 |
Family Income by Number of Earners in Topawa
| Number of Earners | # Families | Median Income |
| No Earners | 62 (67.4%) | $0 |
| 1 Earner | 25 (27.2%) | $0 |
| 2 Earners | 5 (5.4%) | $0 |
| 3+ Earners | 0 (0.0%) | $0 |
| Total | 92 (100.0%) | $26,100 |
Household Income in Topawa
Household Income Brackets in Topawa
With 46 households falling in the category, the less than $10,000 income range is the most frequent in Topawa, accounting for 40.7% of all households.
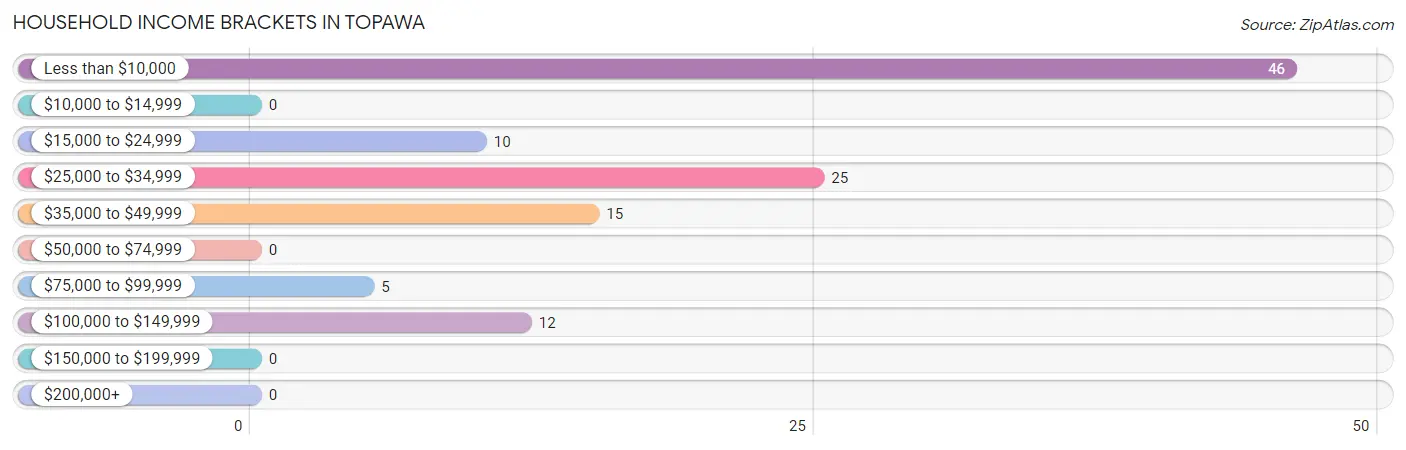
| Income Bracket | # Households | % Households |
| Less than $10,000 | 46 | 40.7% |
| $10,000 to $14,999 | 0 | 0.0% |
| $15,000 to $24,999 | 10 | 8.8% |
| $25,000 to $34,999 | 25 | 22.1% |
| $35,000 to $49,999 | 15 | 13.3% |
| $50,000 to $74,999 | 0 | 0.0% |
| $75,000 to $99,999 | 5 | 4.4% |
| $100,000 to $149,999 | 12 | 10.6% |
| $150,000 to $199,999 | 0 | 0.0% |
| $200,000+ | 0 | 0.0% |
Household Income by Householder Age in Topawa
The median household income in Topawa is $25,050, with the highest median household income of $27,250 found in the 45 to 64 years age bracket for the primary householder. A total of 45 households (39.8%) fall into this category.
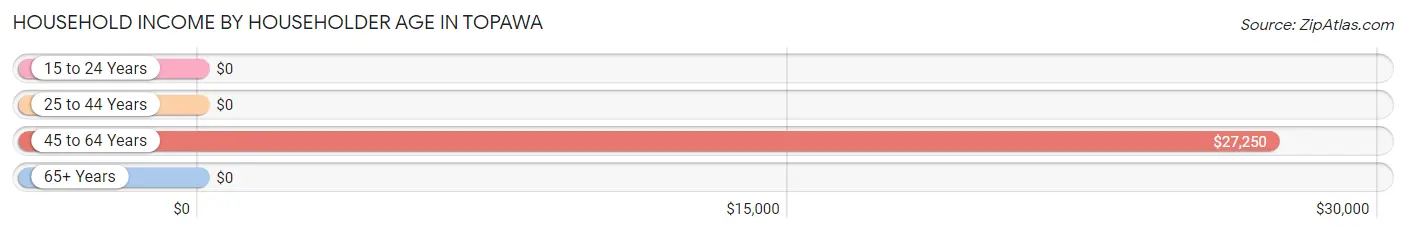
| Income Bracket | # Households | Median Income |
| 15 to 24 Years | 0 (0.0%) | $0 |
| 25 to 44 Years | 11 (9.7%) | $0 |
| 45 to 64 Years | 45 (39.8%) | $27,250 |
| 65+ Years | 57 (50.4%) | $0 |
| Total | 113 (100.0%) | $25,050 |
Poverty in Topawa
Income Below Poverty by Sex and Age in Topawa
With 52.4% poverty level for males and 35.8% for females among the residents of Topawa, 12 to 14 year old males and 75 year old and over females are the most vulnerable to poverty, with 28 males (100.0%) and 14 females (100.0%) in their respective age groups living below the poverty level.
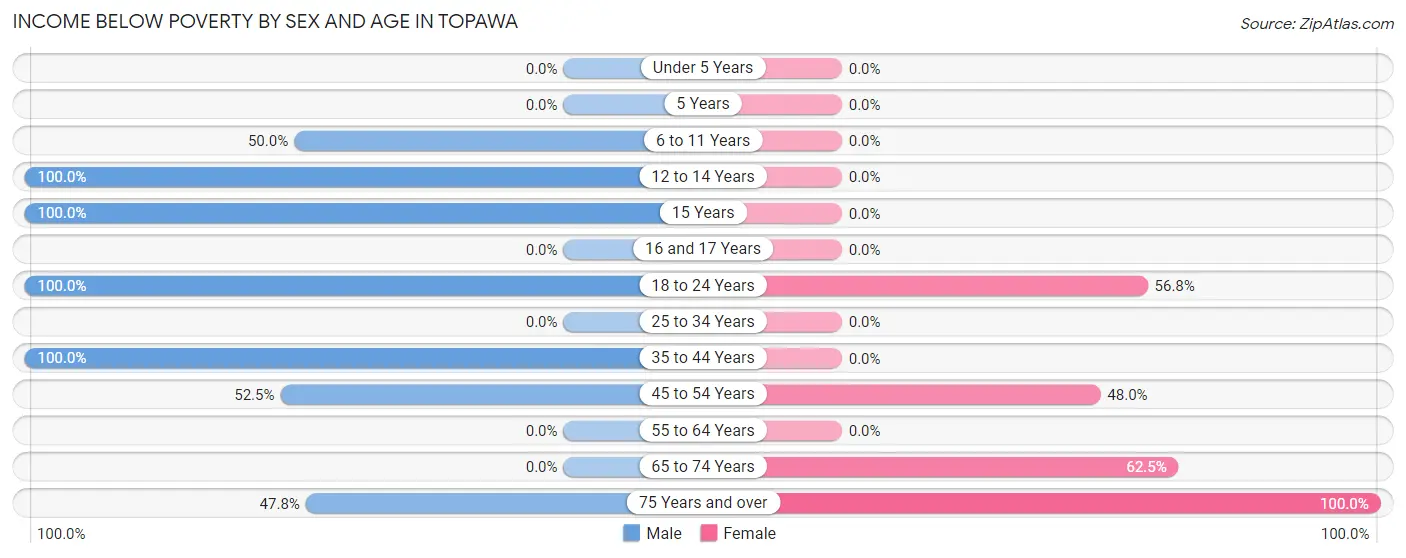
| Age Bracket | Male | Female |
| Under 5 Years | 0 (0.0%) | 0 (0.0%) |
| 5 Years | 0 (0.0%) | 0 (0.0%) |
| 6 to 11 Years | 14 (50.0%) | 0 (0.0%) |
| 12 to 14 Years | 28 (100.0%) | 0 (0.0%) |
| 15 Years | 18 (100.0%) | 0 (0.0%) |
| 16 and 17 Years | 0 (0.0%) | 0 (0.0%) |
| 18 to 24 Years | 20 (100.0%) | 21 (56.8%) |
| 25 to 34 Years | 0 (0.0%) | 0 (0.0%) |
| 35 to 44 Years | 11 (100.0%) | 0 (0.0%) |
| 45 to 54 Years | 31 (52.5%) | 12 (48.0%) |
| 55 to 64 Years | 0 (0.0%) | 0 (0.0%) |
| 65 to 74 Years | 0 (0.0%) | 20 (62.5%) |
| 75 Years and over | 11 (47.8%) | 14 (100.0%) |
| Total | 133 (52.4%) | 67 (35.8%) |
Income Above Poverty by Sex and Age in Topawa
According to the poverty statistics in Topawa, males aged 5 years and females aged 16 and 17 years are the age groups that are most secure financially, with 100.0% of males and 100.0% of females in these age groups living above the poverty line.
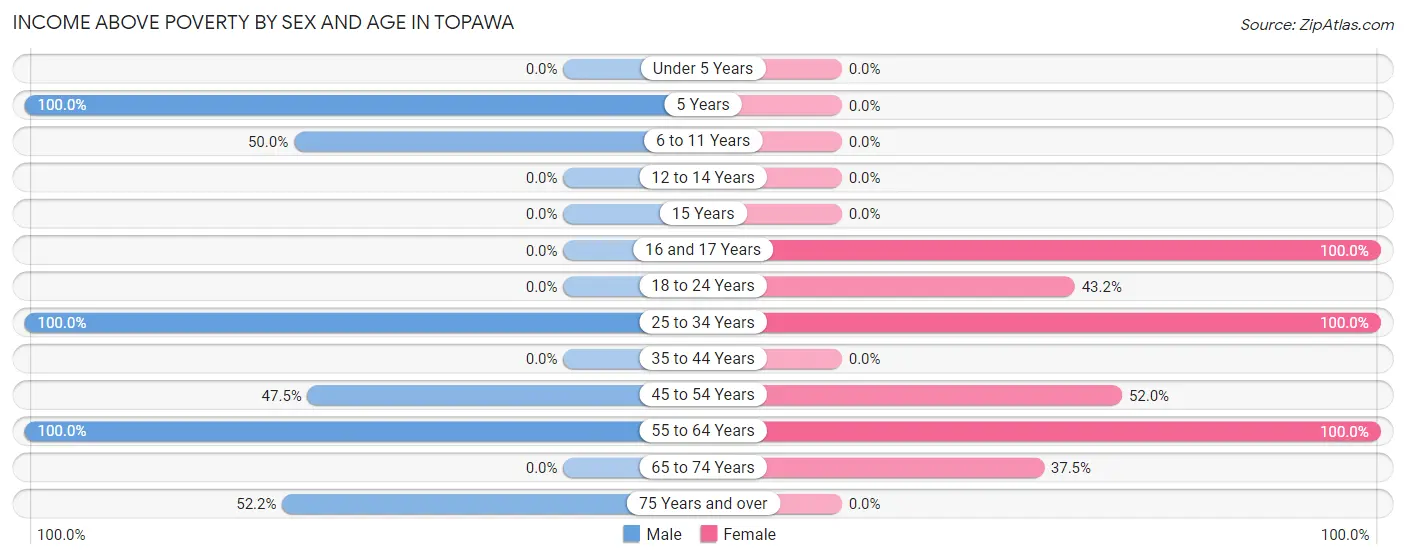
| Age Bracket | Male | Female |
| Under 5 Years | 0 (0.0%) | 0 (0.0%) |
| 5 Years | 13 (100.0%) | 0 (0.0%) |
| 6 to 11 Years | 14 (50.0%) | 0 (0.0%) |
| 12 to 14 Years | 0 (0.0%) | 0 (0.0%) |
| 15 Years | 0 (0.0%) | 0 (0.0%) |
| 16 and 17 Years | 0 (0.0%) | 35 (100.0%) |
| 18 to 24 Years | 0 (0.0%) | 16 (43.2%) |
| 25 to 34 Years | 49 (100.0%) | 19 (100.0%) |
| 35 to 44 Years | 0 (0.0%) | 0 (0.0%) |
| 45 to 54 Years | 28 (47.5%) | 13 (52.0%) |
| 55 to 64 Years | 5 (100.0%) | 25 (100.0%) |
| 65 to 74 Years | 0 (0.0%) | 12 (37.5%) |
| 75 Years and over | 12 (52.2%) | 0 (0.0%) |
| Total | 121 (47.6%) | 120 (64.2%) |
Income Below Poverty Among Married-Couple Families in Topawa
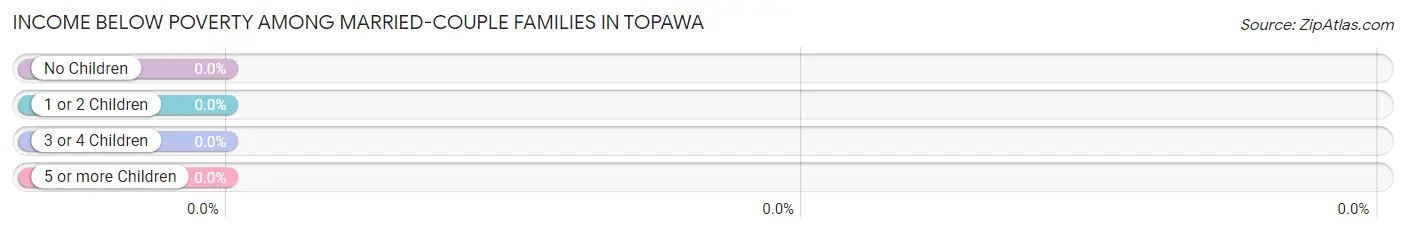
| Children | Above Poverty | Below Poverty |
| No Children | 5 (100.0%) | 0 (0.0%) |
| 1 or 2 Children | 0 (0.0%) | 0 (0.0%) |
| 3 or 4 Children | 15 (100.0%) | 0 (0.0%) |
| 5 or more Children | 0 (0.0%) | 0 (0.0%) |
| Total | 20 (100.0%) | 0 (0.0%) |
Income Below Poverty Among Single-Parent Households in Topawa
According to the poverty data in Topawa, 30.6% or 11 single-father households and 66.7% or 24 single-mother households are living below the poverty line. Among single-father households, those with 1 or 2 children have the highest poverty rate, with 11 households (100.0%) experiencing poverty. Likewise, among single-mother households, those with no children have the highest poverty rate, with 14 households (100.0%) falling below the poverty line.
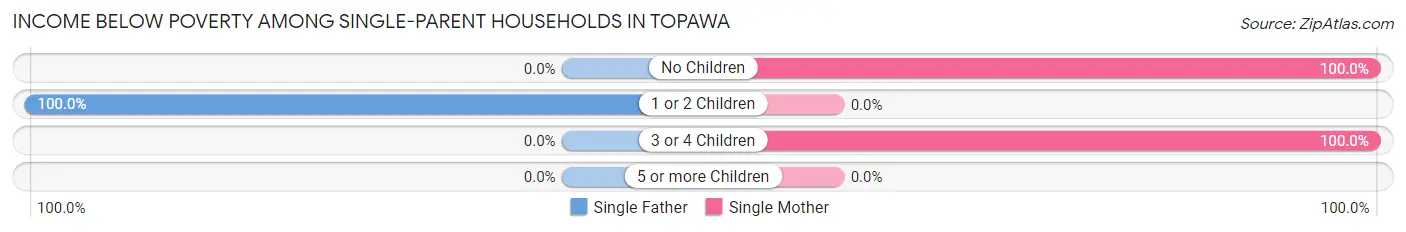
| Children | Single Father | Single Mother |
| No Children | 0 (0.0%) | 14 (100.0%) |
| 1 or 2 Children | 11 (100.0%) | 0 (0.0%) |
| 3 or 4 Children | 0 (0.0%) | 10 (100.0%) |
| 5 or more Children | 0 (0.0%) | 0 (0.0%) |
| Total | 11 (30.6%) | 24 (66.7%) |
Income Below Poverty Among Married-Couple vs Single-Parent Households in Topawa
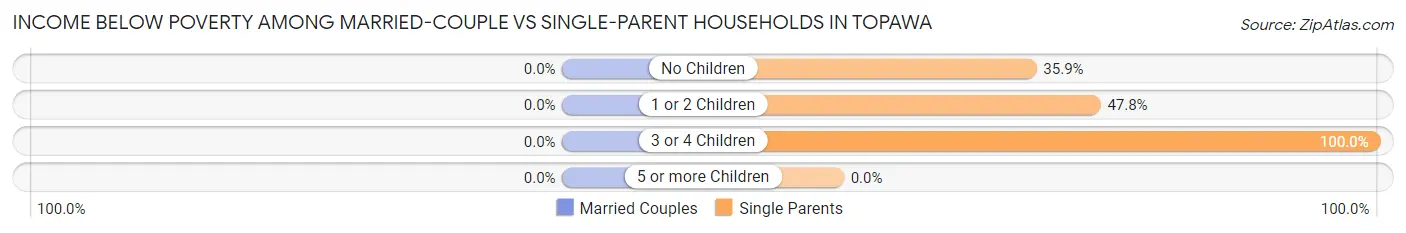
| Children | Married-Couple Families | Single-Parent Households |
| No Children | 0 (0.0%) | 14 (35.9%) |
| 1 or 2 Children | 0 (0.0%) | 11 (47.8%) |
| 3 or 4 Children | 0 (0.0%) | 10 (100.0%) |
| 5 or more Children | 0 (0.0%) | 0 (0.0%) |
| Total | 0 (0.0%) | 35 (48.6%) |
Race in Topawa
The most populous races in Topawa are Native / Alaskan (441 | 100.0%), and Hispanic or Latino (14 | 3.2%).
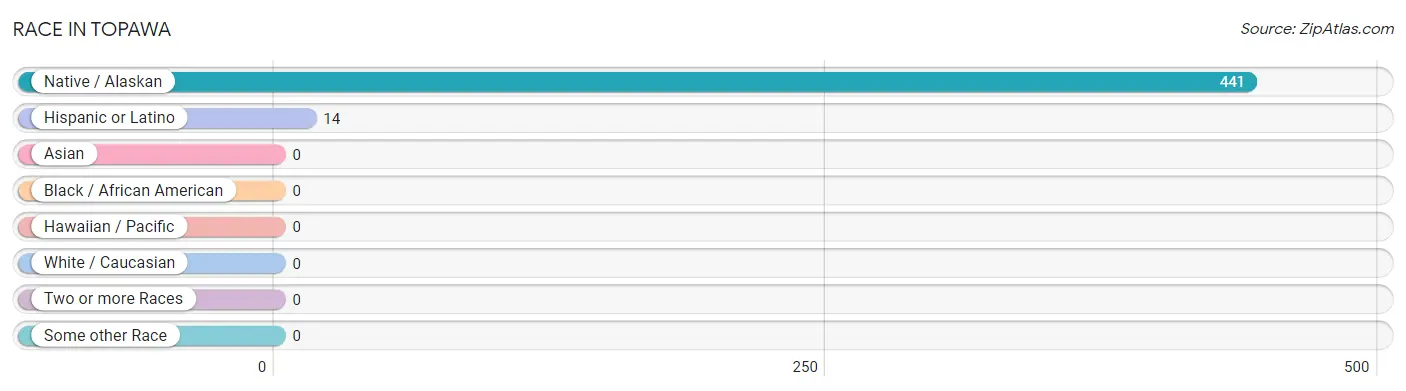
| Race | # Population | % Population |
| Asian | 0 | 0.0% |
| Black / African American | 0 | 0.0% |
| Hawaiian / Pacific | 0 | 0.0% |
| Hispanic or Latino | 14 | 3.2% |
| Native / Alaskan | 441 | 100.0% |
| White / Caucasian | 0 | 0.0% |
| Two or more Races | 0 | 0.0% |
| Some other Race | 0 | 0.0% |
| Total | 441 | 100.0% |
Ancestry in Topawa
The most populous ancestries reported in Topawa are Tohono O'Odham (393 | 89.1%), and Puerto Rican (14 | 3.2%), together accounting for 92.3% of all Topawa residents.
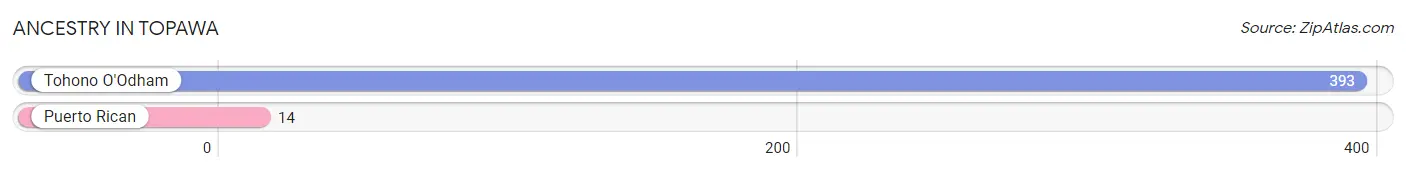
| Ancestry | # Population | % Population |
| Puerto Rican | 14 | 3.2% |
| Tohono O'Odham | 393 | 89.1% | View All 2 Rows |
Immigrants in Topawa

| Immigration Origin | # Population | % Population | View All 0 Rows |
Sex and Age in Topawa
Sex and Age in Topawa
The most populous age groups in Topawa are 25 to 29 Years (49 | 19.3%) for men and 15 to 19 Years (72 | 38.5%) for women.
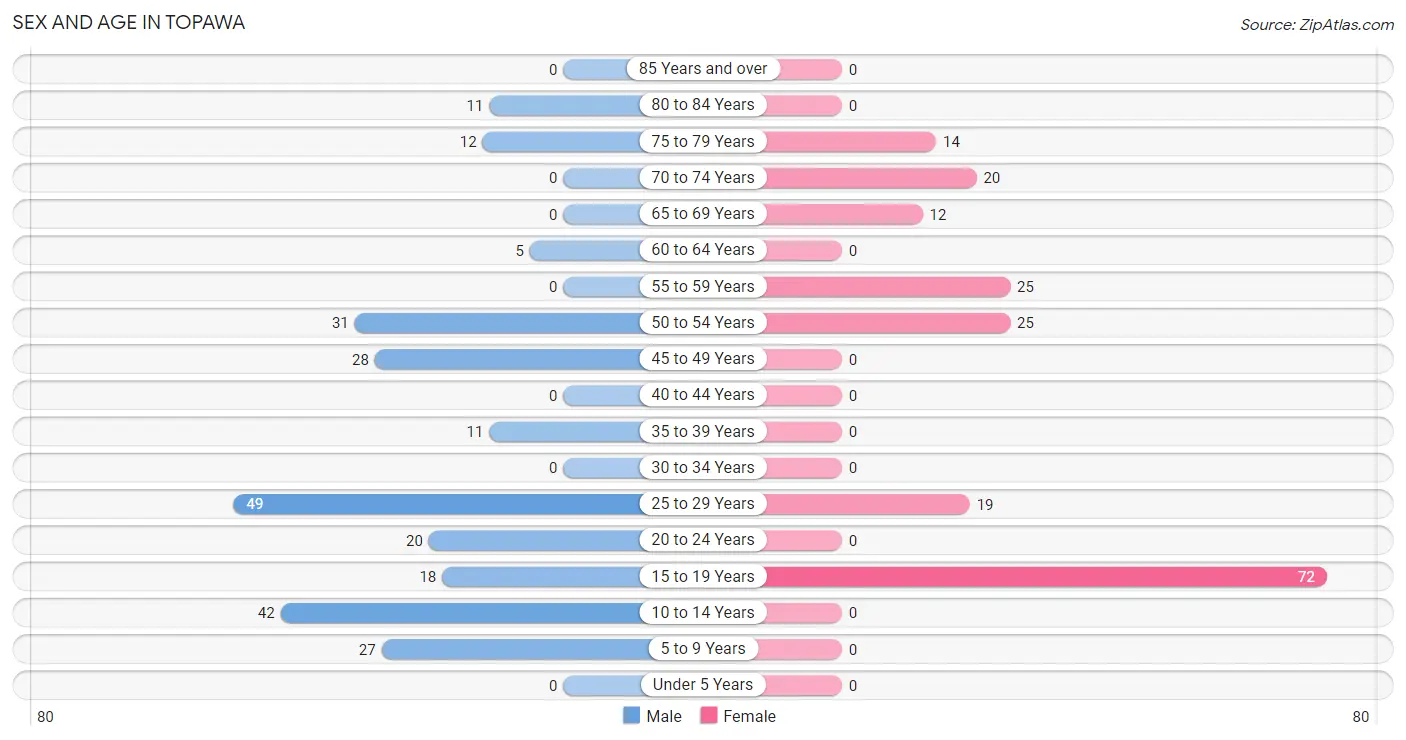
| Age Bracket | Male | Female |
| Under 5 Years | 0 (0.0%) | 0 (0.0%) |
| 5 to 9 Years | 27 (10.6%) | 0 (0.0%) |
| 10 to 14 Years | 42 (16.5%) | 0 (0.0%) |
| 15 to 19 Years | 18 (7.1%) | 72 (38.5%) |
| 20 to 24 Years | 20 (7.9%) | 0 (0.0%) |
| 25 to 29 Years | 49 (19.3%) | 19 (10.2%) |
| 30 to 34 Years | 0 (0.0%) | 0 (0.0%) |
| 35 to 39 Years | 11 (4.3%) | 0 (0.0%) |
| 40 to 44 Years | 0 (0.0%) | 0 (0.0%) |
| 45 to 49 Years | 28 (11.0%) | 0 (0.0%) |
| 50 to 54 Years | 31 (12.2%) | 25 (13.4%) |
| 55 to 59 Years | 0 (0.0%) | 25 (13.4%) |
| 60 to 64 Years | 5 (2.0%) | 0 (0.0%) |
| 65 to 69 Years | 0 (0.0%) | 12 (6.4%) |
| 70 to 74 Years | 0 (0.0%) | 20 (10.7%) |
| 75 to 79 Years | 12 (4.7%) | 14 (7.5%) |
| 80 to 84 Years | 11 (4.3%) | 0 (0.0%) |
| 85 Years and over | 0 (0.0%) | 0 (0.0%) |
| Total | 254 (100.0%) | 187 (100.0%) |
Families and Households in Topawa
Median Family Size in Topawa
The median family size in Topawa is 4.25 persons per family, with married-couple families (20 | 21.7%) accounting for the largest median family size of 6.05 persons per family. On the other hand, single male/father families (36 | 39.1%) represent the smallest median family size with 3.19 persons per family.
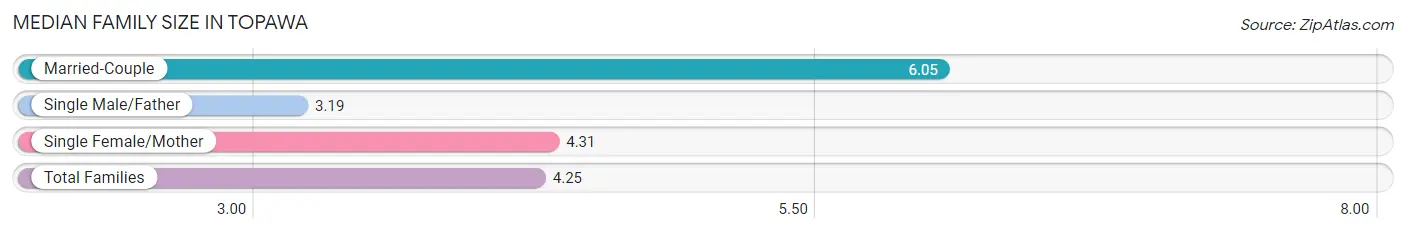
| Family Type | # Families | Family Size |
| Married-Couple | 20 (21.7%) | 6.05 |
| Single Male/Father | 36 (39.1%) | 3.19 |
| Single Female/Mother | 36 (39.1%) | 4.31 |
| Total Families | 92 (100.0%) | 4.25 |
Median Household Size in Topawa
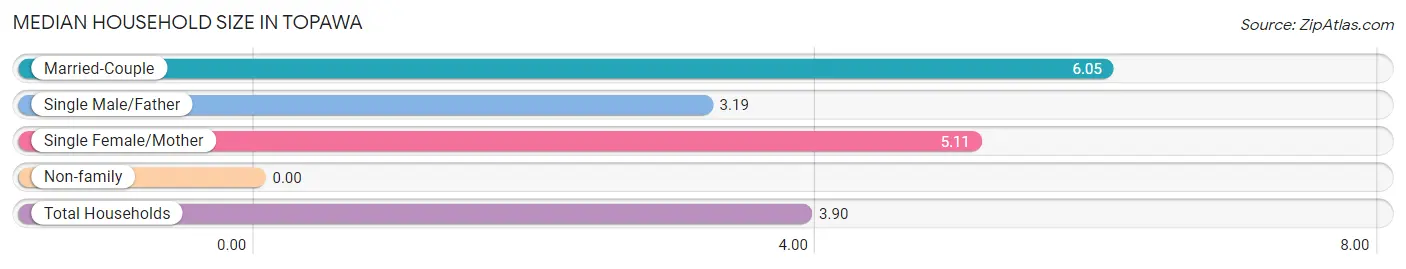
| Household Type | # Households | Household Size |
| Married-Couple | 20 (17.7%) | 6.05 |
| Single Male/Father | 36 (31.9%) | 3.19 |
| Single Female/Mother | 36 (31.9%) | 5.11 |
| Non-family | 21 (18.6%) | - |
| Total Households | 113 (100.0%) | 3.90 |
Household Size by Marriage Status in Topawa
Out of a total of 113 households in Topawa, 92 (81.4%) are family households, while 21 (18.6%) are nonfamily households. The most numerous type of family households are 3-person households, comprising 31, and the most common type of nonfamily households are 1-person households, comprising 21.
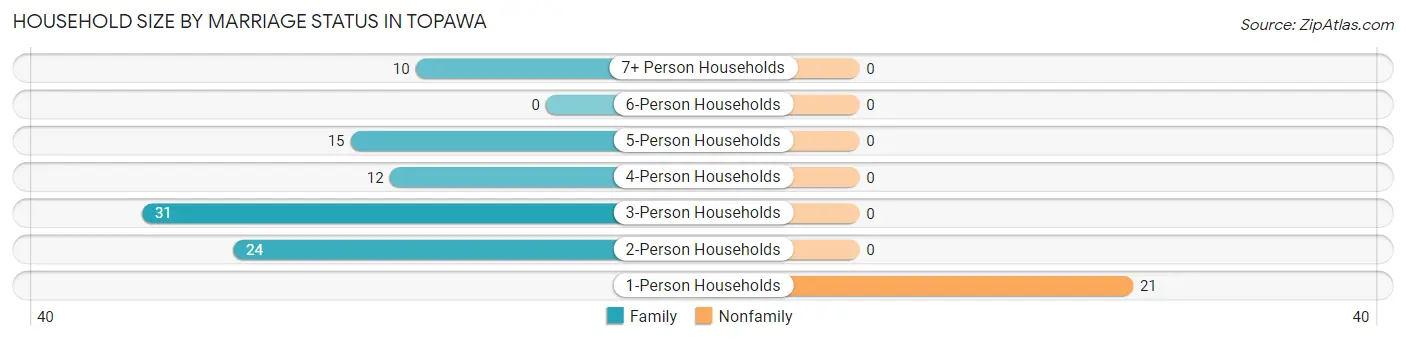
| Household Size | Family Households | Nonfamily Households |
| 1-Person Households | - | 21 (18.6%) |
| 2-Person Households | 24 (21.2%) | 0 (0.0%) |
| 3-Person Households | 31 (27.4%) | 0 (0.0%) |
| 4-Person Households | 12 (10.6%) | 0 (0.0%) |
| 5-Person Households | 15 (13.3%) | 0 (0.0%) |
| 6-Person Households | 0 (0.0%) | 0 (0.0%) |
| 7+ Person Households | 10 (8.8%) | 0 (0.0%) |
| Total | 92 (81.4%) | 21 (18.6%) |
Female Fertility in Topawa
Fertility by Age in Topawa
| Age Bracket | Women with Births | Births / 1,000 Women |
| 15 to 19 years | 0 (0.0%) | 0.0 |
| 20 to 34 years | 0 (0.0%) | 0.0 |
| 35 to 50 years | 0 (0.0%) | 0.0 |
| Total | 0 (0.0%) | 0.0 |
Fertility by Age by Marriage Status in Topawa
| Age Bracket | Married | Unmarried |
| 15 to 19 years | 0 (0.0%) | 0 (0.0%) |
| 20 to 34 years | 0 (0.0%) | 0 (0.0%) |
| 35 to 50 years | 0 (0.0%) | 0 (0.0%) |
| Total | 0 (0.0%) | 0 (0.0%) |
Fertility by Education in Topawa
| Educational Attainment | Women with Births | Births / 1,000 Women |
| Less than High School | 0 (0.0%) | 0.0 |
| High School Diploma | 0 (0.0%) | 0.0 |
| College or Associate's Degree | 0 (0.0%) | 0.0 |
| Bachelor's Degree | 0 (0.0%) | 0.0 |
| Graduate Degree | 0 (0.0%) | 0.0 |
| Total | 0 (0.0%) | 0.0 |
Fertility by Education by Marriage Status in Topawa
| Educational Attainment | Married | Unmarried |
| Less than High School | 0 (0.0%) | 0 (0.0%) |
| High School Diploma | 0 (0.0%) | 0 (0.0%) |
| College or Associate's Degree | 0 (0.0%) | 0 (0.0%) |
| Bachelor's Degree | 0 (0.0%) | 0 (0.0%) |
| Graduate Degree | 0 (0.0%) | 0 (0.0%) |
| Total | 0 (0.0%) | 0 (0.0%) |
Employment Characteristics in Topawa
Employment by Class of Employer in Topawa
Among the 67 employed individuals in Topawa, local government employees (36 | 53.7%), private company employees (18 | 26.9%), and self-employed (not incorporated) (13 | 19.4%) make up the most common classes of employment.
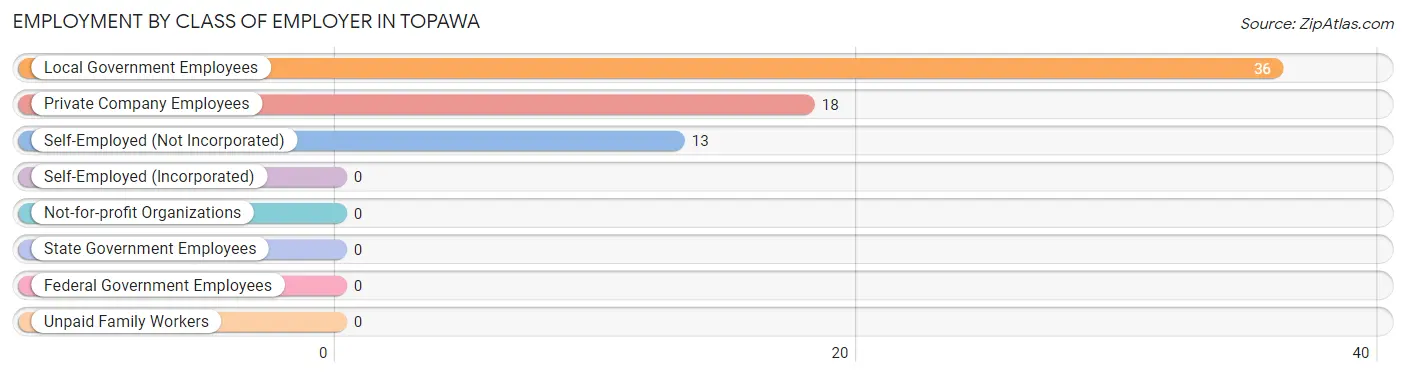
| Employer Class | # Employees | % Employees |
| Private Company Employees | 18 | 26.9% |
| Self-Employed (Incorporated) | 0 | 0.0% |
| Self-Employed (Not Incorporated) | 13 | 19.4% |
| Not-for-profit Organizations | 0 | 0.0% |
| Local Government Employees | 36 | 53.7% |
| State Government Employees | 0 | 0.0% |
| Federal Government Employees | 0 | 0.0% |
| Unpaid Family Workers | 0 | 0.0% |
| Total | 67 | 100.0% |
Employment Status by Age in Topawa
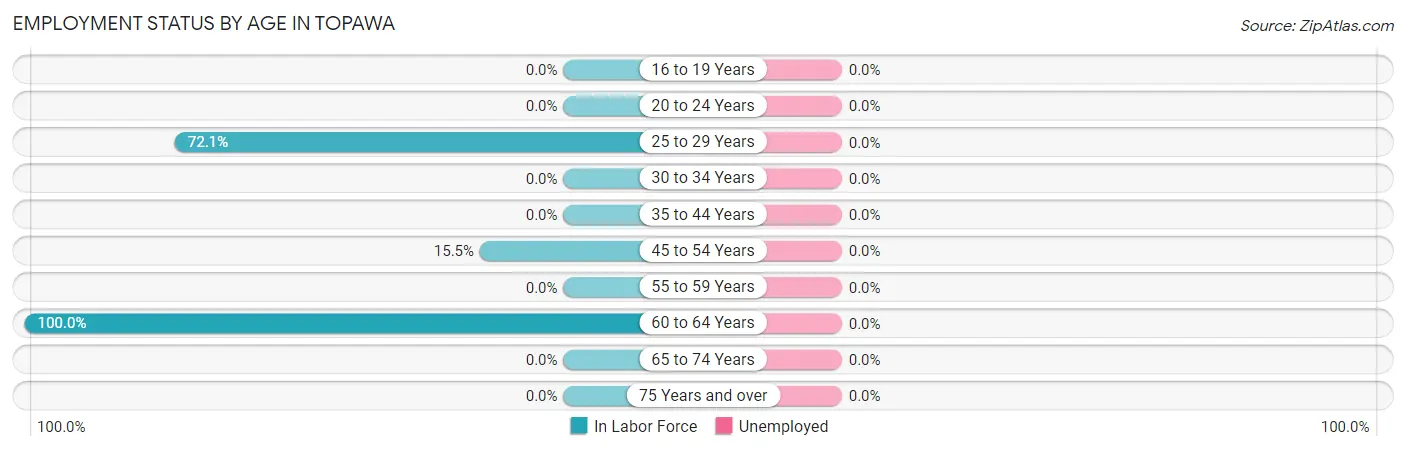
| Age Bracket | In Labor Force | Unemployed |
| 16 to 19 Years | 0 (0.0%) | 0 (0.0%) |
| 20 to 24 Years | 0 (0.0%) | 0 (0.0%) |
| 25 to 29 Years | 49 (72.1%) | 0 (0.0%) |
| 30 to 34 Years | 0 (0.0%) | 0 (0.0%) |
| 35 to 44 Years | 0 (0.0%) | 0 (0.0%) |
| 45 to 54 Years | 13 (15.5%) | 0 (0.0%) |
| 55 to 59 Years | 0 (0.0%) | 0 (0.0%) |
| 60 to 64 Years | 5 (100.0%) | 0 (0.0%) |
| 65 to 74 Years | 0 (0.0%) | 0 (0.0%) |
| 75 Years and over | 0 (0.0%) | 0 (0.0%) |
| Total | 67 (18.9%) | 0 (0.0%) |
Employment Status by Educational Attainment in Topawa
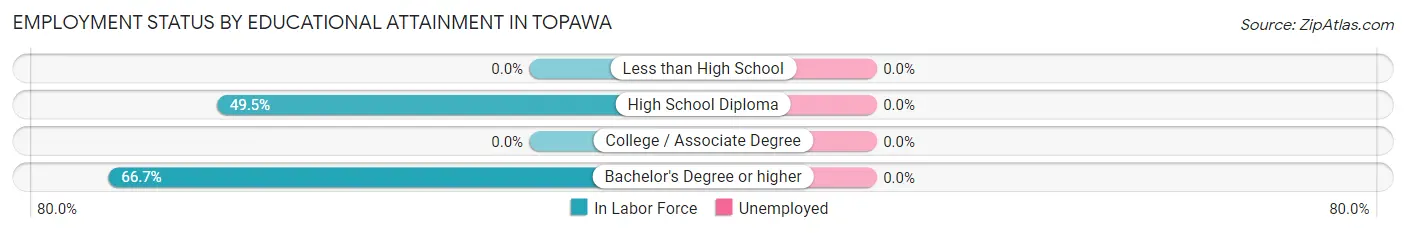
| Educational Attainment | In Labor Force | Unemployed |
| Less than High School | 0 (0.0%) | 0 (0.0%) |
| High School Diploma | 49 (49.5%) | 0 (0.0%) |
| College / Associate Degree | 0 (0.0%) | 0 (0.0%) |
| Bachelor's Degree or higher | 18 (66.7%) | 0 (0.0%) |
| Total | 67 (34.7%) | 0 (0.0%) |
Employment Occupations by Sex in Topawa
Management, Business, Science and Arts Occupations
The most common Management, Business, Science and Arts occupations in Topawa are Community & Social Service (31 | 46.3%), Education, Arts & Media (31 | 46.3%), Computers, Engineering & Science (5 | 7.5%), and Life, Physical & Social Science (5 | 7.5%).
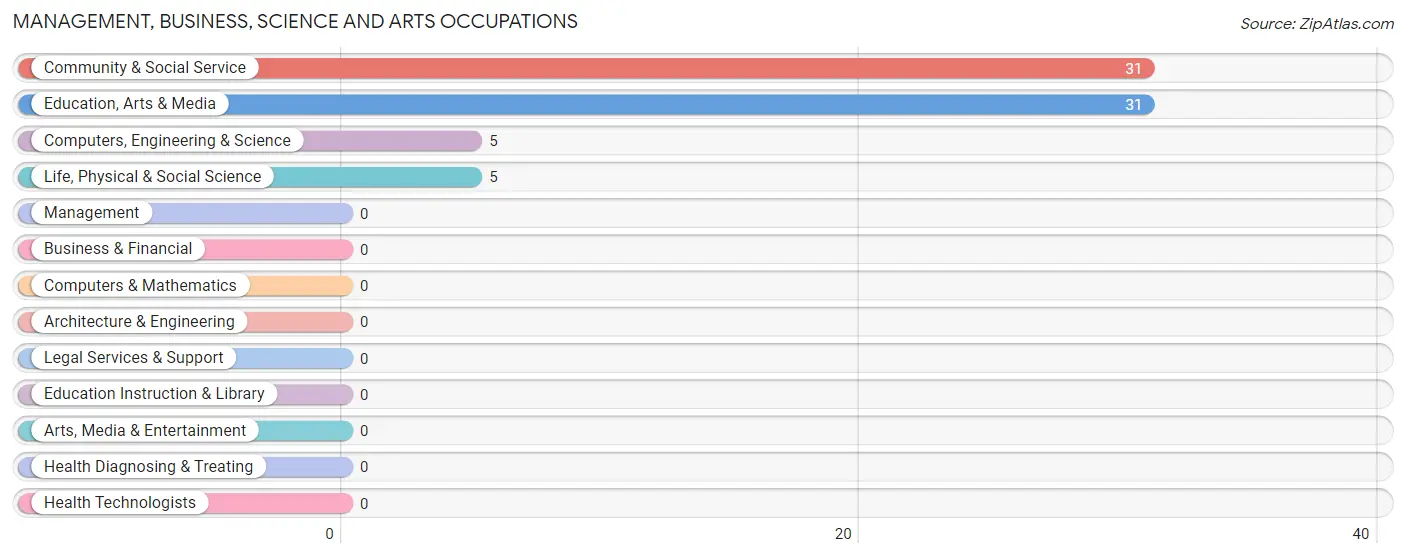
Management, Business, Science and Arts Occupations by Sex
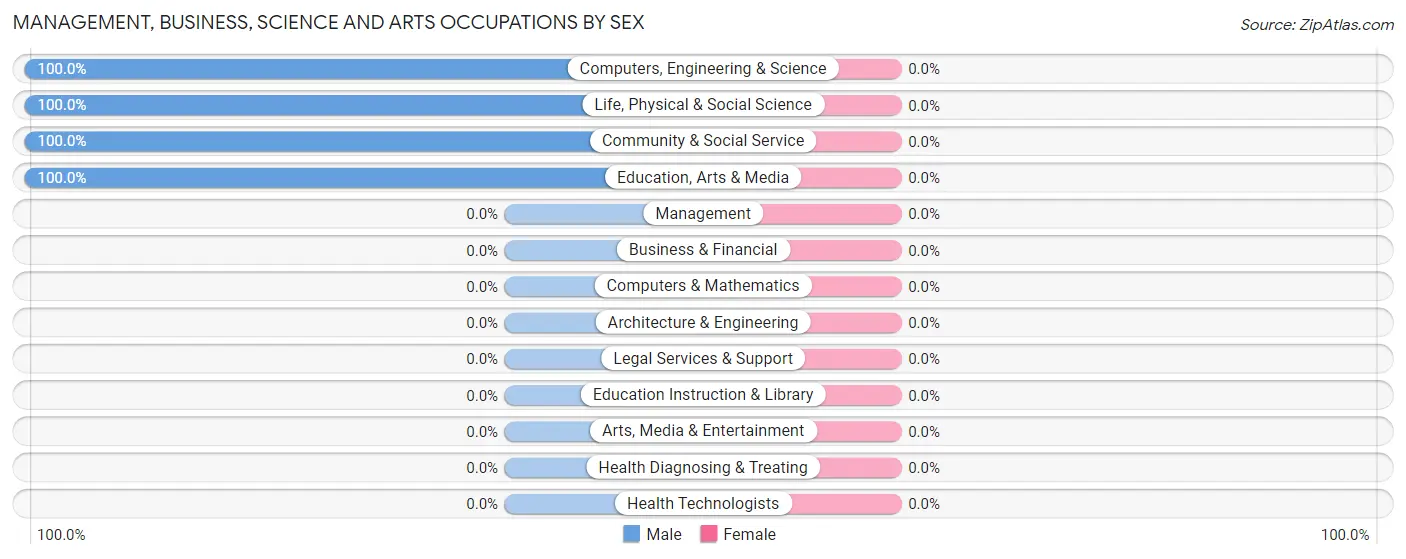
| Occupation | Male | Female |
| Management | 0 (0.0%) | 0 (0.0%) |
| Business & Financial | 0 (0.0%) | 0 (0.0%) |
| Computers, Engineering & Science | 5 (100.0%) | 0 (0.0%) |
| Computers & Mathematics | 0 (0.0%) | 0 (0.0%) |
| Architecture & Engineering | 0 (0.0%) | 0 (0.0%) |
| Life, Physical & Social Science | 5 (100.0%) | 0 (0.0%) |
| Community & Social Service | 31 (100.0%) | 0 (0.0%) |
| Education, Arts & Media | 31 (100.0%) | 0 (0.0%) |
| Legal Services & Support | 0 (0.0%) | 0 (0.0%) |
| Education Instruction & Library | 0 (0.0%) | 0 (0.0%) |
| Arts, Media & Entertainment | 0 (0.0%) | 0 (0.0%) |
| Health Diagnosing & Treating | 0 (0.0%) | 0 (0.0%) |
| Health Technologists | 0 (0.0%) | 0 (0.0%) |
| Total (Category) | 36 (100.0%) | 0 (0.0%) |
| Total (Overall) | 67 (100.0%) | 0 (0.0%) |
Services Occupations
Services Occupations by Sex
| Occupation | Male | Female |
| Healthcare Support | 0 (0.0%) | 0 (0.0%) |
| Security & Protection | 0 (0.0%) | 0 (0.0%) |
| Firefighting & Prevention | 0 (0.0%) | 0 (0.0%) |
| Law Enforcement | 0 (0.0%) | 0 (0.0%) |
| Food Preparation & Serving | 0 (0.0%) | 0 (0.0%) |
| Cleaning & Maintenance | 0 (0.0%) | 0 (0.0%) |
| Personal Care & Service | 0 (0.0%) | 0 (0.0%) |
| Total (Category) | 0 (0.0%) | 0 (0.0%) |
| Total (Overall) | 67 (100.0%) | 0 (0.0%) |
Sales and Office Occupations
Sales and Office Occupations by Sex
| Occupation | Male | Female |
| Sales & Related | 0 (0.0%) | 0 (0.0%) |
| Office & Administration | 0 (0.0%) | 0 (0.0%) |
| Total (Category) | 0 (0.0%) | 0 (0.0%) |
| Total (Overall) | 67 (100.0%) | 0 (0.0%) |
Natural Resources, Construction and Maintenance Occupations
The most common Natural Resources, Construction and Maintenance occupations in Topawa are , and Construction & Extraction (13 | 19.4%).
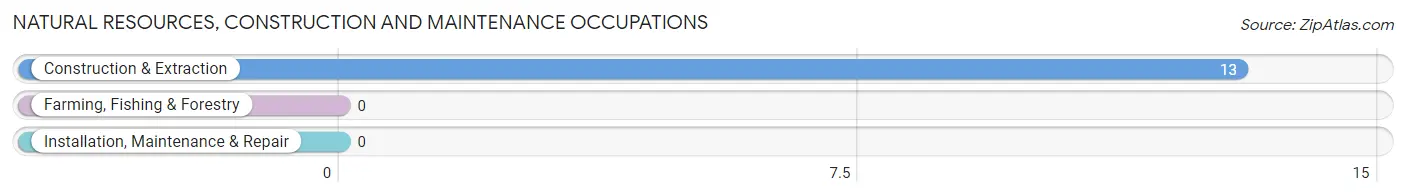
Natural Resources, Construction and Maintenance Occupations by Sex
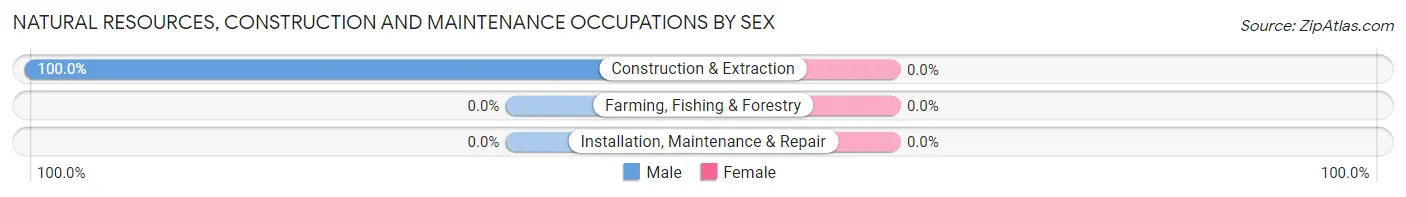
| Occupation | Male | Female |
| Farming, Fishing & Forestry | 0 (0.0%) | 0 (0.0%) |
| Construction & Extraction | 13 (100.0%) | 0 (0.0%) |
| Installation, Maintenance & Repair | 0 (0.0%) | 0 (0.0%) |
| Total (Category) | 13 (100.0%) | 0 (0.0%) |
| Total (Overall) | 67 (100.0%) | 0 (0.0%) |
Production, Transportation and Moving Occupations
The most common Production, Transportation and Moving occupations in Topawa are , and Production (18 | 26.9%).
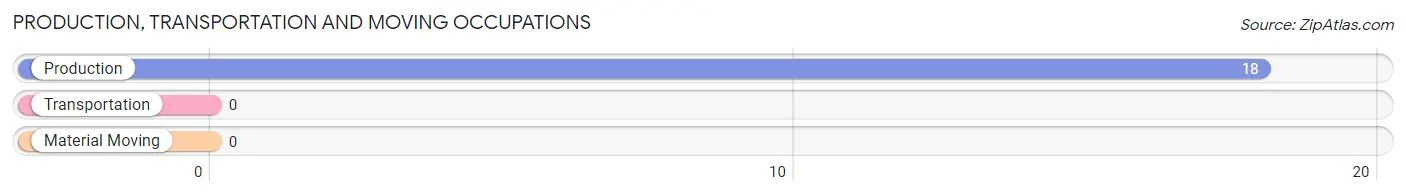
Production, Transportation and Moving Occupations by Sex
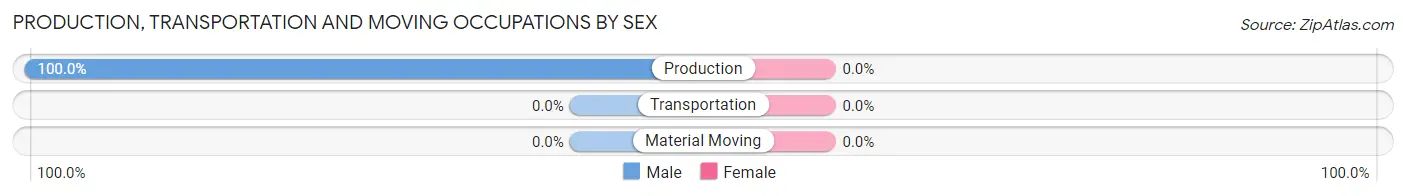
| Occupation | Male | Female |
| Production | 18 (100.0%) | 0 (0.0%) |
| Transportation | 0 (0.0%) | 0 (0.0%) |
| Material Moving | 0 (0.0%) | 0 (0.0%) |
| Total (Category) | 18 (100.0%) | 0 (0.0%) |
| Total (Overall) | 67 (100.0%) | 0 (0.0%) |
Employment Industries by Sex in Topawa
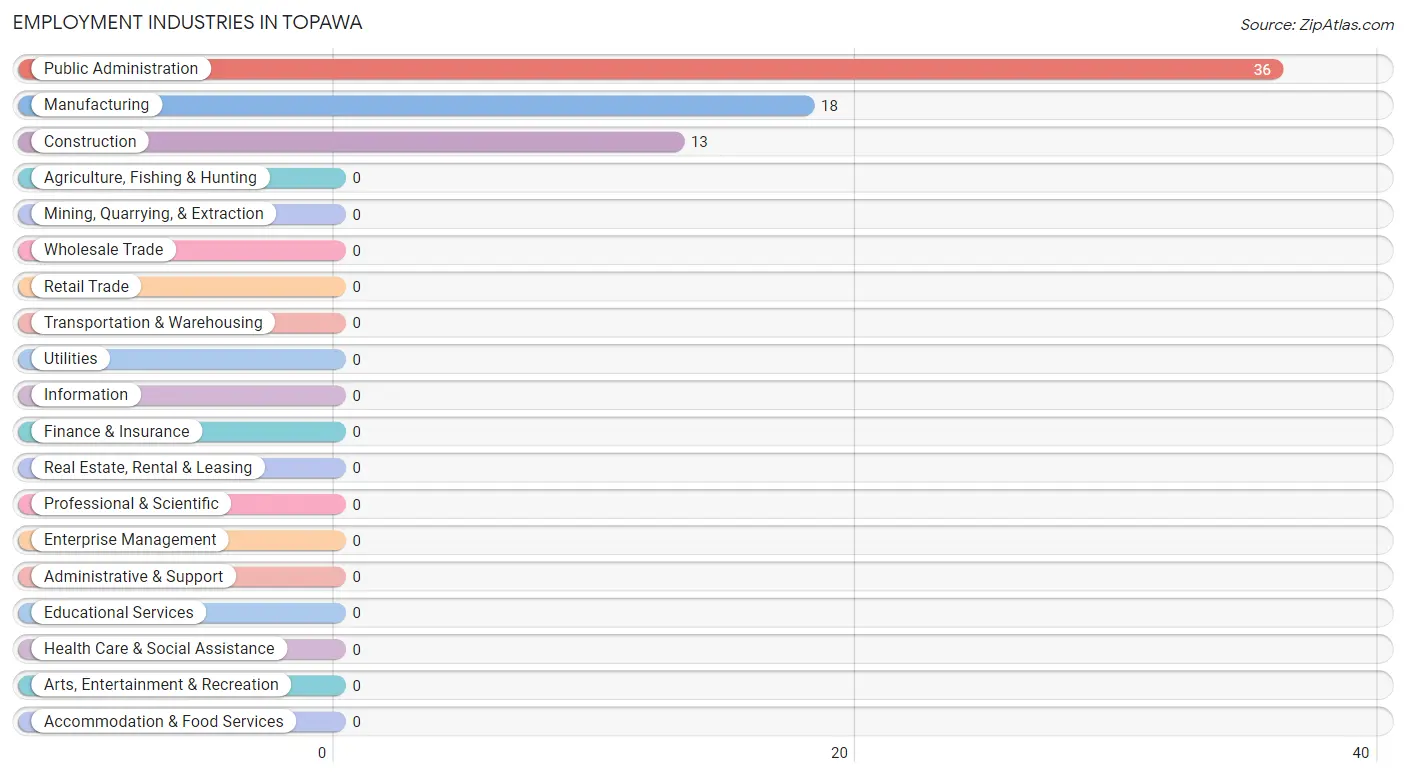
Employment Industries in Topawa
The major employment industries in Topawa include Public Administration (36 | 53.7%), Manufacturing (18 | 26.9%), and Construction (13 | 19.4%).
Employment Industries by Sex in Topawa
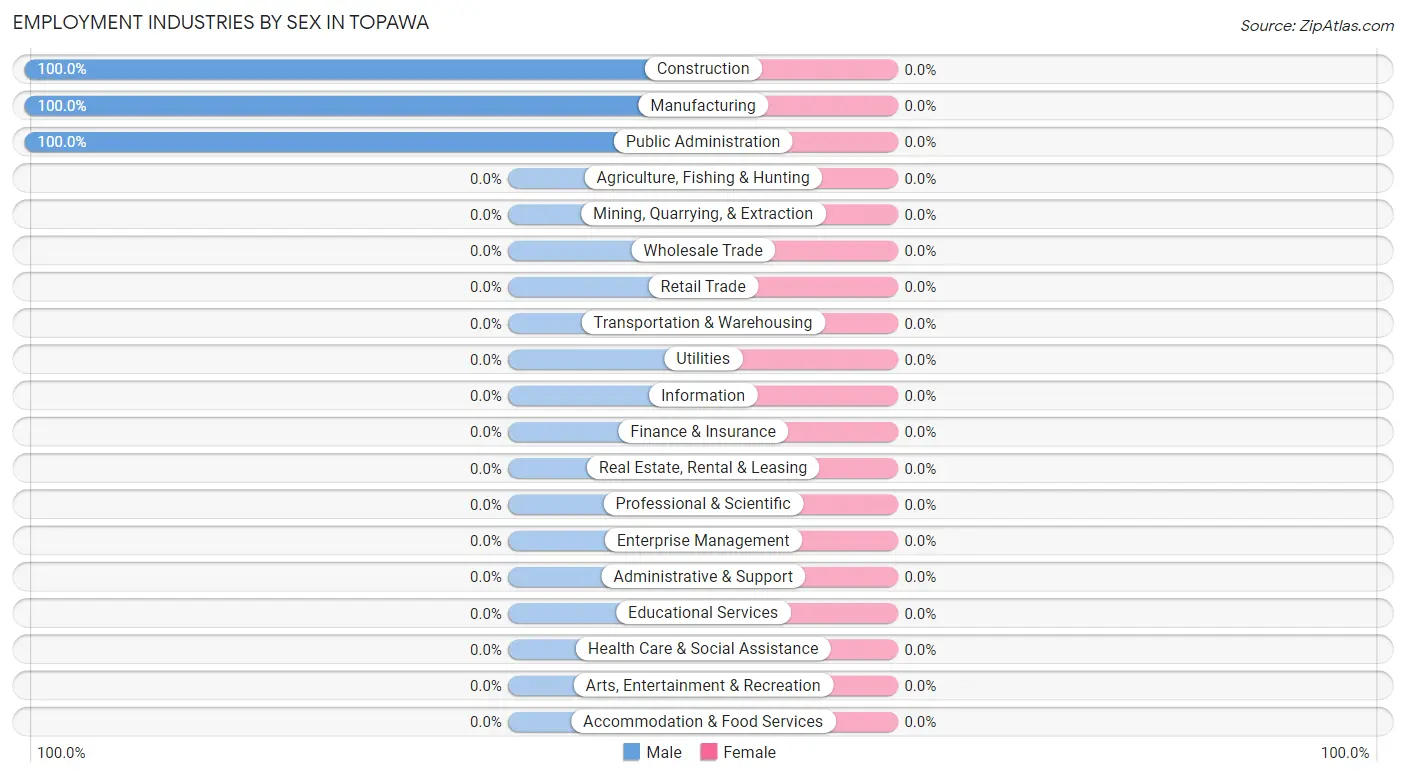
| Industry | Male | Female |
| Agriculture, Fishing & Hunting | 0 (0.0%) | 0 (0.0%) |
| Mining, Quarrying, & Extraction | 0 (0.0%) | 0 (0.0%) |
| Construction | 13 (100.0%) | 0 (0.0%) |
| Manufacturing | 18 (100.0%) | 0 (0.0%) |
| Wholesale Trade | 0 (0.0%) | 0 (0.0%) |
| Retail Trade | 0 (0.0%) | 0 (0.0%) |
| Transportation & Warehousing | 0 (0.0%) | 0 (0.0%) |
| Utilities | 0 (0.0%) | 0 (0.0%) |
| Information | 0 (0.0%) | 0 (0.0%) |
| Finance & Insurance | 0 (0.0%) | 0 (0.0%) |
| Real Estate, Rental & Leasing | 0 (0.0%) | 0 (0.0%) |
| Professional & Scientific | 0 (0.0%) | 0 (0.0%) |
| Enterprise Management | 0 (0.0%) | 0 (0.0%) |
| Administrative & Support | 0 (0.0%) | 0 (0.0%) |
| Educational Services | 0 (0.0%) | 0 (0.0%) |
| Health Care & Social Assistance | 0 (0.0%) | 0 (0.0%) |
| Arts, Entertainment & Recreation | 0 (0.0%) | 0 (0.0%) |
| Accommodation & Food Services | 0 (0.0%) | 0 (0.0%) |
| Public Administration | 36 (100.0%) | 0 (0.0%) |
| Total | 67 (100.0%) | 0 (0.0%) |
Education in Topawa
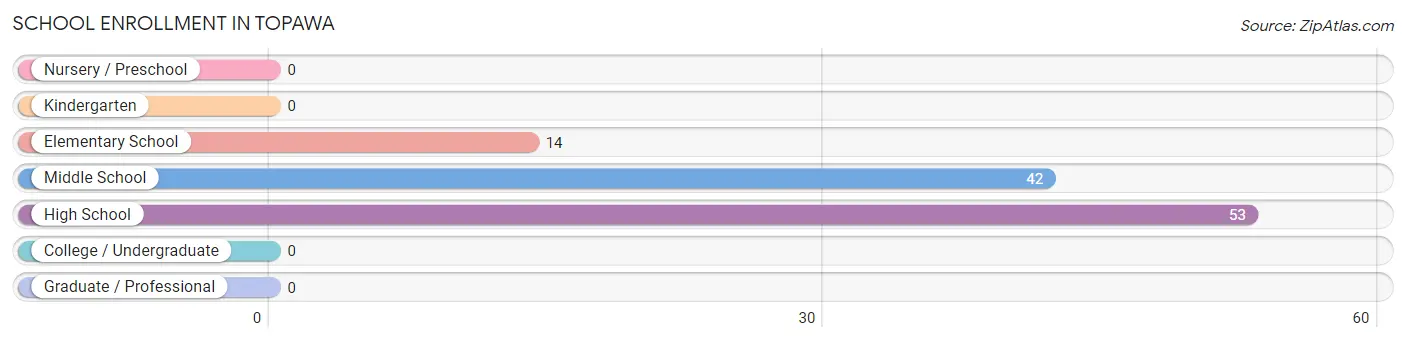
School Enrollment in Topawa
The most common levels of schooling among the 109 students in Topawa are high school (53 | 48.6%), middle school (42 | 38.5%), and elementary school (14 | 12.8%).
| School Level | # Students | % Students |
| Nursery / Preschool | 0 | 0.0% |
| Kindergarten | 0 | 0.0% |
| Elementary School | 14 | 12.8% |
| Middle School | 42 | 38.5% |
| High School | 53 | 48.6% |
| College / Undergraduate | 0 | 0.0% |
| Graduate / Professional | 0 | 0.0% |
| Total | 109 | 100.0% |
School Enrollment by Age by Funding Source in Topawa
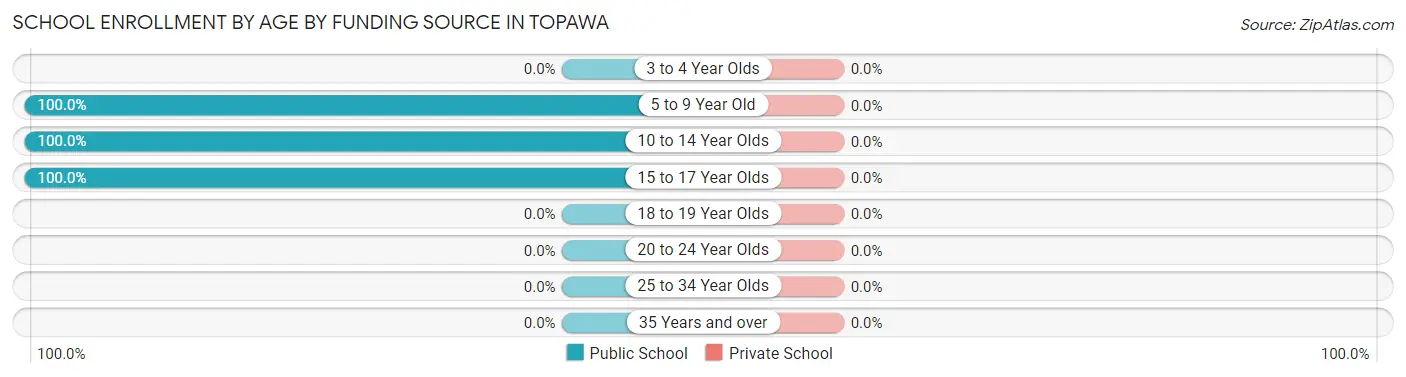
| Age Bracket | Public School | Private School |
| 3 to 4 Year Olds | 0 (0.0%) | 0 (0.0%) |
| 5 to 9 Year Old | 14 (100.0%) | 0 (0.0%) |
| 10 to 14 Year Olds | 42 (100.0%) | 0 (0.0%) |
| 15 to 17 Year Olds | 53 (100.0%) | 0 (0.0%) |
| 18 to 19 Year Olds | 0 (0.0%) | 0 (0.0%) |
| 20 to 24 Year Olds | 0 (0.0%) | 0 (0.0%) |
| 25 to 34 Year Olds | 0 (0.0%) | 0 (0.0%) |
| 35 Years and over | 0 (0.0%) | 0 (0.0%) |
| Total | 109 (100.0%) | 0 (0.0%) |
Educational Attainment by Field of Study in Topawa
Arts & humanities (18 | 66.7%), and bio, nature & agricultural (9 | 33.3%) are the most common fields of study among 27 individuals in Topawa who have obtained a bachelor's degree or higher.
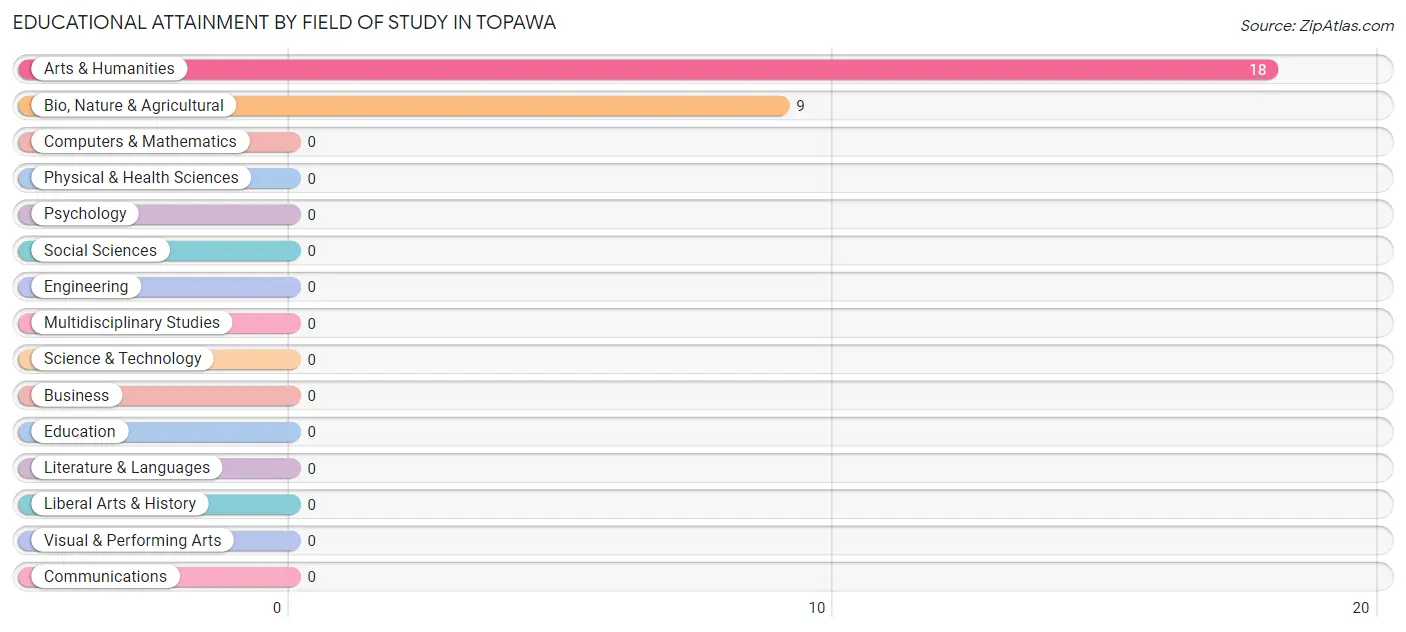
| Field of Study | # Graduates | % Graduates |
| Computers & Mathematics | 0 | 0.0% |
| Bio, Nature & Agricultural | 9 | 33.3% |
| Physical & Health Sciences | 0 | 0.0% |
| Psychology | 0 | 0.0% |
| Social Sciences | 0 | 0.0% |
| Engineering | 0 | 0.0% |
| Multidisciplinary Studies | 0 | 0.0% |
| Science & Technology | 0 | 0.0% |
| Business | 0 | 0.0% |
| Education | 0 | 0.0% |
| Literature & Languages | 0 | 0.0% |
| Liberal Arts & History | 0 | 0.0% |
| Visual & Performing Arts | 0 | 0.0% |
| Communications | 0 | 0.0% |
| Arts & Humanities | 18 | 66.7% |
| Total | 27 | 100.0% |
Transportation & Commute in Topawa
Vehicle Availability by Sex in Topawa
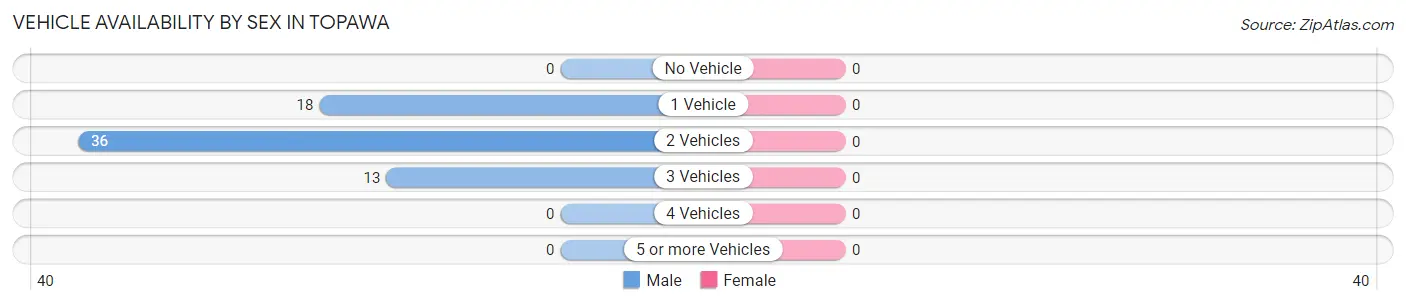
| Vehicles Available | Male | Female |
| No Vehicle | 0 (0.0%) | 0 (0.0%) |
| 1 Vehicle | 18 (26.9%) | 0 (0.0%) |
| 2 Vehicles | 36 (53.7%) | 0 (0.0%) |
| 3 Vehicles | 13 (19.4%) | 0 (0.0%) |
| 4 Vehicles | 0 (0.0%) | 0 (0.0%) |
| 5 or more Vehicles | 0 (0.0%) | 0 (0.0%) |
| Total | 67 (100.0%) | 0 (0.0%) |
Commute Time in Topawa
The most frequently occuring commute durations in Topawa are 15 to 19 minutes (31 commuters, 46.3%), 40 to 44 minutes (18 commuters, 26.9%), and 30 to 34 minutes (13 commuters, 19.4%).
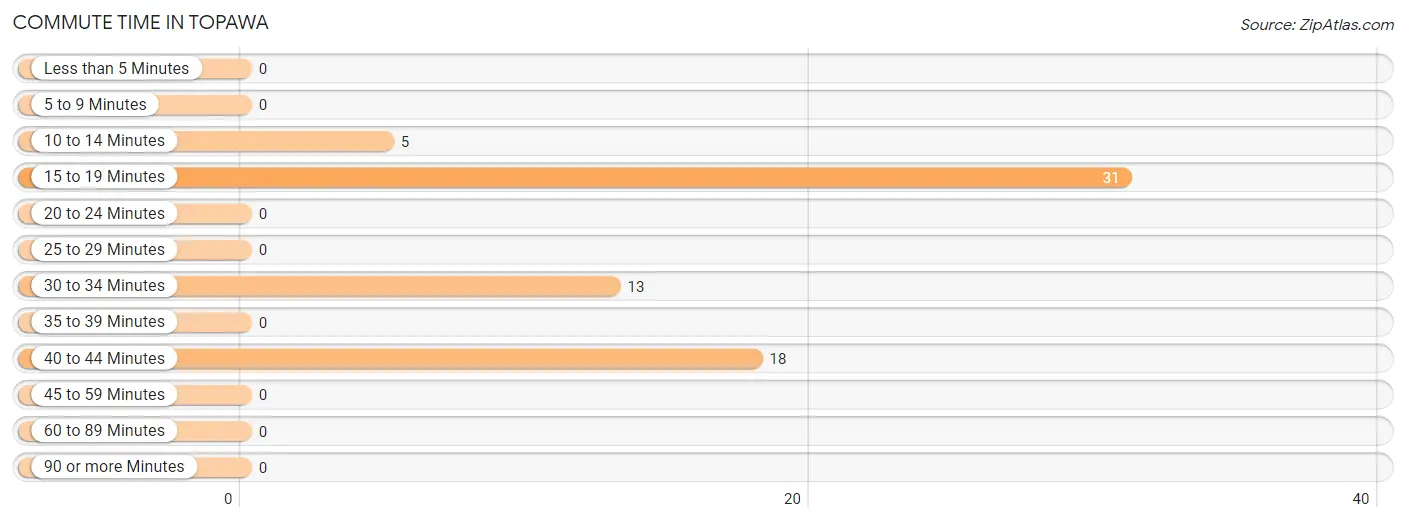
| Commute Time | # Commuters | % Commuters |
| Less than 5 Minutes | 0 | 0.0% |
| 5 to 9 Minutes | 0 | 0.0% |
| 10 to 14 Minutes | 5 | 7.5% |
| 15 to 19 Minutes | 31 | 46.3% |
| 20 to 24 Minutes | 0 | 0.0% |
| 25 to 29 Minutes | 0 | 0.0% |
| 30 to 34 Minutes | 13 | 19.4% |
| 35 to 39 Minutes | 0 | 0.0% |
| 40 to 44 Minutes | 18 | 26.9% |
| 45 to 59 Minutes | 0 | 0.0% |
| 60 to 89 Minutes | 0 | 0.0% |
| 90 or more Minutes | 0 | 0.0% |
Commute Time by Sex in Topawa
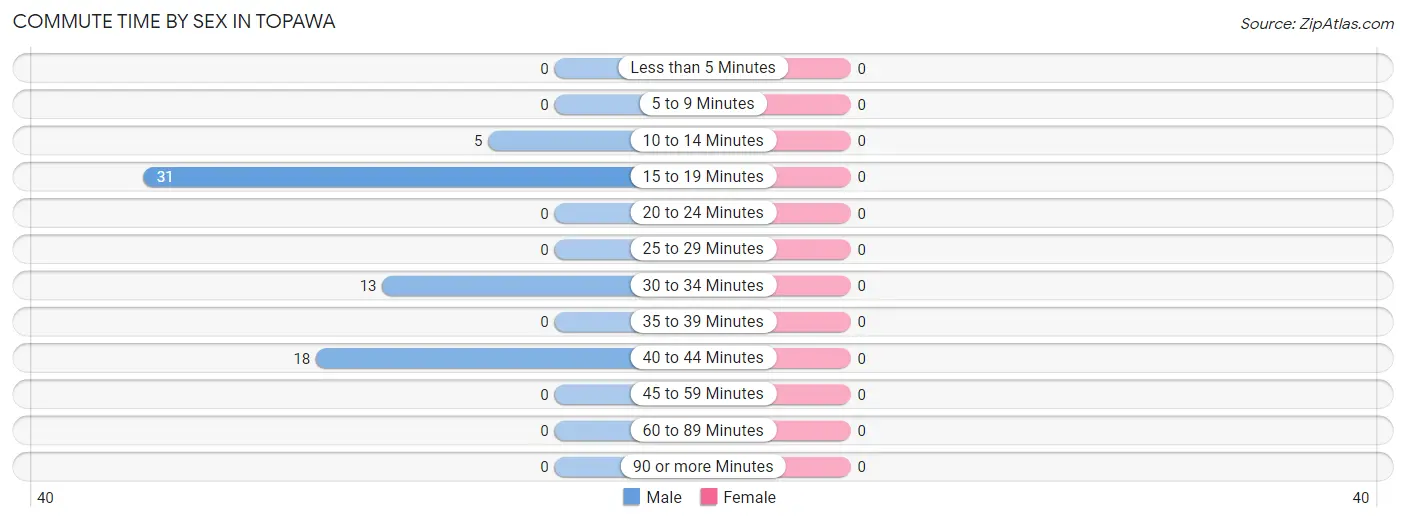
| Commute Time | Male | Female |
| Less than 5 Minutes | 0 (0.0%) | 0 (0.0%) |
| 5 to 9 Minutes | 0 (0.0%) | 0 (0.0%) |
| 10 to 14 Minutes | 5 (7.5%) | 0 (0.0%) |
| 15 to 19 Minutes | 31 (46.3%) | 0 (0.0%) |
| 20 to 24 Minutes | 0 (0.0%) | 0 (0.0%) |
| 25 to 29 Minutes | 0 (0.0%) | 0 (0.0%) |
| 30 to 34 Minutes | 13 (19.4%) | 0 (0.0%) |
| 35 to 39 Minutes | 0 (0.0%) | 0 (0.0%) |
| 40 to 44 Minutes | 18 (26.9%) | 0 (0.0%) |
| 45 to 59 Minutes | 0 (0.0%) | 0 (0.0%) |
| 60 to 89 Minutes | 0 (0.0%) | 0 (0.0%) |
| 90 or more Minutes | 0 (0.0%) | 0 (0.0%) |
Time of Departure to Work by Sex in Topawa
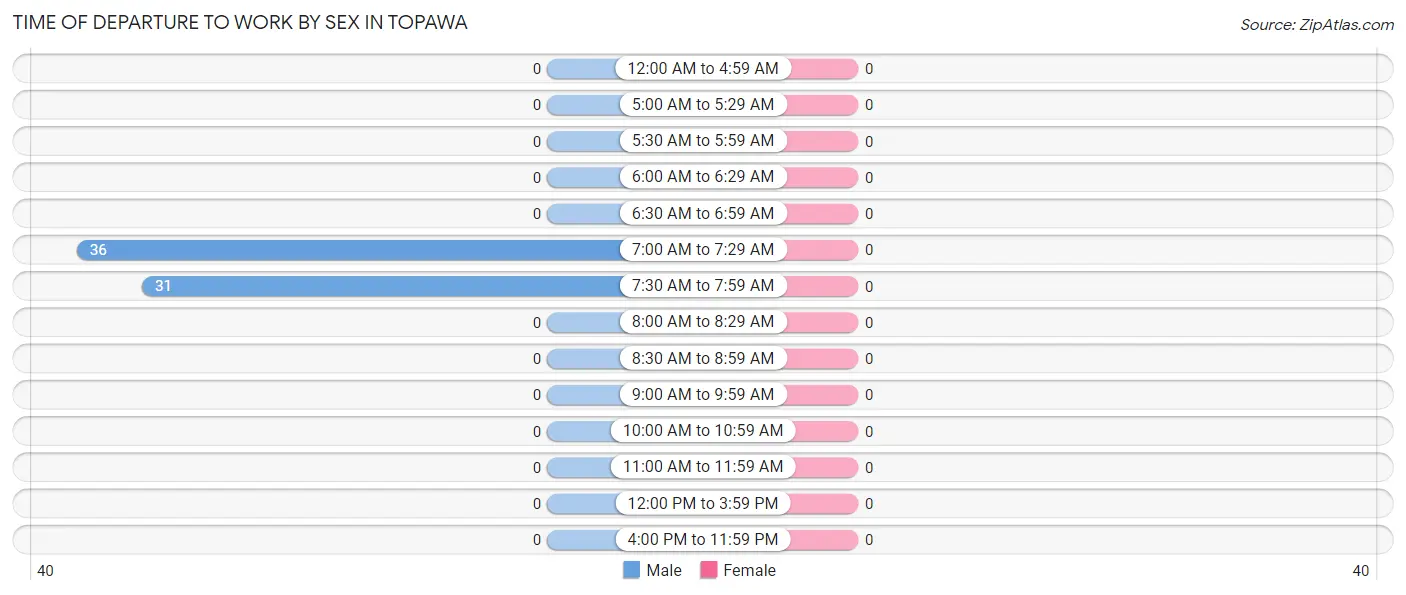
| Time of Departure | Male | Female |
| 12:00 AM to 4:59 AM | 0 (0.0%) | 0 (0.0%) |
| 5:00 AM to 5:29 AM | 0 (0.0%) | 0 (0.0%) |
| 5:30 AM to 5:59 AM | 0 (0.0%) | 0 (0.0%) |
| 6:00 AM to 6:29 AM | 0 (0.0%) | 0 (0.0%) |
| 6:30 AM to 6:59 AM | 0 (0.0%) | 0 (0.0%) |
| 7:00 AM to 7:29 AM | 36 (53.7%) | 0 (0.0%) |
| 7:30 AM to 7:59 AM | 31 (46.3%) | 0 (0.0%) |
| 8:00 AM to 8:29 AM | 0 (0.0%) | 0 (0.0%) |
| 8:30 AM to 8:59 AM | 0 (0.0%) | 0 (0.0%) |
| 9:00 AM to 9:59 AM | 0 (0.0%) | 0 (0.0%) |
| 10:00 AM to 10:59 AM | 0 (0.0%) | 0 (0.0%) |
| 11:00 AM to 11:59 AM | 0 (0.0%) | 0 (0.0%) |
| 12:00 PM to 3:59 PM | 0 (0.0%) | 0 (0.0%) |
| 4:00 PM to 11:59 PM | 0 (0.0%) | 0 (0.0%) |
| Total | 67 (100.0%) | 0 (0.0%) |
Housing Occupancy in Topawa
Occupancy by Ownership in Topawa
Of the total 113 dwellings in Topawa, owner-occupied units account for 71 (62.8%), while renter-occupied units make up 42 (37.2%).
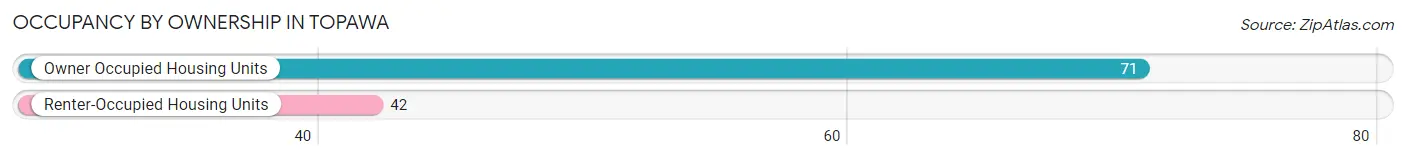
| Occupancy | # Housing Units | % Housing Units |
| Owner Occupied Housing Units | 71 | 62.8% |
| Renter-Occupied Housing Units | 42 | 37.2% |
| Total Occupied Housing Units | 113 | 100.0% |
Occupancy by Household Size in Topawa
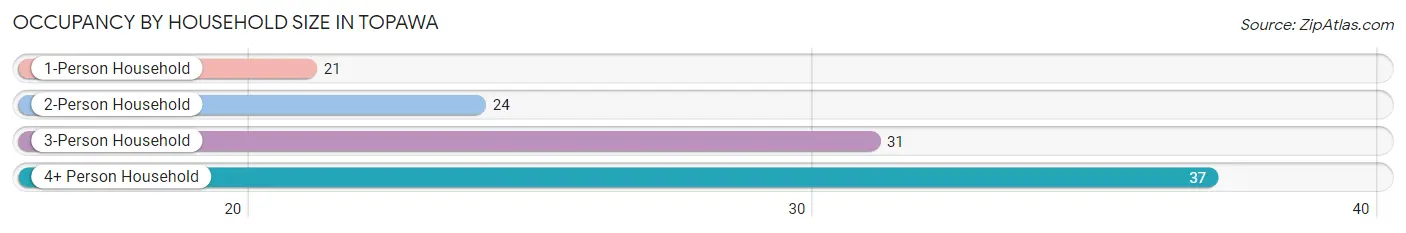
| Household Size | # Housing Units | % Housing Units |
| 1-Person Household | 21 | 18.6% |
| 2-Person Household | 24 | 21.2% |
| 3-Person Household | 31 | 27.4% |
| 4+ Person Household | 37 | 32.7% |
| Total Housing Units | 113 | 100.0% |
Occupancy by Ownership by Household Size in Topawa
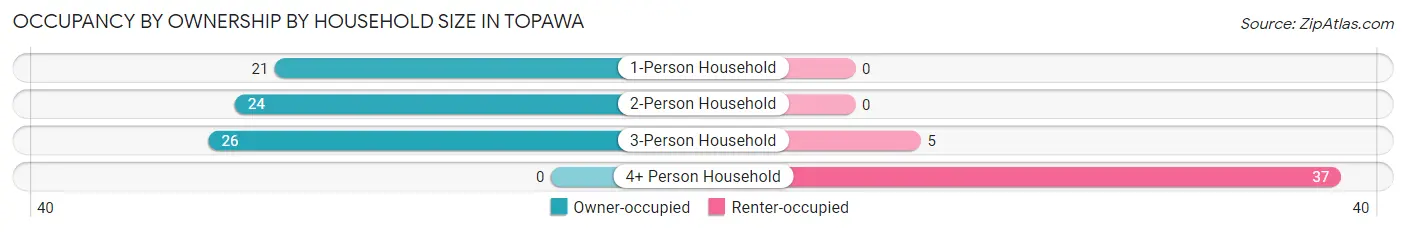
| Household Size | Owner-occupied | Renter-occupied |
| 1-Person Household | 21 (100.0%) | 0 (0.0%) |
| 2-Person Household | 24 (100.0%) | 0 (0.0%) |
| 3-Person Household | 26 (83.9%) | 5 (16.1%) |
| 4+ Person Household | 0 (0.0%) | 37 (100.0%) |
| Total Housing Units | 71 (62.8%) | 42 (37.2%) |
Occupancy by Educational Attainment in Topawa
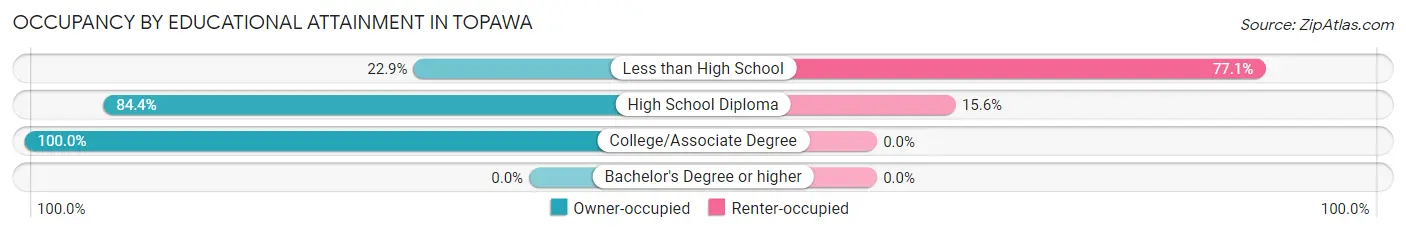
| Household Size | Owner-occupied | Renter-occupied |
| Less than High School | 11 (22.9%) | 37 (77.1%) |
| High School Diploma | 27 (84.4%) | 5 (15.6%) |
| College/Associate Degree | 33 (100.0%) | 0 (0.0%) |
| Bachelor's Degree or higher | 0 (0.0%) | 0 (0.0%) |
Occupancy by Age of Householder in Topawa
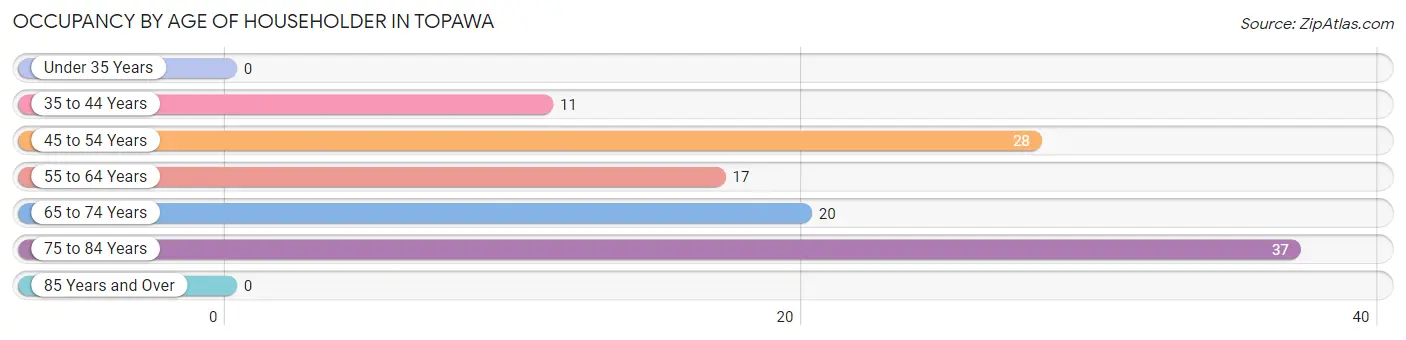
| Age Bracket | # Households | % Households |
| Under 35 Years | 0 | 0.0% |
| 35 to 44 Years | 11 | 9.7% |
| 45 to 54 Years | 28 | 24.8% |
| 55 to 64 Years | 17 | 15.0% |
| 65 to 74 Years | 20 | 17.7% |
| 75 to 84 Years | 37 | 32.7% |
| 85 Years and Over | 0 | 0.0% |
| Total | 113 | 100.0% |
Housing Finances in Topawa
Median Income by Occupancy in Topawa
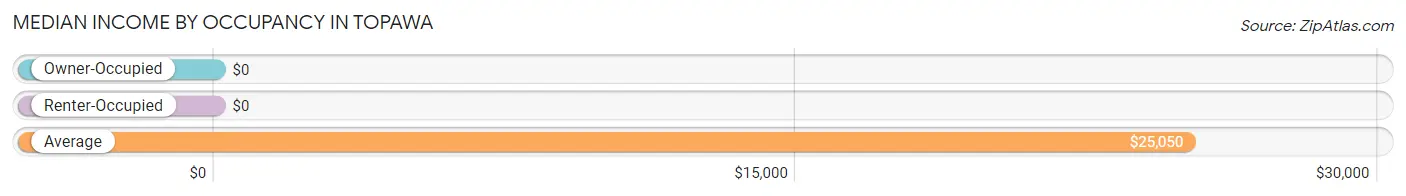
| Occupancy Type | # Households | Median Income |
| Owner-Occupied | 71 (62.8%) | $0 |
| Renter-Occupied | 42 (37.2%) | $0 |
| Average | 113 (100.0%) | $25,050 |
Occupancy by Householder Income Bracket in Topawa
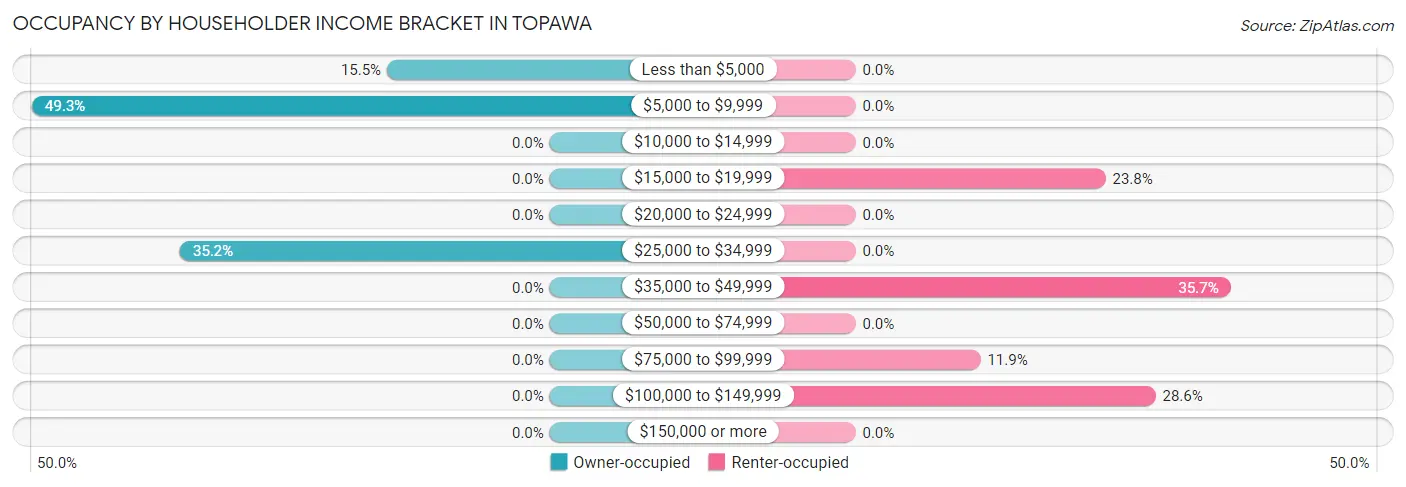
| Income Bracket | Owner-occupied | Renter-occupied |
| Less than $5,000 | 11 (15.5%) | 0 (0.0%) |
| $5,000 to $9,999 | 35 (49.3%) | 0 (0.0%) |
| $10,000 to $14,999 | 0 (0.0%) | 0 (0.0%) |
| $15,000 to $19,999 | 0 (0.0%) | 10 (23.8%) |
| $20,000 to $24,999 | 0 (0.0%) | 0 (0.0%) |
| $25,000 to $34,999 | 25 (35.2%) | 0 (0.0%) |
| $35,000 to $49,999 | 0 (0.0%) | 15 (35.7%) |
| $50,000 to $74,999 | 0 (0.0%) | 0 (0.0%) |
| $75,000 to $99,999 | 0 (0.0%) | 5 (11.9%) |
| $100,000 to $149,999 | 0 (0.0%) | 12 (28.6%) |
| $150,000 or more | 0 (0.0%) | 0 (0.0%) |
| Total | 71 (100.0%) | 42 (100.0%) |
Monthly Housing Cost Tiers in Topawa
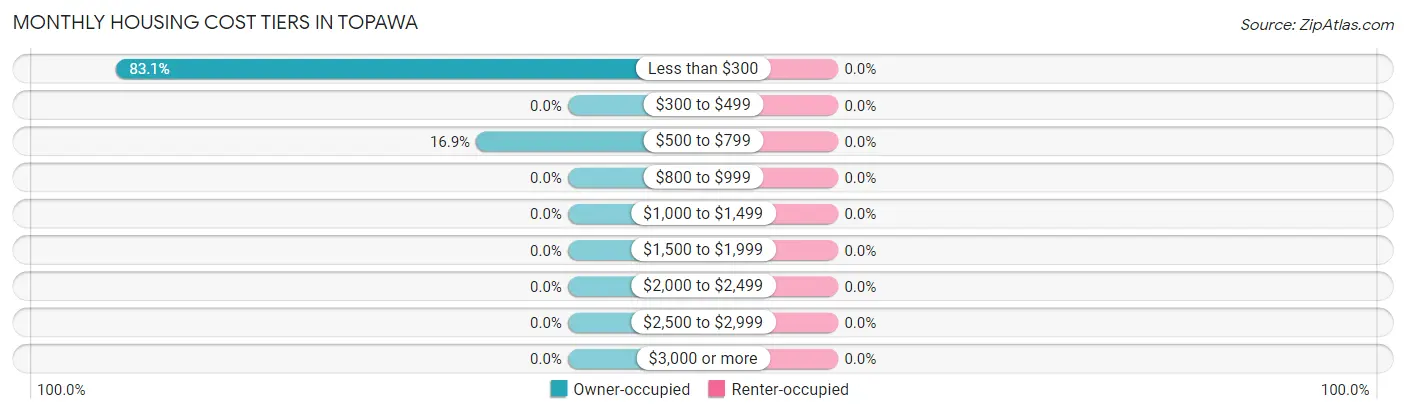
| Monthly Cost | Owner-occupied | Renter-occupied |
| Less than $300 | 59 (83.1%) | 0 (0.0%) |
| $300 to $499 | 0 (0.0%) | 0 (0.0%) |
| $500 to $799 | 12 (16.9%) | 0 (0.0%) |
| $800 to $999 | 0 (0.0%) | 0 (0.0%) |
| $1,000 to $1,499 | 0 (0.0%) | 0 (0.0%) |
| $1,500 to $1,999 | 0 (0.0%) | 0 (0.0%) |
| $2,000 to $2,499 | 0 (0.0%) | 0 (0.0%) |
| $2,500 to $2,999 | 0 (0.0%) | 0 (0.0%) |
| $3,000 or more | 0 (0.0%) | 0 (0.0%) |
| Total | 71 (100.0%) | 42 (100.0%) |
Physical Housing Characteristics in Topawa
Housing Structures in Topawa
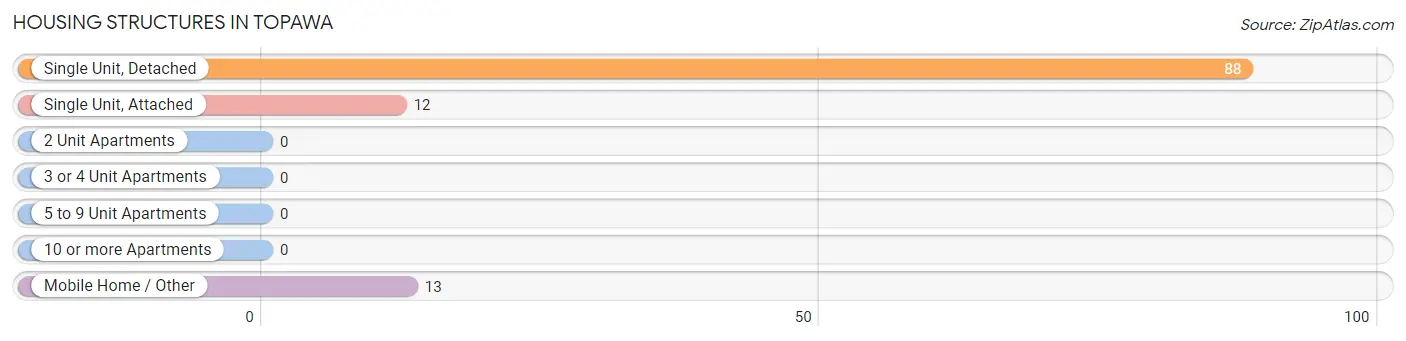
| Structure Type | # Housing Units | % Housing Units |
| Single Unit, Detached | 88 | 77.9% |
| Single Unit, Attached | 12 | 10.6% |
| 2 Unit Apartments | 0 | 0.0% |
| 3 or 4 Unit Apartments | 0 | 0.0% |
| 5 to 9 Unit Apartments | 0 | 0.0% |
| 10 or more Apartments | 0 | 0.0% |
| Mobile Home / Other | 13 | 11.5% |
| Total | 113 | 100.0% |
Housing Structures by Occupancy in Topawa
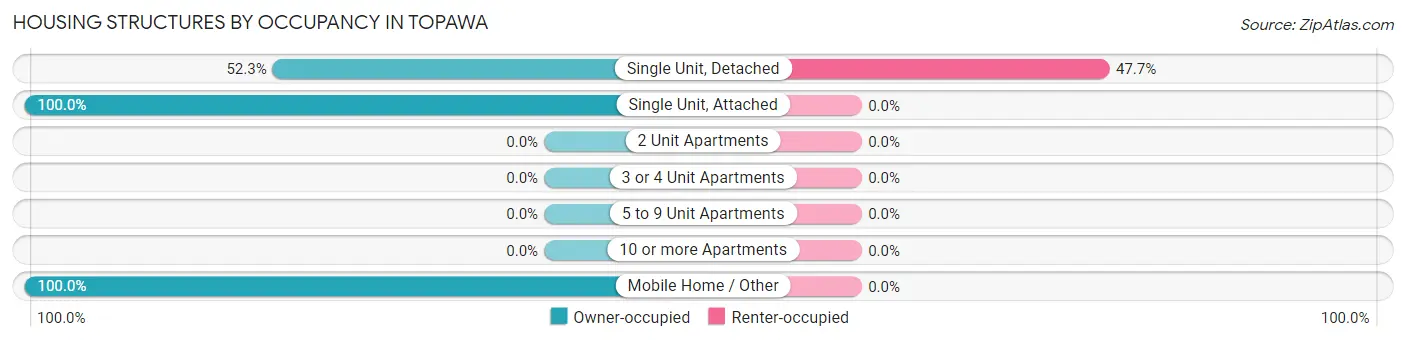
| Structure Type | Owner-occupied | Renter-occupied |
| Single Unit, Detached | 46 (52.3%) | 42 (47.7%) |
| Single Unit, Attached | 12 (100.0%) | 0 (0.0%) |
| 2 Unit Apartments | 0 (0.0%) | 0 (0.0%) |
| 3 or 4 Unit Apartments | 0 (0.0%) | 0 (0.0%) |
| 5 to 9 Unit Apartments | 0 (0.0%) | 0 (0.0%) |
| 10 or more Apartments | 0 (0.0%) | 0 (0.0%) |
| Mobile Home / Other | 13 (100.0%) | 0 (0.0%) |
| Total | 71 (62.8%) | 42 (37.2%) |
Housing Structures by Number of Rooms in Topawa
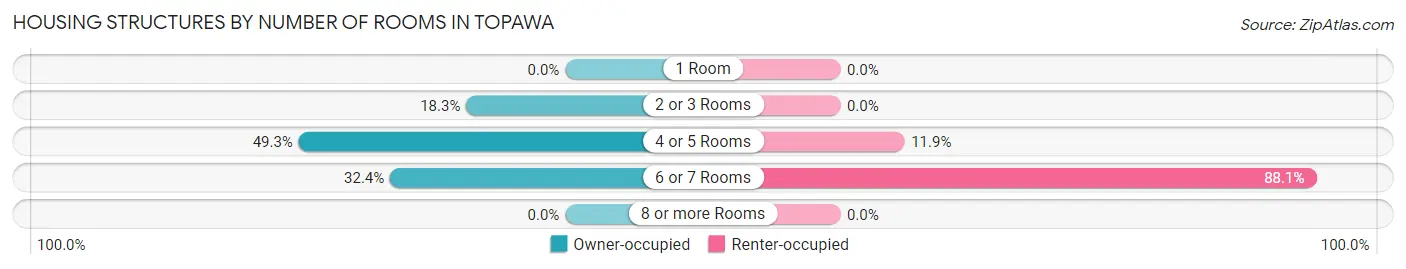
| Number of Rooms | Owner-occupied | Renter-occupied |
| 1 Room | 0 (0.0%) | 0 (0.0%) |
| 2 or 3 Rooms | 13 (18.3%) | 0 (0.0%) |
| 4 or 5 Rooms | 35 (49.3%) | 5 (11.9%) |
| 6 or 7 Rooms | 23 (32.4%) | 37 (88.1%) |
| 8 or more Rooms | 0 (0.0%) | 0 (0.0%) |
| Total | 71 (100.0%) | 42 (100.0%) |
Housing Structure by Heating Type in Topawa
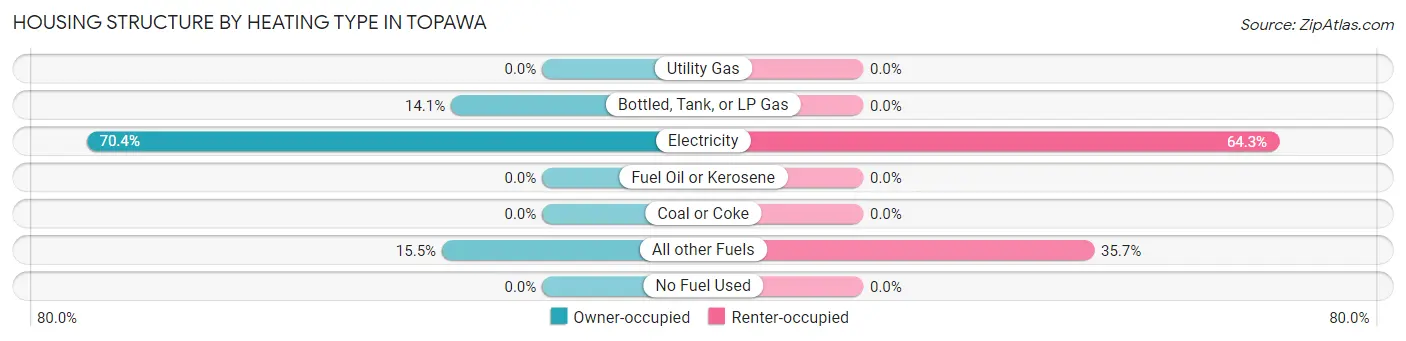
| Heating Type | Owner-occupied | Renter-occupied |
| Utility Gas | 0 (0.0%) | 0 (0.0%) |
| Bottled, Tank, or LP Gas | 10 (14.1%) | 0 (0.0%) |
| Electricity | 50 (70.4%) | 27 (64.3%) |
| Fuel Oil or Kerosene | 0 (0.0%) | 0 (0.0%) |
| Coal or Coke | 0 (0.0%) | 0 (0.0%) |
| All other Fuels | 11 (15.5%) | 15 (35.7%) |
| No Fuel Used | 0 (0.0%) | 0 (0.0%) |
| Total | 71 (100.0%) | 42 (100.0%) |
Household Vehicle Usage in Topawa
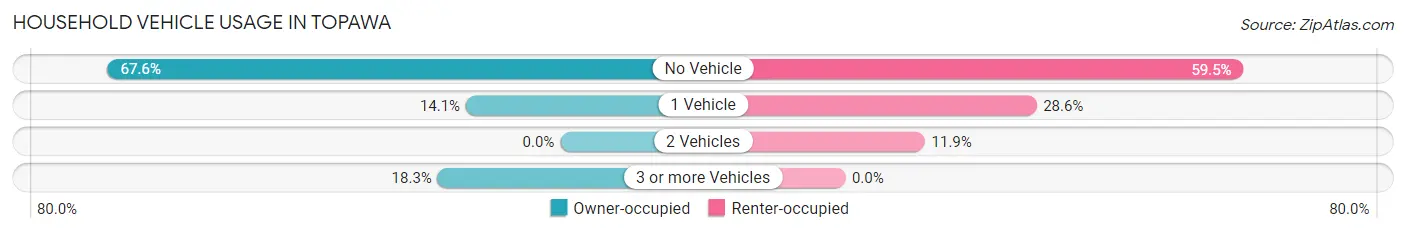
| Vehicles per Household | Owner-occupied | Renter-occupied |
| No Vehicle | 48 (67.6%) | 25 (59.5%) |
| 1 Vehicle | 10 (14.1%) | 12 (28.6%) |
| 2 Vehicles | 0 (0.0%) | 5 (11.9%) |
| 3 or more Vehicles | 13 (18.3%) | 0 (0.0%) |
| Total | 71 (100.0%) | 42 (100.0%) |
Real Estate & Mortgages in Topawa
Real Estate and Mortgage Overview in Topawa
| Characteristic | Without Mortgage | With Mortgage |
| Housing Units | 59 | 12 |
| Median Property Value | - | - |
| Median Household Income | $8,821 | $0 |
| Monthly Housing Costs | $234 | $0 |
| Real Estate Taxes | - | - |
Property Value by Mortgage Status in Topawa
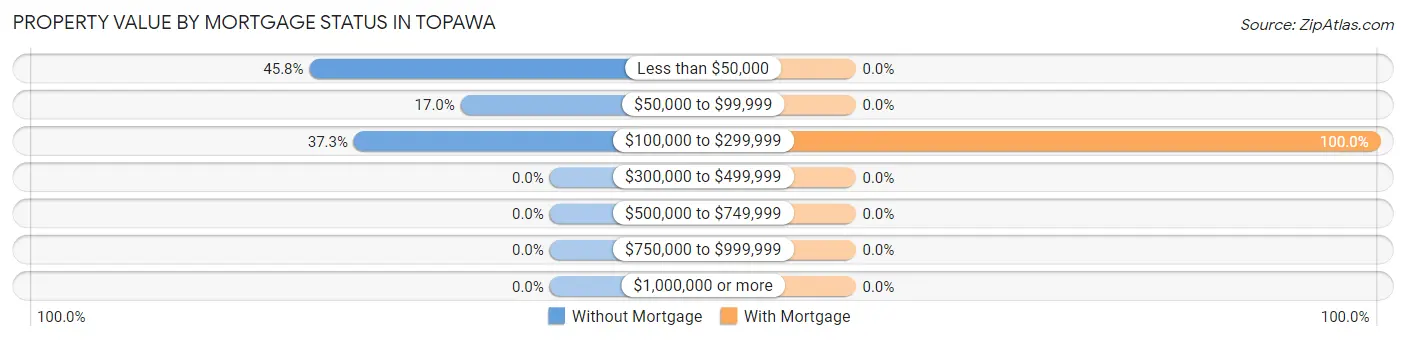
| Property Value | Without Mortgage | With Mortgage |
| Less than $50,000 | 27 (45.8%) | 0 (0.0%) |
| $50,000 to $99,999 | 10 (17.0%) | 0 (0.0%) |
| $100,000 to $299,999 | 22 (37.3%) | 12 (100.0%) |
| $300,000 to $499,999 | 0 (0.0%) | 0 (0.0%) |
| $500,000 to $749,999 | 0 (0.0%) | 0 (0.0%) |
| $750,000 to $999,999 | 0 (0.0%) | 0 (0.0%) |
| $1,000,000 or more | 0 (0.0%) | 0 (0.0%) |
| Total | 59 (100.0%) | 12 (100.0%) |
Household Income by Mortgage Status in Topawa
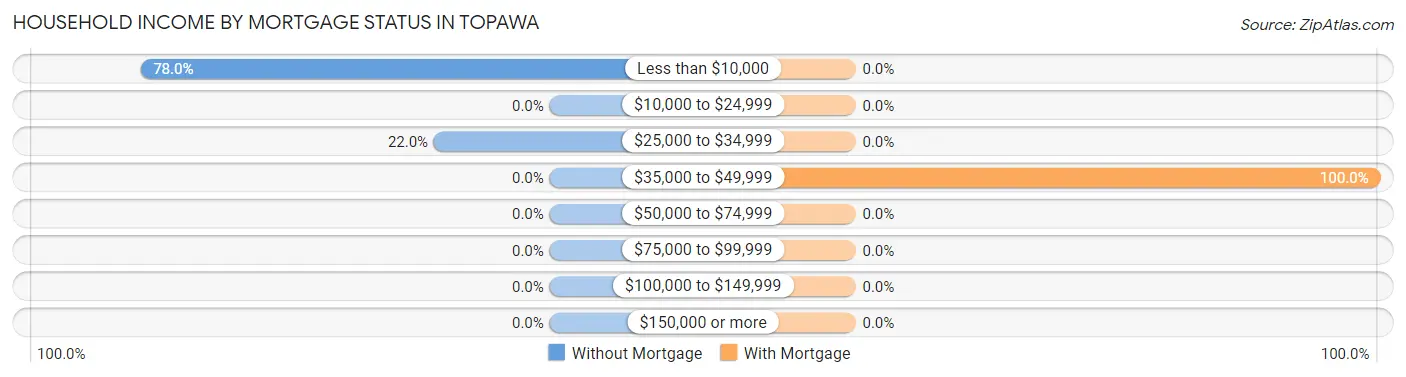
| Household Income | Without Mortgage | With Mortgage |
| Less than $10,000 | 46 (78.0%) | 0 (0.0%) |
| $10,000 to $24,999 | 0 (0.0%) | 0 (0.0%) |
| $25,000 to $34,999 | 13 (22.0%) | 0 (0.0%) |
| $35,000 to $49,999 | 0 (0.0%) | 12 (100.0%) |
| $50,000 to $74,999 | 0 (0.0%) | 0 (0.0%) |
| $75,000 to $99,999 | 0 (0.0%) | 0 (0.0%) |
| $100,000 to $149,999 | 0 (0.0%) | 0 (0.0%) |
| $150,000 or more | 0 (0.0%) | 0 (0.0%) |
| Total | 59 (100.0%) | 12 (100.0%) |
Property Value to Household Income Ratio in Topawa
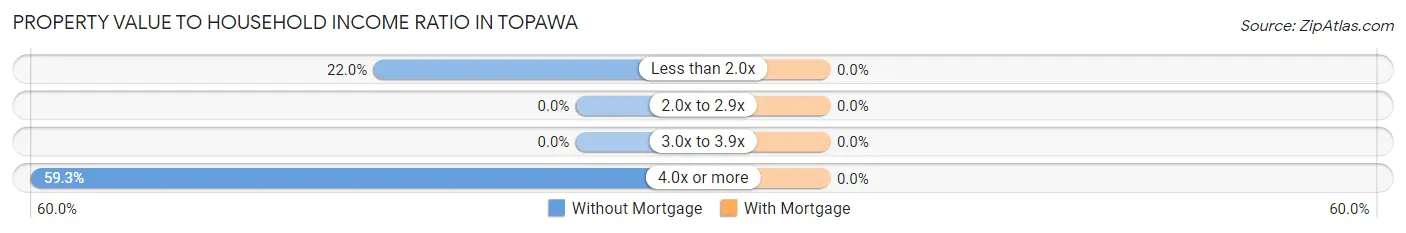
| Value-to-Income Ratio | Without Mortgage | With Mortgage |
| Less than 2.0x | 13 (22.0%) | 0 (0.0%) |
| 2.0x to 2.9x | 0 (0.0%) | 0 (0.0%) |
| 3.0x to 3.9x | 0 (0.0%) | 0 (0.0%) |
| 4.0x or more | 35 (59.3%) | 0 (0.0%) |
| Total | 59 (100.0%) | 12 (100.0%) |
Real Estate Taxes by Mortgage Status in Topawa
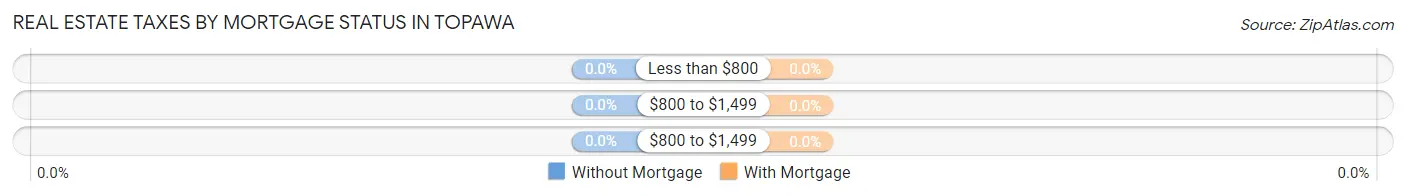
| Property Taxes | Without Mortgage | With Mortgage |
| Less than $800 | 0 (0.0%) | 0 (0.0%) |
| $800 to $1,499 | 0 (0.0%) | 0 (0.0%) |
| $800 to $1,499 | 0 (0.0%) | 0 (0.0%) |
| Total | 59 (100.0%) | 12 (100.0%) |
Health & Disability in Topawa
Health Insurance Coverage by Age in Topawa
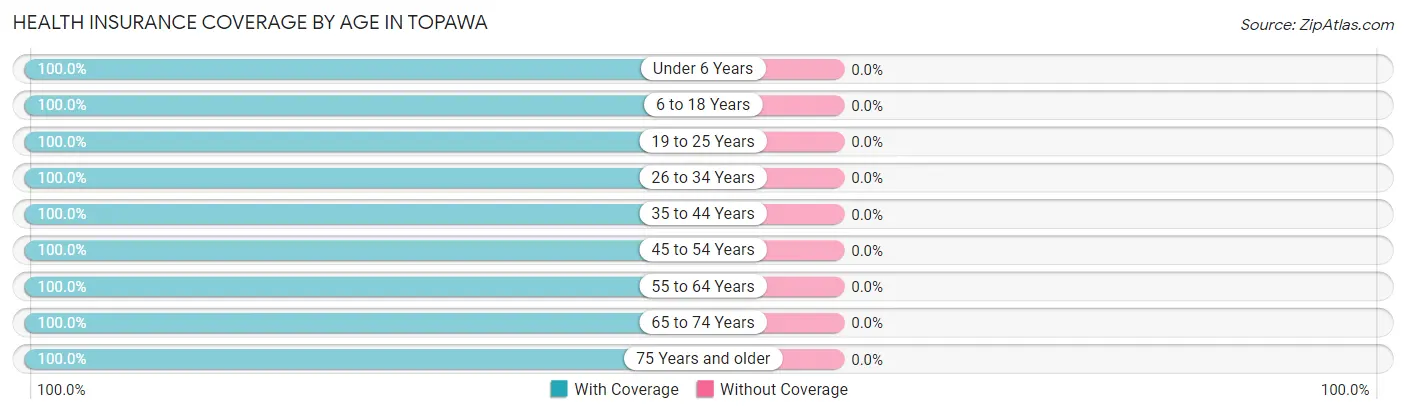
| Age Bracket | With Coverage | Without Coverage |
| Under 6 Years | 13 (100.0%) | 0 (0.0%) |
| 6 to 18 Years | 109 (100.0%) | 0 (0.0%) |
| 19 to 25 Years | 94 (100.0%) | 0 (0.0%) |
| 26 to 34 Years | 31 (100.0%) | 0 (0.0%) |
| 35 to 44 Years | 11 (100.0%) | 0 (0.0%) |
| 45 to 54 Years | 84 (100.0%) | 0 (0.0%) |
| 55 to 64 Years | 30 (100.0%) | 0 (0.0%) |
| 65 to 74 Years | 32 (100.0%) | 0 (0.0%) |
| 75 Years and older | 37 (100.0%) | 0 (0.0%) |
| Total | 441 (100.0%) | 0 (0.0%) |
Health Insurance Coverage by Citizenship Status in Topawa
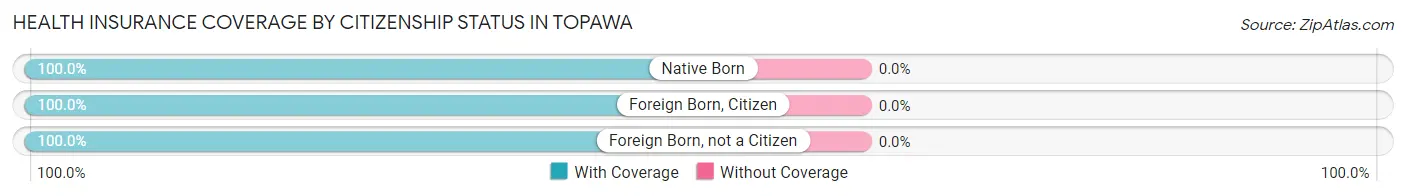
| Citizenship Status | With Coverage | Without Coverage |
| Native Born | 13 (100.0%) | 0 (0.0%) |
| Foreign Born, Citizen | 109 (100.0%) | 0 (0.0%) |
| Foreign Born, not a Citizen | 94 (100.0%) | 0 (0.0%) |
Health Insurance Coverage by Household Income in Topawa
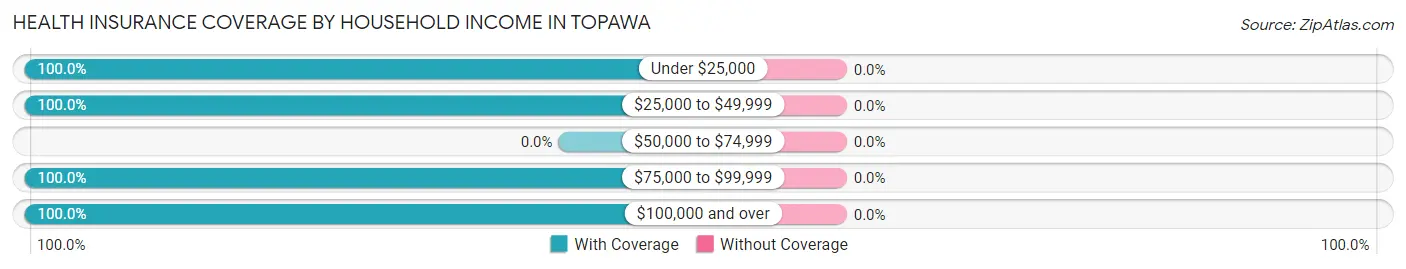
| Household Income | With Coverage | Without Coverage |
| Under $25,000 | 191 (100.0%) | 0 (0.0%) |
| $25,000 to $49,999 | 140 (100.0%) | 0 (0.0%) |
| $50,000 to $74,999 | 0 (0.0%) | 0 (0.0%) |
| $75,000 to $99,999 | 48 (100.0%) | 0 (0.0%) |
| $100,000 and over | 62 (100.0%) | 0 (0.0%) |
Public vs Private Health Insurance Coverage by Age in Topawa
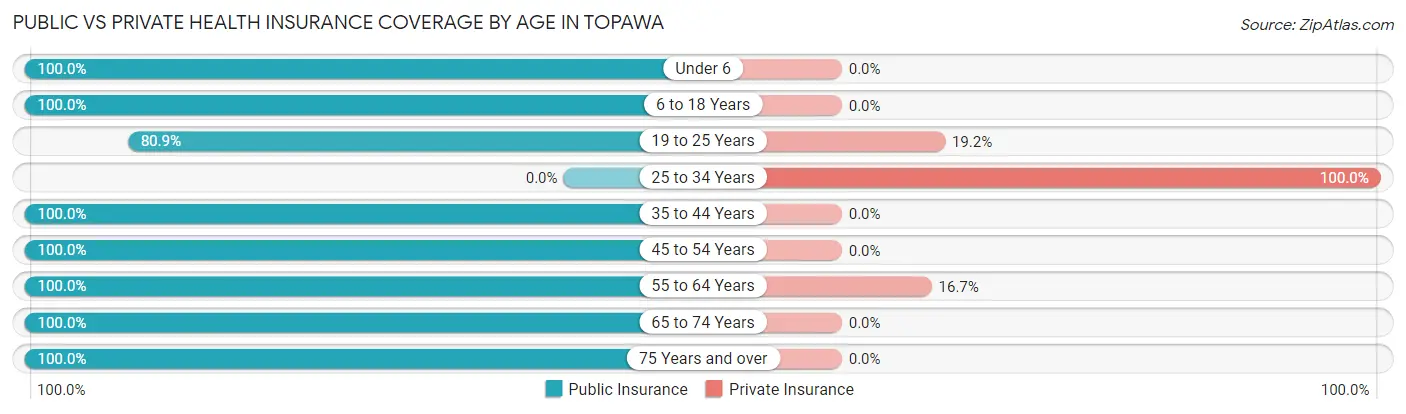
| Age Bracket | Public Insurance | Private Insurance |
| Under 6 | 13 (100.0%) | 0 (0.0%) |
| 6 to 18 Years | 109 (100.0%) | 0 (0.0%) |
| 19 to 25 Years | 76 (80.8%) | 18 (19.2%) |
| 25 to 34 Years | 0 (0.0%) | 31 (100.0%) |
| 35 to 44 Years | 11 (100.0%) | 0 (0.0%) |
| 45 to 54 Years | 84 (100.0%) | 0 (0.0%) |
| 55 to 64 Years | 30 (100.0%) | 5 (16.7%) |
| 65 to 74 Years | 32 (100.0%) | 0 (0.0%) |
| 75 Years and over | 37 (100.0%) | 0 (0.0%) |
| Total | 392 (88.9%) | 54 (12.2%) |
Disability Status by Sex by Age in Topawa
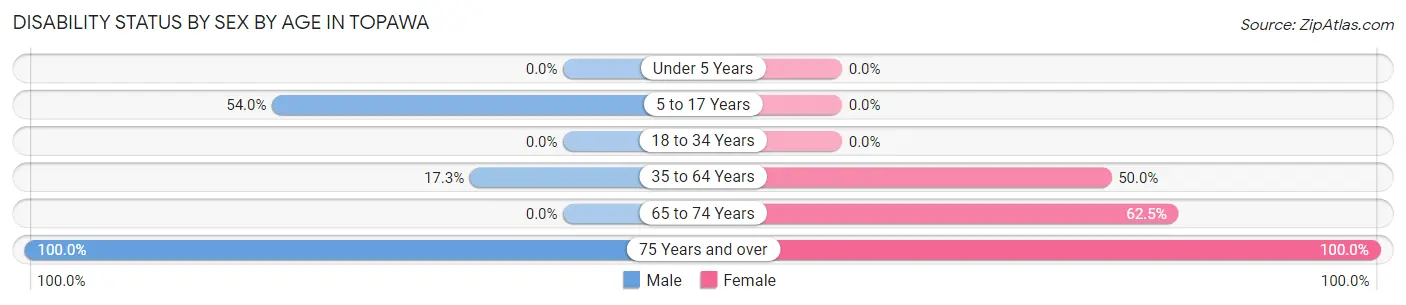
| Age Bracket | Male | Female |
| Under 5 Years | 0 (0.0%) | 0 (0.0%) |
| 5 to 17 Years | 47 (54.0%) | 0 (0.0%) |
| 18 to 34 Years | 0 (0.0%) | 0 (0.0%) |
| 35 to 64 Years | 13 (17.3%) | 25 (50.0%) |
| 65 to 74 Years | 0 (0.0%) | 20 (62.5%) |
| 75 Years and over | 23 (100.0%) | 14 (100.0%) |
Disability Class by Sex by Age in Topawa
Disability Class: Hearing Difficulty
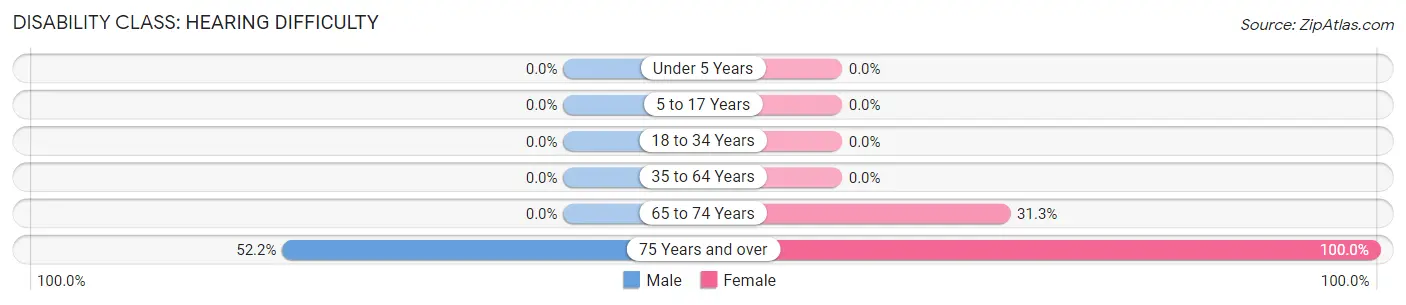
| Age Bracket | Male | Female |
| Under 5 Years | 0 (0.0%) | 0 (0.0%) |
| 5 to 17 Years | 0 (0.0%) | 0 (0.0%) |
| 18 to 34 Years | 0 (0.0%) | 0 (0.0%) |
| 35 to 64 Years | 0 (0.0%) | 0 (0.0%) |
| 65 to 74 Years | 0 (0.0%) | 10 (31.2%) |
| 75 Years and over | 12 (52.2%) | 14 (100.0%) |
Disability Class: Vision Difficulty
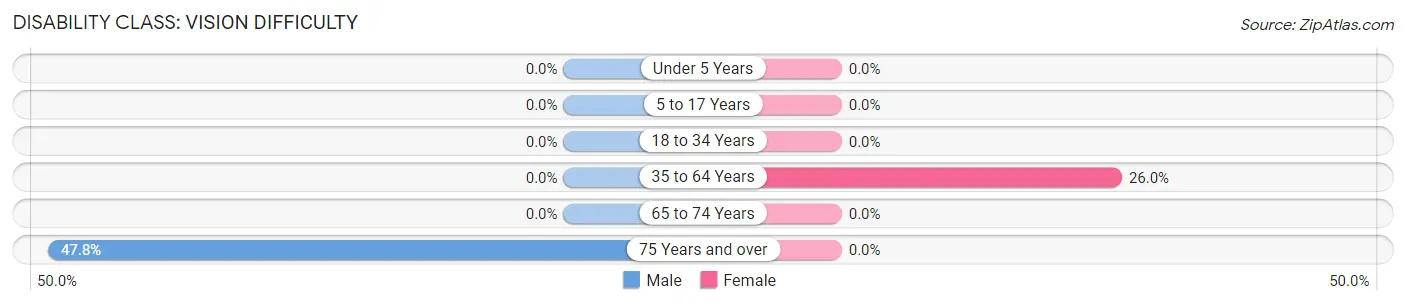
| Age Bracket | Male | Female |
| Under 5 Years | 0 (0.0%) | 0 (0.0%) |
| 5 to 17 Years | 0 (0.0%) | 0 (0.0%) |
| 18 to 34 Years | 0 (0.0%) | 0 (0.0%) |
| 35 to 64 Years | 0 (0.0%) | 13 (26.0%) |
| 65 to 74 Years | 0 (0.0%) | 0 (0.0%) |
| 75 Years and over | 11 (47.8%) | 0 (0.0%) |
Disability Class: Cognitive Difficulty
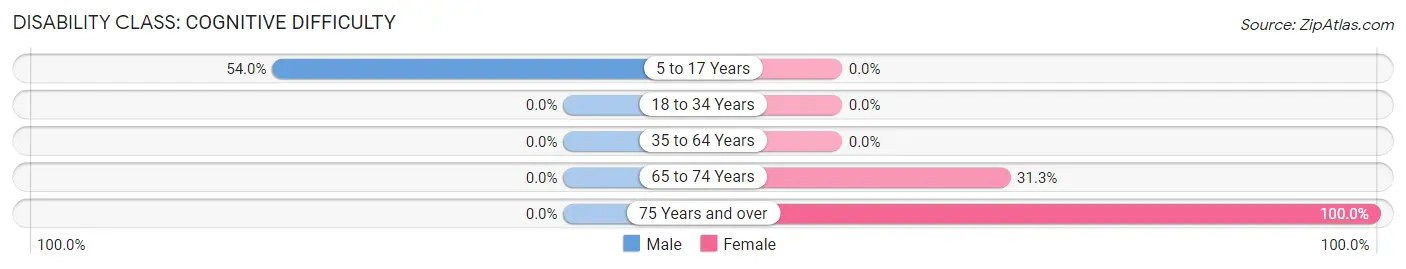
| Age Bracket | Male | Female |
| 5 to 17 Years | 47 (54.0%) | 0 (0.0%) |
| 18 to 34 Years | 0 (0.0%) | 0 (0.0%) |
| 35 to 64 Years | 0 (0.0%) | 0 (0.0%) |
| 65 to 74 Years | 0 (0.0%) | 10 (31.2%) |
| 75 Years and over | 0 (0.0%) | 14 (100.0%) |
Disability Class: Ambulatory Difficulty
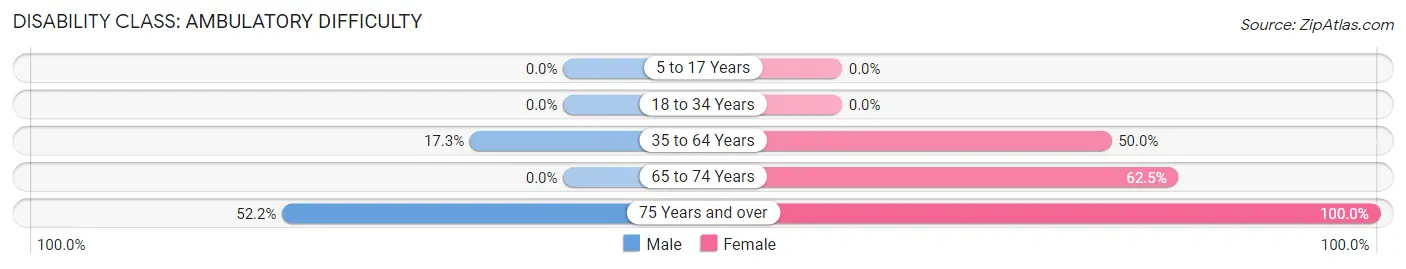
| Age Bracket | Male | Female |
| 5 to 17 Years | 0 (0.0%) | 0 (0.0%) |
| 18 to 34 Years | 0 (0.0%) | 0 (0.0%) |
| 35 to 64 Years | 13 (17.3%) | 25 (50.0%) |
| 65 to 74 Years | 0 (0.0%) | 20 (62.5%) |
| 75 Years and over | 12 (52.2%) | 14 (100.0%) |
Disability Class: Self-Care Difficulty
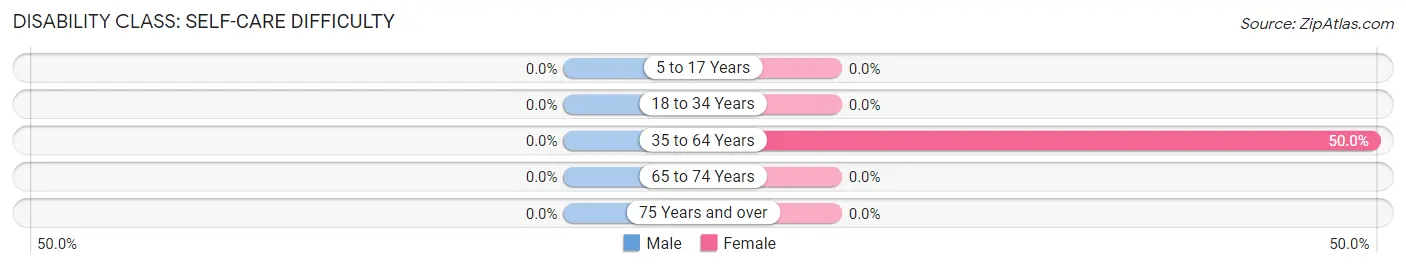
| Age Bracket | Male | Female |
| 5 to 17 Years | 0 (0.0%) | 0 (0.0%) |
| 18 to 34 Years | 0 (0.0%) | 0 (0.0%) |
| 35 to 64 Years | 0 (0.0%) | 25 (50.0%) |
| 65 to 74 Years | 0 (0.0%) | 0 (0.0%) |
| 75 Years and over | 0 (0.0%) | 0 (0.0%) |
Technology Access in Topawa
Computing Device Access in Topawa
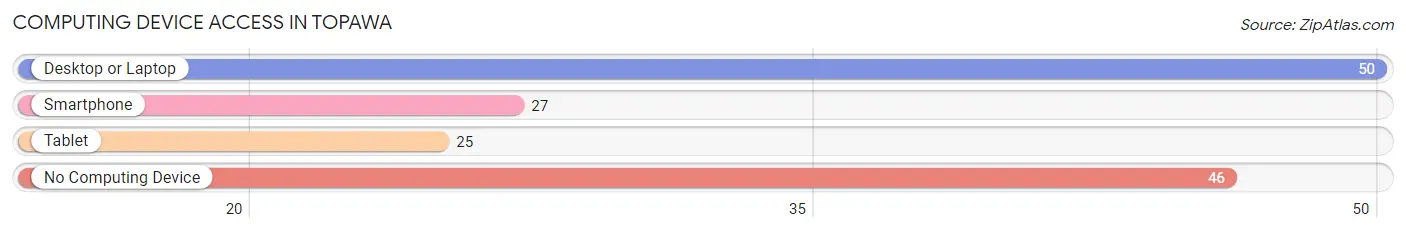
| Device Type | # Households | % Households |
| Desktop or Laptop | 50 | 44.3% |
| Smartphone | 27 | 23.9% |
| Tablet | 25 | 22.1% |
| No Computing Device | 46 | 40.7% |
| Total | 113 | 100.0% |
Internet Access in Topawa
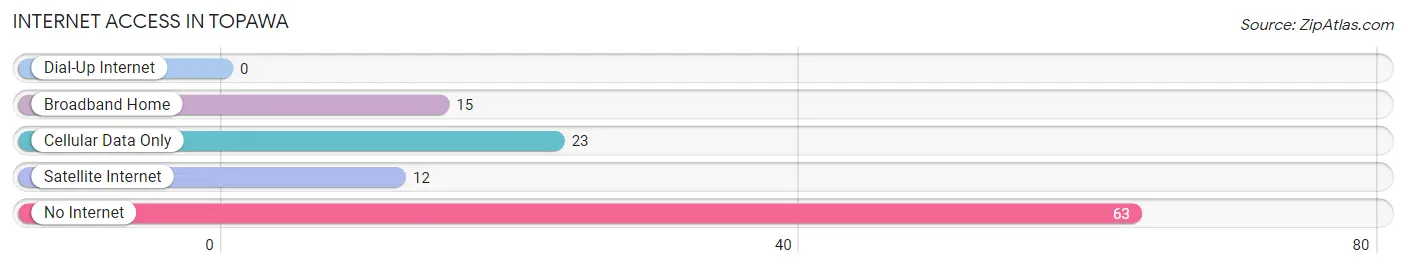
| Internet Type | # Households | % Households |
| Dial-Up Internet | 0 | 0.0% |
| Broadband Home | 15 | 13.3% |
| Cellular Data Only | 23 | 20.3% |
| Satellite Internet | 12 | 10.6% |
| No Internet | 63 | 55.7% |
| Total | 113 | 100.0% |
Topawa Summary
Topawa is a small unincorporated community located in the Tohono O’odham Nation in Pima County, Arizona. It is located about 40 miles southwest of Tucson and is part of the Tucson Metropolitan Statistical Area. The population of Topawa was 1,072 at the 2010 census.
History
The area around Topawa has been inhabited by the Tohono O’odham people for centuries. The name Topawa is derived from the Tohono O’odham phrase “Tohono O’odham Pa Wa” which means “the place of the Tohono O’odham people”. The area was first settled by non-Native Americans in the late 19th century. The first post office was established in Topawa in 1891.
Geography
Topawa is located in the Sonoran Desert at an elevation of 2,717 feet. The area is characterized by rolling hills and flat plains. The climate is hot and dry with temperatures ranging from the mid-90s in the summer to the mid-50s in the winter.
Economy
The economy of Topawa is largely based on agriculture. The area is home to a variety of crops including cotton, alfalfa, wheat, and corn. The area is also home to a number of cattle ranches. The Tohono O’odham Nation operates a casino in Topawa, which provides jobs and economic activity to the area.
Demographics
As of the 2010 census, the population of Topawa was 1,072. The racial makeup of the town was 94.3% Native American, 4.2% White, 0.3% African American, 0.2% Asian, and 0.9% from other races. The median household income was $20,938 and the median family income was $25,000.
Conclusion
Topawa is a small unincorporated community located in the Tohono O’odham Nation in Pima County, Arizona. It has a long history of settlement by the Tohono O’odham people and has been home to non-Native Americans since the late 19th century. The economy of Topawa is largely based on agriculture and the Tohono O’odham Nation operates a casino in the area. The population of Topawa was 1,072 at the 2010 census and the racial makeup of the town was 94.3% Native American, 4.2% White, 0.3% African American, 0.2% Asian, and 0.9% from other races.
Common Questions
What is Per Capita Income in Topawa?
Per Capita income in Topawa is $10,397.
What is the Median Family Income in Topawa?
Median Family Income in Topawa is $26,100.
What is the Median Household income in Topawa?
Median Household Income in Topawa is $25,050.
What is Inequality or Gini Index in Topawa?
Inequality or Gini Index in Topawa is 0.50.
What is the Total Population of Topawa?
Total Population of Topawa is 441.
What is the Total Male Population of Topawa?
Total Male Population of Topawa is 254.
What is the Total Female Population of Topawa?
Total Female Population of Topawa is 187.
What is the Ratio of Males per 100 Females in Topawa?
There are 135.83 Males per 100 Females in Topawa.
What is the Ratio of Females per 100 Males in Topawa?
There are 73.62 Females per 100 Males in Topawa.
What is the Median Population Age in Topawa?
Median Population Age in Topawa is 26.1 Years.
What is the Average Family Size in Topawa
Average Family Size in Topawa is 4.2 People.
What is the Average Household Size in Topawa
Average Household Size in Topawa is 3.9 People.
How Large is the Labor Force in Topawa?
There are 67 People in the Labor Forcein in Topawa.
What is the Percentage of People in the Labor Force in Topawa?
18.9% of People are in the Labor Force in Topawa.