Doney Park, AZ Map & Demographics
Doney Park Map
Doney Park Overview
$43,794
PER CAPITA INCOME
$107,108
AVG FAMILY INCOME
$90,858
AVG HOUSEHOLD INCOME
38.9%
WAGE / INCOME GAP [ % ]
61.1¢/ $1
WAGE / INCOME GAP [ $ ]
0.40
INEQUALITY / GINI INDEX
5,056
TOTAL POPULATION
2,423
MALE POPULATION
2,633
FEMALE POPULATION
92.02
MALES / 100 FEMALES
108.67
FEMALES / 100 MALES
44.1
MEDIAN AGE
3.2
AVG FAMILY SIZE
2.8
AVG HOUSEHOLD SIZE
2,520
LABOR FORCE [ PEOPLE ]
62.3%
PERCENT IN LABOR FORCE
1.7%
UNEMPLOYMENT RATE
Income in Doney Park
Income Overview in Doney Park
Per Capita Income in Doney Park is $43,794, while median incomes of families and households are $107,108 and $90,858 respectively.
| Characteristic | Number | Measure |
| Per Capita Income | 5,056 | $43,794 |
| Median Family Income | 1,413 | $107,108 |
| Mean Family Income | 1,413 | $137,463 |
| Median Household Income | 1,807 | $90,858 |
| Mean Household Income | 1,807 | $121,962 |
| Income Deficit | 1,413 | $0 |
| Wage / Income Gap (%) | 5,056 | 38.90% |
| Wage / Income Gap ($) | 5,056 | 61.10¢ per $1 |
| Gini / Inequality Index | 5,056 | 0.40 |
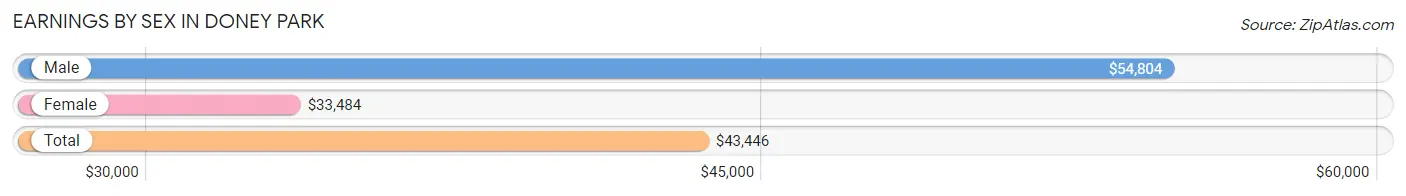
Earnings by Sex in Doney Park
Average Earnings in Doney Park are $43,446, $54,804 for men and $33,484 for women, a difference of 38.9%.
| Sex | Number | Average Earnings |
| Male | 1,394 (52.2%) | $54,804 |
| Female | 1,274 (47.7%) | $33,484 |
| Total | 2,668 (100.0%) | $43,446 |
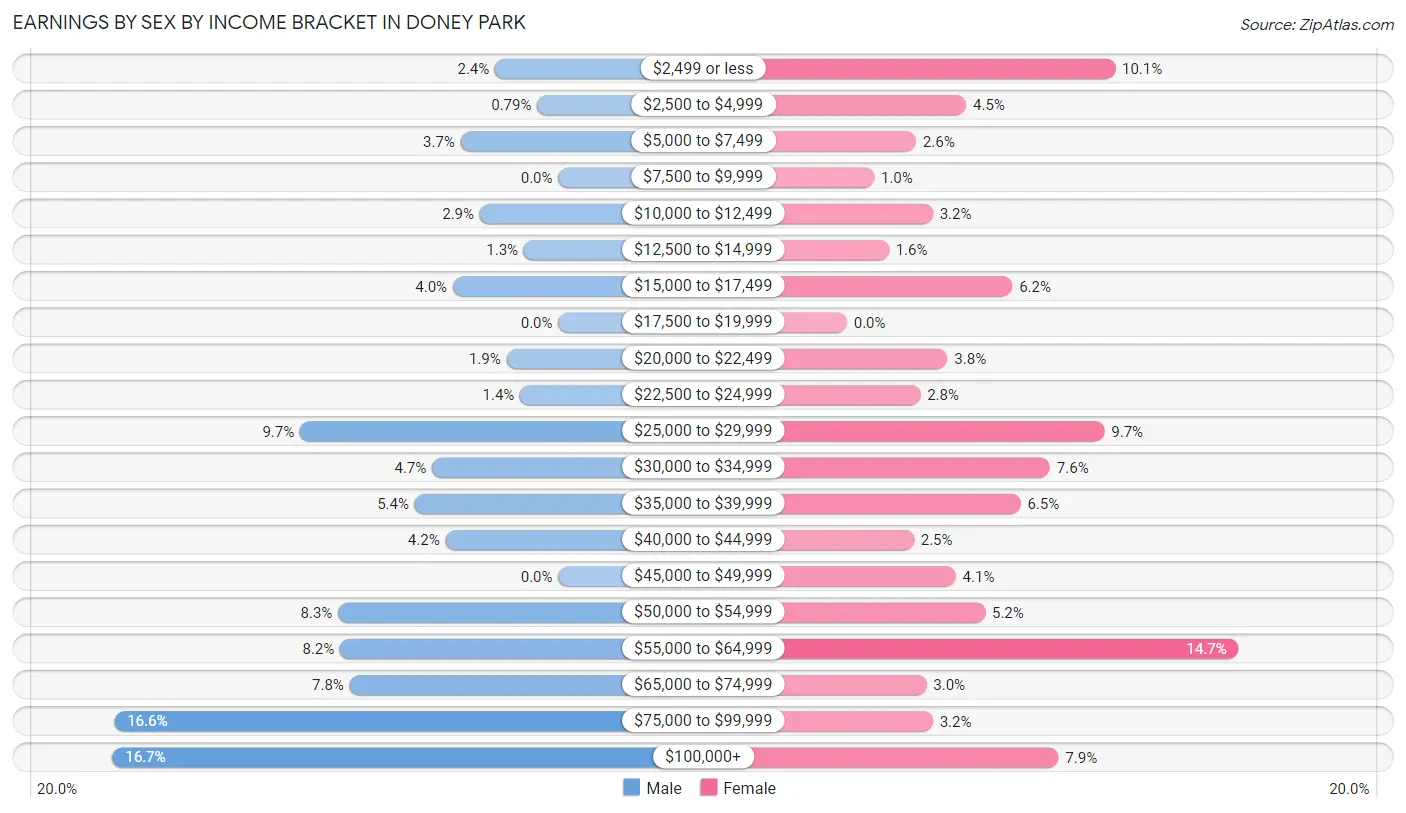
Earnings by Sex by Income Bracket in Doney Park
The most common earnings brackets in Doney Park are $100,000+ for men (233 | 16.7%) and $55,000 to $64,999 for women (187 | 14.7%).
| Income | Male | Female |
| $2,499 or less | 33 (2.4%) | 128 (10.1%) |
| $2,500 to $4,999 | 11 (0.8%) | 57 (4.5%) |
| $5,000 to $7,499 | 51 (3.7%) | 33 (2.6%) |
| $7,500 to $9,999 | 0 (0.0%) | 13 (1.0%) |
| $10,000 to $12,499 | 41 (2.9%) | 41 (3.2%) |
| $12,500 to $14,999 | 18 (1.3%) | 20 (1.6%) |
| $15,000 to $17,499 | 55 (4.0%) | 79 (6.2%) |
| $17,500 to $19,999 | 0 (0.0%) | 0 (0.0%) |
| $20,000 to $22,499 | 27 (1.9%) | 48 (3.8%) |
| $22,500 to $24,999 | 20 (1.4%) | 35 (2.8%) |
| $25,000 to $29,999 | 135 (9.7%) | 123 (9.7%) |
| $30,000 to $34,999 | 66 (4.7%) | 97 (7.6%) |
| $35,000 to $39,999 | 75 (5.4%) | 83 (6.5%) |
| $40,000 to $44,999 | 59 (4.2%) | 32 (2.5%) |
| $45,000 to $49,999 | 0 (0.0%) | 52 (4.1%) |
| $50,000 to $54,999 | 115 (8.3%) | 66 (5.2%) |
| $55,000 to $64,999 | 114 (8.2%) | 187 (14.7%) |
| $65,000 to $74,999 | 109 (7.8%) | 38 (3.0%) |
| $75,000 to $99,999 | 232 (16.6%) | 41 (3.2%) |
| $100,000+ | 233 (16.7%) | 101 (7.9%) |
| Total | 1,394 (100.0%) | 1,274 (100.0%) |
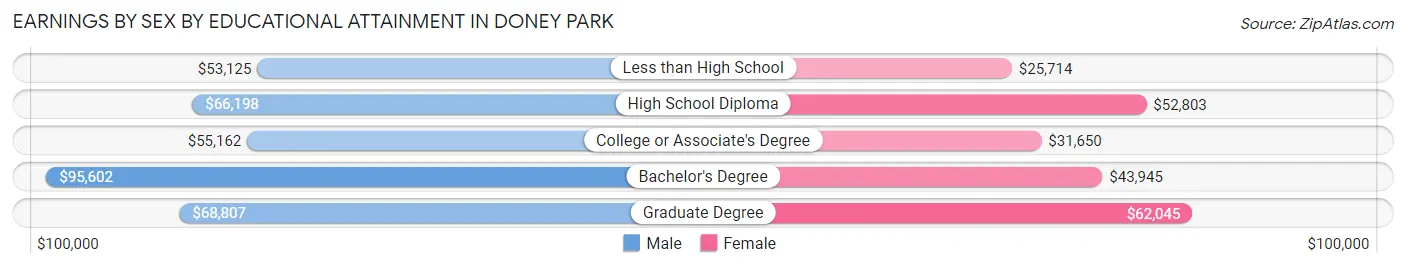
Earnings by Sex by Educational Attainment in Doney Park
Average earnings in Doney Park are $59,375 for men and $38,077 for women, a difference of 35.9%. Men with an educational attainment of bachelor's degree enjoy the highest average annual earnings of $95,602, while those with less than high school education earn the least with $53,125. Women with an educational attainment of graduate degree earn the most with the average annual earnings of $62,045, while those with less than high school education have the smallest earnings of $25,714.
| Educational Attainment | Male Income | Female Income |
| Less than High School | $53,125 | $25,714 |
| High School Diploma | $66,198 | $52,803 |
| College or Associate's Degree | $55,162 | $31,650 |
| Bachelor's Degree | $95,602 | $43,945 |
| Graduate Degree | $68,807 | $62,045 |
| Total | $59,375 | $38,077 |
Family Income in Doney Park
Family Income Brackets in Doney Park
According to the Doney Park family income data, there are 343 families falling into the $100,000 to $149,999 income range, which is the most common income bracket and makes up 24.3% of all families.
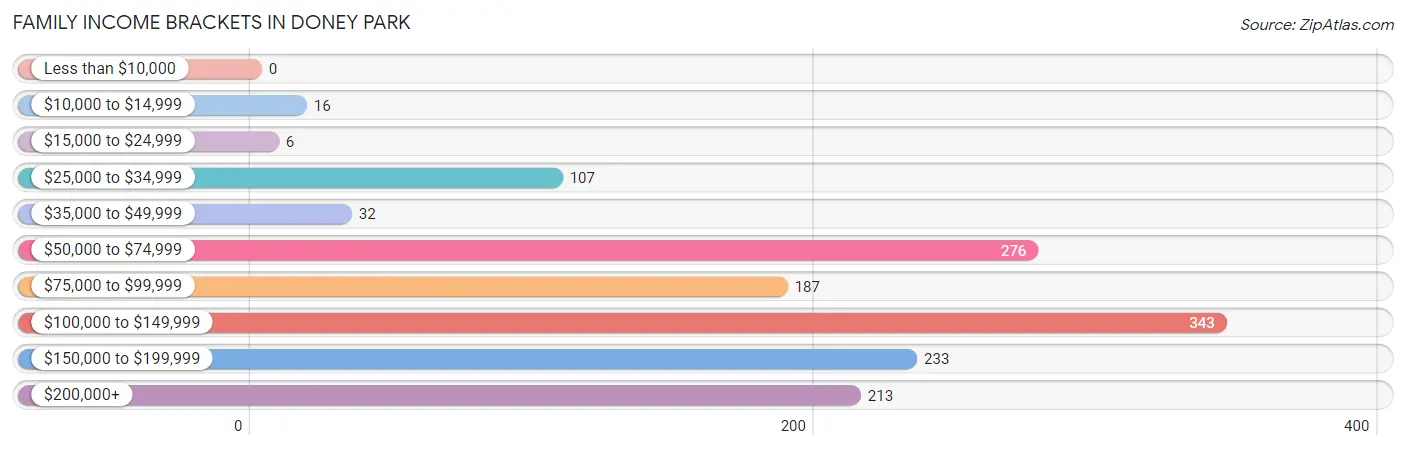
| Income Bracket | # Families | % Families |
| Less than $10,000 | 0 | 0.0% |
| $10,000 to $14,999 | 16 | 1.1% |
| $15,000 to $24,999 | 6 | 0.4% |
| $25,000 to $34,999 | 107 | 7.6% |
| $35,000 to $49,999 | 32 | 2.3% |
| $50,000 to $74,999 | 276 | 19.5% |
| $75,000 to $99,999 | 187 | 13.2% |
| $100,000 to $149,999 | 343 | 24.3% |
| $150,000 to $199,999 | 233 | 16.5% |
| $200,000+ | 213 | 15.1% |
Family Income by Famaliy Size in Doney Park
4-person families (264 | 18.7%) account for the highest median family income in Doney Park with $181,500 per family, while 4-person families (264 | 18.7%) have the highest median income of $45,375 per family member.
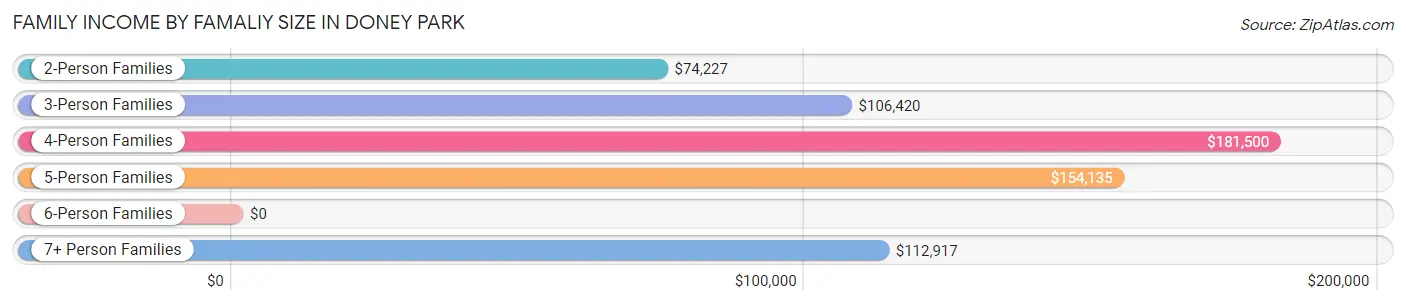
| Income Bracket | # Families | Median Income |
| 2-Person Families | 724 (51.2%) | $74,227 |
| 3-Person Families | 211 (14.9%) | $106,420 |
| 4-Person Families | 264 (18.7%) | $181,500 |
| 5-Person Families | 99 (7.0%) | $154,135 |
| 6-Person Families | 48 (3.4%) | $0 |
| 7+ Person Families | 67 (4.7%) | $112,917 |
| Total | 1,413 (100.0%) | $107,108 |
Family Income by Number of Earners in Doney Park
The median family income in Doney Park is $107,108, with families comprising 3+ earners (248) having the highest median family income of $154,423, while families with 1 earner (248) have the lowest median family income of $56,994, accounting for 17.5% and 17.5% of families, respectively.
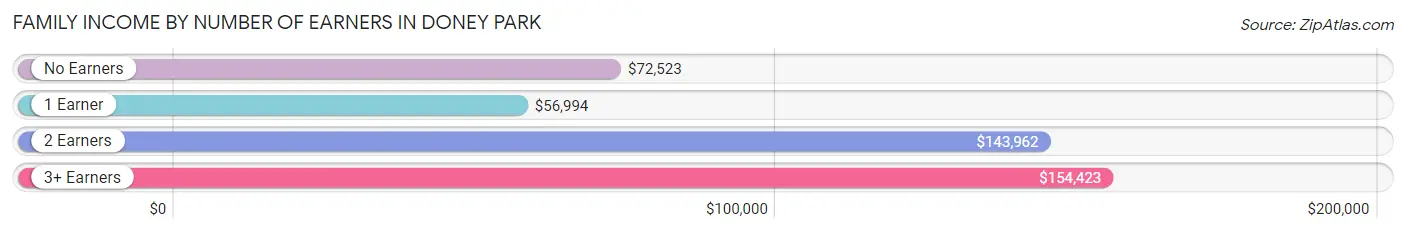
| Number of Earners | # Families | Median Income |
| No Earners | 307 (21.7%) | $72,523 |
| 1 Earner | 248 (17.5%) | $56,994 |
| 2 Earners | 610 (43.2%) | $143,962 |
| 3+ Earners | 248 (17.5%) | $154,423 |
| Total | 1,413 (100.0%) | $107,108 |
Household Income in Doney Park
Household Income Brackets in Doney Park
With 405 households falling in the category, the $100,000 to $149,999 income range is the most frequent in Doney Park, accounting for 22.4% of all households. In contrast, only 14 households (0.8%) fall into the $15,000 to $24,999 income bracket, making it the least populous group.
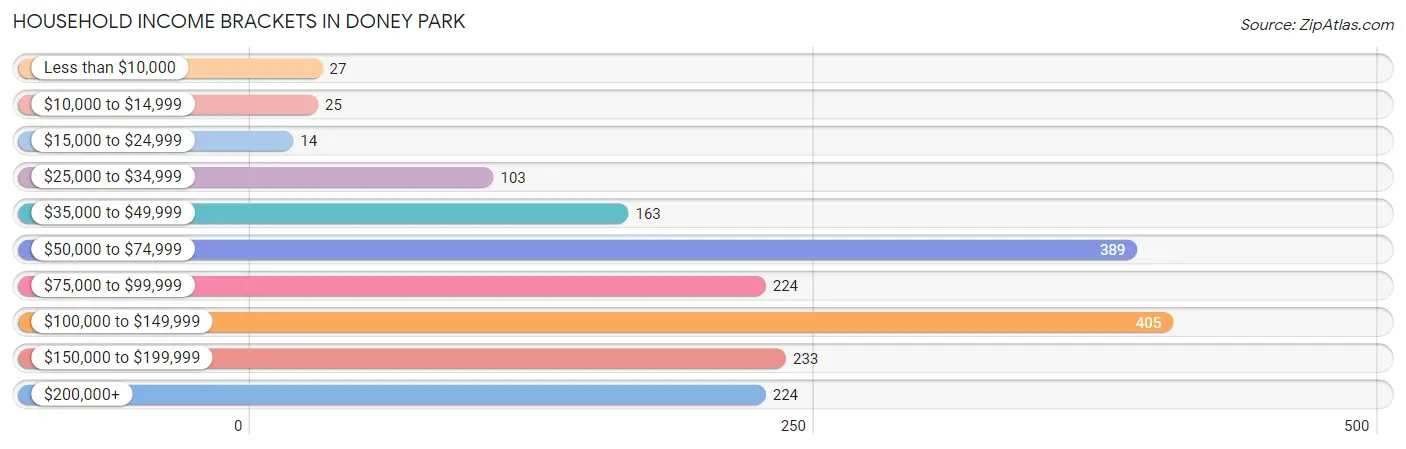
| Income Bracket | # Households | % Households |
| Less than $10,000 | 27 | 1.5% |
| $10,000 to $14,999 | 25 | 1.4% |
| $15,000 to $24,999 | 14 | 0.8% |
| $25,000 to $34,999 | 103 | 5.7% |
| $35,000 to $49,999 | 163 | 9.0% |
| $50,000 to $74,999 | 389 | 21.5% |
| $75,000 to $99,999 | 224 | 12.4% |
| $100,000 to $149,999 | 405 | 22.4% |
| $150,000 to $199,999 | 233 | 12.9% |
| $200,000+ | 224 | 12.4% |
Household Income by Householder Age in Doney Park
The median household income in Doney Park is $90,858, with the highest median household income of $143,596 found in the 45 to 64 years age bracket for the primary householder. A total of 675 households (37.3%) fall into this category. Meanwhile, the 15 to 24 years age bracket for the primary householder has the lowest median household income of $0, with 41 households (2.3%) in this group.
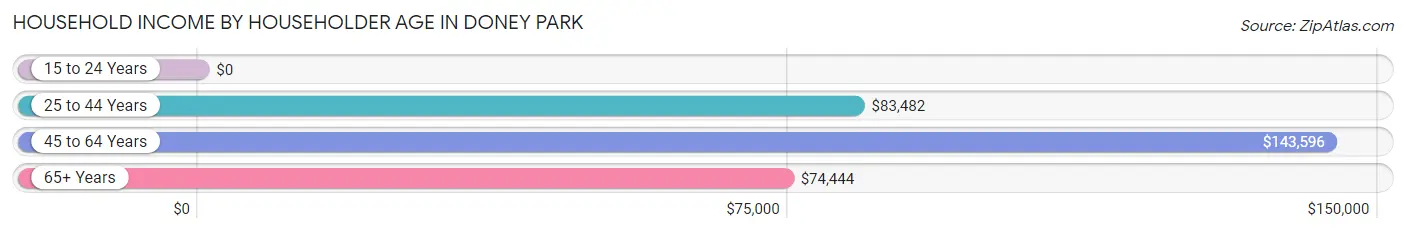
| Income Bracket | # Households | Median Income |
| 15 to 24 Years | 41 (2.3%) | $0 |
| 25 to 44 Years | 441 (24.4%) | $83,482 |
| 45 to 64 Years | 675 (37.3%) | $143,596 |
| 65+ Years | 650 (36.0%) | $74,444 |
| Total | 1,807 (100.0%) | $90,858 |
Poverty in Doney Park
Income Below Poverty by Sex and Age in Doney Park
With 4.3% poverty level for males and 2.8% for females among the residents of Doney Park, 25 to 34 year old males and 25 to 34 year old females are the most vulnerable to poverty, with 15 males (11.7%) and 41 females (23.2%) in their respective age groups living below the poverty level.
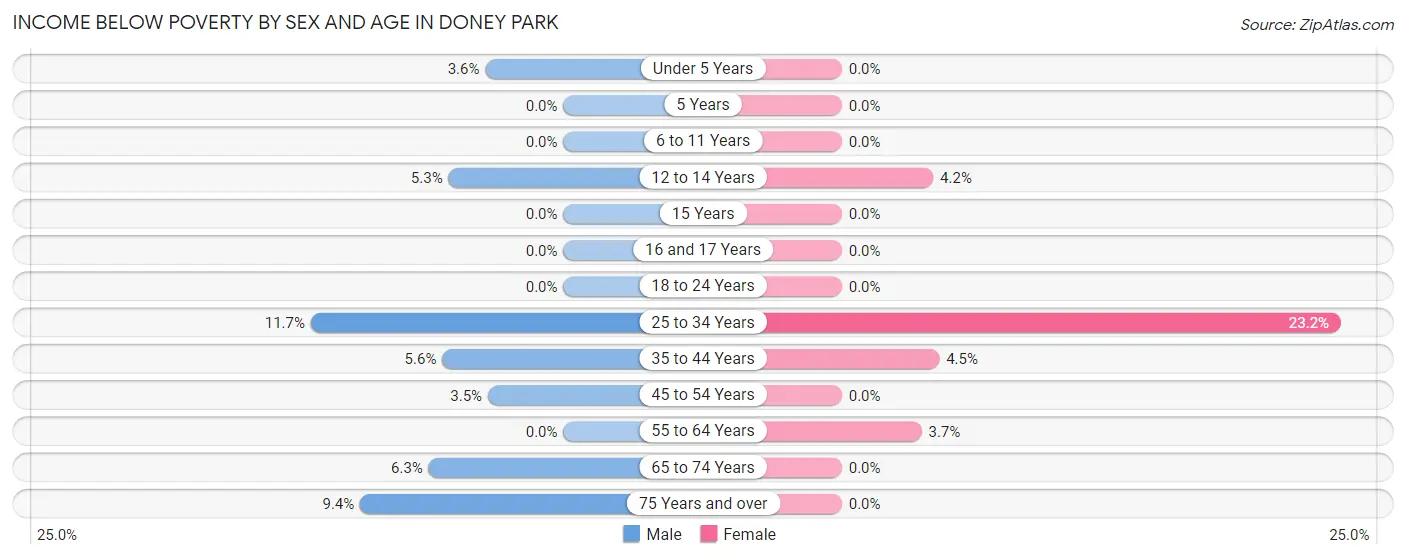
| Age Bracket | Male | Female |
| Under 5 Years | 5 (3.6%) | 0 (0.0%) |
| 5 Years | 0 (0.0%) | 0 (0.0%) |
| 6 to 11 Years | 0 (0.0%) | 0 (0.0%) |
| 12 to 14 Years | 4 (5.3%) | 10 (4.2%) |
| 15 Years | 0 (0.0%) | 0 (0.0%) |
| 16 and 17 Years | 0 (0.0%) | 0 (0.0%) |
| 18 to 24 Years | 0 (0.0%) | 0 (0.0%) |
| 25 to 34 Years | 15 (11.7%) | 41 (23.2%) |
| 35 to 44 Years | 20 (5.6%) | 16 (4.5%) |
| 45 to 54 Years | 17 (3.5%) | 0 (0.0%) |
| 55 to 64 Years | 0 (0.0%) | 7 (3.7%) |
| 65 to 74 Years | 16 (6.2%) | 0 (0.0%) |
| 75 Years and over | 28 (9.4%) | 0 (0.0%) |
| Total | 105 (4.3%) | 74 (2.8%) |
Income Above Poverty by Sex and Age in Doney Park
According to the poverty statistics in Doney Park, males aged 5 years and females aged under 5 years are the age groups that are most secure financially, with 100.0% of males and 100.0% of females in these age groups living above the poverty line.
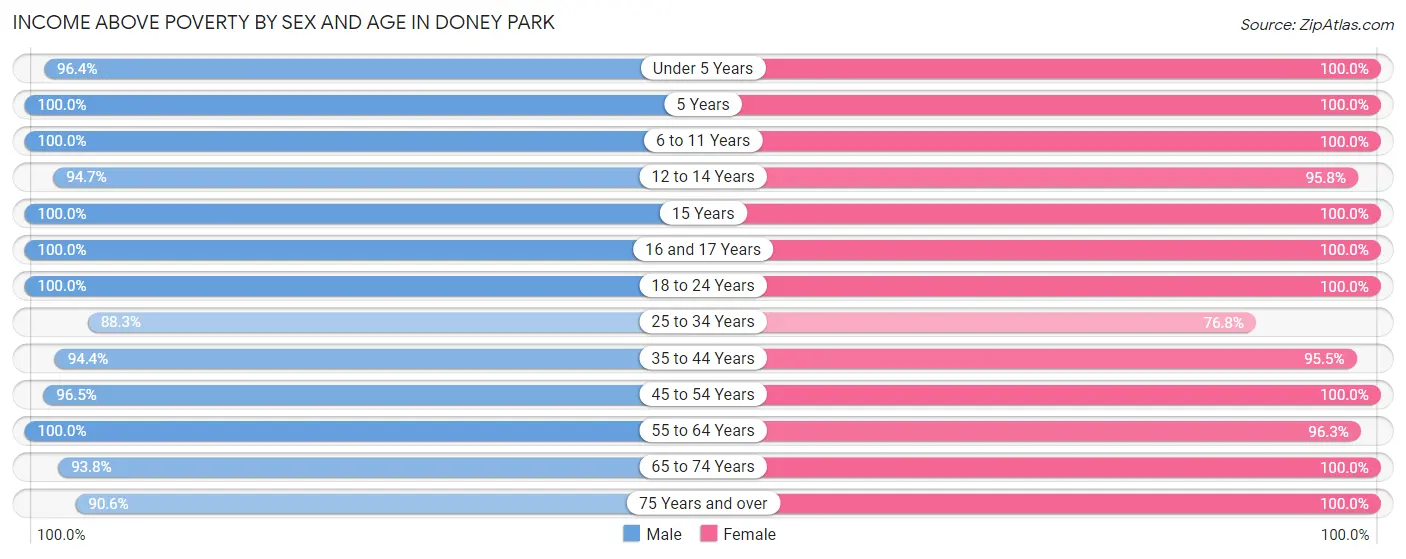
| Age Bracket | Male | Female |
| Under 5 Years | 133 (96.4%) | 59 (100.0%) |
| 5 Years | 62 (100.0%) | 45 (100.0%) |
| 6 to 11 Years | 157 (100.0%) | 212 (100.0%) |
| 12 to 14 Years | 71 (94.7%) | 226 (95.8%) |
| 15 Years | 8 (100.0%) | 9 (100.0%) |
| 16 and 17 Years | 74 (100.0%) | 157 (100.0%) |
| 18 to 24 Years | 174 (100.0%) | 187 (100.0%) |
| 25 to 34 Years | 113 (88.3%) | 136 (76.8%) |
| 35 to 44 Years | 336 (94.4%) | 338 (95.5%) |
| 45 to 54 Years | 469 (96.5%) | 457 (100.0%) |
| 55 to 64 Years | 202 (100.0%) | 182 (96.3%) |
| 65 to 74 Years | 240 (93.8%) | 365 (100.0%) |
| 75 Years and over | 269 (90.6%) | 186 (100.0%) |
| Total | 2,308 (95.7%) | 2,559 (97.2%) |
Income Below Poverty Among Married-Couple Families in Doney Park
The poverty statistics for married-couple families in Doney Park show that 0.4% or 5 of the total 1,280 families live below the poverty line. Families with 3 or 4 children have the highest poverty rate of 5.4%, comprising of 5 families. On the other hand, families with no children have the lowest poverty rate of 0.0%, which includes 0 families.
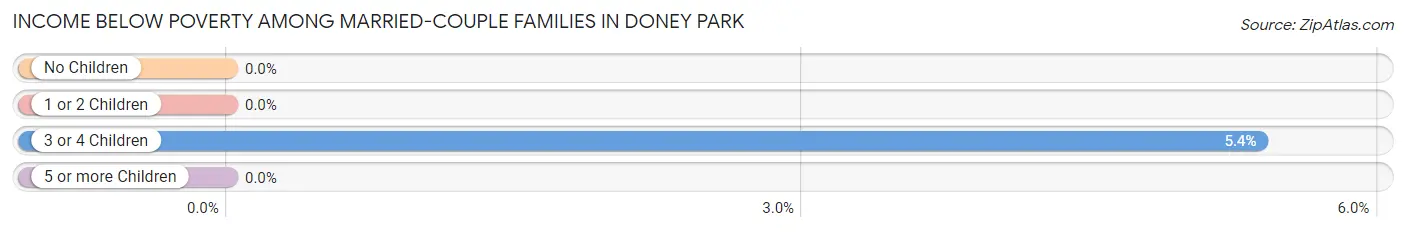
| Children | Above Poverty | Below Poverty |
| No Children | 796 (100.0%) | 0 (0.0%) |
| 1 or 2 Children | 354 (100.0%) | 0 (0.0%) |
| 3 or 4 Children | 88 (94.6%) | 5 (5.4%) |
| 5 or more Children | 37 (100.0%) | 0 (0.0%) |
| Total | 1,275 (99.6%) | 5 (0.4%) |
Income Below Poverty Among Single-Parent Households in Doney Park
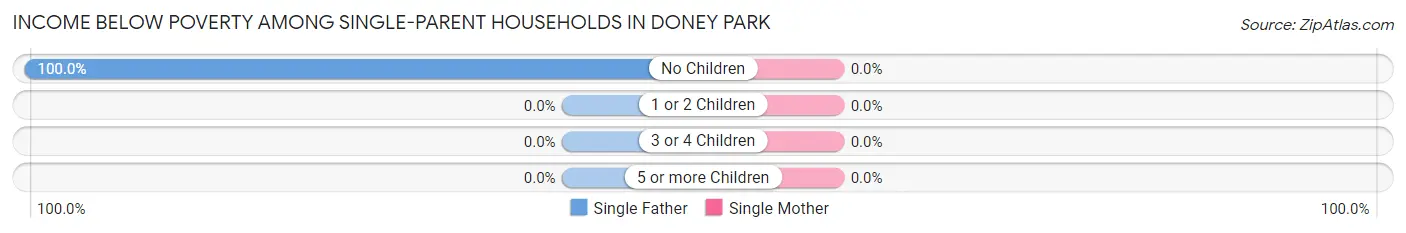
| Children | Single Father | Single Mother |
| No Children | 16 (100.0%) | 0 (0.0%) |
| 1 or 2 Children | 0 (0.0%) | 0 (0.0%) |
| 3 or 4 Children | 0 (0.0%) | 0 (0.0%) |
| 5 or more Children | 0 (0.0%) | 0 (0.0%) |
| Total | 16 (16.5%) | 0 (0.0%) |
Income Below Poverty Among Married-Couple vs Single-Parent Households in Doney Park
The poverty data for Doney Park shows that 5 of the married-couple family households (0.4%) and 16 of the single-parent households (12.0%) are living below the poverty level. Within the married-couple family households, those with 3 or 4 children have the highest poverty rate, with 5 households (5.4%) falling below the poverty line. Among the single-parent households, those with no children have the highest poverty rate, with 16 household (59.3%) living below poverty.
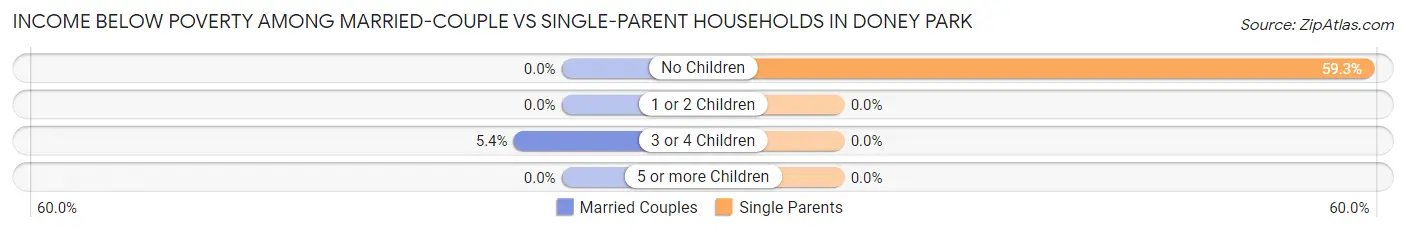
| Children | Married-Couple Families | Single-Parent Households |
| No Children | 0 (0.0%) | 16 (59.3%) |
| 1 or 2 Children | 0 (0.0%) | 0 (0.0%) |
| 3 or 4 Children | 5 (5.4%) | 0 (0.0%) |
| 5 or more Children | 0 (0.0%) | 0 (0.0%) |
| Total | 5 (0.4%) | 16 (12.0%) |
Race in Doney Park
The most populous races in Doney Park are White / Caucasian (4,579 | 90.6%), Hispanic or Latino (868 | 17.2%), and Two or more Races (263 | 5.2%).
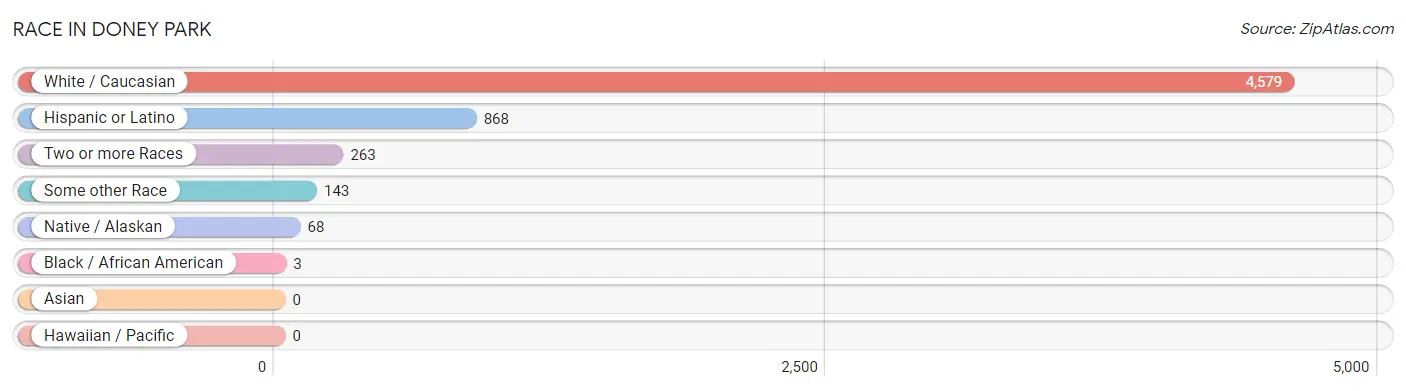
| Race | # Population | % Population |
| Asian | 0 | 0.0% |
| Black / African American | 3 | 0.1% |
| Hawaiian / Pacific | 0 | 0.0% |
| Hispanic or Latino | 868 | 17.2% |
| Native / Alaskan | 68 | 1.3% |
| White / Caucasian | 4,579 | 90.6% |
| Two or more Races | 263 | 5.2% |
| Some other Race | 143 | 2.8% |
| Total | 5,056 | 100.0% |
Ancestry in Doney Park
The most populous ancestries reported in Doney Park are German (963 | 19.1%), Irish (881 | 17.4%), Mexican (644 | 12.7%), English (579 | 11.5%), and Scottish (266 | 5.3%), together accounting for 65.9% of all Doney Park residents.
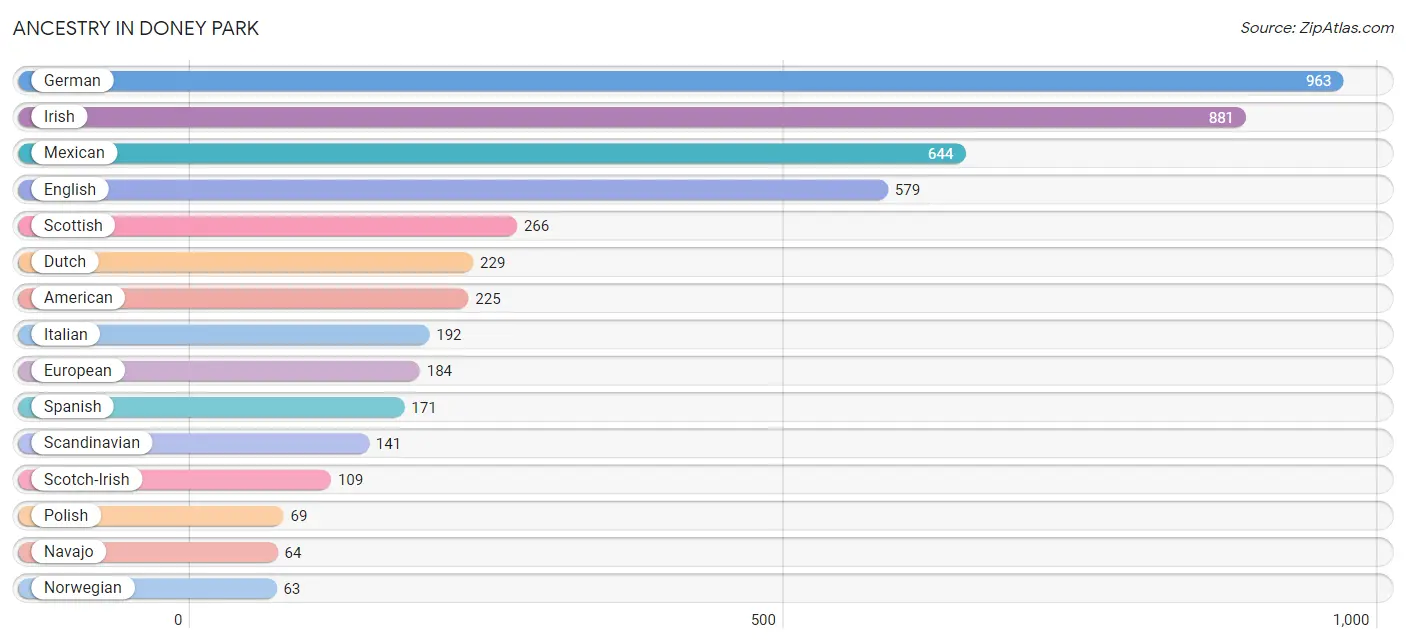
| Ancestry | # Population | % Population |
| American | 225 | 4.4% |
| Armenian | 19 | 0.4% |
| Blackfeet | 1 | 0.0% |
| British | 53 | 1.1% |
| Canadian | 32 | 0.6% |
| Central American | 24 | 0.5% |
| Cherokee | 24 | 0.5% |
| Croatian | 10 | 0.2% |
| Czech | 18 | 0.4% |
| Czechoslovakian | 21 | 0.4% |
| Danish | 21 | 0.4% |
| Dutch | 229 | 4.5% |
| English | 579 | 11.5% |
| European | 184 | 3.6% |
| Finnish | 45 | 0.9% |
| French | 43 | 0.9% |
| French Canadian | 25 | 0.5% |
| German | 963 | 19.1% |
| Greek | 21 | 0.4% |
| Guatemalan | 24 | 0.5% |
| Hungarian | 30 | 0.6% |
| Irish | 881 | 17.4% |
| Italian | 192 | 3.8% |
| Mexican | 644 | 12.7% |
| Navajo | 64 | 1.3% |
| Northern European | 8 | 0.2% |
| Norwegian | 63 | 1.3% |
| Polish | 69 | 1.4% |
| Puerto Rican | 13 | 0.3% |
| Russian | 28 | 0.5% |
| Scandinavian | 141 | 2.8% |
| Scotch-Irish | 109 | 2.2% |
| Scottish | 266 | 5.3% |
| Sioux | 30 | 0.6% |
| Slovak | 7 | 0.1% |
| Spaniard | 13 | 0.3% |
| Spanish | 171 | 3.4% |
| Subsaharan African | 11 | 0.2% |
| Swedish | 40 | 0.8% |
| Swiss | 13 | 0.3% |
| Welsh | 41 | 0.8% |
| Yaqui | 9 | 0.2% | View All 42 Rows |
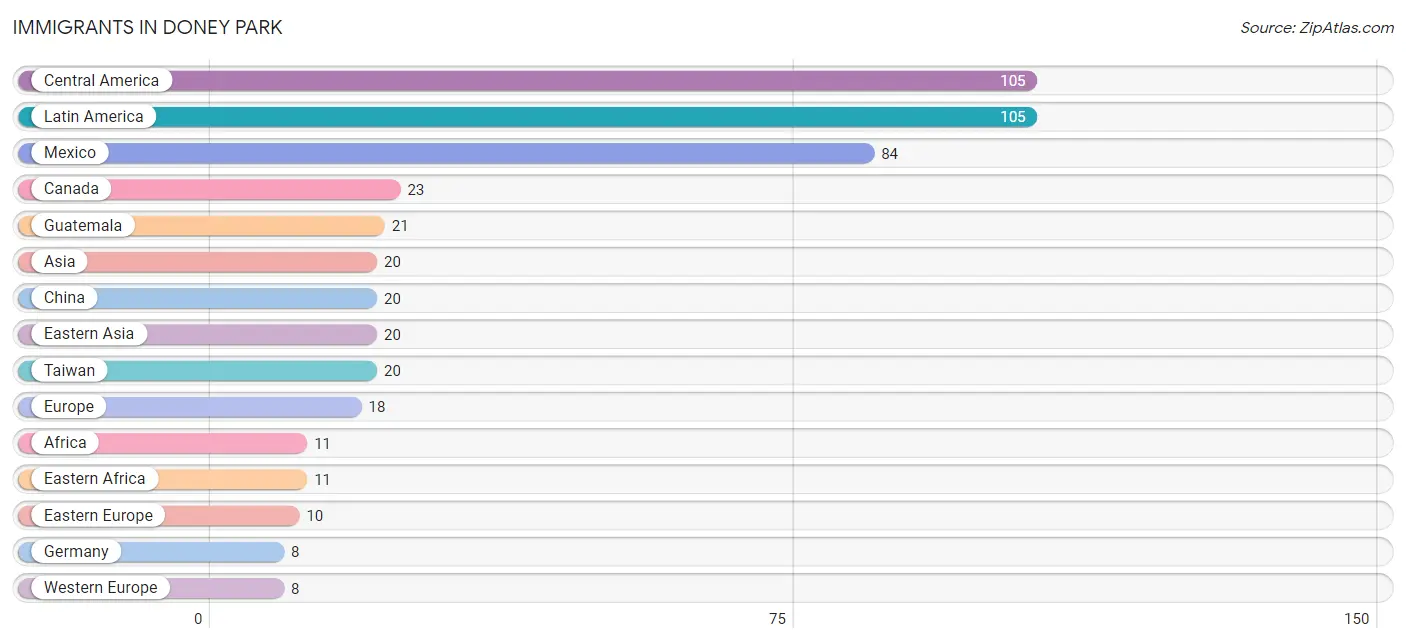
Immigrants in Doney Park
The most numerous immigrant groups reported in Doney Park came from Central America (105 | 2.1%), Latin America (105 | 2.1%), Mexico (84 | 1.7%), Canada (23 | 0.4%), and Guatemala (21 | 0.4%), together accounting for 6.7% of all Doney Park residents.
| Immigration Origin | # Population | % Population |
| Africa | 11 | 0.2% |
| Asia | 20 | 0.4% |
| Canada | 23 | 0.4% |
| Central America | 105 | 2.1% |
| China | 20 | 0.4% |
| Eastern Africa | 11 | 0.2% |
| Eastern Asia | 20 | 0.4% |
| Eastern Europe | 10 | 0.2% |
| Europe | 18 | 0.4% |
| Germany | 8 | 0.2% |
| Guatemala | 21 | 0.4% |
| Latin America | 105 | 2.1% |
| Mexico | 84 | 1.7% |
| Taiwan | 20 | 0.4% |
| Western Europe | 8 | 0.2% | View All 15 Rows |
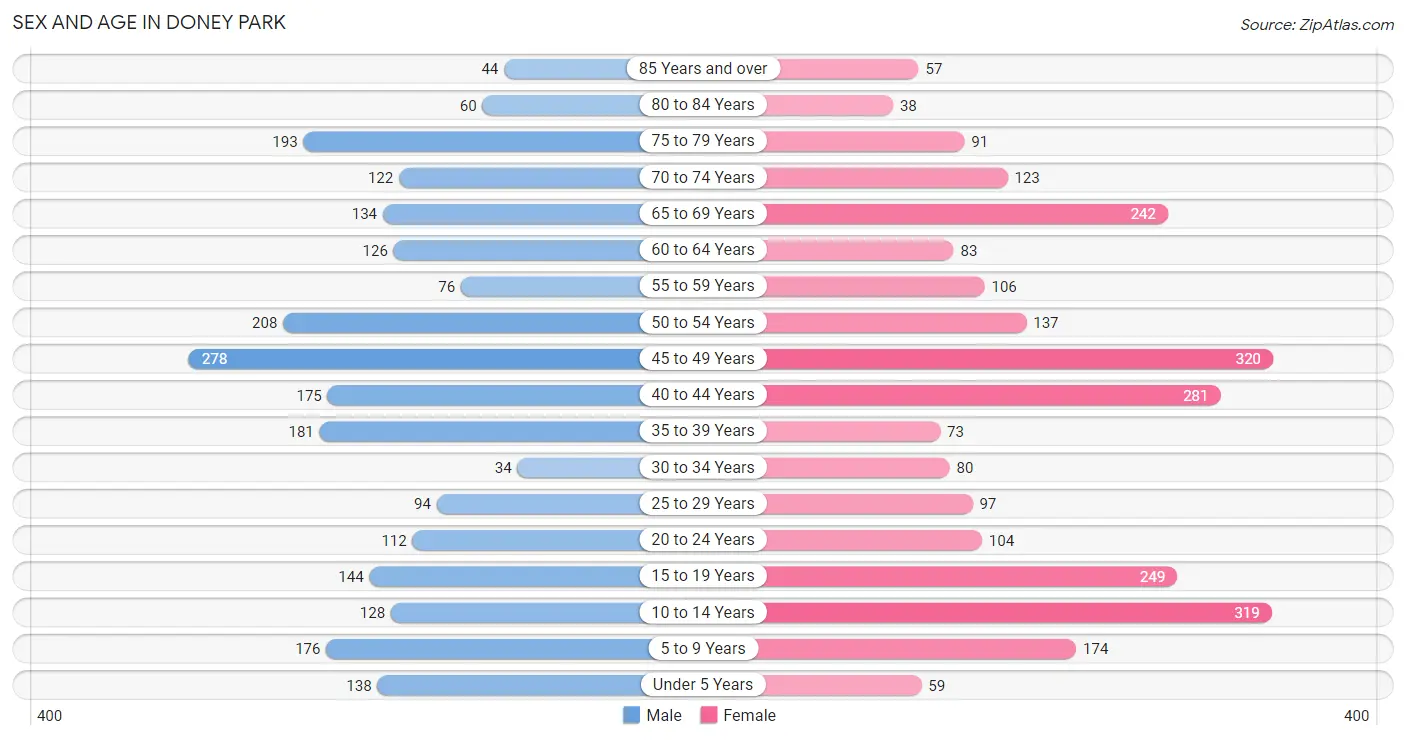
Sex and Age in Doney Park
Sex and Age in Doney Park
The most populous age groups in Doney Park are 45 to 49 Years (278 | 11.5%) for men and 45 to 49 Years (320 | 12.1%) for women.
| Age Bracket | Male | Female |
| Under 5 Years | 138 (5.7%) | 59 (2.2%) |
| 5 to 9 Years | 176 (7.3%) | 174 (6.6%) |
| 10 to 14 Years | 128 (5.3%) | 319 (12.1%) |
| 15 to 19 Years | 144 (5.9%) | 249 (9.5%) |
| 20 to 24 Years | 112 (4.6%) | 104 (4.0%) |
| 25 to 29 Years | 94 (3.9%) | 97 (3.7%) |
| 30 to 34 Years | 34 (1.4%) | 80 (3.0%) |
| 35 to 39 Years | 181 (7.5%) | 73 (2.8%) |
| 40 to 44 Years | 175 (7.2%) | 281 (10.7%) |
| 45 to 49 Years | 278 (11.5%) | 320 (12.1%) |
| 50 to 54 Years | 208 (8.6%) | 137 (5.2%) |
| 55 to 59 Years | 76 (3.1%) | 106 (4.0%) |
| 60 to 64 Years | 126 (5.2%) | 83 (3.2%) |
| 65 to 69 Years | 134 (5.5%) | 242 (9.2%) |
| 70 to 74 Years | 122 (5.0%) | 123 (4.7%) |
| 75 to 79 Years | 193 (8.0%) | 91 (3.5%) |
| 80 to 84 Years | 60 (2.5%) | 38 (1.4%) |
| 85 Years and over | 44 (1.8%) | 57 (2.2%) |
| Total | 2,423 (100.0%) | 2,633 (100.0%) |
Families and Households in Doney Park
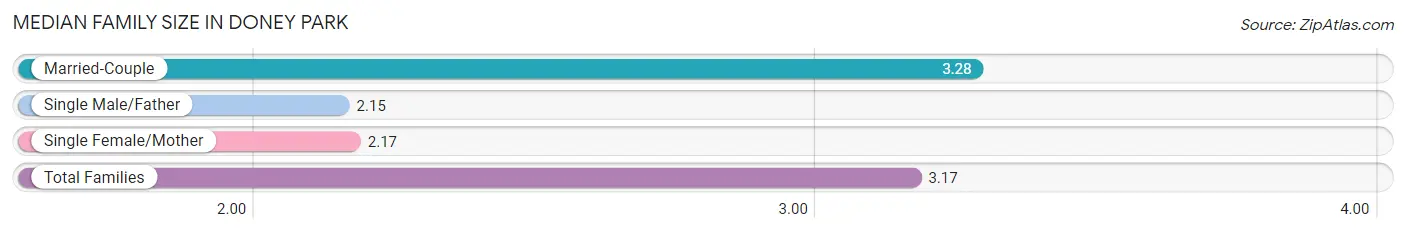
Median Family Size in Doney Park
The median family size in Doney Park is 3.17 persons per family, with married-couple families (1,280 | 90.6%) accounting for the largest median family size of 3.28 persons per family. On the other hand, single male/father families (97 | 6.9%) represent the smallest median family size with 2.15 persons per family.
| Family Type | # Families | Family Size |
| Married-Couple | 1,280 (90.6%) | 3.28 |
| Single Male/Father | 97 (6.9%) | 2.15 |
| Single Female/Mother | 36 (2.5%) | 2.17 |
| Total Families | 1,413 (100.0%) | 3.17 |
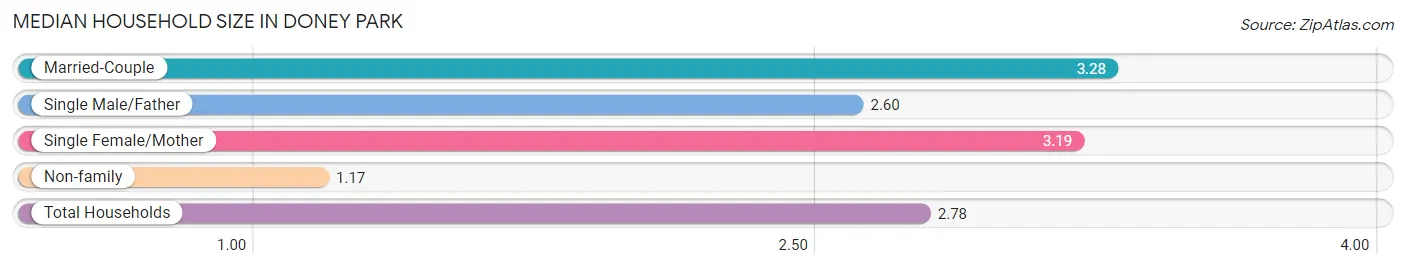
Median Household Size in Doney Park
The median household size in Doney Park is 2.78 persons per household, with married-couple households (1,280 | 70.8%) accounting for the largest median household size of 3.28 persons per household. non-family households (394 | 21.8%) represent the smallest median household size with 1.17 persons per household.
| Household Type | # Households | Household Size |
| Married-Couple | 1,280 (70.8%) | 3.28 |
| Single Male/Father | 97 (5.4%) | 2.60 |
| Single Female/Mother | 36 (2.0%) | 3.19 |
| Non-family | 394 (21.8%) | 1.17 |
| Total Households | 1,807 (100.0%) | 2.78 |
Household Size by Marriage Status in Doney Park
Out of a total of 1,807 households in Doney Park, 1,413 (78.2%) are family households, while 394 (21.8%) are nonfamily households. The most numerous type of family households are 2-person households, comprising 600, and the most common type of nonfamily households are 1-person households, comprising 365.
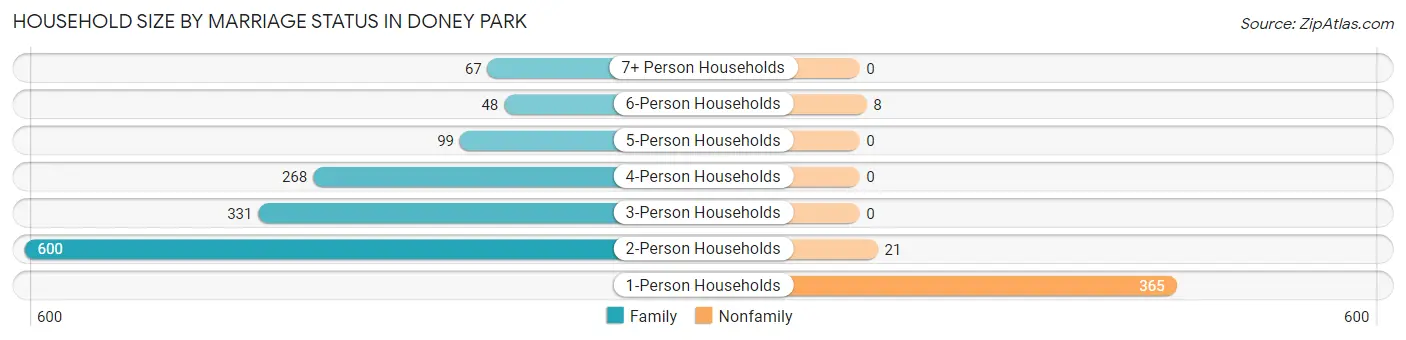
| Household Size | Family Households | Nonfamily Households |
| 1-Person Households | - | 365 (20.2%) |
| 2-Person Households | 600 (33.2%) | 21 (1.2%) |
| 3-Person Households | 331 (18.3%) | 0 (0.0%) |
| 4-Person Households | 268 (14.8%) | 0 (0.0%) |
| 5-Person Households | 99 (5.5%) | 0 (0.0%) |
| 6-Person Households | 48 (2.7%) | 8 (0.4%) |
| 7+ Person Households | 67 (3.7%) | 0 (0.0%) |
| Total | 1,413 (78.2%) | 394 (21.8%) |
Female Fertility in Doney Park
Fertility by Age in Doney Park
Average fertility rate in Doney Park is 15.0 births per 1,000 women. Women in the age bracket of 20 to 34 years have the highest fertility rate with 28.0 births per 1,000 women. Women in the age bracket of 35 to 50 years acount for 57.9% of all women with births.
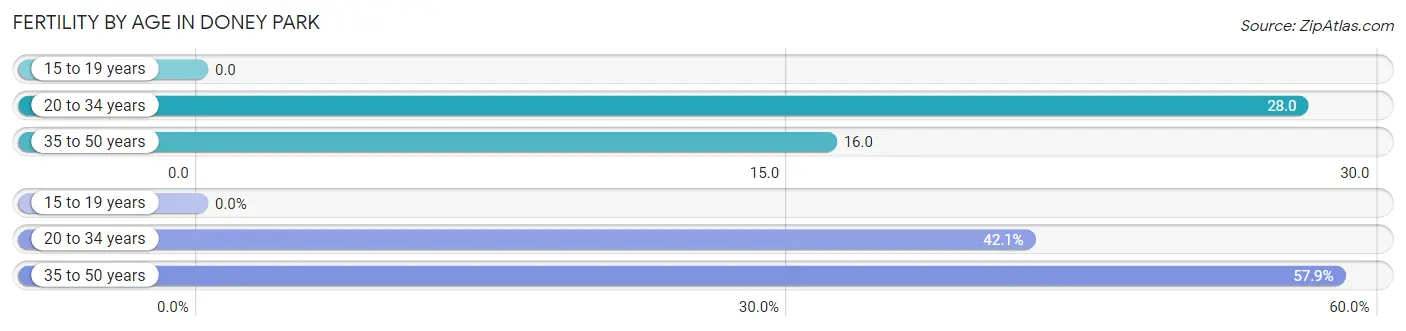
| Age Bracket | Women with Births | Births / 1,000 Women |
| 15 to 19 years | 0 (0.0%) | 0.0 |
| 20 to 34 years | 8 (42.1%) | 28.0 |
| 35 to 50 years | 11 (57.9%) | 16.0 |
| Total | 19 (100.0%) | 15.0 |
Fertility by Age by Marriage Status in Doney Park
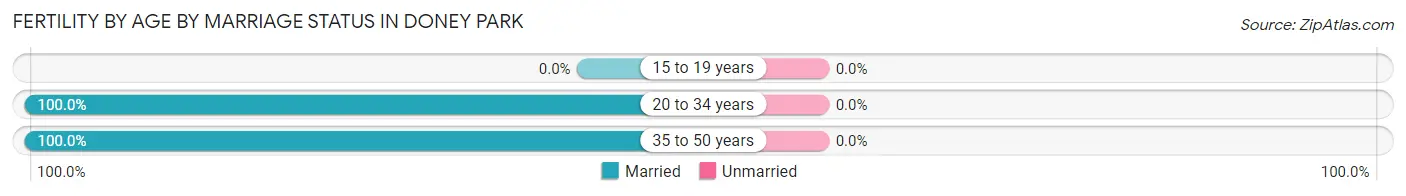
| Age Bracket | Married | Unmarried |
| 15 to 19 years | 0 (0.0%) | 0 (0.0%) |
| 20 to 34 years | 8 (100.0%) | 0 (0.0%) |
| 35 to 50 years | 11 (100.0%) | 0 (0.0%) |
| Total | 19 (100.0%) | 0 (0.0%) |
Fertility by Education in Doney Park
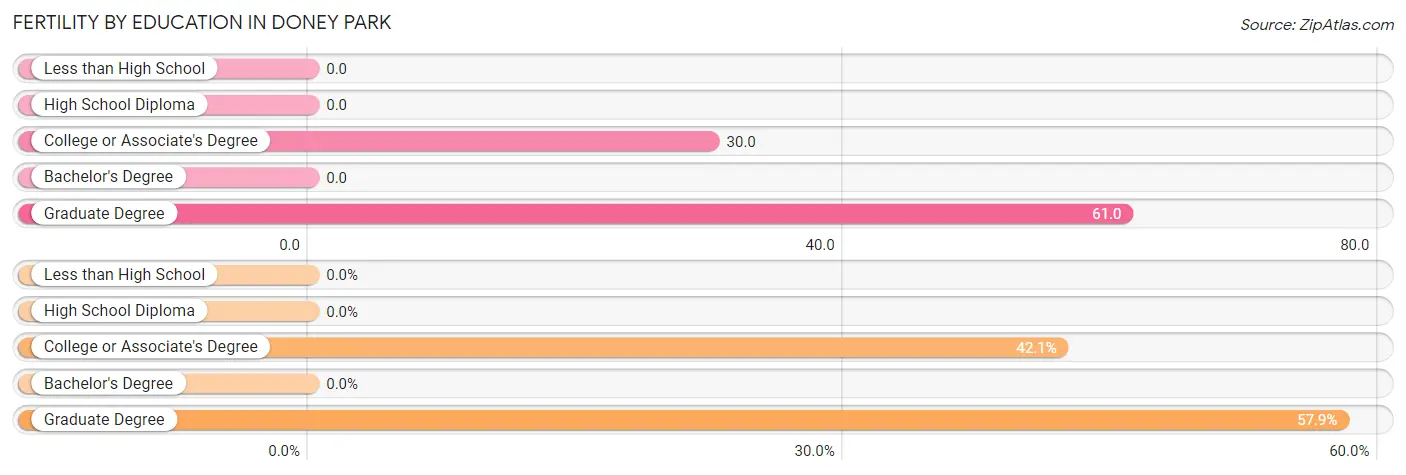
| Educational Attainment | Women with Births | Births / 1,000 Women |
| Less than High School | 0 (0.0%) | 0.0 |
| High School Diploma | 0 (0.0%) | 0.0 |
| College or Associate's Degree | 8 (42.1%) | 30.0 |
| Bachelor's Degree | 0 (0.0%) | 0.0 |
| Graduate Degree | 11 (57.9%) | 61.0 |
| Total | 19 (100.0%) | 15.0 |
Fertility by Education by Marriage Status in Doney Park
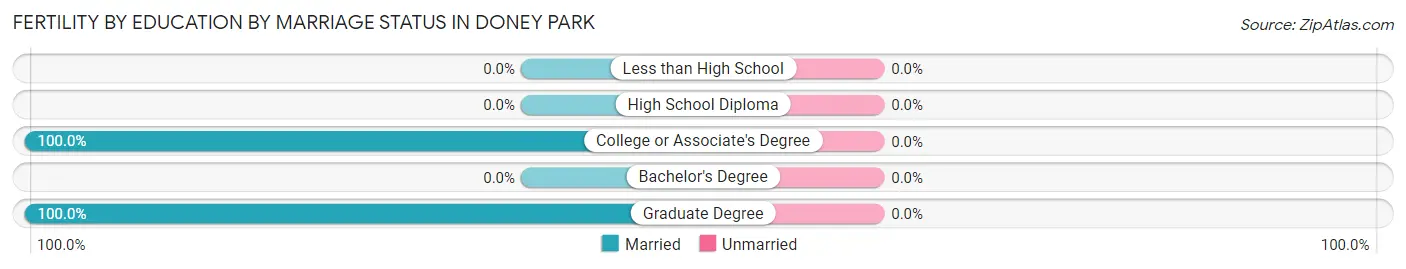
| Educational Attainment | Married | Unmarried |
| Less than High School | 0 (0.0%) | 0 (0.0%) |
| High School Diploma | 0 (0.0%) | 0 (0.0%) |
| College or Associate's Degree | 8 (100.0%) | 0 (0.0%) |
| Bachelor's Degree | 0 (0.0%) | 0 (0.0%) |
| Graduate Degree | 11 (100.0%) | 0 (0.0%) |
| Total | 19 (100.0%) | 0 (0.0%) |
Employment Characteristics in Doney Park
Employment by Class of Employer in Doney Park
Among the 2,424 employed individuals in Doney Park, private company employees (1,508 | 62.2%), state government employees (246 | 10.2%), and self-employed (not incorporated) (225 | 9.3%) make up the most common classes of employment.
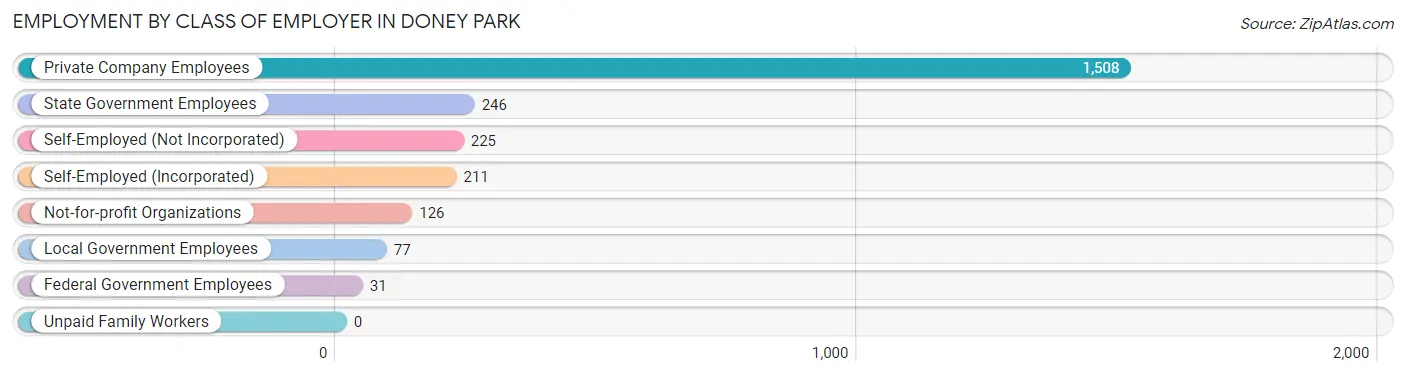
| Employer Class | # Employees | % Employees |
| Private Company Employees | 1,508 | 62.2% |
| Self-Employed (Incorporated) | 211 | 8.7% |
| Self-Employed (Not Incorporated) | 225 | 9.3% |
| Not-for-profit Organizations | 126 | 5.2% |
| Local Government Employees | 77 | 3.2% |
| State Government Employees | 246 | 10.2% |
| Federal Government Employees | 31 | 1.3% |
| Unpaid Family Workers | 0 | 0.0% |
| Total | 2,424 | 100.0% |
Employment Status by Age in Doney Park
According to the labor force statistics for Doney Park, out of the total population over 16 years of age (4,045), 62.3% or 2,520 individuals are in the labor force, with 1.7% or 43 of them unemployed. The age group with the highest labor force participation rate is 35 to 44 years, with 93.1% or 661 individuals in the labor force. Within the labor force, the 16 to 19 years age range has the highest percentage of unemployed individuals, with 15.4% or 31 of them being unemployed.
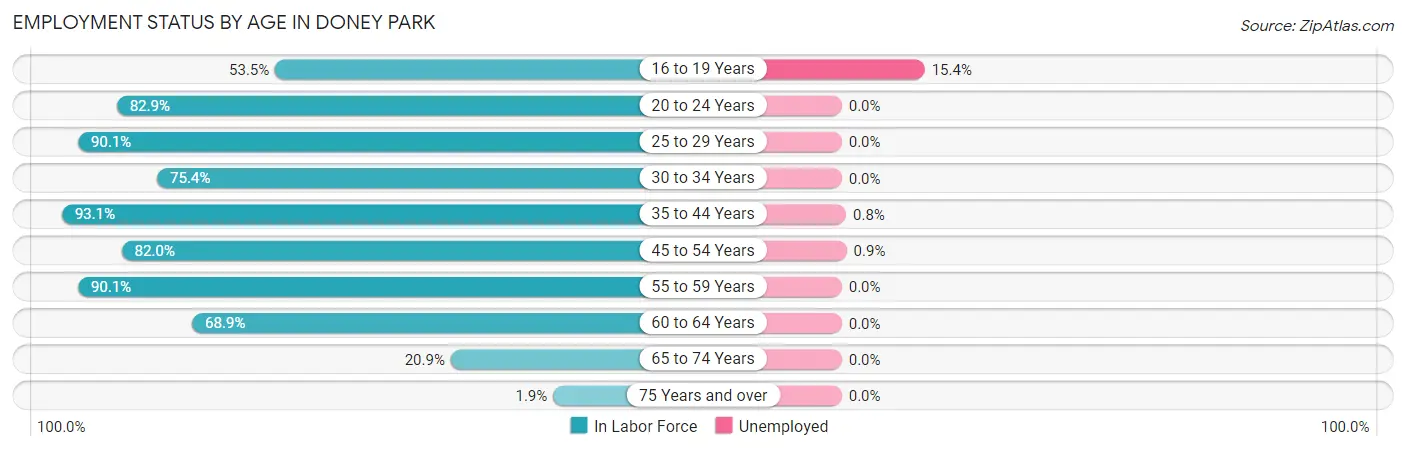
| Age Bracket | In Labor Force | Unemployed |
| 16 to 19 Years | 201 (53.5%) | 31 (15.4%) |
| 20 to 24 Years | 179 (82.9%) | 0 (0.0%) |
| 25 to 29 Years | 172 (90.1%) | 0 (0.0%) |
| 30 to 34 Years | 86 (75.4%) | 0 (0.0%) |
| 35 to 44 Years | 661 (93.1%) | 5 (0.8%) |
| 45 to 54 Years | 773 (82.0%) | 7 (0.9%) |
| 55 to 59 Years | 164 (90.1%) | 0 (0.0%) |
| 60 to 64 Years | 144 (68.9%) | 0 (0.0%) |
| 65 to 74 Years | 130 (20.9%) | 0 (0.0%) |
| 75 Years and over | 9 (1.9%) | 0 (0.0%) |
| Total | 2,520 (62.3%) | 43 (1.7%) |
Employment Status by Educational Attainment in Doney Park
According to labor force statistics for Doney Park, 85.1% of individuals (1,999) out of the total population between 25 and 64 years of age (2,349) are in the labor force, with 0.6% or 12 of them being unemployed. The group with the highest labor force participation rate are those with the educational attainment of bachelor's degree or higher, with 91.2% or 732 individuals in the labor force. Within the labor force, individuals with college / associate degree education have the highest percentage of unemployment, with 2.2% or 12 of them being unemployed.
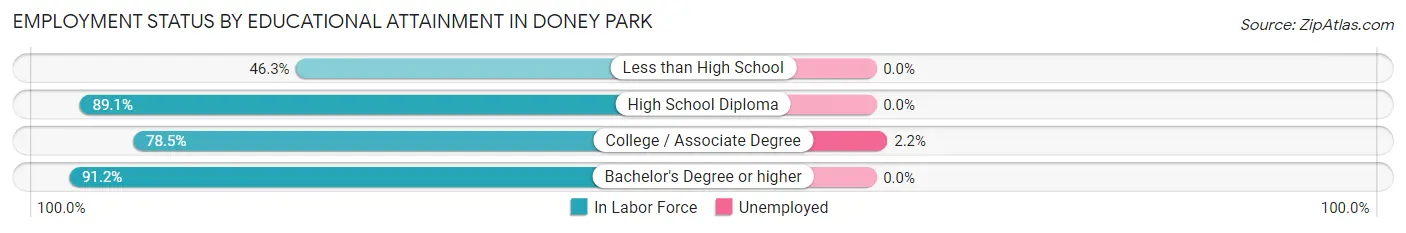
| Educational Attainment | In Labor Force | Unemployed |
| Less than High School | 38 (46.3%) | 0 (0.0%) |
| High School Diploma | 678 (89.1%) | 0 (0.0%) |
| College / Associate Degree | 552 (78.5%) | 15 (2.2%) |
| Bachelor's Degree or higher | 732 (91.2%) | 0 (0.0%) |
| Total | 1,999 (85.1%) | 14 (0.6%) |
Employment Occupations by Sex in Doney Park
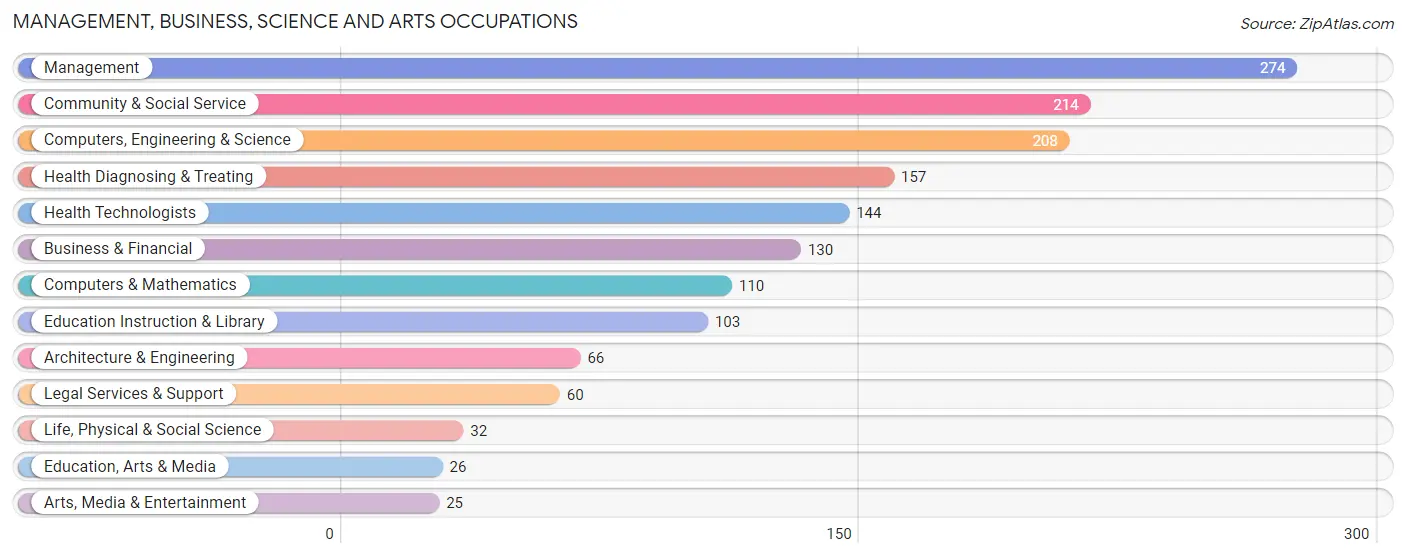
Management, Business, Science and Arts Occupations
The most common Management, Business, Science and Arts occupations in Doney Park are Management (274 | 11.1%), Community & Social Service (214 | 8.6%), Computers, Engineering & Science (208 | 8.4%), Health Diagnosing & Treating (157 | 6.3%), and Health Technologists (144 | 5.8%).
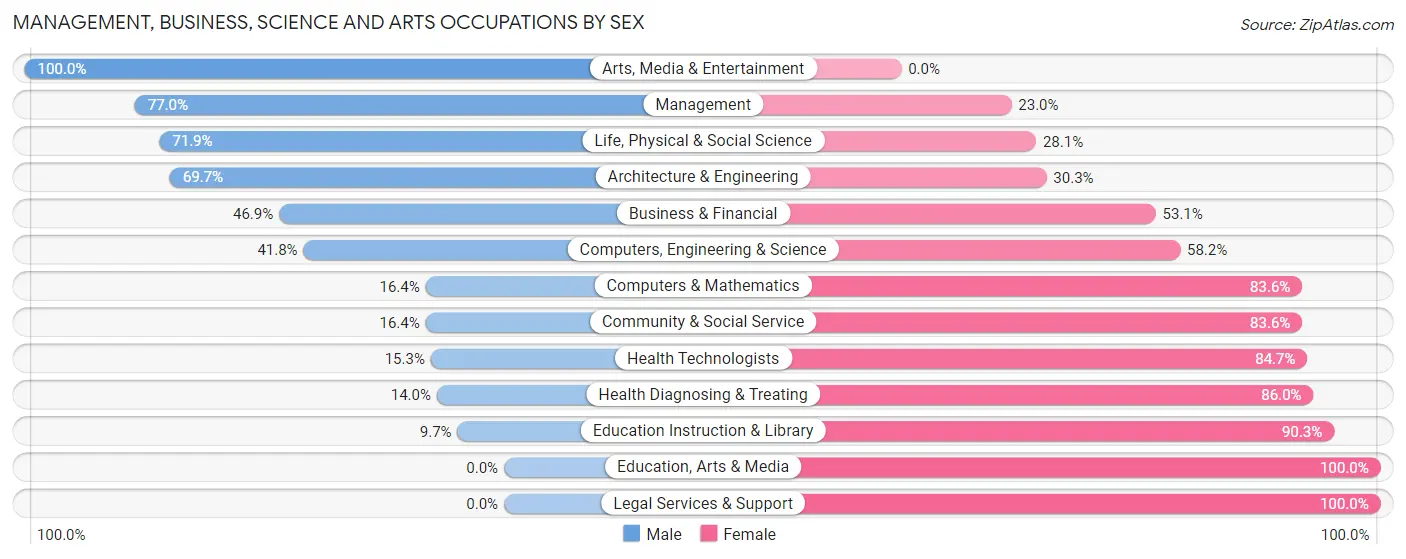
Management, Business, Science and Arts Occupations by Sex
Within the Management, Business, Science and Arts occupations in Doney Park, the most male-oriented occupations are Arts, Media & Entertainment (100.0%), Management (77.0%), and Life, Physical & Social Science (71.9%), while the most female-oriented occupations are Education, Arts & Media (100.0%), Legal Services & Support (100.0%), and Education Instruction & Library (90.3%).
| Occupation | Male | Female |
| Management | 211 (77.0%) | 63 (23.0%) |
| Business & Financial | 61 (46.9%) | 69 (53.1%) |
| Computers, Engineering & Science | 87 (41.8%) | 121 (58.2%) |
| Computers & Mathematics | 18 (16.4%) | 92 (83.6%) |
| Architecture & Engineering | 46 (69.7%) | 20 (30.3%) |
| Life, Physical & Social Science | 23 (71.9%) | 9 (28.1%) |
| Community & Social Service | 35 (16.4%) | 179 (83.6%) |
| Education, Arts & Media | 0 (0.0%) | 26 (100.0%) |
| Legal Services & Support | 0 (0.0%) | 60 (100.0%) |
| Education Instruction & Library | 10 (9.7%) | 93 (90.3%) |
| Arts, Media & Entertainment | 25 (100.0%) | 0 (0.0%) |
| Health Diagnosing & Treating | 22 (14.0%) | 135 (86.0%) |
| Health Technologists | 22 (15.3%) | 122 (84.7%) |
| Total (Category) | 416 (42.3%) | 567 (57.7%) |
| Total (Overall) | 1,345 (54.3%) | 1,131 (45.7%) |
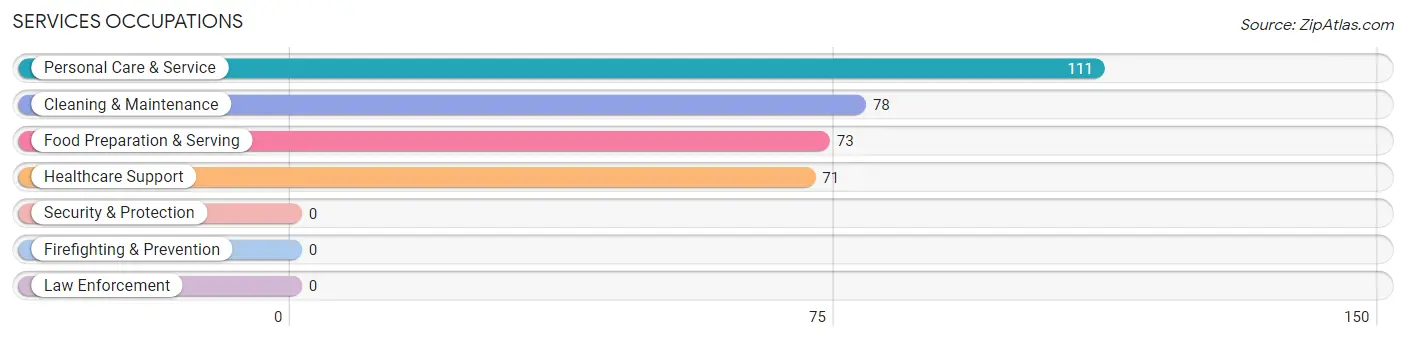
Services Occupations
The most common Services occupations in Doney Park are Personal Care & Service (111 | 4.5%), Cleaning & Maintenance (78 | 3.2%), Food Preparation & Serving (73 | 2.9%), and Healthcare Support (71 | 2.9%).
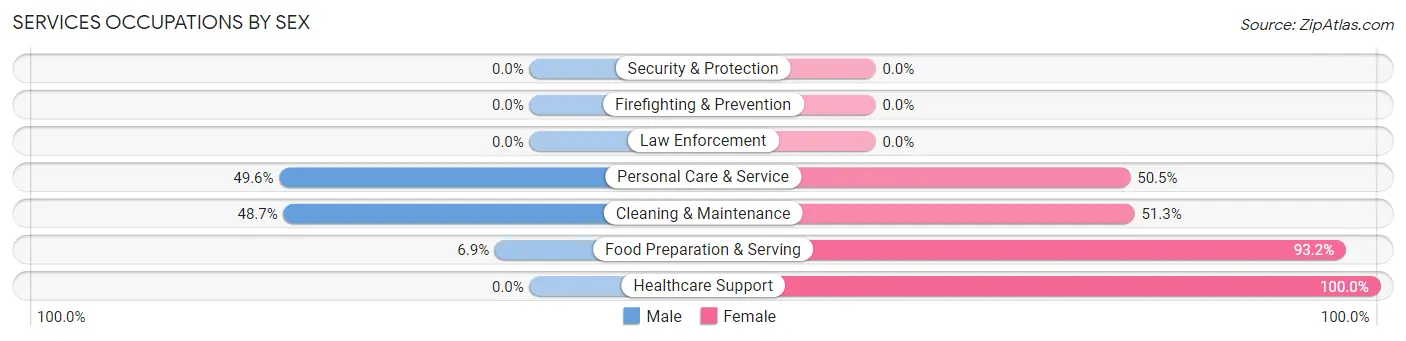
Services Occupations by Sex
Within the Services occupations in Doney Park, the most male-oriented occupations are Personal Care & Service (49.5%), Cleaning & Maintenance (48.7%), and Food Preparation & Serving (6.9%), while the most female-oriented occupations are Healthcare Support (100.0%), Food Preparation & Serving (93.1%), and Cleaning & Maintenance (51.3%).
| Occupation | Male | Female |
| Healthcare Support | 0 (0.0%) | 71 (100.0%) |
| Security & Protection | 0 (0.0%) | 0 (0.0%) |
| Firefighting & Prevention | 0 (0.0%) | 0 (0.0%) |
| Law Enforcement | 0 (0.0%) | 0 (0.0%) |
| Food Preparation & Serving | 5 (6.9%) | 68 (93.1%) |
| Cleaning & Maintenance | 38 (48.7%) | 40 (51.3%) |
| Personal Care & Service | 55 (49.5%) | 56 (50.4%) |
| Total (Category) | 98 (29.4%) | 235 (70.6%) |
| Total (Overall) | 1,345 (54.3%) | 1,131 (45.7%) |
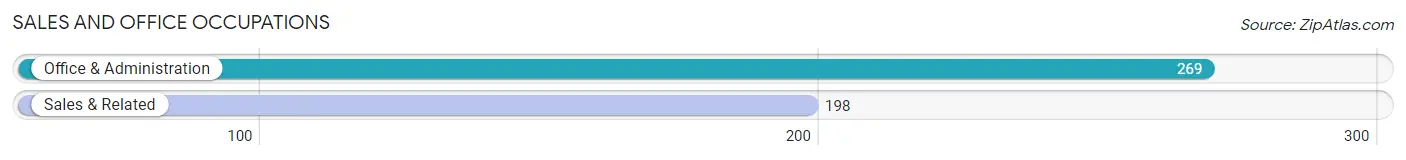
Sales and Office Occupations
The most common Sales and Office occupations in Doney Park are Office & Administration (269 | 10.9%), and Sales & Related (198 | 8.0%).
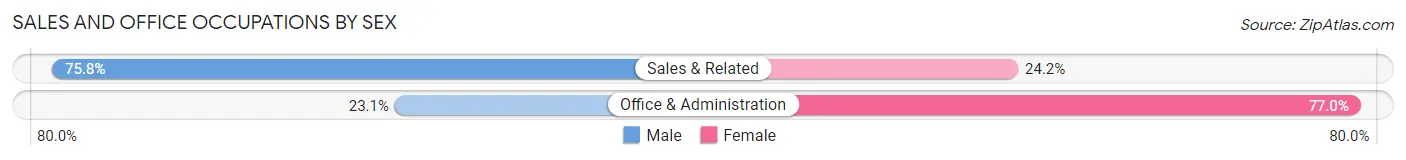
Sales and Office Occupations by Sex
| Occupation | Male | Female |
| Sales & Related | 150 (75.8%) | 48 (24.2%) |
| Office & Administration | 62 (23.1%) | 207 (76.9%) |
| Total (Category) | 212 (45.4%) | 255 (54.6%) |
| Total (Overall) | 1,345 (54.3%) | 1,131 (45.7%) |
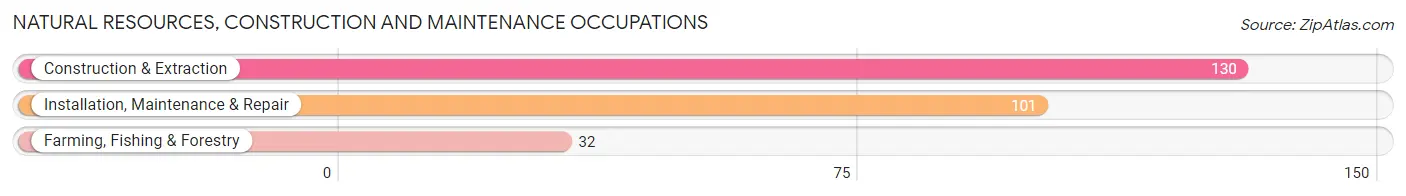
Natural Resources, Construction and Maintenance Occupations
The most common Natural Resources, Construction and Maintenance occupations in Doney Park are Construction & Extraction (130 | 5.2%), Installation, Maintenance & Repair (101 | 4.1%), and Farming, Fishing & Forestry (32 | 1.3%).
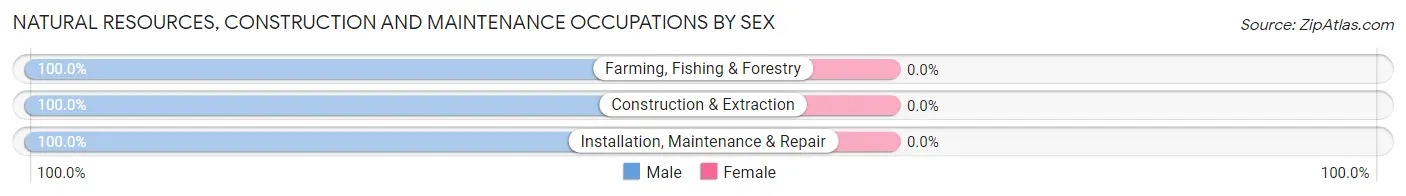
Natural Resources, Construction and Maintenance Occupations by Sex
| Occupation | Male | Female |
| Farming, Fishing & Forestry | 32 (100.0%) | 0 (0.0%) |
| Construction & Extraction | 130 (100.0%) | 0 (0.0%) |
| Installation, Maintenance & Repair | 101 (100.0%) | 0 (0.0%) |
| Total (Category) | 263 (100.0%) | 0 (0.0%) |
| Total (Overall) | 1,345 (54.3%) | 1,131 (45.7%) |
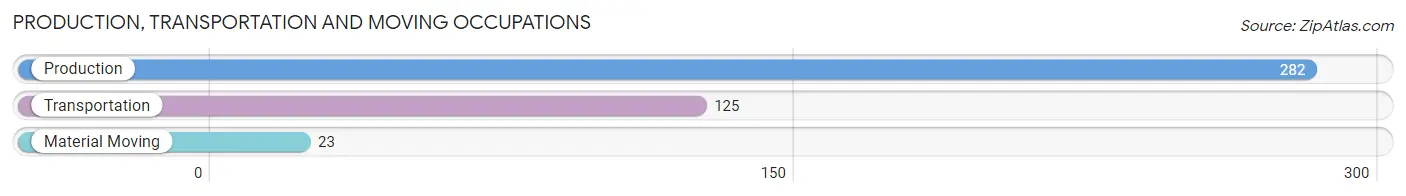
Production, Transportation and Moving Occupations
The most common Production, Transportation and Moving occupations in Doney Park are Production (282 | 11.4%), Transportation (125 | 5.1%), and Material Moving (23 | 0.9%).
Production, Transportation and Moving Occupations by Sex
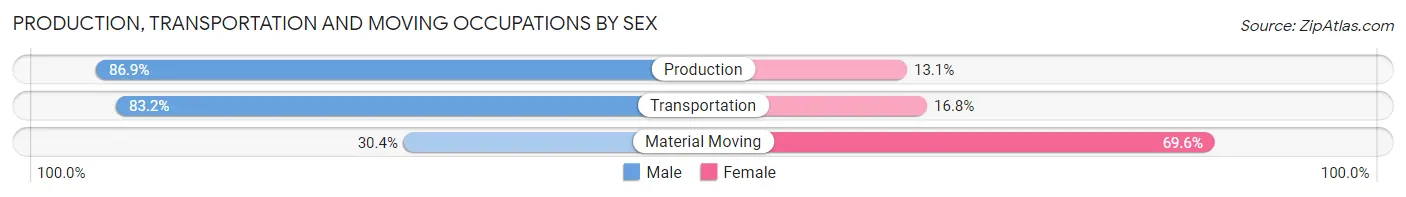
| Occupation | Male | Female |
| Production | 245 (86.9%) | 37 (13.1%) |
| Transportation | 104 (83.2%) | 21 (16.8%) |
| Material Moving | 7 (30.4%) | 16 (69.6%) |
| Total (Category) | 356 (82.8%) | 74 (17.2%) |
| Total (Overall) | 1,345 (54.3%) | 1,131 (45.7%) |
Employment Industries by Sex in Doney Park
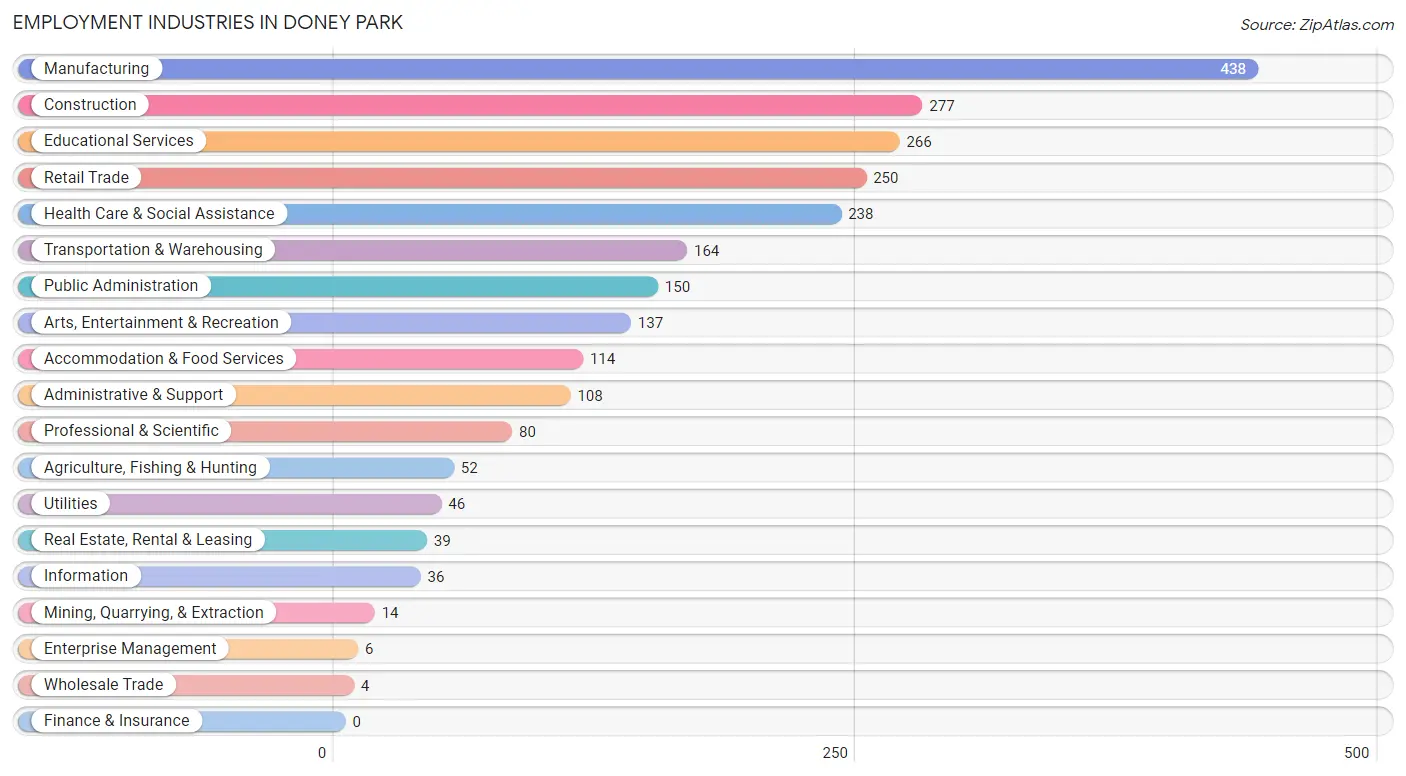
Employment Industries in Doney Park
The major employment industries in Doney Park include Manufacturing (438 | 17.7%), Construction (277 | 11.2%), Educational Services (266 | 10.7%), Retail Trade (250 | 10.1%), and Health Care & Social Assistance (238 | 9.6%).
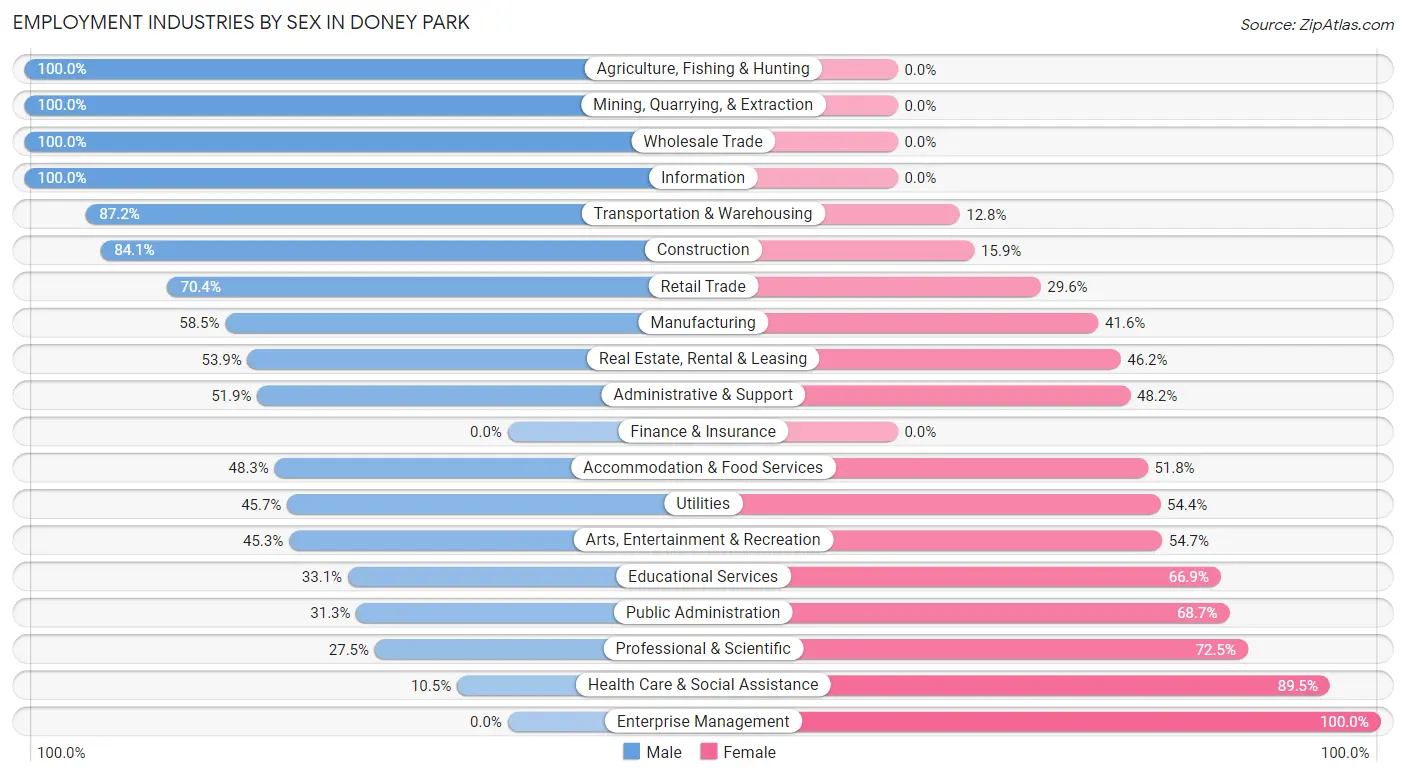
Employment Industries by Sex in Doney Park
The Doney Park industries that see more men than women are Agriculture, Fishing & Hunting (100.0%), Mining, Quarrying, & Extraction (100.0%), and Wholesale Trade (100.0%), whereas the industries that tend to have a higher number of women are Enterprise Management (100.0%), Health Care & Social Assistance (89.5%), and Professional & Scientific (72.5%).
| Industry | Male | Female |
| Agriculture, Fishing & Hunting | 52 (100.0%) | 0 (0.0%) |
| Mining, Quarrying, & Extraction | 14 (100.0%) | 0 (0.0%) |
| Construction | 233 (84.1%) | 44 (15.9%) |
| Manufacturing | 256 (58.5%) | 182 (41.5%) |
| Wholesale Trade | 4 (100.0%) | 0 (0.0%) |
| Retail Trade | 176 (70.4%) | 74 (29.6%) |
| Transportation & Warehousing | 143 (87.2%) | 21 (12.8%) |
| Utilities | 21 (45.7%) | 25 (54.3%) |
| Information | 36 (100.0%) | 0 (0.0%) |
| Finance & Insurance | 0 (0.0%) | 0 (0.0%) |
| Real Estate, Rental & Leasing | 21 (53.8%) | 18 (46.2%) |
| Professional & Scientific | 22 (27.5%) | 58 (72.5%) |
| Enterprise Management | 0 (0.0%) | 6 (100.0%) |
| Administrative & Support | 56 (51.8%) | 52 (48.1%) |
| Educational Services | 88 (33.1%) | 178 (66.9%) |
| Health Care & Social Assistance | 25 (10.5%) | 213 (89.5%) |
| Arts, Entertainment & Recreation | 62 (45.3%) | 75 (54.7%) |
| Accommodation & Food Services | 55 (48.2%) | 59 (51.7%) |
| Public Administration | 47 (31.3%) | 103 (68.7%) |
| Total | 1,345 (54.3%) | 1,131 (45.7%) |
Education in Doney Park
School Enrollment in Doney Park
The most common levels of schooling among the 1,450 students in Doney Park are middle school (372 | 25.7%), high school (359 | 24.8%), and college / undergraduate (286 | 19.7%).
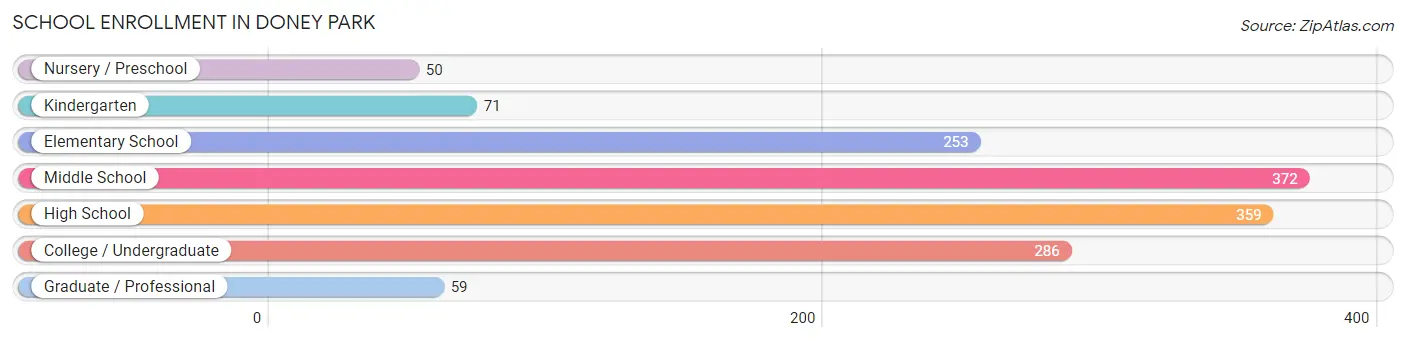
| School Level | # Students | % Students |
| Nursery / Preschool | 50 | 3.5% |
| Kindergarten | 71 | 4.9% |
| Elementary School | 253 | 17.4% |
| Middle School | 372 | 25.7% |
| High School | 359 | 24.8% |
| College / Undergraduate | 286 | 19.7% |
| Graduate / Professional | 59 | 4.1% |
| Total | 1,450 | 100.0% |
School Enrollment by Age by Funding Source in Doney Park
Out of a total of 1,450 students who are enrolled in schools in Doney Park, 579 (39.9%) attend a private institution, while the remaining 871 (60.1%) are enrolled in public schools. The age group of 15 to 17 year olds has the highest likelihood of being enrolled in private schools, with 168 (67.7% in the age bracket) enrolled. Conversely, the age group of 3 to 4 year olds has the lowest likelihood of being enrolled in a private school, with 14 (100.0% in the age bracket) attending a public institution.
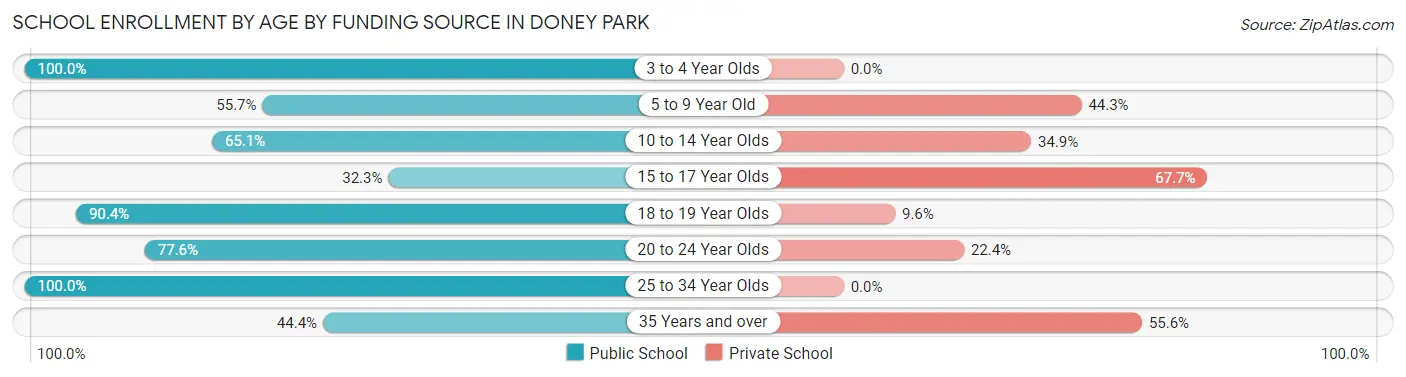
| Age Bracket | Public School | Private School |
| 3 to 4 Year Olds | 14 (100.0%) | 0 (0.0%) |
| 5 to 9 Year Old | 195 (55.7%) | 155 (44.3%) |
| 10 to 14 Year Olds | 291 (65.1%) | 156 (34.9%) |
| 15 to 17 Year Olds | 80 (32.3%) | 168 (67.7%) |
| 18 to 19 Year Olds | 85 (90.4%) | 9 (9.6%) |
| 20 to 24 Year Olds | 142 (77.6%) | 41 (22.4%) |
| 25 to 34 Year Olds | 24 (100.0%) | 0 (0.0%) |
| 35 Years and over | 40 (44.4%) | 50 (55.6%) |
| Total | 871 (60.1%) | 579 (39.9%) |
Educational Attainment by Field of Study in Doney Park
Education (273 | 17.1%), business (230 | 14.4%), liberal arts & history (212 | 13.3%), engineering (136 | 8.5%), and science & technology (124 | 7.8%) are the most common fields of study among 1,594 individuals in Doney Park who have obtained a bachelor's degree or higher.
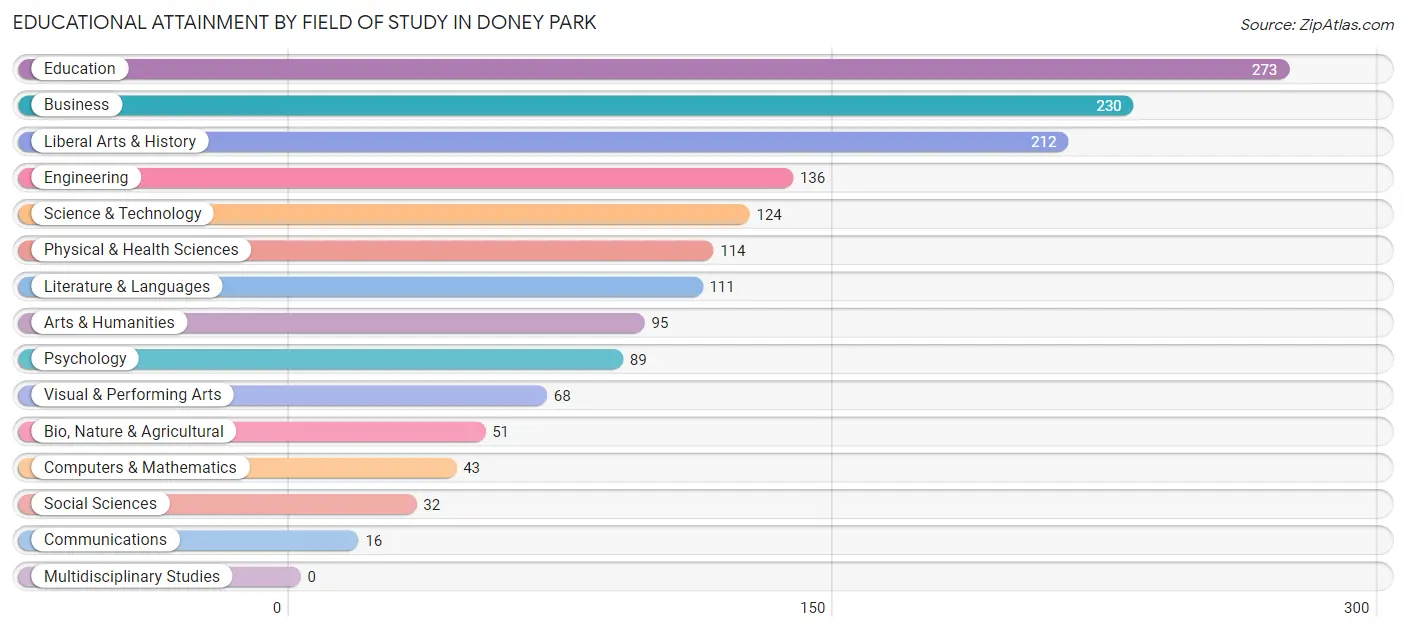
| Field of Study | # Graduates | % Graduates |
| Computers & Mathematics | 43 | 2.7% |
| Bio, Nature & Agricultural | 51 | 3.2% |
| Physical & Health Sciences | 114 | 7.1% |
| Psychology | 89 | 5.6% |
| Social Sciences | 32 | 2.0% |
| Engineering | 136 | 8.5% |
| Multidisciplinary Studies | 0 | 0.0% |
| Science & Technology | 124 | 7.8% |
| Business | 230 | 14.4% |
| Education | 273 | 17.1% |
| Literature & Languages | 111 | 7.0% |
| Liberal Arts & History | 212 | 13.3% |
| Visual & Performing Arts | 68 | 4.3% |
| Communications | 16 | 1.0% |
| Arts & Humanities | 95 | 6.0% |
| Total | 1,594 | 100.0% |
Transportation & Commute in Doney Park
Vehicle Availability by Sex in Doney Park
The most prevalent vehicle ownership categories in Doney Park are males with 3 vehicles (375, accounting for 28.8%) and females with 3 vehicles (316, making up 33.5%).
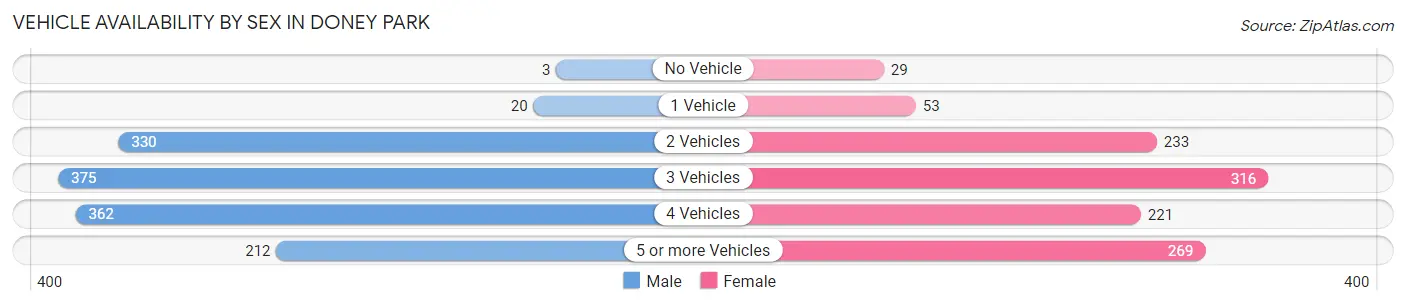
| Vehicles Available | Male | Female |
| No Vehicle | 3 (0.2%) | 29 (2.6%) |
| 1 Vehicle | 20 (1.5%) | 53 (4.7%) |
| 2 Vehicles | 330 (25.4%) | 233 (20.8%) |
| 3 Vehicles | 375 (28.8%) | 316 (28.2%) |
| 4 Vehicles | 362 (27.8%) | 221 (19.7%) |
| 5 or more Vehicles | 212 (16.3%) | 269 (24.0%) |
| Total | 1,302 (100.0%) | 1,121 (100.0%) |
Commute Time in Doney Park
The most frequently occuring commute durations in Doney Park are 20 to 24 minutes (572 commuters, 28.9%), 15 to 19 minutes (569 commuters, 28.7%), and 30 to 34 minutes (311 commuters, 15.7%).
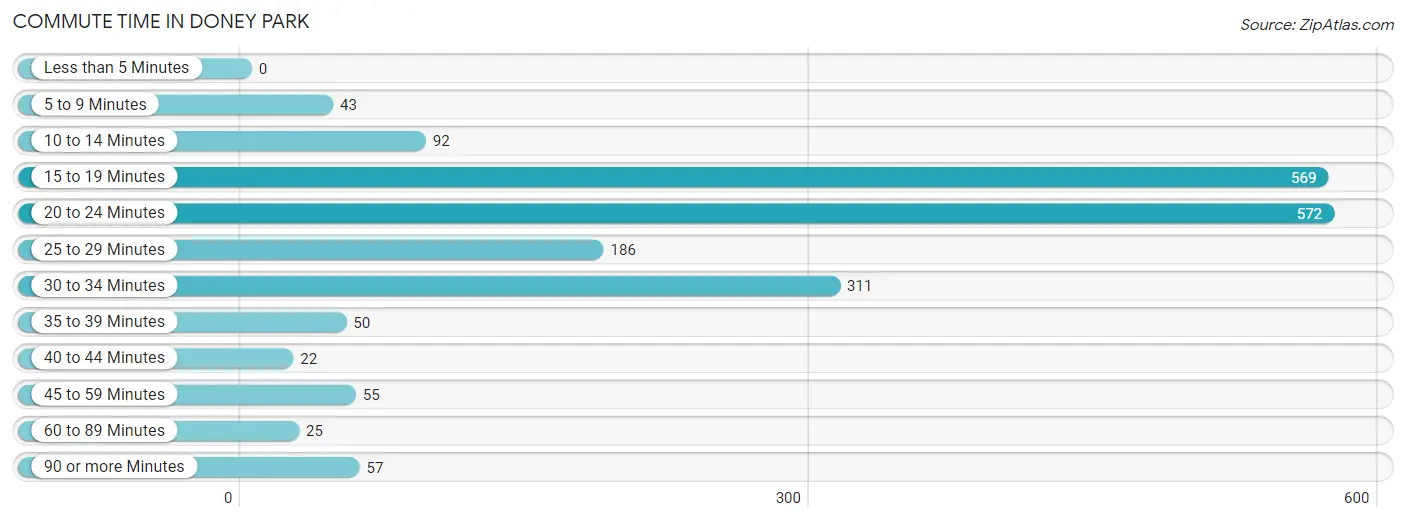
| Commute Time | # Commuters | % Commuters |
| Less than 5 Minutes | 0 | 0.0% |
| 5 to 9 Minutes | 43 | 2.2% |
| 10 to 14 Minutes | 92 | 4.6% |
| 15 to 19 Minutes | 569 | 28.7% |
| 20 to 24 Minutes | 572 | 28.9% |
| 25 to 29 Minutes | 186 | 9.4% |
| 30 to 34 Minutes | 311 | 15.7% |
| 35 to 39 Minutes | 50 | 2.5% |
| 40 to 44 Minutes | 22 | 1.1% |
| 45 to 59 Minutes | 55 | 2.8% |
| 60 to 89 Minutes | 25 | 1.3% |
| 90 or more Minutes | 57 | 2.9% |
Commute Time by Sex in Doney Park
The most common commute times in Doney Park are 15 to 19 minutes (367 commuters, 33.2%) for males and 20 to 24 minutes (360 commuters, 41.1%) for females.
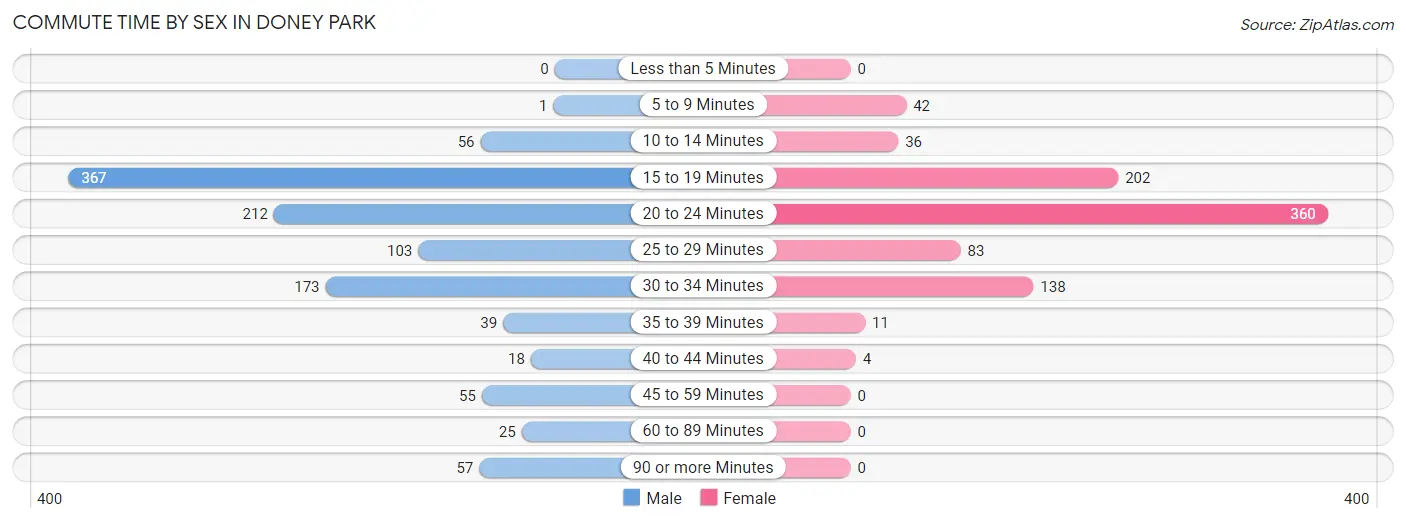
| Commute Time | Male | Female |
| Less than 5 Minutes | 0 (0.0%) | 0 (0.0%) |
| 5 to 9 Minutes | 1 (0.1%) | 42 (4.8%) |
| 10 to 14 Minutes | 56 (5.1%) | 36 (4.1%) |
| 15 to 19 Minutes | 367 (33.2%) | 202 (23.1%) |
| 20 to 24 Minutes | 212 (19.2%) | 360 (41.1%) |
| 25 to 29 Minutes | 103 (9.3%) | 83 (9.5%) |
| 30 to 34 Minutes | 173 (15.6%) | 138 (15.8%) |
| 35 to 39 Minutes | 39 (3.5%) | 11 (1.3%) |
| 40 to 44 Minutes | 18 (1.6%) | 4 (0.5%) |
| 45 to 59 Minutes | 55 (5.0%) | 0 (0.0%) |
| 60 to 89 Minutes | 25 (2.3%) | 0 (0.0%) |
| 90 or more Minutes | 57 (5.1%) | 0 (0.0%) |
Time of Departure to Work by Sex in Doney Park
The most frequent times of departure to work in Doney Park are 7:00 AM to 7:29 AM (184, 16.6%) for males and 7:30 AM to 7:59 AM (268, 30.6%) for females.
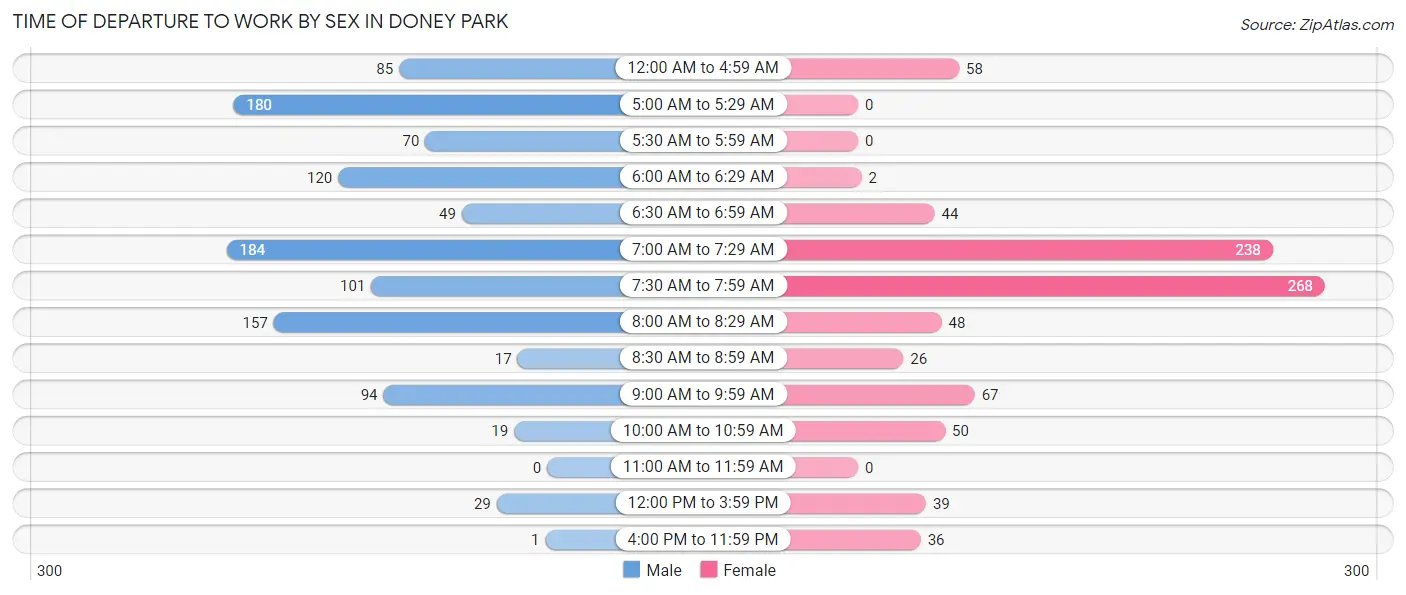
| Time of Departure | Male | Female |
| 12:00 AM to 4:59 AM | 85 (7.7%) | 58 (6.6%) |
| 5:00 AM to 5:29 AM | 180 (16.3%) | 0 (0.0%) |
| 5:30 AM to 5:59 AM | 70 (6.3%) | 0 (0.0%) |
| 6:00 AM to 6:29 AM | 120 (10.8%) | 2 (0.2%) |
| 6:30 AM to 6:59 AM | 49 (4.4%) | 44 (5.0%) |
| 7:00 AM to 7:29 AM | 184 (16.6%) | 238 (27.2%) |
| 7:30 AM to 7:59 AM | 101 (9.1%) | 268 (30.6%) |
| 8:00 AM to 8:29 AM | 157 (14.2%) | 48 (5.5%) |
| 8:30 AM to 8:59 AM | 17 (1.5%) | 26 (3.0%) |
| 9:00 AM to 9:59 AM | 94 (8.5%) | 67 (7.6%) |
| 10:00 AM to 10:59 AM | 19 (1.7%) | 50 (5.7%) |
| 11:00 AM to 11:59 AM | 0 (0.0%) | 0 (0.0%) |
| 12:00 PM to 3:59 PM | 29 (2.6%) | 39 (4.4%) |
| 4:00 PM to 11:59 PM | 1 (0.1%) | 36 (4.1%) |
| Total | 1,106 (100.0%) | 876 (100.0%) |
Housing Occupancy in Doney Park
Occupancy by Ownership in Doney Park
Of the total 1,807 dwellings in Doney Park, owner-occupied units account for 1,703 (94.2%), while renter-occupied units make up 104 (5.8%).
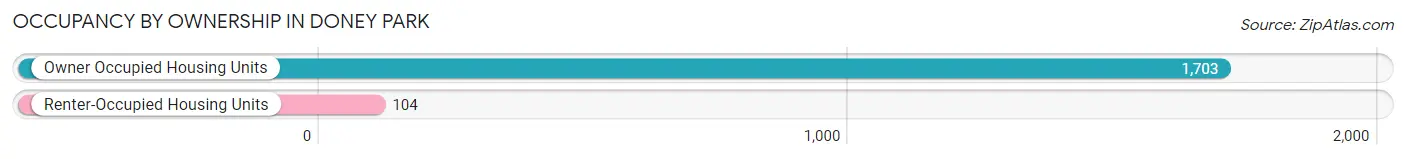
| Occupancy | # Housing Units | % Housing Units |
| Owner Occupied Housing Units | 1,703 | 94.2% |
| Renter-Occupied Housing Units | 104 | 5.8% |
| Total Occupied Housing Units | 1,807 | 100.0% |
Occupancy by Household Size in Doney Park
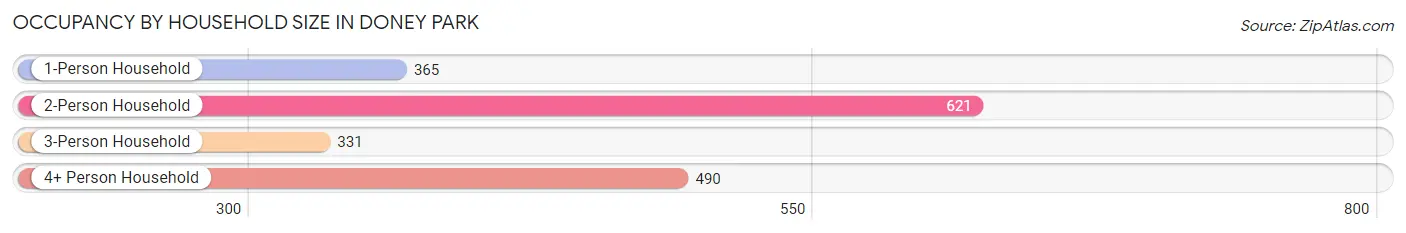
| Household Size | # Housing Units | % Housing Units |
| 1-Person Household | 365 | 20.2% |
| 2-Person Household | 621 | 34.4% |
| 3-Person Household | 331 | 18.3% |
| 4+ Person Household | 490 | 27.1% |
| Total Housing Units | 1,807 | 100.0% |
Occupancy by Ownership by Household Size in Doney Park
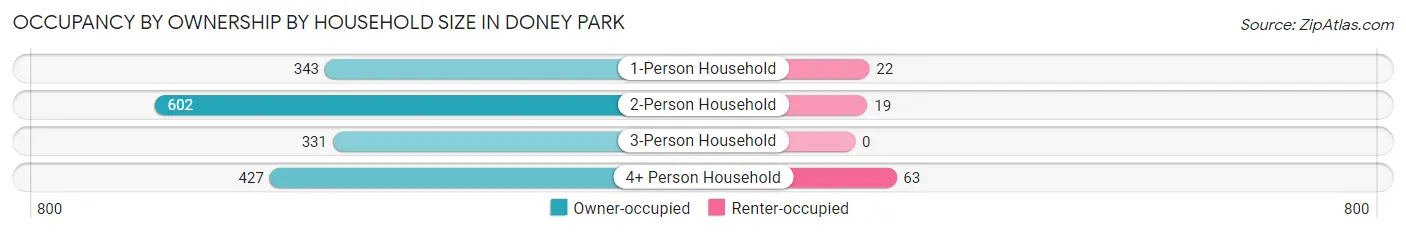
| Household Size | Owner-occupied | Renter-occupied |
| 1-Person Household | 343 (94.0%) | 22 (6.0%) |
| 2-Person Household | 602 (96.9%) | 19 (3.1%) |
| 3-Person Household | 331 (100.0%) | 0 (0.0%) |
| 4+ Person Household | 427 (87.1%) | 63 (12.9%) |
| Total Housing Units | 1,703 (94.2%) | 104 (5.8%) |
Occupancy by Educational Attainment in Doney Park
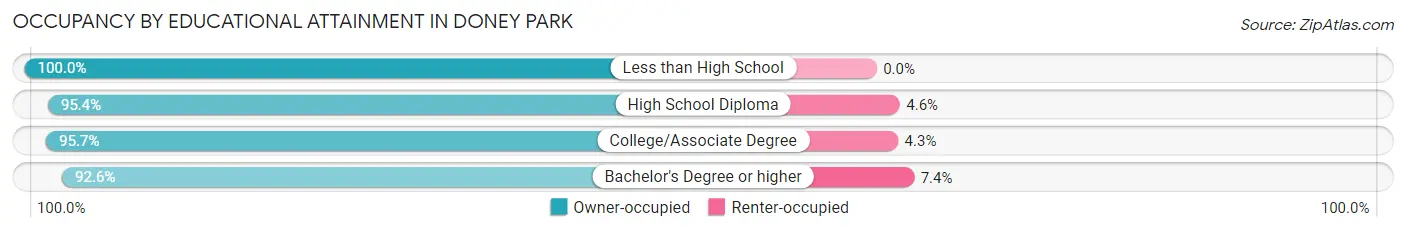
| Household Size | Owner-occupied | Renter-occupied |
| Less than High School | 31 (100.0%) | 0 (0.0%) |
| High School Diploma | 394 (95.4%) | 19 (4.6%) |
| College/Associate Degree | 494 (95.7%) | 22 (4.3%) |
| Bachelor's Degree or higher | 784 (92.6%) | 63 (7.4%) |
Occupancy by Age of Householder in Doney Park
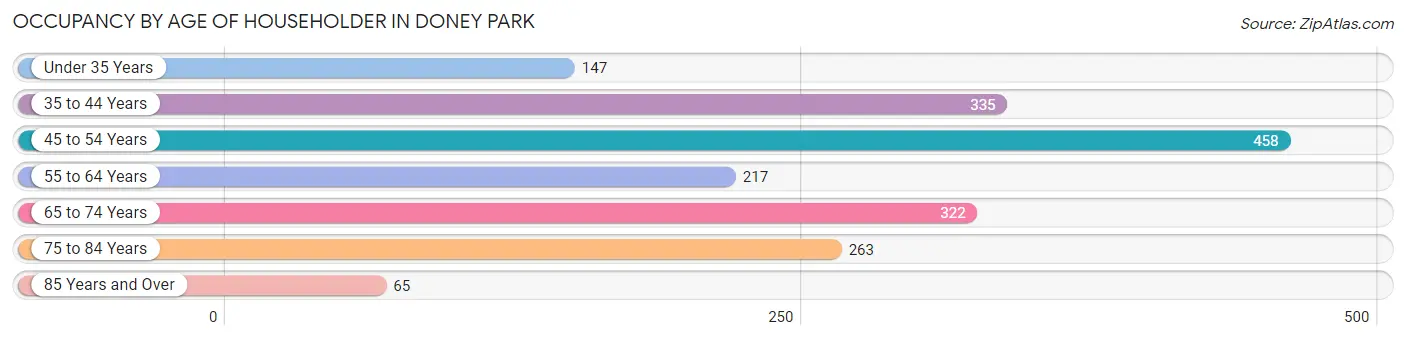
| Age Bracket | # Households | % Households |
| Under 35 Years | 147 | 8.1% |
| 35 to 44 Years | 335 | 18.5% |
| 45 to 54 Years | 458 | 25.4% |
| 55 to 64 Years | 217 | 12.0% |
| 65 to 74 Years | 322 | 17.8% |
| 75 to 84 Years | 263 | 14.5% |
| 85 Years and Over | 65 | 3.6% |
| Total | 1,807 | 100.0% |
Housing Finances in Doney Park
Median Income by Occupancy in Doney Park
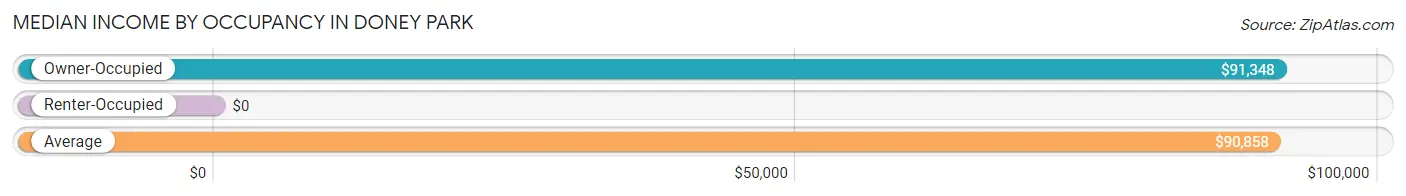
| Occupancy Type | # Households | Median Income |
| Owner-Occupied | 1,703 (94.2%) | $91,348 |
| Renter-Occupied | 104 (5.8%) | $0 |
| Average | 1,807 (100.0%) | $90,858 |
Occupancy by Householder Income Bracket in Doney Park
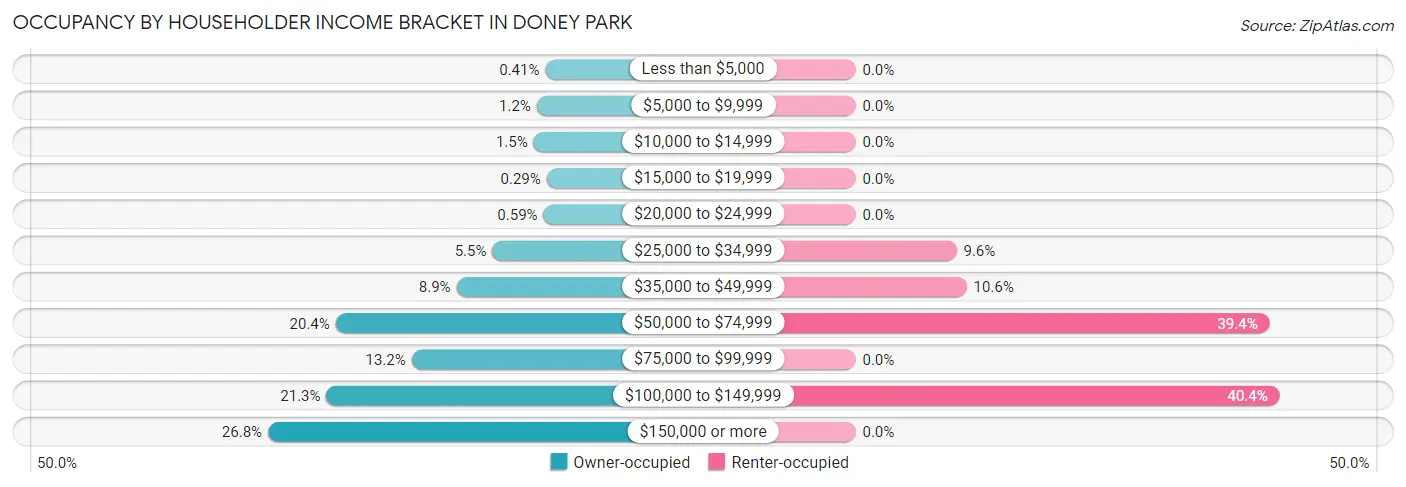
| Income Bracket | Owner-occupied | Renter-occupied |
| Less than $5,000 | 7 (0.4%) | 0 (0.0%) |
| $5,000 to $9,999 | 21 (1.2%) | 0 (0.0%) |
| $10,000 to $14,999 | 26 (1.5%) | 0 (0.0%) |
| $15,000 to $19,999 | 5 (0.3%) | 0 (0.0%) |
| $20,000 to $24,999 | 10 (0.6%) | 0 (0.0%) |
| $25,000 to $34,999 | 93 (5.5%) | 10 (9.6%) |
| $35,000 to $49,999 | 151 (8.9%) | 11 (10.6%) |
| $50,000 to $74,999 | 347 (20.4%) | 41 (39.4%) |
| $75,000 to $99,999 | 224 (13.2%) | 0 (0.0%) |
| $100,000 to $149,999 | 362 (21.3%) | 42 (40.4%) |
| $150,000 or more | 457 (26.8%) | 0 (0.0%) |
| Total | 1,703 (100.0%) | 104 (100.0%) |
Monthly Housing Cost Tiers in Doney Park
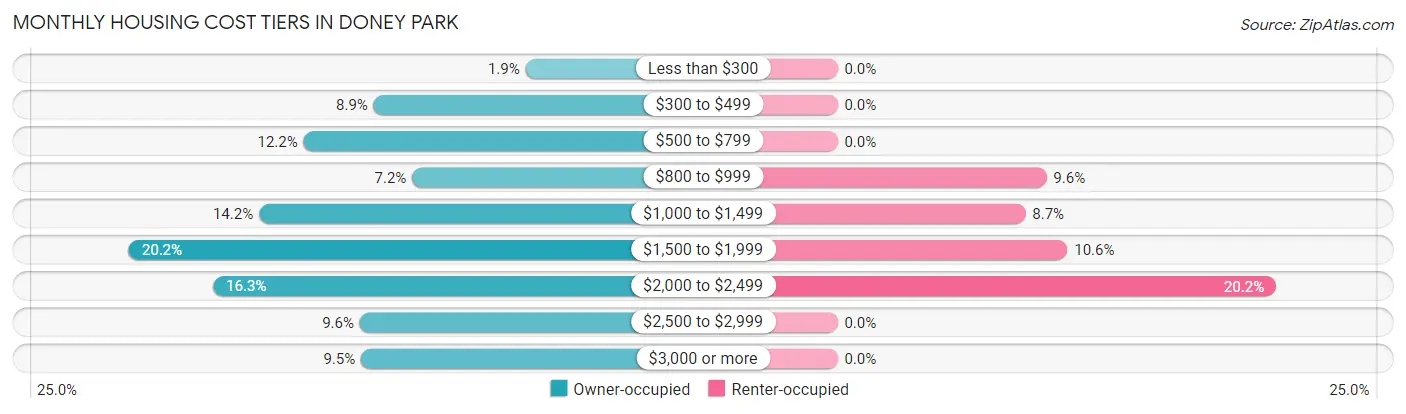
| Monthly Cost | Owner-occupied | Renter-occupied |
| Less than $300 | 33 (1.9%) | 0 (0.0%) |
| $300 to $499 | 152 (8.9%) | 0 (0.0%) |
| $500 to $799 | 207 (12.2%) | 0 (0.0%) |
| $800 to $999 | 122 (7.2%) | 10 (9.6%) |
| $1,000 to $1,499 | 242 (14.2%) | 9 (8.6%) |
| $1,500 to $1,999 | 344 (20.2%) | 11 (10.6%) |
| $2,000 to $2,499 | 278 (16.3%) | 21 (20.2%) |
| $2,500 to $2,999 | 163 (9.6%) | 0 (0.0%) |
| $3,000 or more | 162 (9.5%) | 0 (0.0%) |
| Total | 1,703 (100.0%) | 104 (100.0%) |
Physical Housing Characteristics in Doney Park
Housing Structures in Doney Park
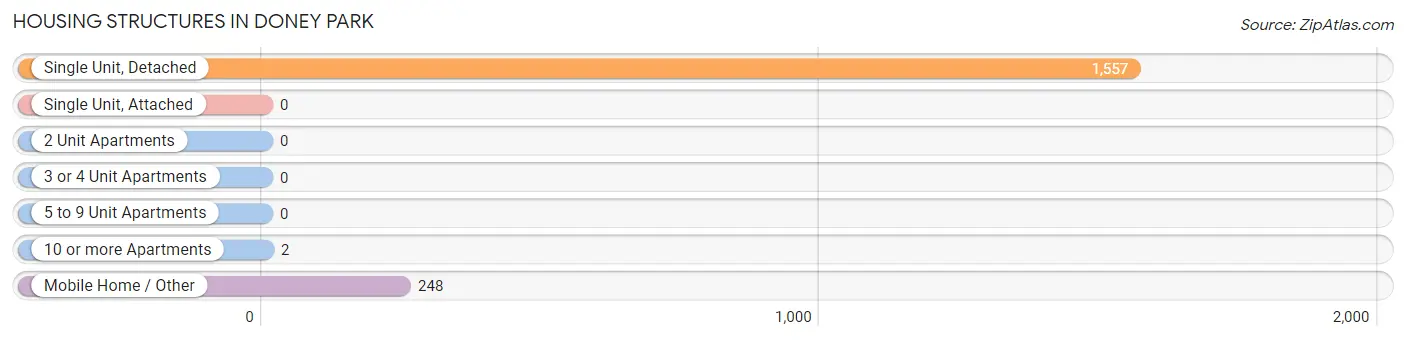
| Structure Type | # Housing Units | % Housing Units |
| Single Unit, Detached | 1,557 | 86.2% |
| Single Unit, Attached | 0 | 0.0% |
| 2 Unit Apartments | 0 | 0.0% |
| 3 or 4 Unit Apartments | 0 | 0.0% |
| 5 to 9 Unit Apartments | 0 | 0.0% |
| 10 or more Apartments | 2 | 0.1% |
| Mobile Home / Other | 248 | 13.7% |
| Total | 1,807 | 100.0% |
Housing Structures by Occupancy in Doney Park
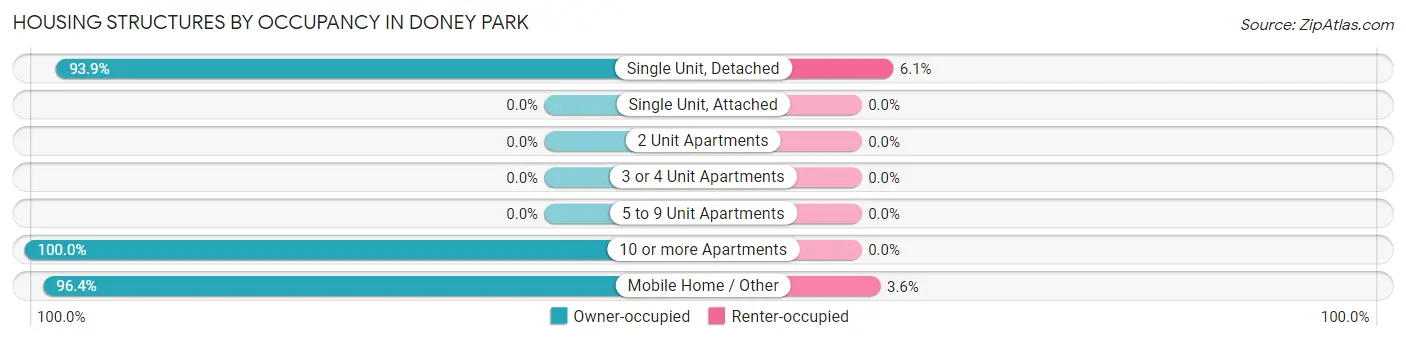
| Structure Type | Owner-occupied | Renter-occupied |
| Single Unit, Detached | 1,462 (93.9%) | 95 (6.1%) |
| Single Unit, Attached | 0 (0.0%) | 0 (0.0%) |
| 2 Unit Apartments | 0 (0.0%) | 0 (0.0%) |
| 3 or 4 Unit Apartments | 0 (0.0%) | 0 (0.0%) |
| 5 to 9 Unit Apartments | 0 (0.0%) | 0 (0.0%) |
| 10 or more Apartments | 2 (100.0%) | 0 (0.0%) |
| Mobile Home / Other | 239 (96.4%) | 9 (3.6%) |
| Total | 1,703 (94.2%) | 104 (5.8%) |
Housing Structures by Number of Rooms in Doney Park
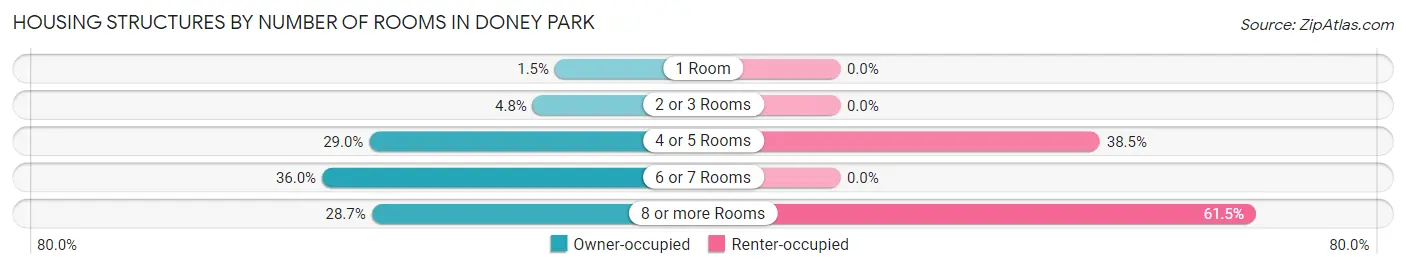
| Number of Rooms | Owner-occupied | Renter-occupied |
| 1 Room | 26 (1.5%) | 0 (0.0%) |
| 2 or 3 Rooms | 82 (4.8%) | 0 (0.0%) |
| 4 or 5 Rooms | 494 (29.0%) | 40 (38.5%) |
| 6 or 7 Rooms | 613 (36.0%) | 0 (0.0%) |
| 8 or more Rooms | 488 (28.7%) | 64 (61.5%) |
| Total | 1,703 (100.0%) | 104 (100.0%) |
Housing Structure by Heating Type in Doney Park
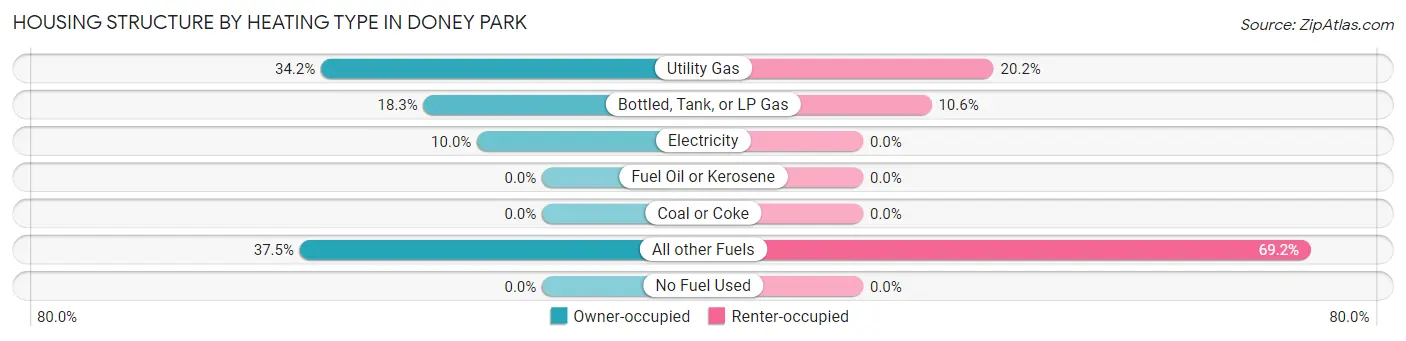
| Heating Type | Owner-occupied | Renter-occupied |
| Utility Gas | 582 (34.2%) | 21 (20.2%) |
| Bottled, Tank, or LP Gas | 312 (18.3%) | 11 (10.6%) |
| Electricity | 171 (10.0%) | 0 (0.0%) |
| Fuel Oil or Kerosene | 0 (0.0%) | 0 (0.0%) |
| Coal or Coke | 0 (0.0%) | 0 (0.0%) |
| All other Fuels | 638 (37.5%) | 72 (69.2%) |
| No Fuel Used | 0 (0.0%) | 0 (0.0%) |
| Total | 1,703 (100.0%) | 104 (100.0%) |
Household Vehicle Usage in Doney Park
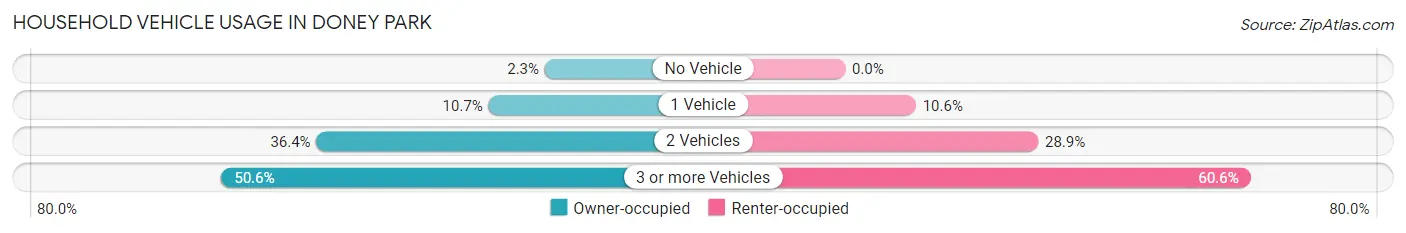
| Vehicles per Household | Owner-occupied | Renter-occupied |
| No Vehicle | 39 (2.3%) | 0 (0.0%) |
| 1 Vehicle | 182 (10.7%) | 11 (10.6%) |
| 2 Vehicles | 620 (36.4%) | 30 (28.8%) |
| 3 or more Vehicles | 862 (50.6%) | 63 (60.6%) |
| Total | 1,703 (100.0%) | 104 (100.0%) |
Real Estate & Mortgages in Doney Park
Real Estate and Mortgage Overview in Doney Park
| Characteristic | Without Mortgage | With Mortgage |
| Housing Units | 473 | 1,230 |
| Median Property Value | $533,800 | $530,900 |
| Median Household Income | $72,452 | $424 |
| Monthly Housing Costs | $571 | $162 |
| Real Estate Taxes | $2,449 | $0 |
Property Value by Mortgage Status in Doney Park
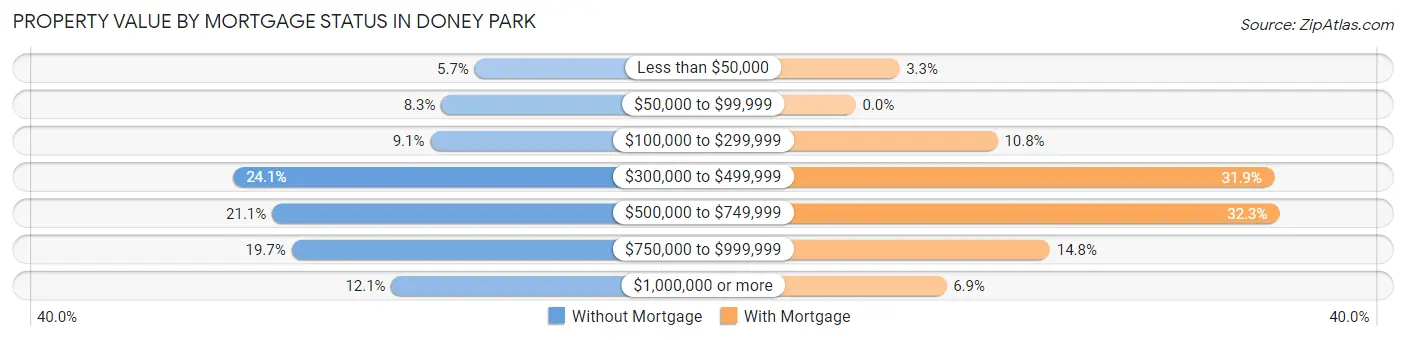
| Property Value | Without Mortgage | With Mortgage |
| Less than $50,000 | 27 (5.7%) | 41 (3.3%) |
| $50,000 to $99,999 | 39 (8.3%) | 0 (0.0%) |
| $100,000 to $299,999 | 43 (9.1%) | 133 (10.8%) |
| $300,000 to $499,999 | 114 (24.1%) | 392 (31.9%) |
| $500,000 to $749,999 | 100 (21.1%) | 397 (32.3%) |
| $750,000 to $999,999 | 93 (19.7%) | 182 (14.8%) |
| $1,000,000 or more | 57 (12.0%) | 85 (6.9%) |
| Total | 473 (100.0%) | 1,230 (100.0%) |
Household Income by Mortgage Status in Doney Park
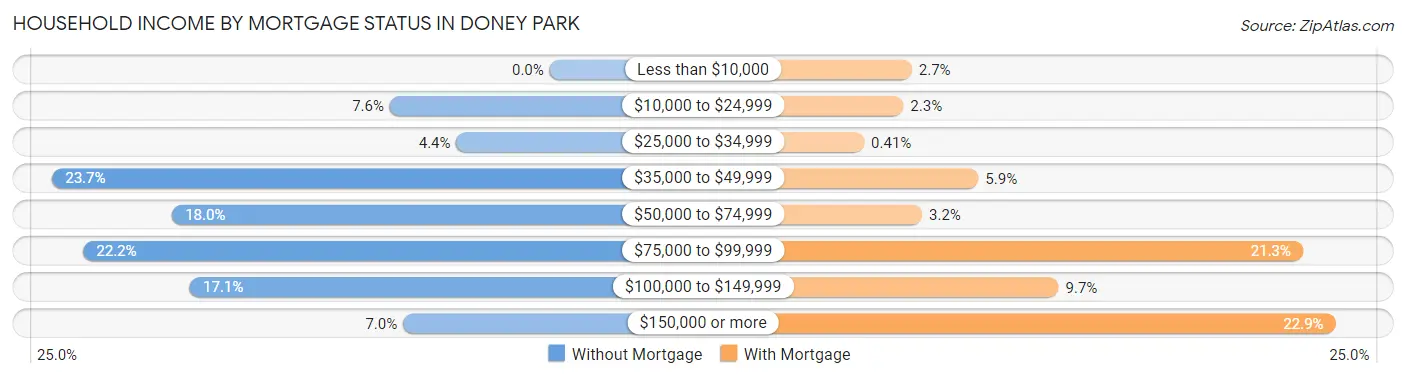
| Household Income | Without Mortgage | With Mortgage |
| Less than $10,000 | 0 (0.0%) | 33 (2.7%) |
| $10,000 to $24,999 | 36 (7.6%) | 28 (2.3%) |
| $25,000 to $34,999 | 21 (4.4%) | 5 (0.4%) |
| $35,000 to $49,999 | 112 (23.7%) | 72 (5.9%) |
| $50,000 to $74,999 | 85 (18.0%) | 39 (3.2%) |
| $75,000 to $99,999 | 105 (22.2%) | 262 (21.3%) |
| $100,000 to $149,999 | 81 (17.1%) | 119 (9.7%) |
| $150,000 or more | 33 (7.0%) | 281 (22.9%) |
| Total | 473 (100.0%) | 1,230 (100.0%) |
Property Value to Household Income Ratio in Doney Park
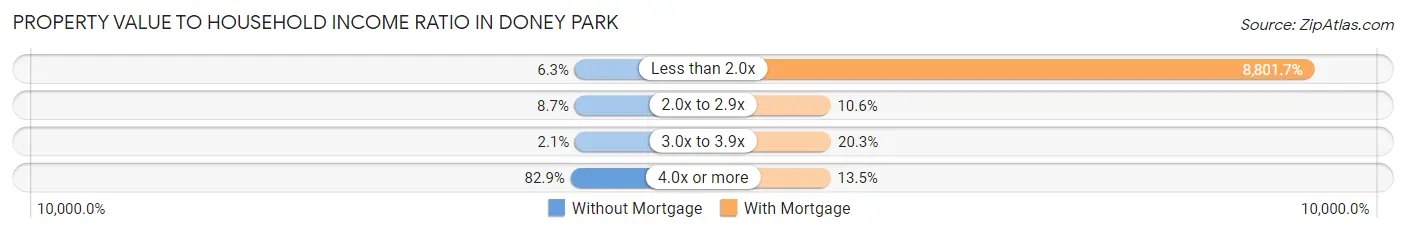
| Value-to-Income Ratio | Without Mortgage | With Mortgage |
| Less than 2.0x | 30 (6.3%) | 108,261 (8,801.7%) |
| 2.0x to 2.9x | 41 (8.7%) | 130 (10.6%) |
| 3.0x to 3.9x | 10 (2.1%) | 250 (20.3%) |
| 4.0x or more | 392 (82.9%) | 166 (13.5%) |
| Total | 473 (100.0%) | 1,230 (100.0%) |
Real Estate Taxes by Mortgage Status in Doney Park
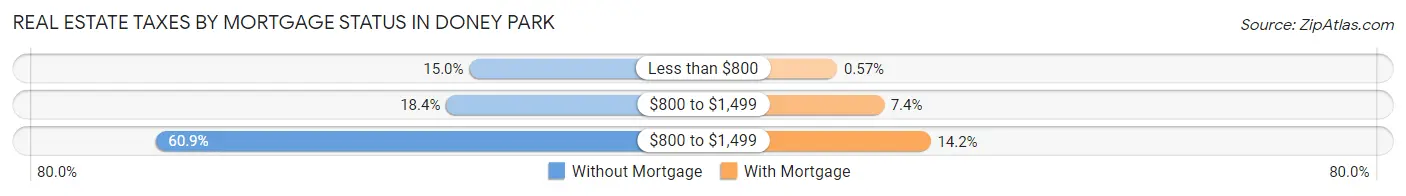
| Property Taxes | Without Mortgage | With Mortgage |
| Less than $800 | 71 (15.0%) | 7 (0.6%) |
| $800 to $1,499 | 87 (18.4%) | 91 (7.4%) |
| $800 to $1,499 | 288 (60.9%) | 175 (14.2%) |
| Total | 473 (100.0%) | 1,230 (100.0%) |
Health & Disability in Doney Park
Health Insurance Coverage by Age in Doney Park
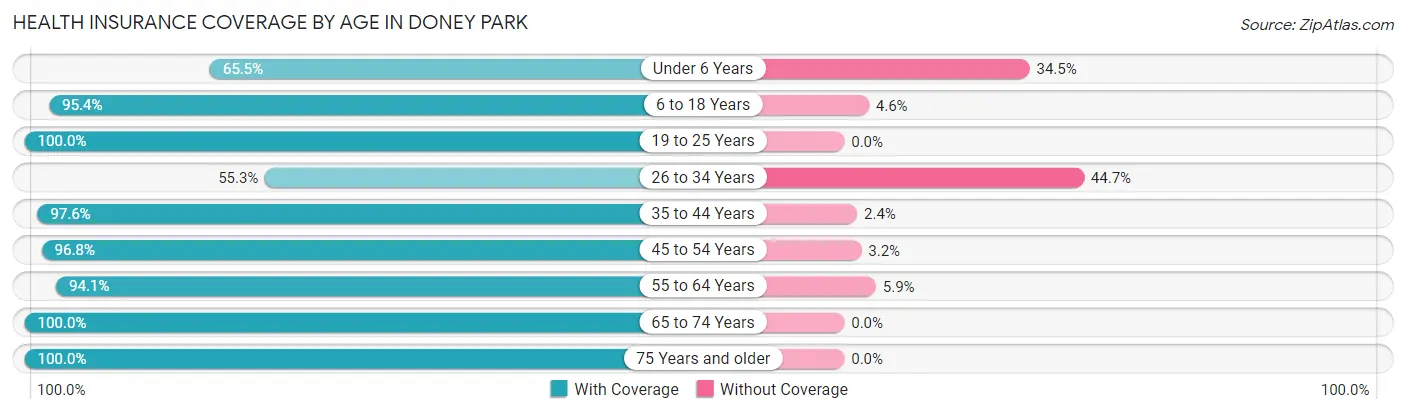
| Age Bracket | With Coverage | Without Coverage |
| Under 6 Years | 199 (65.5%) | 105 (34.5%) |
| 6 to 18 Years | 958 (95.4%) | 46 (4.6%) |
| 19 to 25 Years | 308 (100.0%) | 0 (0.0%) |
| 26 to 34 Years | 156 (55.3%) | 126 (44.7%) |
| 35 to 44 Years | 693 (97.6%) | 17 (2.4%) |
| 45 to 54 Years | 913 (96.8%) | 30 (3.2%) |
| 55 to 64 Years | 368 (94.1%) | 23 (5.9%) |
| 65 to 74 Years | 621 (100.0%) | 0 (0.0%) |
| 75 Years and older | 483 (100.0%) | 0 (0.0%) |
| Total | 4,699 (93.1%) | 347 (6.9%) |
Health Insurance Coverage by Citizenship Status in Doney Park
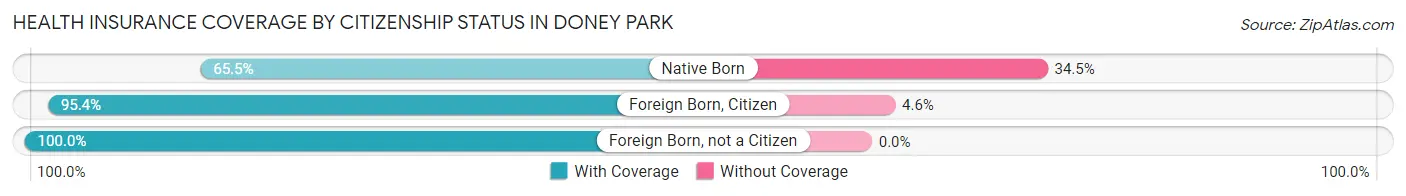
| Citizenship Status | With Coverage | Without Coverage |
| Native Born | 199 (65.5%) | 105 (34.5%) |
| Foreign Born, Citizen | 958 (95.4%) | 46 (4.6%) |
| Foreign Born, not a Citizen | 308 (100.0%) | 0 (0.0%) |
Health Insurance Coverage by Household Income in Doney Park
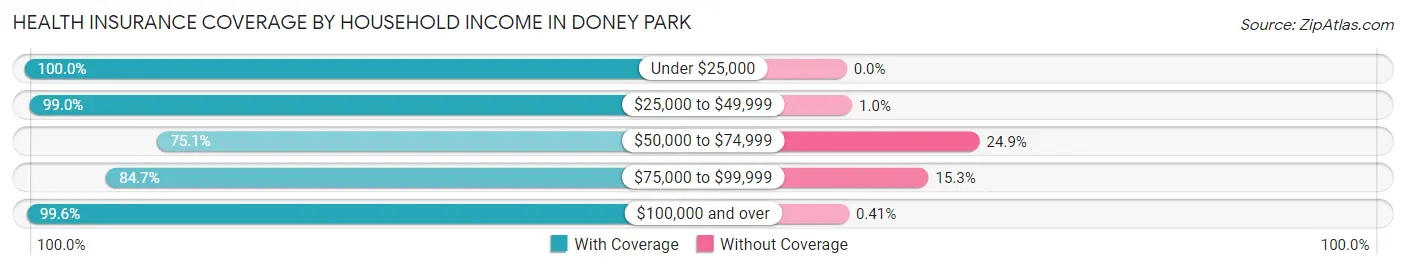
| Household Income | With Coverage | Without Coverage |
| Under $25,000 | 109 (100.0%) | 0 (0.0%) |
| $25,000 to $49,999 | 397 (99.0%) | 4 (1.0%) |
| $50,000 to $74,999 | 685 (75.1%) | 227 (24.9%) |
| $75,000 to $99,999 | 575 (84.7%) | 104 (15.3%) |
| $100,000 and over | 2,913 (99.6%) | 12 (0.4%) |
Public vs Private Health Insurance Coverage by Age in Doney Park
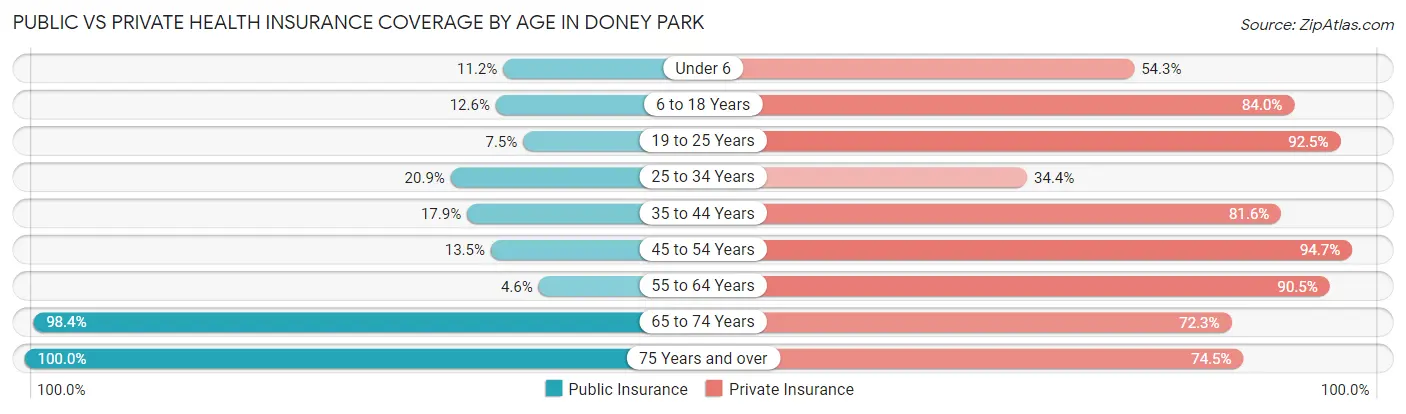
| Age Bracket | Public Insurance | Private Insurance |
| Under 6 | 34 (11.2%) | 165 (54.3%) |
| 6 to 18 Years | 126 (12.6%) | 843 (84.0%) |
| 19 to 25 Years | 23 (7.5%) | 285 (92.5%) |
| 25 to 34 Years | 59 (20.9%) | 97 (34.4%) |
| 35 to 44 Years | 127 (17.9%) | 579 (81.6%) |
| 45 to 54 Years | 127 (13.5%) | 893 (94.7%) |
| 55 to 64 Years | 18 (4.6%) | 354 (90.5%) |
| 65 to 74 Years | 611 (98.4%) | 449 (72.3%) |
| 75 Years and over | 483 (100.0%) | 360 (74.5%) |
| Total | 1,608 (31.9%) | 4,025 (79.8%) |
Disability Status by Sex by Age in Doney Park
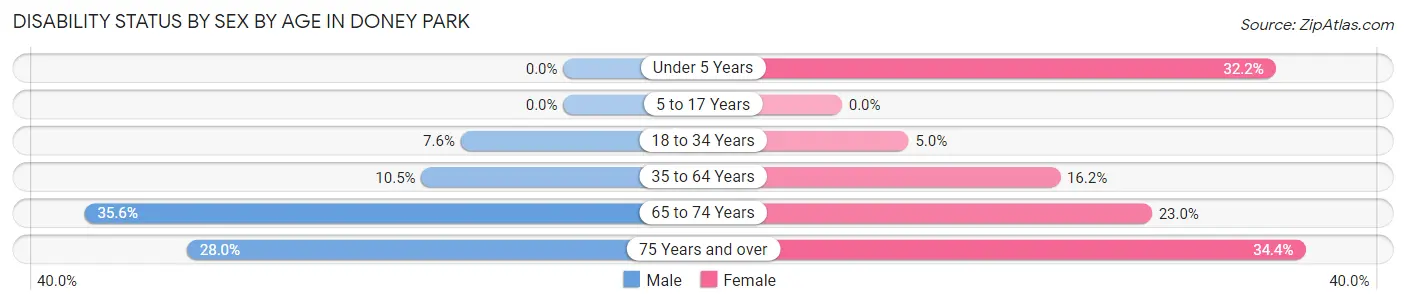
| Age Bracket | Male | Female |
| Under 5 Years | 0 (0.0%) | 19 (32.2%) |
| 5 to 17 Years | 0 (0.0%) | 0 (0.0%) |
| 18 to 34 Years | 23 (7.6%) | 18 (5.0%) |
| 35 to 64 Years | 110 (10.5%) | 162 (16.2%) |
| 65 to 74 Years | 91 (35.5%) | 84 (23.0%) |
| 75 Years and over | 83 (28.0%) | 64 (34.4%) |
Disability Class by Sex by Age in Doney Park
Disability Class: Hearing Difficulty
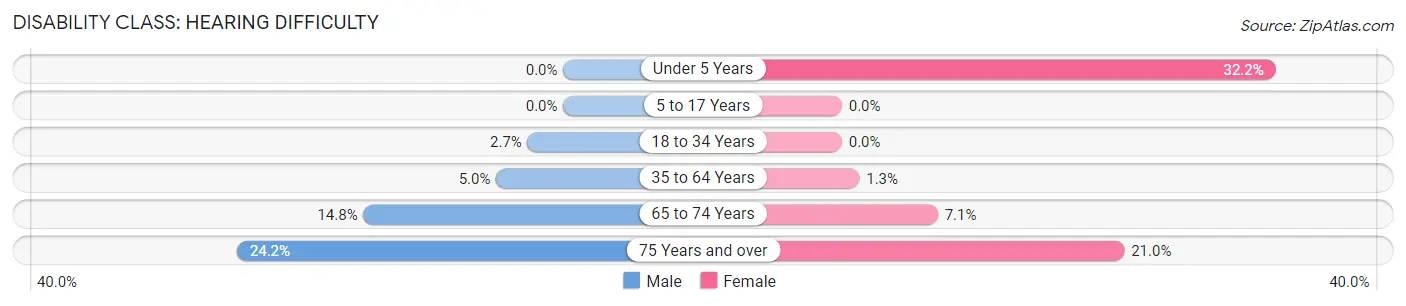
| Age Bracket | Male | Female |
| Under 5 Years | 0 (0.0%) | 19 (32.2%) |
| 5 to 17 Years | 0 (0.0%) | 0 (0.0%) |
| 18 to 34 Years | 8 (2.6%) | 0 (0.0%) |
| 35 to 64 Years | 52 (5.0%) | 13 (1.3%) |
| 65 to 74 Years | 38 (14.8%) | 26 (7.1%) |
| 75 Years and over | 72 (24.2%) | 39 (21.0%) |
Disability Class: Vision Difficulty
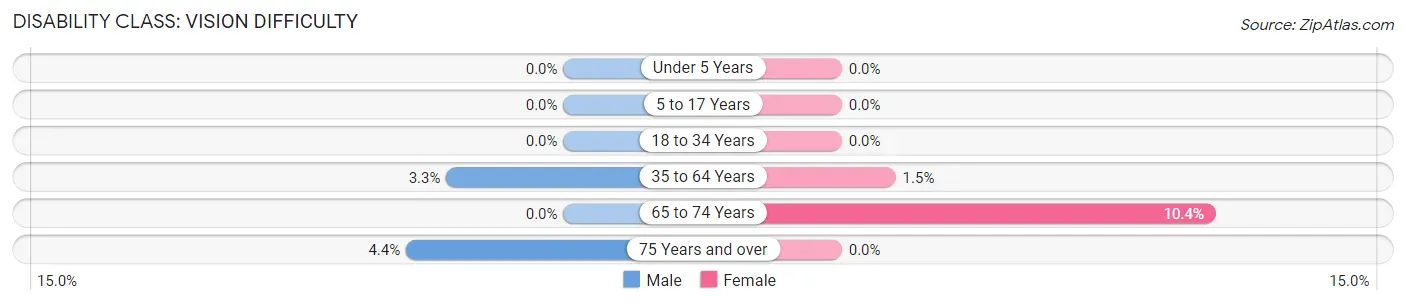
| Age Bracket | Male | Female |
| Under 5 Years | 0 (0.0%) | 0 (0.0%) |
| 5 to 17 Years | 0 (0.0%) | 0 (0.0%) |
| 18 to 34 Years | 0 (0.0%) | 0 (0.0%) |
| 35 to 64 Years | 34 (3.3%) | 15 (1.5%) |
| 65 to 74 Years | 0 (0.0%) | 38 (10.4%) |
| 75 Years and over | 13 (4.4%) | 0 (0.0%) |
Disability Class: Cognitive Difficulty
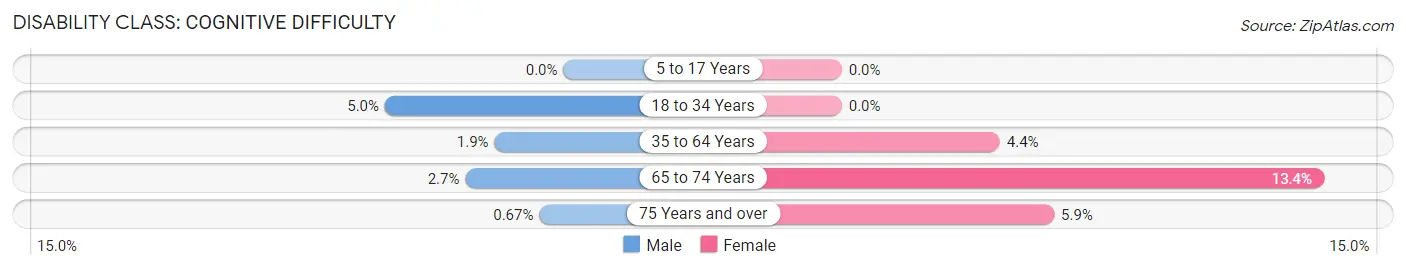
| Age Bracket | Male | Female |
| 5 to 17 Years | 0 (0.0%) | 0 (0.0%) |
| 18 to 34 Years | 15 (5.0%) | 0 (0.0%) |
| 35 to 64 Years | 20 (1.9%) | 44 (4.4%) |
| 65 to 74 Years | 7 (2.7%) | 49 (13.4%) |
| 75 Years and over | 2 (0.7%) | 11 (5.9%) |
Disability Class: Ambulatory Difficulty
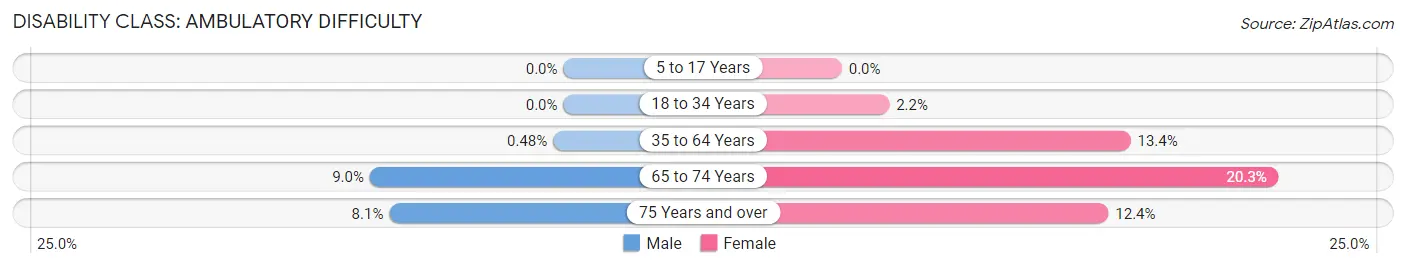
| Age Bracket | Male | Female |
| 5 to 17 Years | 0 (0.0%) | 0 (0.0%) |
| 18 to 34 Years | 0 (0.0%) | 8 (2.2%) |
| 35 to 64 Years | 5 (0.5%) | 134 (13.4%) |
| 65 to 74 Years | 23 (9.0%) | 74 (20.3%) |
| 75 Years and over | 24 (8.1%) | 23 (12.4%) |
Disability Class: Self-Care Difficulty
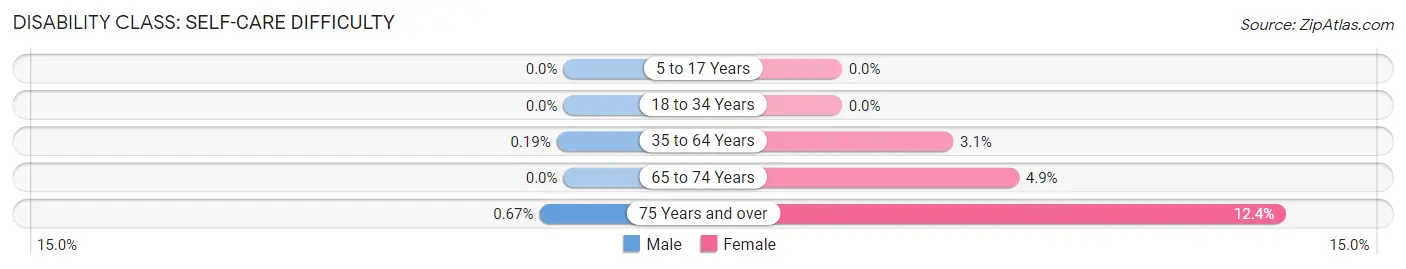
| Age Bracket | Male | Female |
| 5 to 17 Years | 0 (0.0%) | 0 (0.0%) |
| 18 to 34 Years | 0 (0.0%) | 0 (0.0%) |
| 35 to 64 Years | 2 (0.2%) | 31 (3.1%) |
| 65 to 74 Years | 0 (0.0%) | 18 (4.9%) |
| 75 Years and over | 2 (0.7%) | 23 (12.4%) |
Technology Access in Doney Park
Computing Device Access in Doney Park
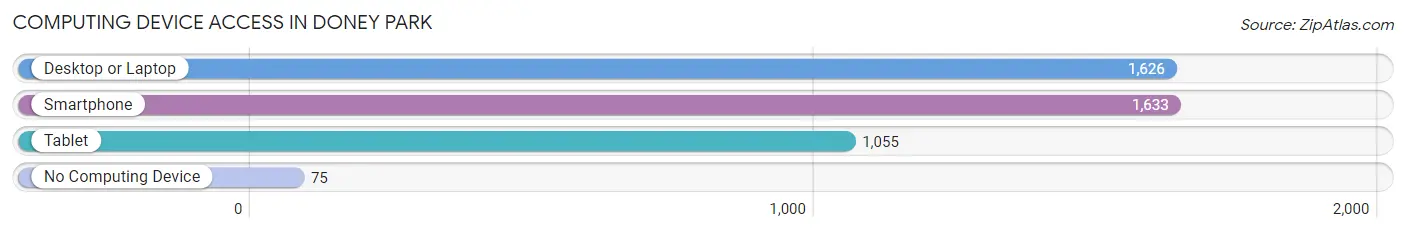
| Device Type | # Households | % Households |
| Desktop or Laptop | 1,626 | 90.0% |
| Smartphone | 1,633 | 90.4% |
| Tablet | 1,055 | 58.4% |
| No Computing Device | 75 | 4.2% |
| Total | 1,807 | 100.0% |
Internet Access in Doney Park
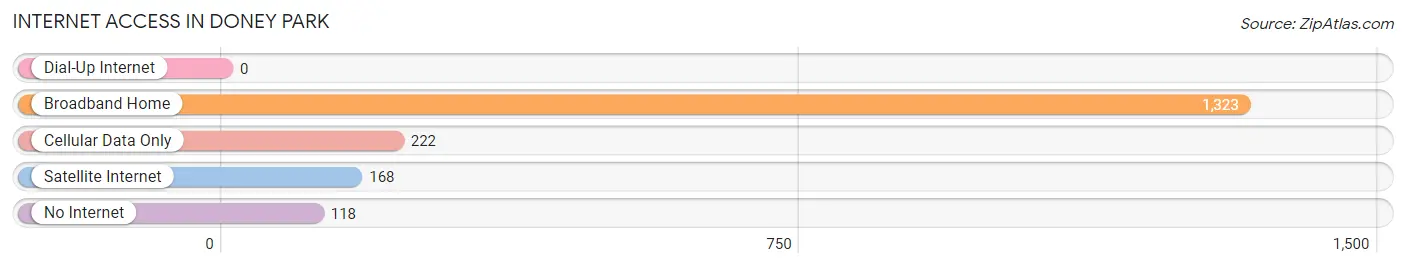
| Internet Type | # Households | % Households |
| Dial-Up Internet | 0 | 0.0% |
| Broadband Home | 1,323 | 73.2% |
| Cellular Data Only | 222 | 12.3% |
| Satellite Internet | 168 | 9.3% |
| No Internet | 118 | 6.5% |
| Total | 1,807 | 100.0% |
Doney Park Summary
Doney Park is an unincorporated community located in Coconino County, Arizona. It is situated in the Coconino National Forest, approximately 10 miles north of Flagstaff. The community is named after the Doney family, who settled in the area in the late 1800s.
History
The Doney family first settled in the area in the late 1800s. The family was originally from Missouri and had moved to Arizona in search of a better life. The family homesteaded in the area and built a small ranch. The ranch was used to raise cattle and horses, and the family also grew crops such as corn and hay.
In the early 1900s, the Doney family began to sell off parcels of their land to other settlers. This led to the development of the community of Doney Park. The community was officially established in the 1920s and was named after the Doney family.
In the 1950s, the community began to grow as more people moved to the area. The population of Doney Park peaked in the 1970s, when it had a population of over 1,000 people. Since then, the population has declined and is now estimated to be around 500 people.
Geography
Doney Park is located in Coconino County, Arizona. It is situated in the Coconino National Forest, approximately 10 miles north of Flagstaff. The community is located at an elevation of 6,500 feet and is surrounded by pine forests and rolling hills.
The climate in Doney Park is semi-arid, with hot summers and cold winters. The average annual temperature is around 50 degrees Fahrenheit. The average annual precipitation is around 15 inches.
Economy
The economy of Doney Park is largely based on tourism. The community is a popular destination for outdoor activities such as camping, hiking, fishing, and hunting. The nearby Coconino National Forest provides a variety of recreational opportunities for visitors.
In addition to tourism, the community also has a few small businesses. These include a general store, a gas station, and a few restaurants.
Demographics
As of the 2010 census, the population of Doney Park was estimated to be around 500 people. The racial makeup of the community is predominantly white (90%), with a small percentage of Native American (5%) and Hispanic (5%) residents.
The median household income in Doney Park is around $50,000. The median home value is around $200,000. The unemployment rate is around 5%.
Conclusion
Doney Park is an unincorporated community located in Coconino County, Arizona. It is situated in the Coconino National Forest, approximately 10 miles north of Flagstaff. The community is named after the Doney family, who settled in the area in the late 1800s. The economy of Doney Park is largely based on tourism, with a few small businesses located in the community. The population of Doney Park is estimated to be around 500 people, with a predominantly white population. The median household income in Doney Park is around $50,000 and the median home value is around $200,000.
Common Questions
What is Per Capita Income in Doney Park?
Per Capita income in Doney Park is $43,794.
What is the Median Family Income in Doney Park?
Median Family Income in Doney Park is $107,108.
What is the Median Household income in Doney Park?
Median Household Income in Doney Park is $90,858.
What is Income or Wage Gap in Doney Park?
Income or Wage Gap in Doney Park is 38.9%.
Women in Doney Park earn 61.1 cents for every dollar earned by a man.
What is Inequality or Gini Index in Doney Park?
Inequality or Gini Index in Doney Park is 0.40.
What is the Total Population of Doney Park?
Total Population of Doney Park is 5,056.
What is the Total Male Population of Doney Park?
Total Male Population of Doney Park is 2,423.
What is the Total Female Population of Doney Park?
Total Female Population of Doney Park is 2,633.
What is the Ratio of Males per 100 Females in Doney Park?
There are 92.02 Males per 100 Females in Doney Park.
What is the Ratio of Females per 100 Males in Doney Park?
There are 108.67 Females per 100 Males in Doney Park.
What is the Median Population Age in Doney Park?
Median Population Age in Doney Park is 44.1 Years.
What is the Average Family Size in Doney Park
Average Family Size in Doney Park is 3.2 People.
What is the Average Household Size in Doney Park
Average Household Size in Doney Park is 2.8 People.
How Large is the Labor Force in Doney Park?
There are 2,520 People in the Labor Forcein in Doney Park.
What is the Percentage of People in the Labor Force in Doney Park?
62.3% of People are in the Labor Force in Doney Park.
What is the Unemployment Rate in Doney Park?
Unemployment Rate in Doney Park is 1.7%.