Vail, AZ Map & Demographics
Vail Map
Vail Overview
$43,646
PER CAPITA INCOME
$130,696
AVG FAMILY INCOME
$120,179
AVG HOUSEHOLD INCOME
45.6%
WAGE / INCOME GAP [ % ]
54.4¢/ $1
WAGE / INCOME GAP [ $ ]
0.32
INEQUALITY / GINI INDEX
15,248
TOTAL POPULATION
8,249
MALE POPULATION
6,999
FEMALE POPULATION
117.86
MALES / 100 FEMALES
84.85
FEMALES / 100 MALES
39.1
MEDIAN AGE
3.2
AVG FAMILY SIZE
2.9
AVG HOUSEHOLD SIZE
7,715
LABOR FORCE [ PEOPLE ]
66.3%
PERCENT IN LABOR FORCE
1.9%
UNEMPLOYMENT RATE
Vail Zip Codes
Vail Area Codes
Income in Vail
Income Overview in Vail
Per Capita Income in Vail is $43,646, while median incomes of families and households are $130,696 and $120,179 respectively.
| Characteristic | Number | Measure |
| Per Capita Income | 15,248 | $43,646 |
| Median Family Income | 4,387 | $130,696 |
| Mean Family Income | 4,387 | $134,500 |
| Median Household Income | 5,221 | $120,179 |
| Mean Household Income | 5,221 | $126,431 |
| Income Deficit | 4,387 | $0 |
| Wage / Income Gap (%) | 15,248 | 45.55% |
| Wage / Income Gap ($) | 15,248 | 54.45¢ per $1 |
| Gini / Inequality Index | 15,248 | 0.32 |
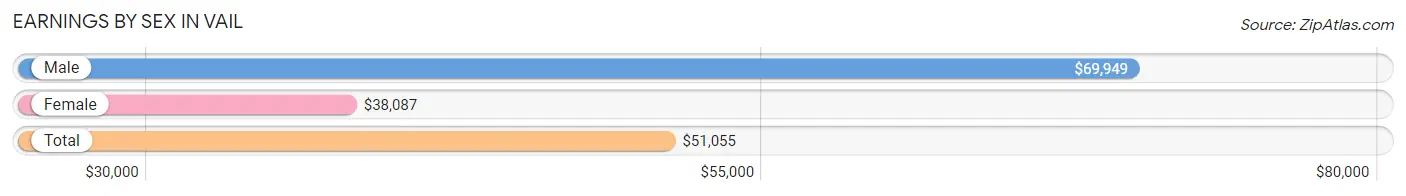
Earnings by Sex in Vail
Average Earnings in Vail are $51,055, $69,949 for men and $38,087 for women, a difference of 45.6%.
| Sex | Number | Average Earnings |
| Male | 4,652 (56.8%) | $69,949 |
| Female | 3,545 (43.2%) | $38,087 |
| Total | 8,197 (100.0%) | $51,055 |
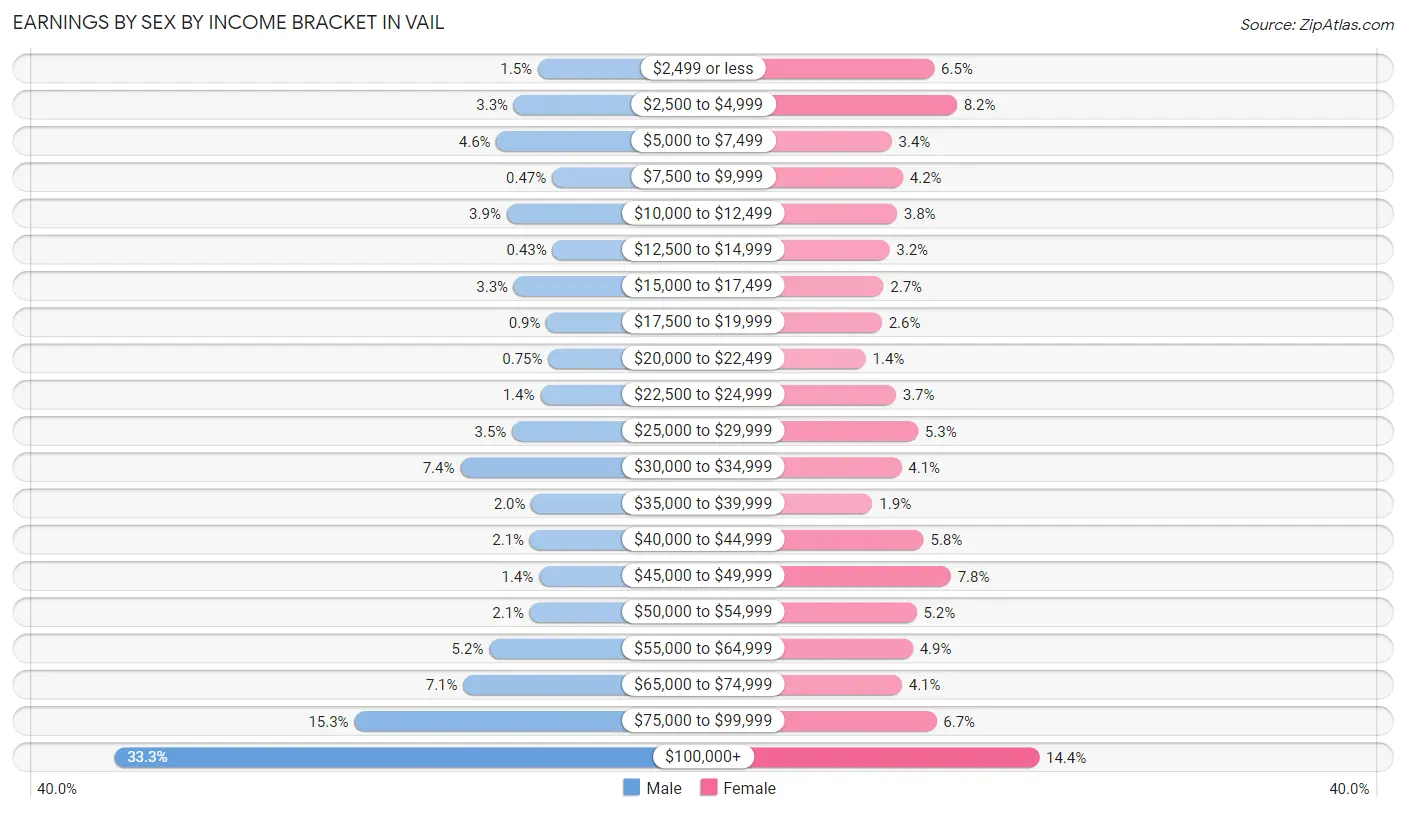
Earnings by Sex by Income Bracket in Vail
The most common earnings brackets in Vail are $100,000+ for men (1,548 | 33.3%) and $100,000+ for women (511 | 14.4%).
| Income | Male | Female |
| $2,499 or less | 71 (1.5%) | 232 (6.5%) |
| $2,500 to $4,999 | 155 (3.3%) | 292 (8.2%) |
| $5,000 to $7,499 | 216 (4.6%) | 119 (3.4%) |
| $7,500 to $9,999 | 22 (0.5%) | 149 (4.2%) |
| $10,000 to $12,499 | 180 (3.9%) | 133 (3.7%) |
| $12,500 to $14,999 | 20 (0.4%) | 113 (3.2%) |
| $15,000 to $17,499 | 155 (3.3%) | 97 (2.7%) |
| $17,500 to $19,999 | 42 (0.9%) | 93 (2.6%) |
| $20,000 to $22,499 | 35 (0.7%) | 50 (1.4%) |
| $22,500 to $24,999 | 63 (1.3%) | 130 (3.7%) |
| $25,000 to $29,999 | 161 (3.5%) | 189 (5.3%) |
| $30,000 to $34,999 | 342 (7.3%) | 145 (4.1%) |
| $35,000 to $39,999 | 94 (2.0%) | 68 (1.9%) |
| $40,000 to $44,999 | 99 (2.1%) | 204 (5.8%) |
| $45,000 to $49,999 | 67 (1.4%) | 276 (7.8%) |
| $50,000 to $54,999 | 99 (2.1%) | 185 (5.2%) |
| $55,000 to $64,999 | 241 (5.2%) | 175 (4.9%) |
| $65,000 to $74,999 | 331 (7.1%) | 146 (4.1%) |
| $75,000 to $99,999 | 711 (15.3%) | 238 (6.7%) |
| $100,000+ | 1,548 (33.3%) | 511 (14.4%) |
| Total | 4,652 (100.0%) | 3,545 (100.0%) |
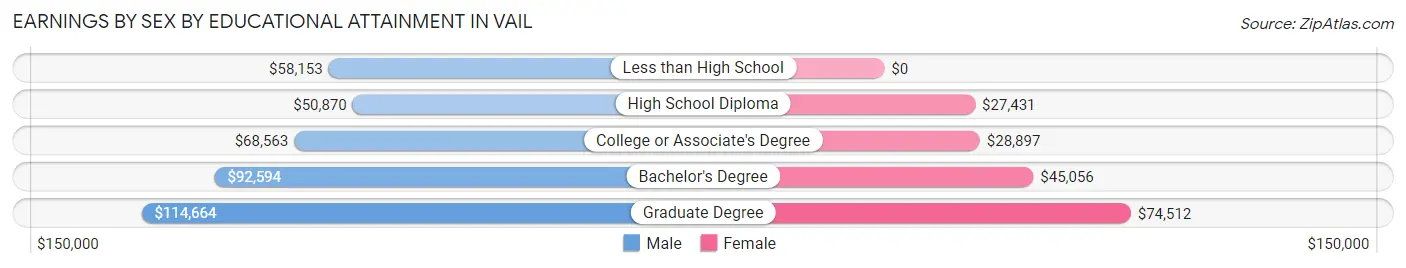
Earnings by Sex by Educational Attainment in Vail
Average earnings in Vail are $79,046 for men and $44,736 for women, a difference of 43.4%. Men with an educational attainment of graduate degree enjoy the highest average annual earnings of $114,664, while those with high school diploma education earn the least with $50,870. Women with an educational attainment of graduate degree earn the most with the average annual earnings of $74,512, while those with high school diploma education have the smallest earnings of $27,431.
| Educational Attainment | Male Income | Female Income |
| Less than High School | $58,153 | $0 |
| High School Diploma | $50,870 | $27,431 |
| College or Associate's Degree | $68,563 | $28,897 |
| Bachelor's Degree | $92,594 | $45,056 |
| Graduate Degree | $114,664 | $74,512 |
| Total | $79,046 | $44,736 |
Family Income in Vail
Family Income Brackets in Vail
According to the Vail family income data, there are 1,189 families falling into the $150,000 to $199,999 income range, which is the most common income bracket and makes up 27.1% of all families. Conversely, the $10,000 to $14,999 income bracket is the least frequent group with only 13 families (0.3%) belonging to this category.
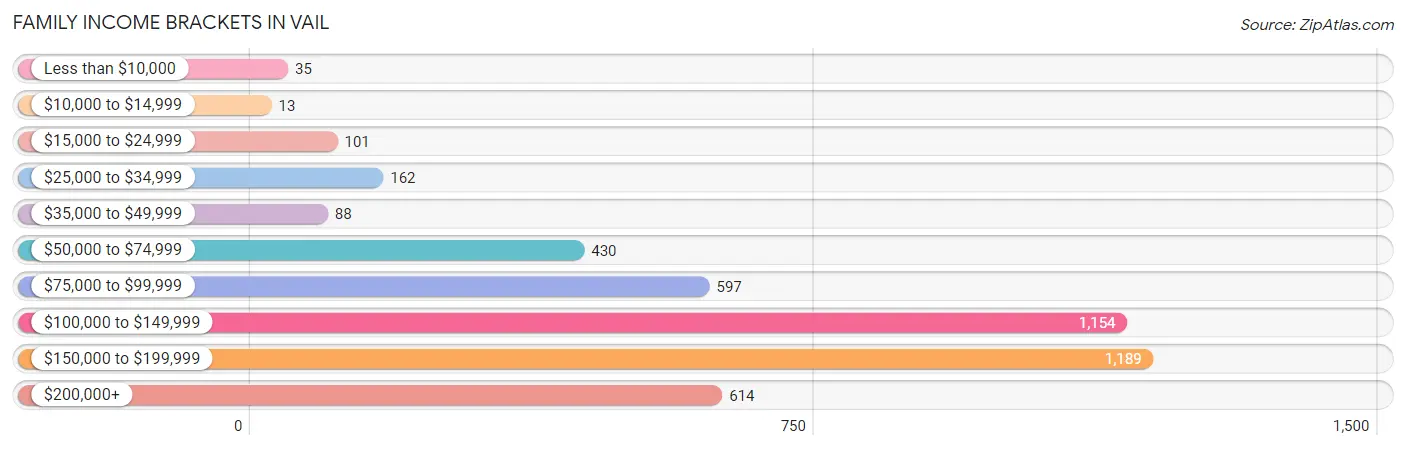
| Income Bracket | # Families | % Families |
| Less than $10,000 | 35 | 0.8% |
| $10,000 to $14,999 | 13 | 0.3% |
| $15,000 to $24,999 | 101 | 2.3% |
| $25,000 to $34,999 | 162 | 3.7% |
| $35,000 to $49,999 | 88 | 2.0% |
| $50,000 to $74,999 | 430 | 9.8% |
| $75,000 to $99,999 | 597 | 13.6% |
| $100,000 to $149,999 | 1,154 | 26.3% |
| $150,000 to $199,999 | 1,189 | 27.1% |
| $200,000+ | 614 | 14.0% |
Family Income by Famaliy Size in Vail
6-person families (188 | 4.3%) account for the highest median family income in Vail with $168,750 per family, while 2-person families (1,808 | 41.2%) have the highest median income of $59,453 per family member.
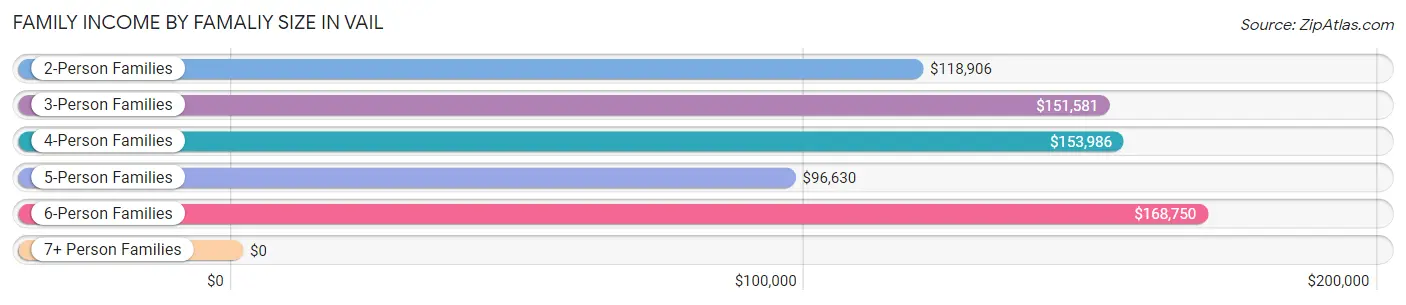
| Income Bracket | # Families | Median Income |
| 2-Person Families | 1,808 (41.2%) | $118,906 |
| 3-Person Families | 872 (19.9%) | $151,581 |
| 4-Person Families | 1,143 (26.1%) | $153,986 |
| 5-Person Families | 307 (7.0%) | $96,630 |
| 6-Person Families | 188 (4.3%) | $168,750 |
| 7+ Person Families | 69 (1.6%) | $0 |
| Total | 4,387 (100.0%) | $130,696 |
Family Income by Number of Earners in Vail
The median family income in Vail is $130,696, with families comprising 3+ earners (512) having the highest median family income of $175,714, while families with no earners (660) have the lowest median family income of $73,775, accounting for 11.7% and 15.0% of families, respectively.
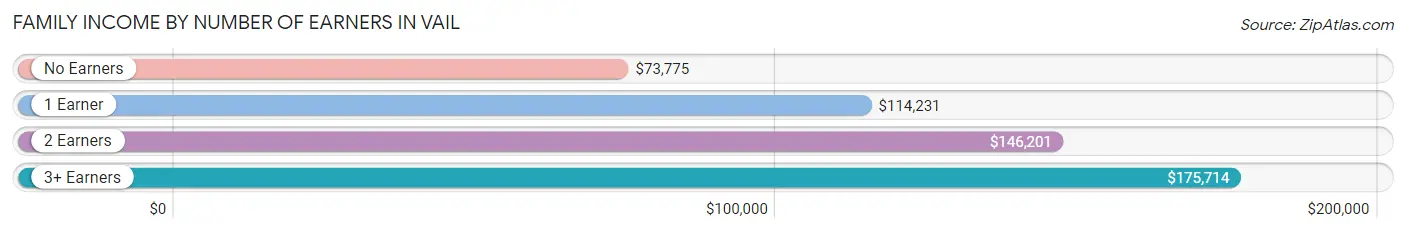
| Number of Earners | # Families | Median Income |
| No Earners | 660 (15.0%) | $73,775 |
| 1 Earner | 920 (21.0%) | $114,231 |
| 2 Earners | 2,295 (52.3%) | $146,201 |
| 3+ Earners | 512 (11.7%) | $175,714 |
| Total | 4,387 (100.0%) | $130,696 |
Household Income in Vail
Household Income Brackets in Vail
With 1,305 households falling in the category, the $150,000 to $199,999 income range is the most frequent in Vail, accounting for 25.0% of all households. In contrast, only 16 households (0.3%) fall into the $10,000 to $14,999 income bracket, making it the least populous group.
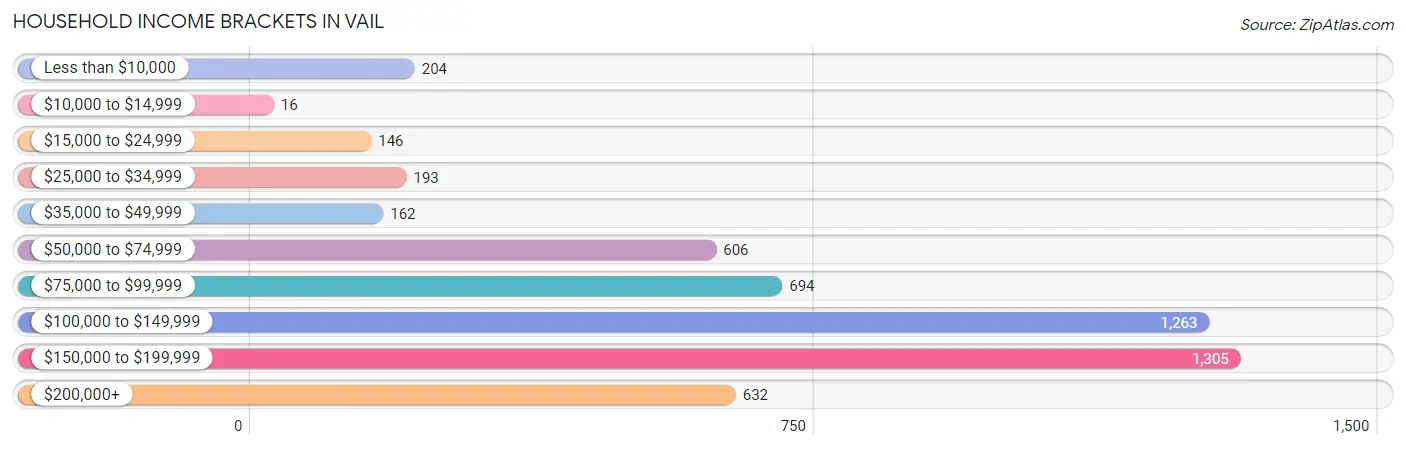
| Income Bracket | # Households | % Households |
| Less than $10,000 | 204 | 3.9% |
| $10,000 to $14,999 | 16 | 0.3% |
| $15,000 to $24,999 | 146 | 2.8% |
| $25,000 to $34,999 | 193 | 3.7% |
| $35,000 to $49,999 | 162 | 3.1% |
| $50,000 to $74,999 | 606 | 11.6% |
| $75,000 to $99,999 | 694 | 13.3% |
| $100,000 to $149,999 | 1,263 | 24.2% |
| $150,000 to $199,999 | 1,305 | 25.0% |
| $200,000+ | 632 | 12.1% |
Household Income by Householder Age in Vail
The median household income in Vail is $120,179, with the highest median household income of $157,587 found in the 45 to 64 years age bracket for the primary householder. A total of 2,243 households (43.0%) fall into this category. Meanwhile, the 15 to 24 years age bracket for the primary householder has the lowest median household income of $0, with 153 households (2.9%) in this group.
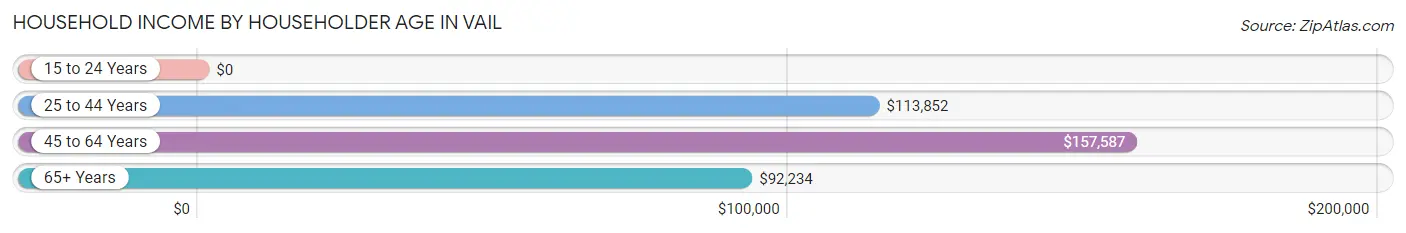
| Income Bracket | # Households | Median Income |
| 15 to 24 Years | 153 (2.9%) | $0 |
| 25 to 44 Years | 1,645 (31.5%) | $113,852 |
| 45 to 64 Years | 2,243 (43.0%) | $157,587 |
| 65+ Years | 1,180 (22.6%) | $92,234 |
| Total | 5,221 (100.0%) | $120,179 |
Poverty in Vail
Income Below Poverty by Sex and Age in Vail
With 5.5% poverty level for males and 4.4% for females among the residents of Vail, 18 to 24 year old males and 5 year old females are the most vulnerable to poverty, with 174 males (23.8%) and 30 females (49.2%) in their respective age groups living below the poverty level.
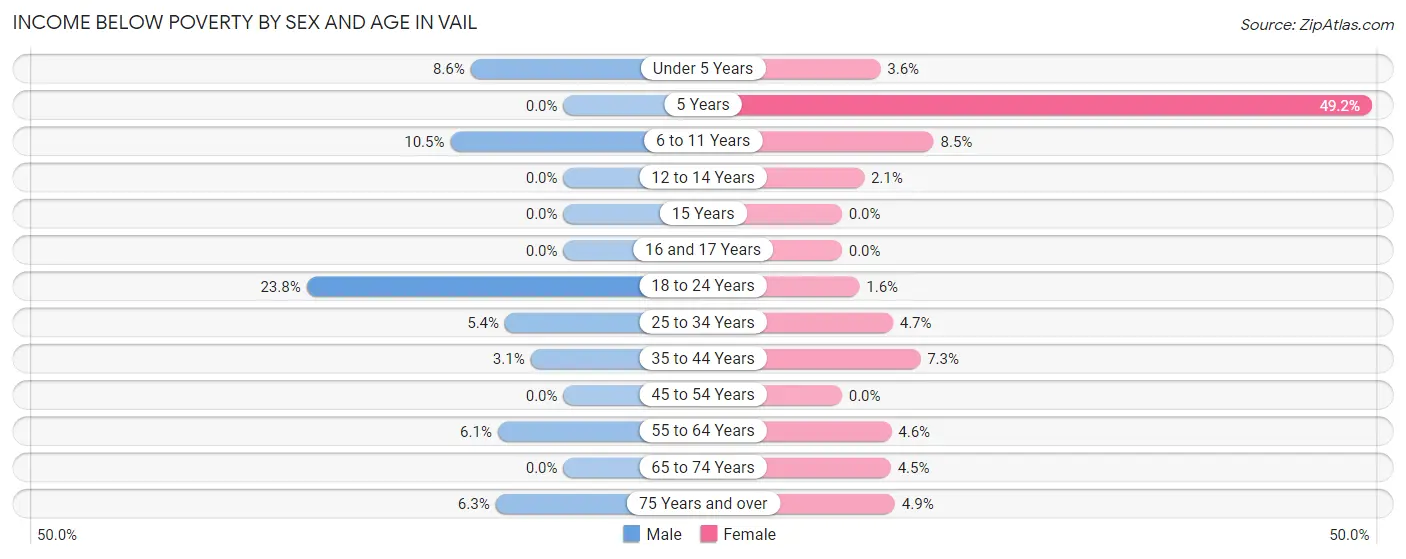
| Age Bracket | Male | Female |
| Under 5 Years | 77 (8.6%) | 17 (3.6%) |
| 5 Years | 0 (0.0%) | 30 (49.2%) |
| 6 to 11 Years | 66 (10.5%) | 53 (8.5%) |
| 12 to 14 Years | 0 (0.0%) | 6 (2.1%) |
| 15 Years | 0 (0.0%) | 0 (0.0%) |
| 16 and 17 Years | 0 (0.0%) | 0 (0.0%) |
| 18 to 24 Years | 174 (23.8%) | 8 (1.6%) |
| 25 to 34 Years | 42 (5.4%) | 33 (4.7%) |
| 35 to 44 Years | 35 (3.0%) | 79 (7.3%) |
| 45 to 54 Years | 0 (0.0%) | 0 (0.0%) |
| 55 to 64 Years | 45 (6.1%) | 37 (4.6%) |
| 65 to 74 Years | 0 (0.0%) | 33 (4.5%) |
| 75 Years and over | 15 (6.3%) | 15 (4.9%) |
| Total | 454 (5.5%) | 311 (4.4%) |
Income Above Poverty by Sex and Age in Vail
According to the poverty statistics in Vail, males aged 5 years and females aged 15 years are the age groups that are most secure financially, with 100.0% of males and 100.0% of females in these age groups living above the poverty line.
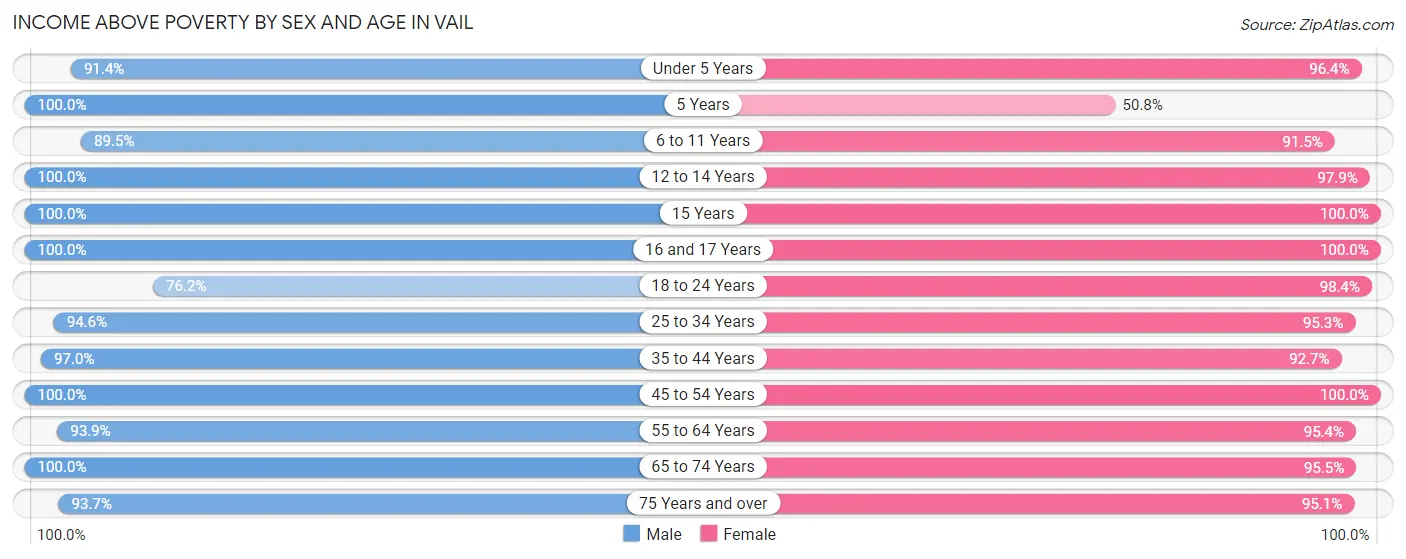
| Age Bracket | Male | Female |
| Under 5 Years | 817 (91.4%) | 458 (96.4%) |
| 5 Years | 217 (100.0%) | 31 (50.8%) |
| 6 to 11 Years | 563 (89.5%) | 569 (91.5%) |
| 12 to 14 Years | 272 (100.0%) | 285 (97.9%) |
| 15 Years | 63 (100.0%) | 87 (100.0%) |
| 16 and 17 Years | 176 (100.0%) | 100 (100.0%) |
| 18 to 24 Years | 556 (76.2%) | 482 (98.4%) |
| 25 to 34 Years | 731 (94.6%) | 664 (95.3%) |
| 35 to 44 Years | 1,111 (97.0%) | 1,006 (92.7%) |
| 45 to 54 Years | 1,543 (100.0%) | 1,255 (100.0%) |
| 55 to 64 Years | 694 (93.9%) | 768 (95.4%) |
| 65 to 74 Years | 829 (100.0%) | 694 (95.5%) |
| 75 Years and over | 223 (93.7%) | 289 (95.1%) |
| Total | 7,795 (94.5%) | 6,688 (95.6%) |
Income Below Poverty Among Married-Couple Families in Vail
The poverty statistics for married-couple families in Vail show that 2.9% or 115 of the total 3,931 families live below the poverty line. Families with 5 or more children have the highest poverty rate of 57.9%, comprising of 33 families. On the other hand, families with 3 or 4 children have the lowest poverty rate of 0.0%, which includes 0 families.
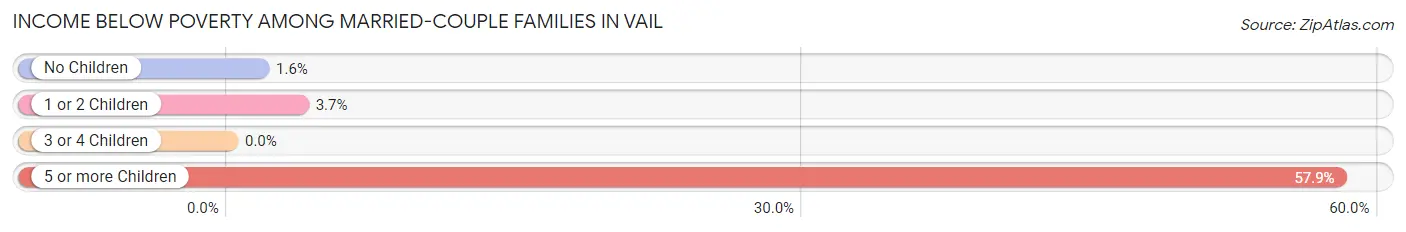
| Children | Above Poverty | Below Poverty |
| No Children | 2,242 (98.4%) | 37 (1.6%) |
| 1 or 2 Children | 1,175 (96.3%) | 45 (3.7%) |
| 3 or 4 Children | 375 (100.0%) | 0 (0.0%) |
| 5 or more Children | 24 (42.1%) | 33 (57.9%) |
| Total | 3,816 (97.1%) | 115 (2.9%) |
Income Below Poverty Among Single-Parent Households in Vail
According to the poverty data in Vail, 19.1% or 35 single-father households and 2.2% or 6 single-mother households are living below the poverty line. Among single-father households, those with 1 or 2 children have the highest poverty rate, with 20 households (23.0%) experiencing poverty. Likewise, among single-mother households, those with 1 or 2 children have the highest poverty rate, with 6 households (8.0%) falling below the poverty line.
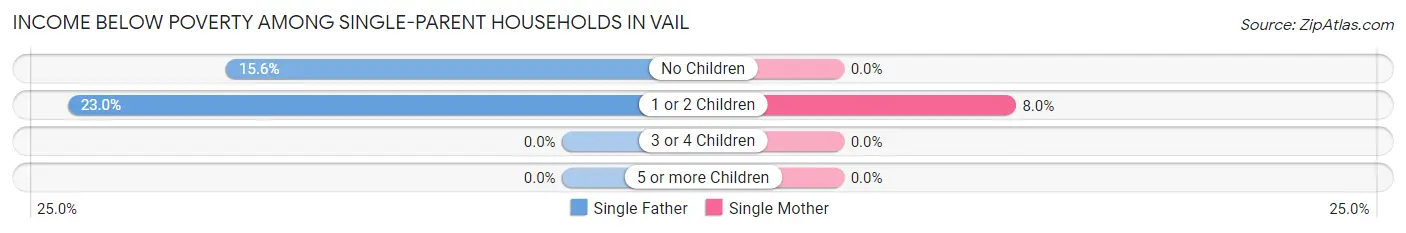
| Children | Single Father | Single Mother |
| No Children | 15 (15.6%) | 0 (0.0%) |
| 1 or 2 Children | 20 (23.0%) | 6 (8.0%) |
| 3 or 4 Children | 0 (0.0%) | 0 (0.0%) |
| 5 or more Children | 0 (0.0%) | 0 (0.0%) |
| Total | 35 (19.1%) | 6 (2.2%) |
Income Below Poverty Among Married-Couple vs Single-Parent Households in Vail
The poverty data for Vail shows that 115 of the married-couple family households (2.9%) and 41 of the single-parent households (9.0%) are living below the poverty level. Within the married-couple family households, those with 5 or more children have the highest poverty rate, with 33 households (57.9%) falling below the poverty line. Among the single-parent households, those with 1 or 2 children have the highest poverty rate, with 26 household (16.1%) living below poverty.
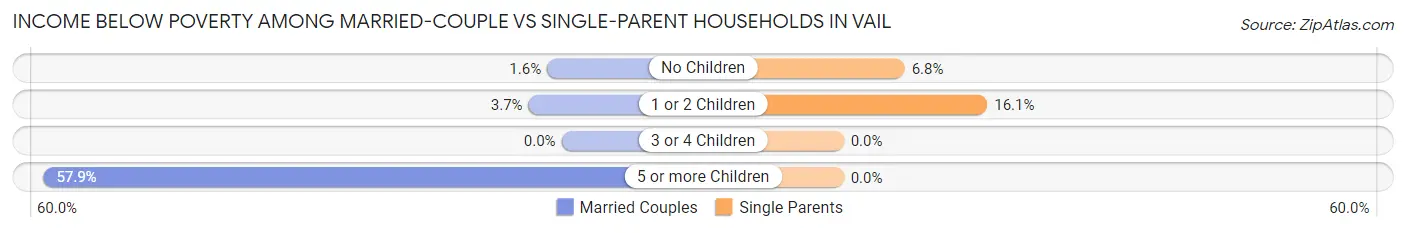
| Children | Married-Couple Families | Single-Parent Households |
| No Children | 37 (1.6%) | 15 (6.8%) |
| 1 or 2 Children | 45 (3.7%) | 26 (16.1%) |
| 3 or 4 Children | 0 (0.0%) | 0 (0.0%) |
| 5 or more Children | 33 (57.9%) | 0 (0.0%) |
| Total | 115 (2.9%) | 41 (9.0%) |
Race in Vail
The most populous races in Vail are White / Caucasian (10,977 | 72.0%), Hispanic or Latino (3,447 | 22.6%), and Two or more Races (2,030 | 13.3%).
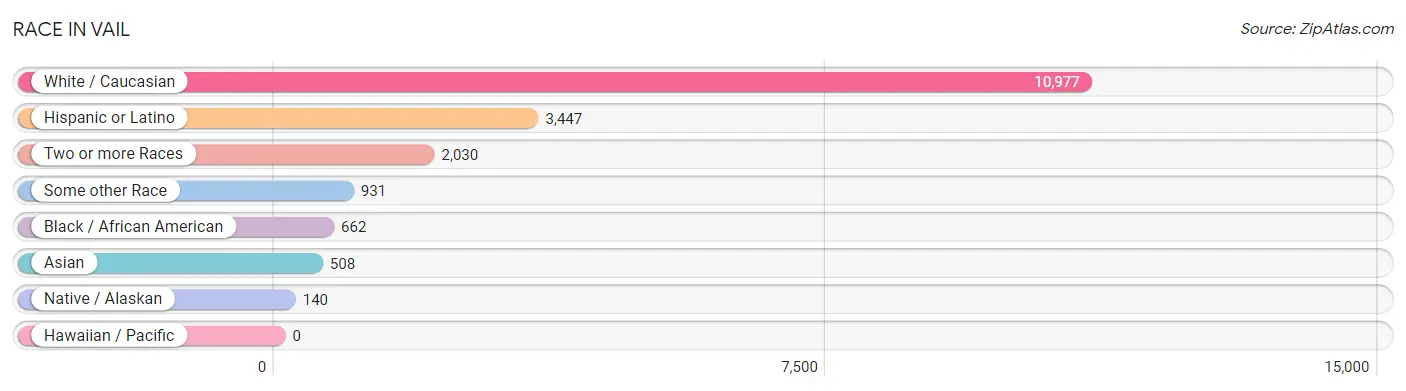
| Race | # Population | % Population |
| Asian | 508 | 3.3% |
| Black / African American | 662 | 4.3% |
| Hawaiian / Pacific | 0 | 0.0% |
| Hispanic or Latino | 3,447 | 22.6% |
| Native / Alaskan | 140 | 0.9% |
| White / Caucasian | 10,977 | 72.0% |
| Two or more Races | 2,030 | 13.3% |
| Some other Race | 931 | 6.1% |
| Total | 15,248 | 100.0% |
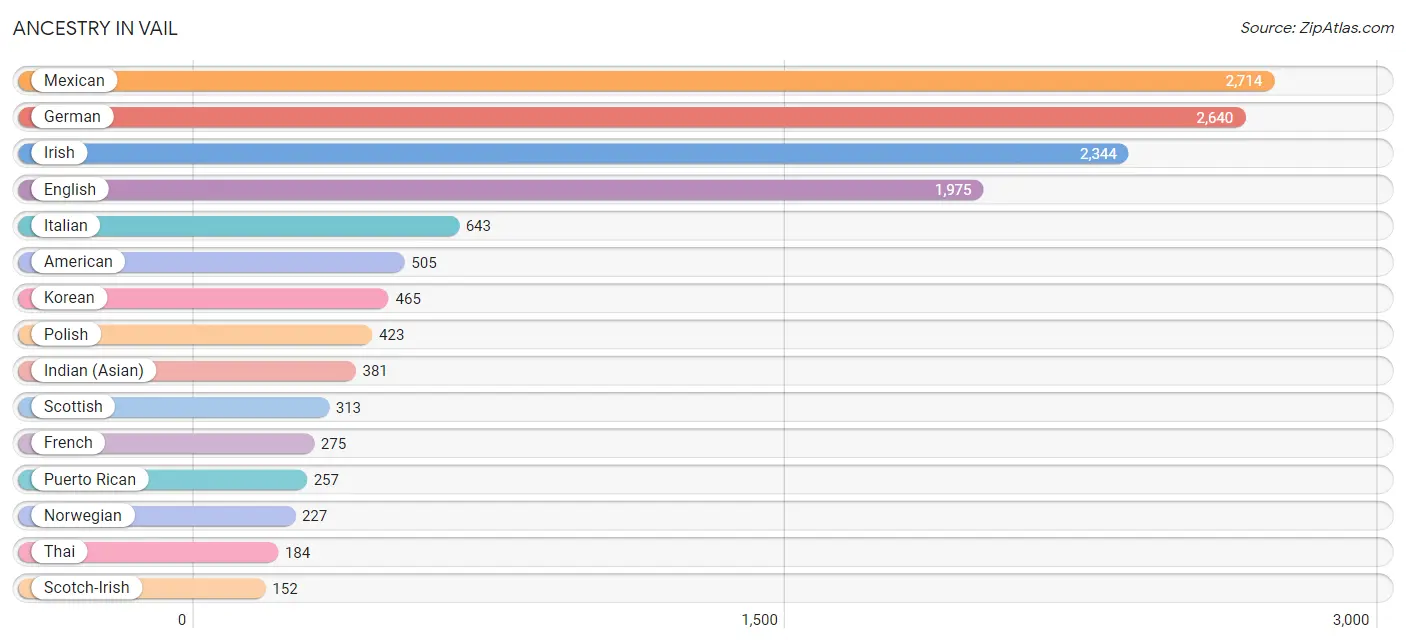
Ancestry in Vail
The most populous ancestries reported in Vail are Mexican (2,714 | 17.8%), German (2,640 | 17.3%), Irish (2,344 | 15.4%), English (1,975 | 13.0%), and Italian (643 | 4.2%), together accounting for 67.6% of all Vail residents.
| Ancestry | # Population | % Population |
| American | 505 | 3.3% |
| Arab | 25 | 0.2% |
| Armenian | 12 | 0.1% |
| Austrian | 108 | 0.7% |
| Basque | 7 | 0.1% |
| Belgian | 14 | 0.1% |
| Bhutanese | 97 | 0.6% |
| Brazilian | 8 | 0.1% |
| British | 69 | 0.4% |
| Burmese | 11 | 0.1% |
| Canadian | 10 | 0.1% |
| Central American | 86 | 0.6% |
| Central American Indian | 12 | 0.1% |
| Cherokee | 16 | 0.1% |
| Chilean | 23 | 0.2% |
| Colombian | 23 | 0.2% |
| Comanche | 1 | 0.0% |
| Creek | 21 | 0.1% |
| Czech | 108 | 0.7% |
| Danish | 45 | 0.3% |
| Dutch | 148 | 1.0% |
| Eastern European | 10 | 0.1% |
| Egyptian | 25 | 0.2% |
| English | 1,975 | 13.0% |
| Ethiopian | 11 | 0.1% |
| European | 135 | 0.9% |
| Finnish | 90 | 0.6% |
| French | 275 | 1.8% |
| French Canadian | 48 | 0.3% |
| German | 2,640 | 17.3% |
| Greek | 42 | 0.3% |
| Honduran | 60 | 0.4% |
| Hungarian | 147 | 1.0% |
| Indian (Asian) | 381 | 2.5% |
| Irish | 2,344 | 15.4% |
| Israeli | 102 | 0.7% |
| Italian | 643 | 4.2% |
| Korean | 465 | 3.0% |
| Mexican | 2,714 | 17.8% |
| Mexican American Indian | 31 | 0.2% |
| Native Hawaiian | 33 | 0.2% |
| Navajo | 13 | 0.1% |
| New Zealander | 38 | 0.3% |
| Nicaraguan | 13 | 0.1% |
| Nigerian | 4 | 0.0% |
| Northern European | 30 | 0.2% |
| Norwegian | 227 | 1.5% |
| Peruvian | 70 | 0.5% |
| Polish | 423 | 2.8% |
| Portuguese | 61 | 0.4% |
| Puerto Rican | 257 | 1.7% |
| Russian | 121 | 0.8% |
| Salvadoran | 13 | 0.1% |
| Scandinavian | 51 | 0.3% |
| Scotch-Irish | 152 | 1.0% |
| Scottish | 313 | 2.1% |
| Serbian | 14 | 0.1% |
| South American | 116 | 0.8% |
| Spaniard | 109 | 0.7% |
| Spanish | 102 | 0.7% |
| Subsaharan African | 15 | 0.1% |
| Swedish | 144 | 0.9% |
| Swiss | 38 | 0.3% |
| Thai | 184 | 1.2% |
| Tohono O'Odham | 64 | 0.4% |
| Welsh | 90 | 0.6% | View All 66 Rows |
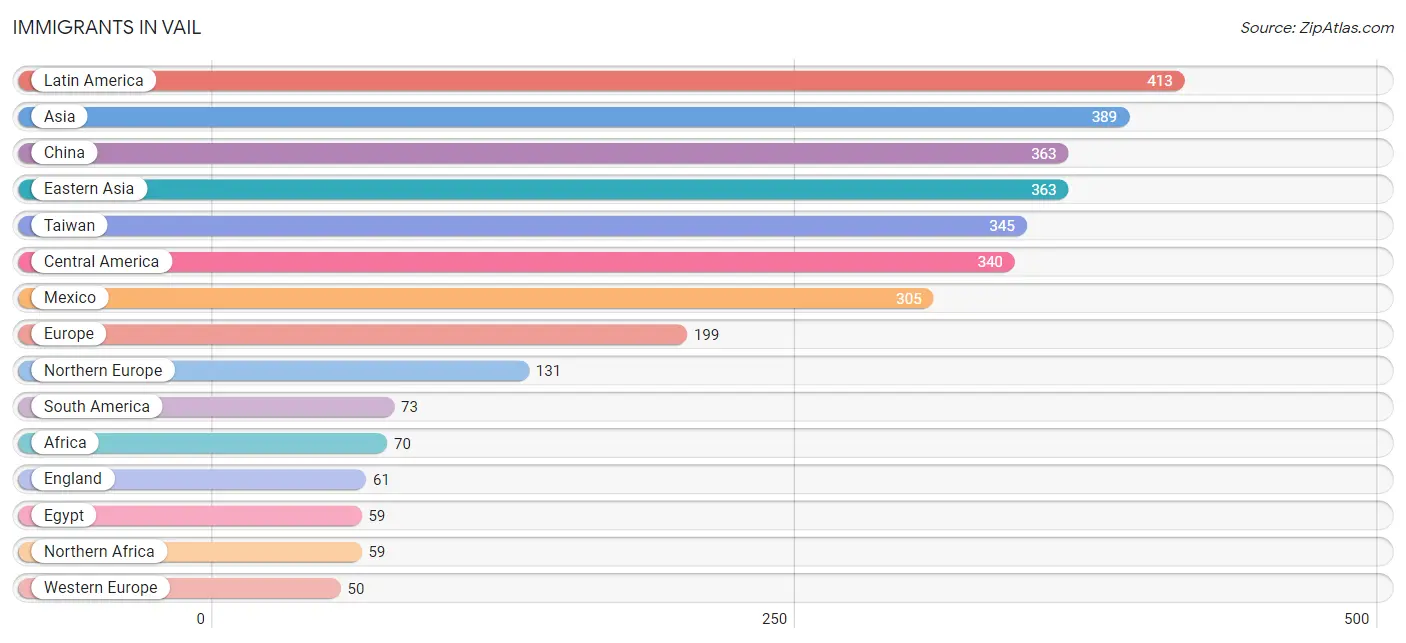
Immigrants in Vail
The most numerous immigrant groups reported in Vail came from Latin America (413 | 2.7%), Asia (389 | 2.5%), China (363 | 2.4%), Eastern Asia (363 | 2.4%), and Taiwan (345 | 2.3%), together accounting for 12.3% of all Vail residents.
| Immigration Origin | # Population | % Population |
| Africa | 70 | 0.5% |
| Asia | 389 | 2.5% |
| Brazil | 8 | 0.1% |
| Canada | 14 | 0.1% |
| Central America | 340 | 2.2% |
| Chile | 23 | 0.2% |
| China | 363 | 2.4% |
| Colombia | 11 | 0.1% |
| Eastern Africa | 11 | 0.1% |
| Eastern Asia | 363 | 2.4% |
| Egypt | 59 | 0.4% |
| England | 61 | 0.4% |
| Ethiopia | 11 | 0.1% |
| Europe | 199 | 1.3% |
| France | 15 | 0.1% |
| Germany | 35 | 0.2% |
| Honduras | 22 | 0.1% |
| Latin America | 413 | 2.7% |
| Mexico | 305 | 2.0% |
| Nicaragua | 13 | 0.1% |
| Northern Africa | 59 | 0.4% |
| Northern Europe | 131 | 0.9% |
| Oceania | 38 | 0.3% |
| Peru | 31 | 0.2% |
| Philippines | 26 | 0.2% |
| South America | 73 | 0.5% |
| South Eastern Asia | 26 | 0.2% |
| Southern Europe | 18 | 0.1% |
| Spain | 18 | 0.1% |
| Taiwan | 345 | 2.3% |
| Western Europe | 50 | 0.3% | View All 31 Rows |
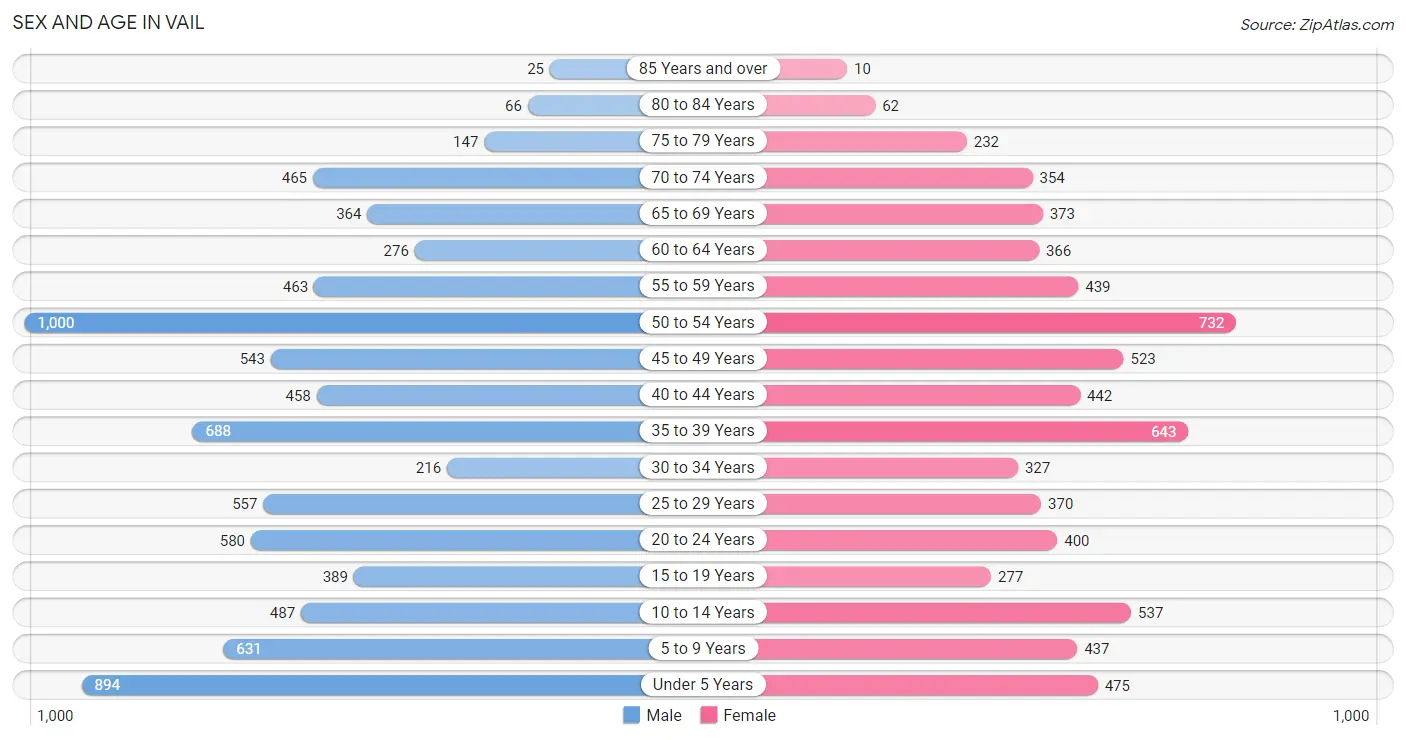
Sex and Age in Vail
Sex and Age in Vail
The most populous age groups in Vail are 50 to 54 Years (1,000 | 12.1%) for men and 50 to 54 Years (732 | 10.5%) for women.
| Age Bracket | Male | Female |
| Under 5 Years | 894 (10.8%) | 475 (6.8%) |
| 5 to 9 Years | 631 (7.6%) | 437 (6.2%) |
| 10 to 14 Years | 487 (5.9%) | 537 (7.7%) |
| 15 to 19 Years | 389 (4.7%) | 277 (4.0%) |
| 20 to 24 Years | 580 (7.0%) | 400 (5.7%) |
| 25 to 29 Years | 557 (6.8%) | 370 (5.3%) |
| 30 to 34 Years | 216 (2.6%) | 327 (4.7%) |
| 35 to 39 Years | 688 (8.3%) | 643 (9.2%) |
| 40 to 44 Years | 458 (5.6%) | 442 (6.3%) |
| 45 to 49 Years | 543 (6.6%) | 523 (7.5%) |
| 50 to 54 Years | 1,000 (12.1%) | 732 (10.5%) |
| 55 to 59 Years | 463 (5.6%) | 439 (6.3%) |
| 60 to 64 Years | 276 (3.4%) | 366 (5.2%) |
| 65 to 69 Years | 364 (4.4%) | 373 (5.3%) |
| 70 to 74 Years | 465 (5.6%) | 354 (5.1%) |
| 75 to 79 Years | 147 (1.8%) | 232 (3.3%) |
| 80 to 84 Years | 66 (0.8%) | 62 (0.9%) |
| 85 Years and over | 25 (0.3%) | 10 (0.1%) |
| Total | 8,249 (100.0%) | 6,999 (100.0%) |
Families and Households in Vail
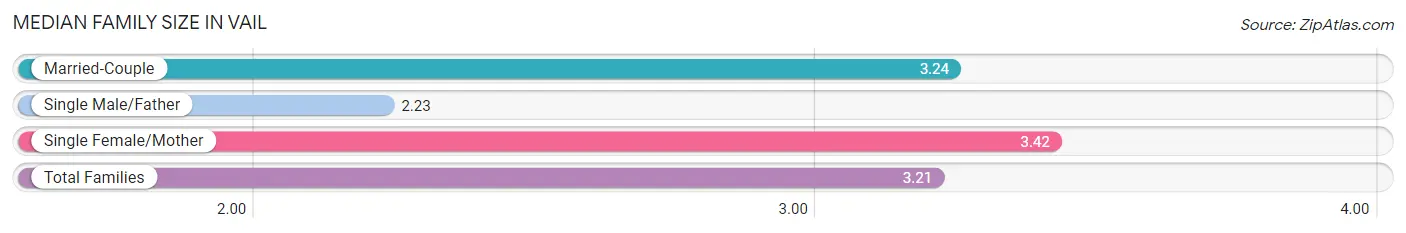
Median Family Size in Vail
The median family size in Vail is 3.21 persons per family, with single female/mother families (273 | 6.2%) accounting for the largest median family size of 3.42 persons per family. On the other hand, single male/father families (183 | 4.2%) represent the smallest median family size with 2.23 persons per family.
| Family Type | # Families | Family Size |
| Married-Couple | 3,931 (89.6%) | 3.24 |
| Single Male/Father | 183 (4.2%) | 2.23 |
| Single Female/Mother | 273 (6.2%) | 3.42 |
| Total Families | 4,387 (100.0%) | 3.21 |
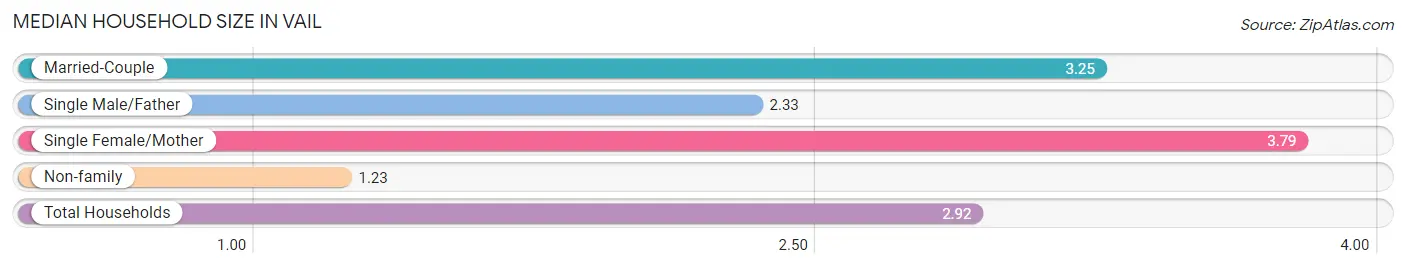
Median Household Size in Vail
The median household size in Vail is 2.92 persons per household, with single female/mother households (273 | 5.2%) accounting for the largest median household size of 3.79 persons per household. non-family households (834 | 16.0%) represent the smallest median household size with 1.23 persons per household.
| Household Type | # Households | Household Size |
| Married-Couple | 3,931 (75.3%) | 3.25 |
| Single Male/Father | 183 (3.5%) | 2.33 |
| Single Female/Mother | 273 (5.2%) | 3.79 |
| Non-family | 834 (16.0%) | 1.23 |
| Total Households | 5,221 (100.0%) | 2.92 |
Household Size by Marriage Status in Vail
Out of a total of 5,221 households in Vail, 4,387 (84.0%) are family households, while 834 (16.0%) are nonfamily households. The most numerous type of family households are 2-person households, comprising 1,781, and the most common type of nonfamily households are 1-person households, comprising 630.
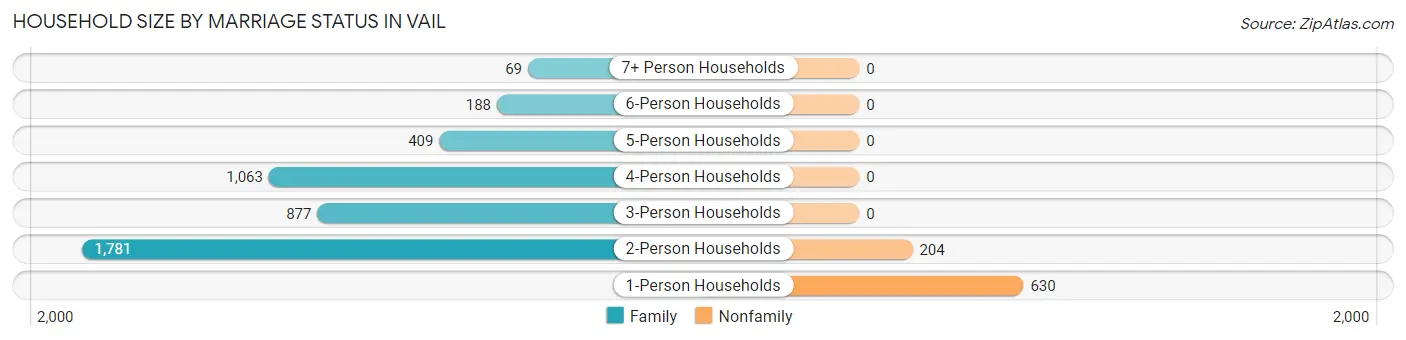
| Household Size | Family Households | Nonfamily Households |
| 1-Person Households | - | 630 (12.1%) |
| 2-Person Households | 1,781 (34.1%) | 204 (3.9%) |
| 3-Person Households | 877 (16.8%) | 0 (0.0%) |
| 4-Person Households | 1,063 (20.4%) | 0 (0.0%) |
| 5-Person Households | 409 (7.8%) | 0 (0.0%) |
| 6-Person Households | 188 (3.6%) | 0 (0.0%) |
| 7+ Person Households | 69 (1.3%) | 0 (0.0%) |
| Total | 4,387 (84.0%) | 834 (16.0%) |
Female Fertility in Vail
Fertility by Age in Vail
Average fertility rate in Vail is 58.0 births per 1,000 women. Women in the age bracket of 20 to 34 years have the highest fertility rate with 125.0 births per 1,000 women. Women in the age bracket of 20 to 34 years acount for 74.9% of all women with births.
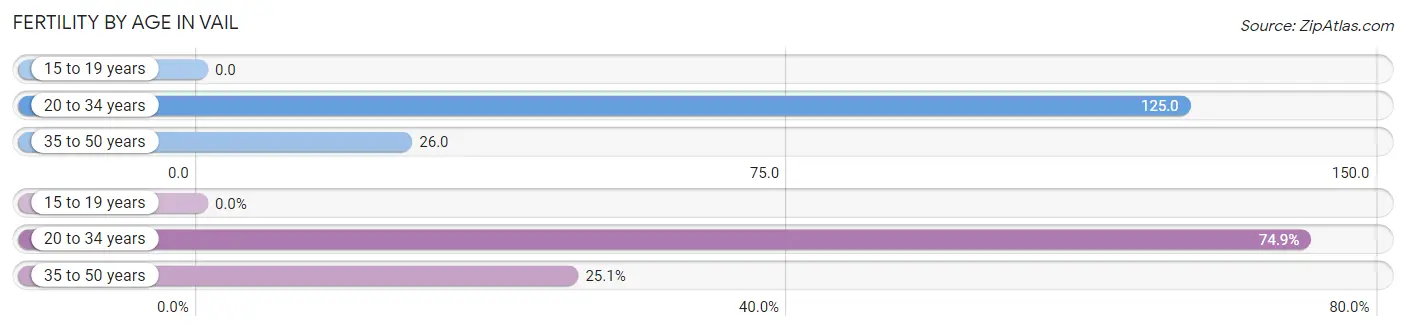
| Age Bracket | Women with Births | Births / 1,000 Women |
| 15 to 19 years | 0 (0.0%) | 0.0 |
| 20 to 34 years | 137 (74.9%) | 125.0 |
| 35 to 50 years | 46 (25.1%) | 26.0 |
| Total | 183 (100.0%) | 58.0 |
Fertility by Age by Marriage Status in Vail
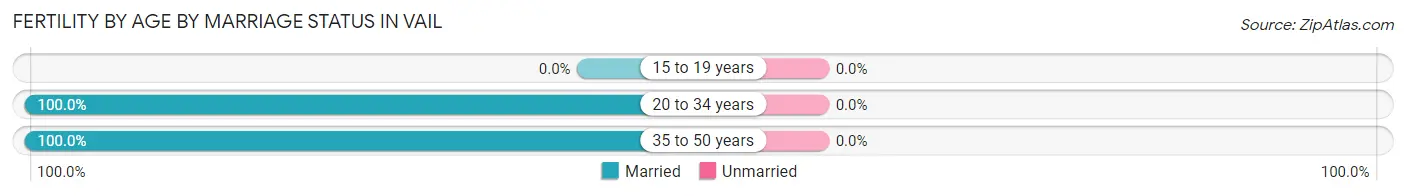
| Age Bracket | Married | Unmarried |
| 15 to 19 years | 0 (0.0%) | 0 (0.0%) |
| 20 to 34 years | 137 (100.0%) | 0 (0.0%) |
| 35 to 50 years | 46 (100.0%) | 0 (0.0%) |
| Total | 183 (100.0%) | 0 (0.0%) |
Fertility by Education in Vail
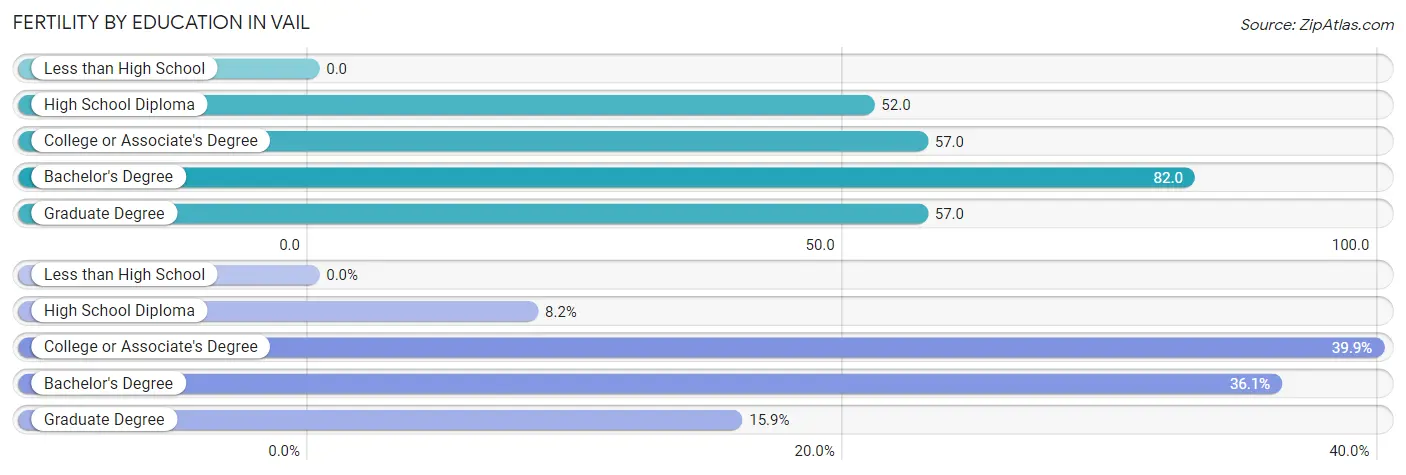
| Educational Attainment | Women with Births | Births / 1,000 Women |
| Less than High School | 0 (0.0%) | 0.0 |
| High School Diploma | 15 (8.2%) | 52.0 |
| College or Associate's Degree | 73 (39.9%) | 57.0 |
| Bachelor's Degree | 66 (36.1%) | 82.0 |
| Graduate Degree | 29 (15.9%) | 57.0 |
| Total | 183 (100.0%) | 58.0 |
Fertility by Education by Marriage Status in Vail
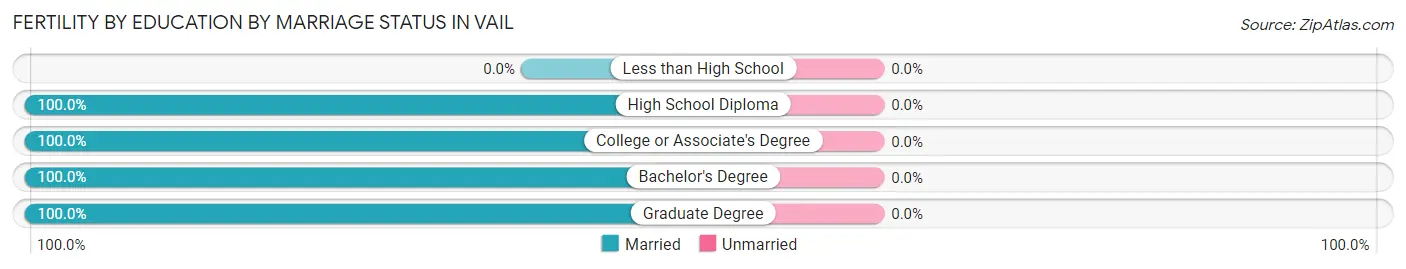
| Educational Attainment | Married | Unmarried |
| Less than High School | 0 (0.0%) | 0 (0.0%) |
| High School Diploma | 15 (100.0%) | 0 (0.0%) |
| College or Associate's Degree | 73 (100.0%) | 0 (0.0%) |
| Bachelor's Degree | 66 (100.0%) | 0 (0.0%) |
| Graduate Degree | 29 (100.0%) | 0 (0.0%) |
| Total | 183 (100.0%) | 0 (0.0%) |
Employment Characteristics in Vail
Employment by Class of Employer in Vail
Among the 7,472 employed individuals in Vail, private company employees (4,676 | 62.6%), federal government employees (813 | 10.9%), and local government employees (562 | 7.5%) make up the most common classes of employment.
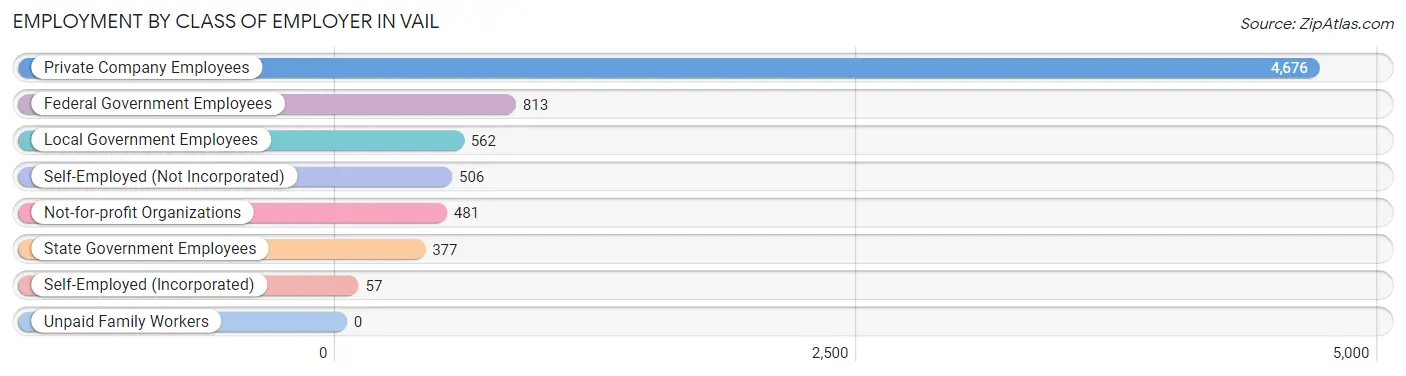
| Employer Class | # Employees | % Employees |
| Private Company Employees | 4,676 | 62.6% |
| Self-Employed (Incorporated) | 57 | 0.8% |
| Self-Employed (Not Incorporated) | 506 | 6.8% |
| Not-for-profit Organizations | 481 | 6.4% |
| Local Government Employees | 562 | 7.5% |
| State Government Employees | 377 | 5.1% |
| Federal Government Employees | 813 | 10.9% |
| Unpaid Family Workers | 0 | 0.0% |
| Total | 7,472 | 100.0% |
Employment Status by Age in Vail
According to the labor force statistics for Vail, out of the total population over 16 years of age (11,637), 66.3% or 7,715 individuals are in the labor force, with 1.9% or 147 of them unemployed. The age group with the highest labor force participation rate is 35 to 44 years, with 90.0% or 2,008 individuals in the labor force. Within the labor force, the 16 to 19 years age range has the highest percentage of unemployed individuals, with 9.3% or 10 of them being unemployed.
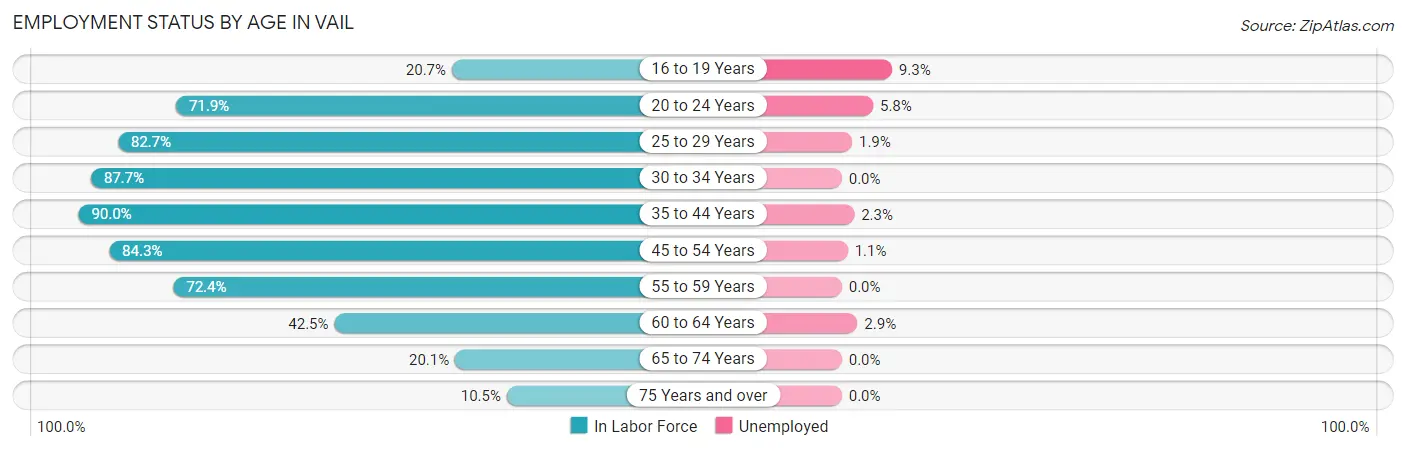
| Age Bracket | In Labor Force | Unemployed |
| 16 to 19 Years | 107 (20.7%) | 10 (9.3%) |
| 20 to 24 Years | 705 (71.9%) | 41 (5.8%) |
| 25 to 29 Years | 767 (82.7%) | 15 (1.9%) |
| 30 to 34 Years | 476 (87.7%) | 0 (0.0%) |
| 35 to 44 Years | 2,008 (90.0%) | 46 (2.3%) |
| 45 to 54 Years | 2,359 (84.3%) | 26 (1.1%) |
| 55 to 59 Years | 653 (72.4%) | 0 (0.0%) |
| 60 to 64 Years | 273 (42.5%) | 8 (2.9%) |
| 65 to 74 Years | 313 (20.1%) | 0 (0.0%) |
| 75 Years and over | 57 (10.5%) | 0 (0.0%) |
| Total | 7,715 (66.3%) | 147 (1.9%) |
Employment Status by Educational Attainment in Vail
According to labor force statistics for Vail, 81.3% of individuals (6,539) out of the total population between 25 and 64 years of age (8,043) are in the labor force, with 1.5% or 98 of them being unemployed. The group with the highest labor force participation rate are those with the educational attainment of bachelor's degree or higher, with 87.8% or 2,997 individuals in the labor force. Within the labor force, individuals with less than high school education have the highest percentage of unemployment, with 31.4% or 44 of them being unemployed.
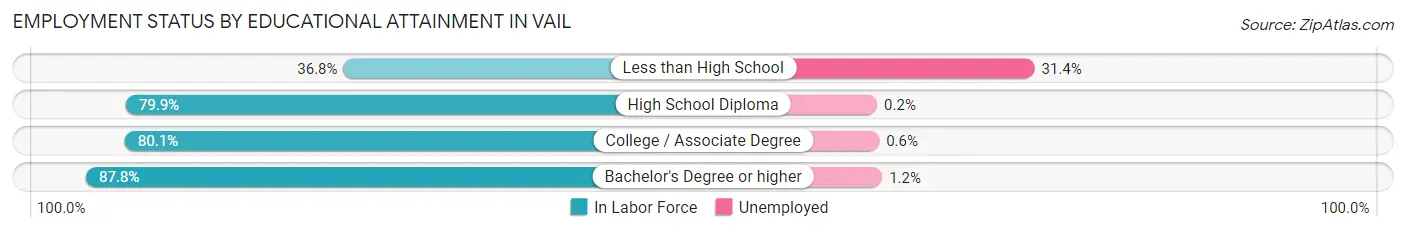
| Educational Attainment | In Labor Force | Unemployed |
| Less than High School | 140 (36.8%) | 119 (31.4%) |
| High School Diploma | 869 (79.9%) | 2 (0.2%) |
| College / Associate Degree | 2,532 (80.1%) | 19 (0.6%) |
| Bachelor's Degree or higher | 2,997 (87.8%) | 41 (1.2%) |
| Total | 6,539 (81.3%) | 121 (1.5%) |
Employment Occupations by Sex in Vail
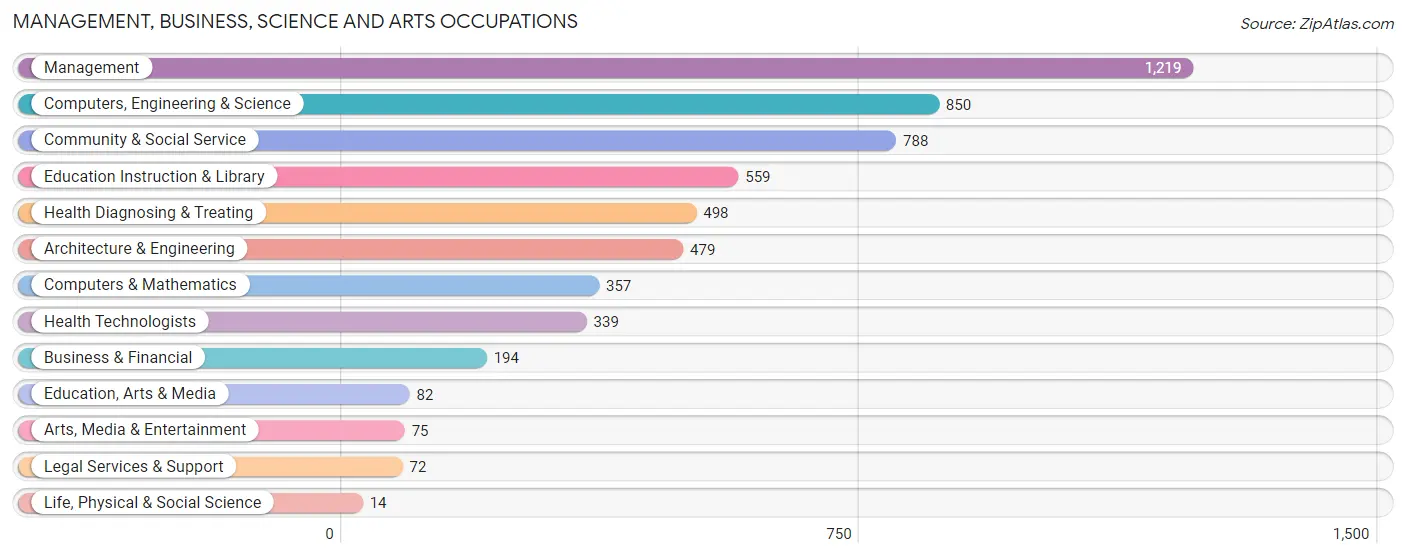
Management, Business, Science and Arts Occupations
The most common Management, Business, Science and Arts occupations in Vail are Management (1,219 | 16.3%), Computers, Engineering & Science (850 | 11.4%), Community & Social Service (788 | 10.6%), Education Instruction & Library (559 | 7.5%), and Health Diagnosing & Treating (498 | 6.7%).
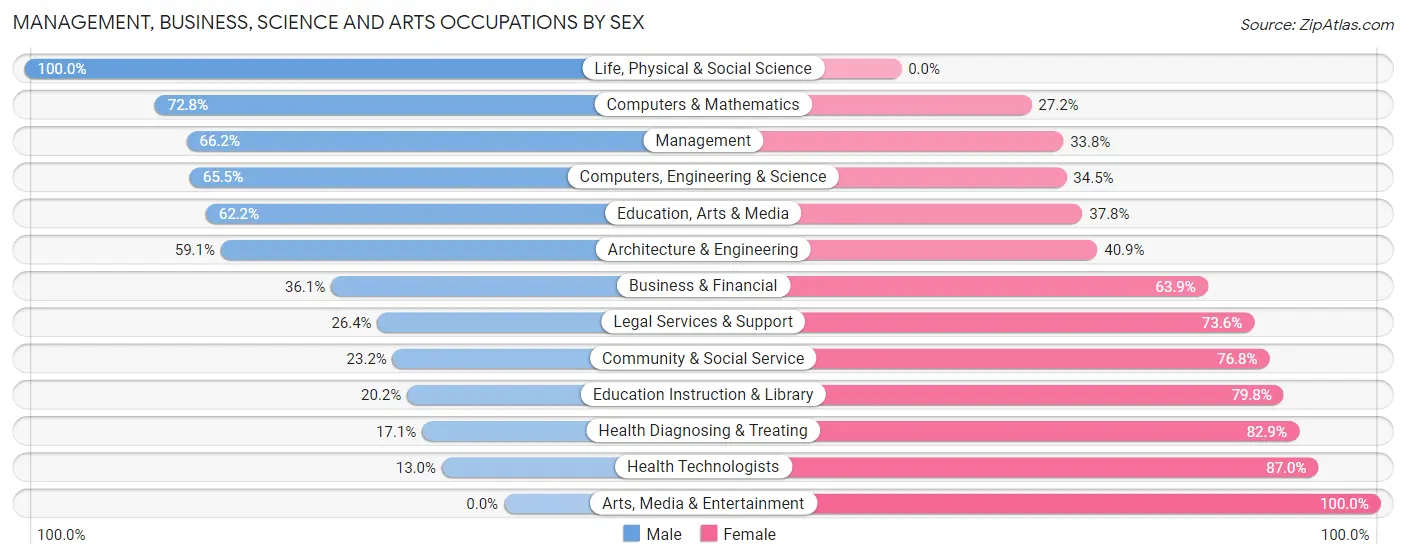
Management, Business, Science and Arts Occupations by Sex
Within the Management, Business, Science and Arts occupations in Vail, the most male-oriented occupations are Life, Physical & Social Science (100.0%), Computers & Mathematics (72.8%), and Management (66.2%), while the most female-oriented occupations are Arts, Media & Entertainment (100.0%), Health Technologists (87.0%), and Health Diagnosing & Treating (82.9%).
| Occupation | Male | Female |
| Management | 807 (66.2%) | 412 (33.8%) |
| Business & Financial | 70 (36.1%) | 124 (63.9%) |
| Computers, Engineering & Science | 557 (65.5%) | 293 (34.5%) |
| Computers & Mathematics | 260 (72.8%) | 97 (27.2%) |
| Architecture & Engineering | 283 (59.1%) | 196 (40.9%) |
| Life, Physical & Social Science | 14 (100.0%) | 0 (0.0%) |
| Community & Social Service | 183 (23.2%) | 605 (76.8%) |
| Education, Arts & Media | 51 (62.2%) | 31 (37.8%) |
| Legal Services & Support | 19 (26.4%) | 53 (73.6%) |
| Education Instruction & Library | 113 (20.2%) | 446 (79.8%) |
| Arts, Media & Entertainment | 0 (0.0%) | 75 (100.0%) |
| Health Diagnosing & Treating | 85 (17.1%) | 413 (82.9%) |
| Health Technologists | 44 (13.0%) | 295 (87.0%) |
| Total (Category) | 1,702 (48.0%) | 1,847 (52.0%) |
| Total (Overall) | 4,184 (56.1%) | 3,278 (43.9%) |
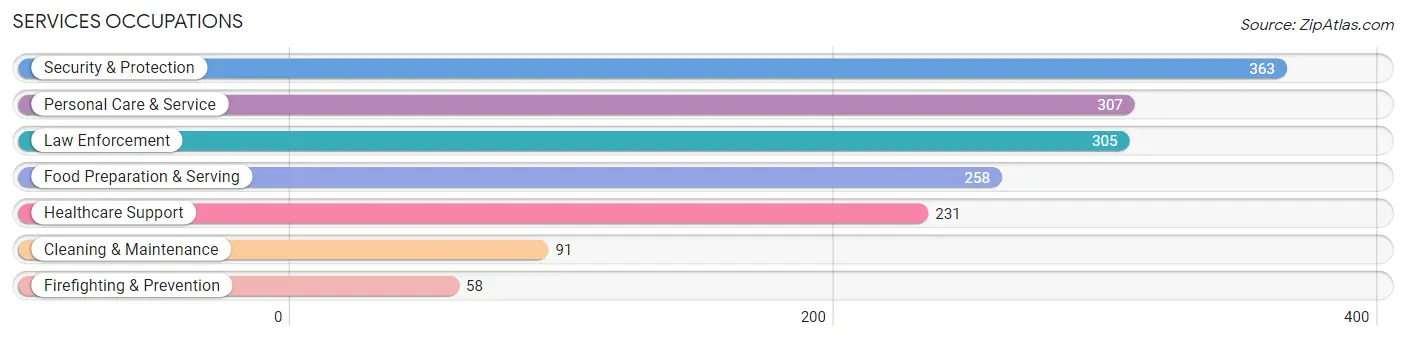
Services Occupations
The most common Services occupations in Vail are Security & Protection (363 | 4.9%), Personal Care & Service (307 | 4.1%), Law Enforcement (305 | 4.1%), Food Preparation & Serving (258 | 3.5%), and Healthcare Support (231 | 3.1%).
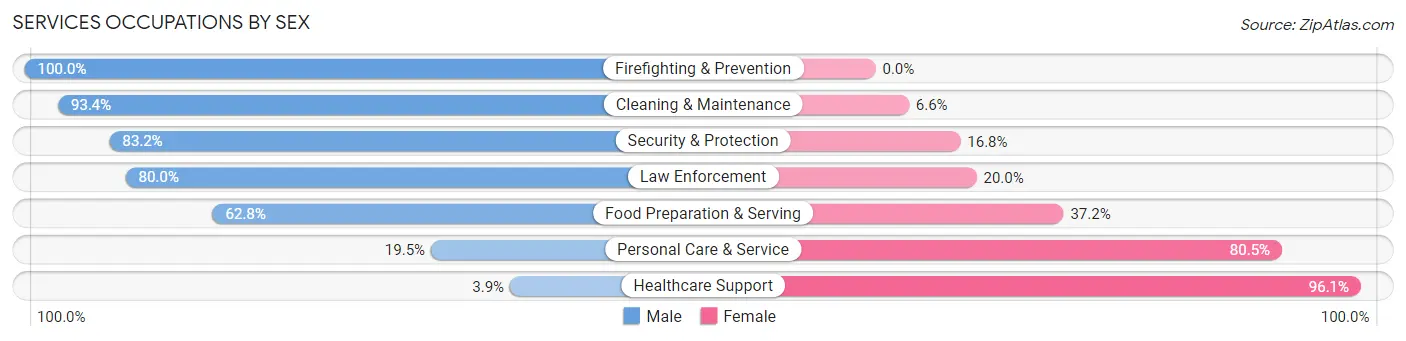
Services Occupations by Sex
Within the Services occupations in Vail, the most male-oriented occupations are Firefighting & Prevention (100.0%), Cleaning & Maintenance (93.4%), and Security & Protection (83.2%), while the most female-oriented occupations are Healthcare Support (96.1%), Personal Care & Service (80.5%), and Food Preparation & Serving (37.2%).
| Occupation | Male | Female |
| Healthcare Support | 9 (3.9%) | 222 (96.1%) |
| Security & Protection | 302 (83.2%) | 61 (16.8%) |
| Firefighting & Prevention | 58 (100.0%) | 0 (0.0%) |
| Law Enforcement | 244 (80.0%) | 61 (20.0%) |
| Food Preparation & Serving | 162 (62.8%) | 96 (37.2%) |
| Cleaning & Maintenance | 85 (93.4%) | 6 (6.6%) |
| Personal Care & Service | 60 (19.5%) | 247 (80.5%) |
| Total (Category) | 618 (49.4%) | 632 (50.6%) |
| Total (Overall) | 4,184 (56.1%) | 3,278 (43.9%) |
Sales and Office Occupations
The most common Sales and Office occupations in Vail are Office & Administration (848 | 11.4%), and Sales & Related (475 | 6.4%).
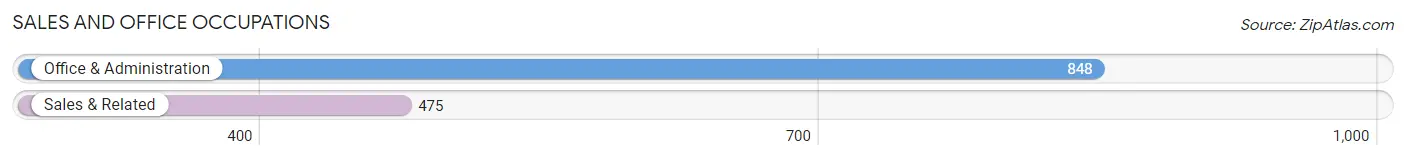
Sales and Office Occupations by Sex
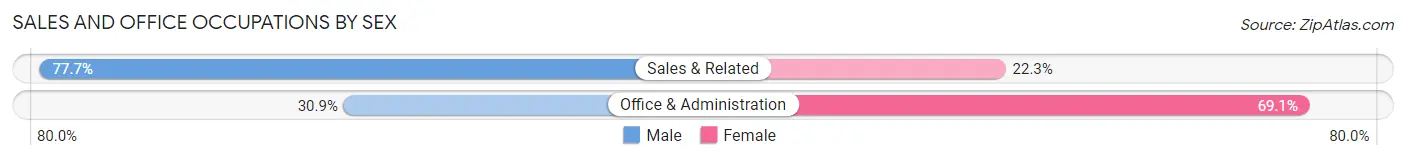
| Occupation | Male | Female |
| Sales & Related | 369 (77.7%) | 106 (22.3%) |
| Office & Administration | 262 (30.9%) | 586 (69.1%) |
| Total (Category) | 631 (47.7%) | 692 (52.3%) |
| Total (Overall) | 4,184 (56.1%) | 3,278 (43.9%) |
Natural Resources, Construction and Maintenance Occupations
The most common Natural Resources, Construction and Maintenance occupations in Vail are Installation, Maintenance & Repair (357 | 4.8%), Construction & Extraction (214 | 2.9%), and Farming, Fishing & Forestry (18 | 0.2%).
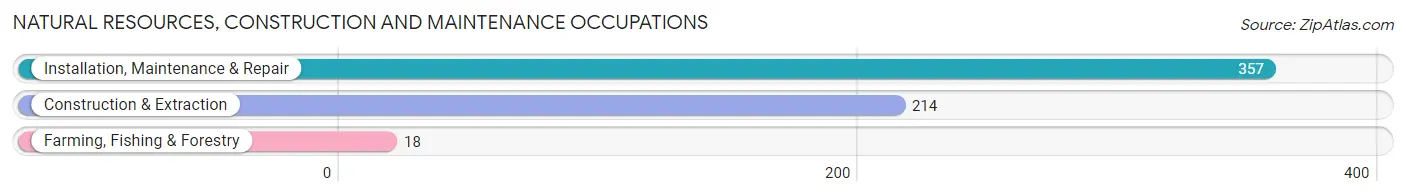
Natural Resources, Construction and Maintenance Occupations by Sex
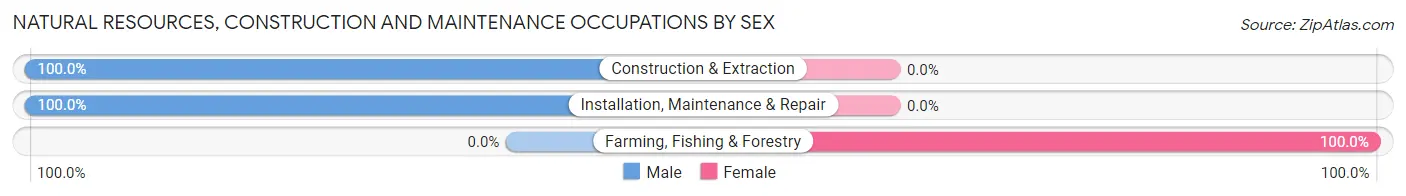
| Occupation | Male | Female |
| Farming, Fishing & Forestry | 0 (0.0%) | 18 (100.0%) |
| Construction & Extraction | 214 (100.0%) | 0 (0.0%) |
| Installation, Maintenance & Repair | 357 (100.0%) | 0 (0.0%) |
| Total (Category) | 571 (96.9%) | 18 (3.1%) |
| Total (Overall) | 4,184 (56.1%) | 3,278 (43.9%) |
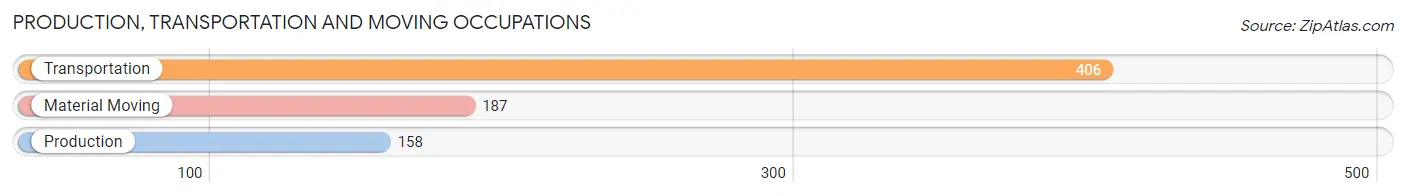
Production, Transportation and Moving Occupations
The most common Production, Transportation and Moving occupations in Vail are Transportation (406 | 5.4%), Material Moving (187 | 2.5%), and Production (158 | 2.1%).
Production, Transportation and Moving Occupations by Sex
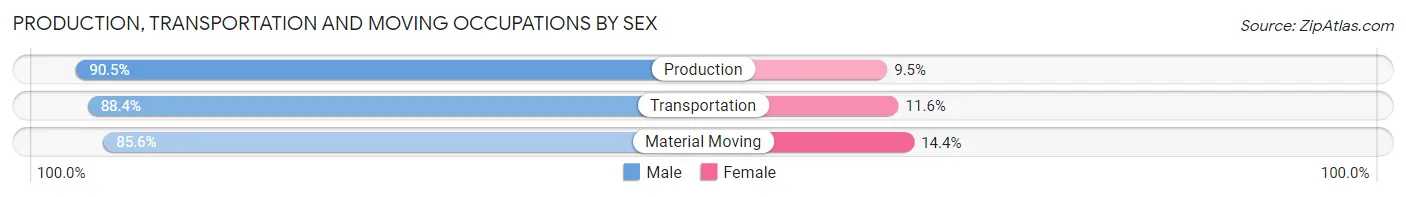
| Occupation | Male | Female |
| Production | 143 (90.5%) | 15 (9.5%) |
| Transportation | 359 (88.4%) | 47 (11.6%) |
| Material Moving | 160 (85.6%) | 27 (14.4%) |
| Total (Category) | 662 (88.1%) | 89 (11.8%) |
| Total (Overall) | 4,184 (56.1%) | 3,278 (43.9%) |
Employment Industries by Sex in Vail
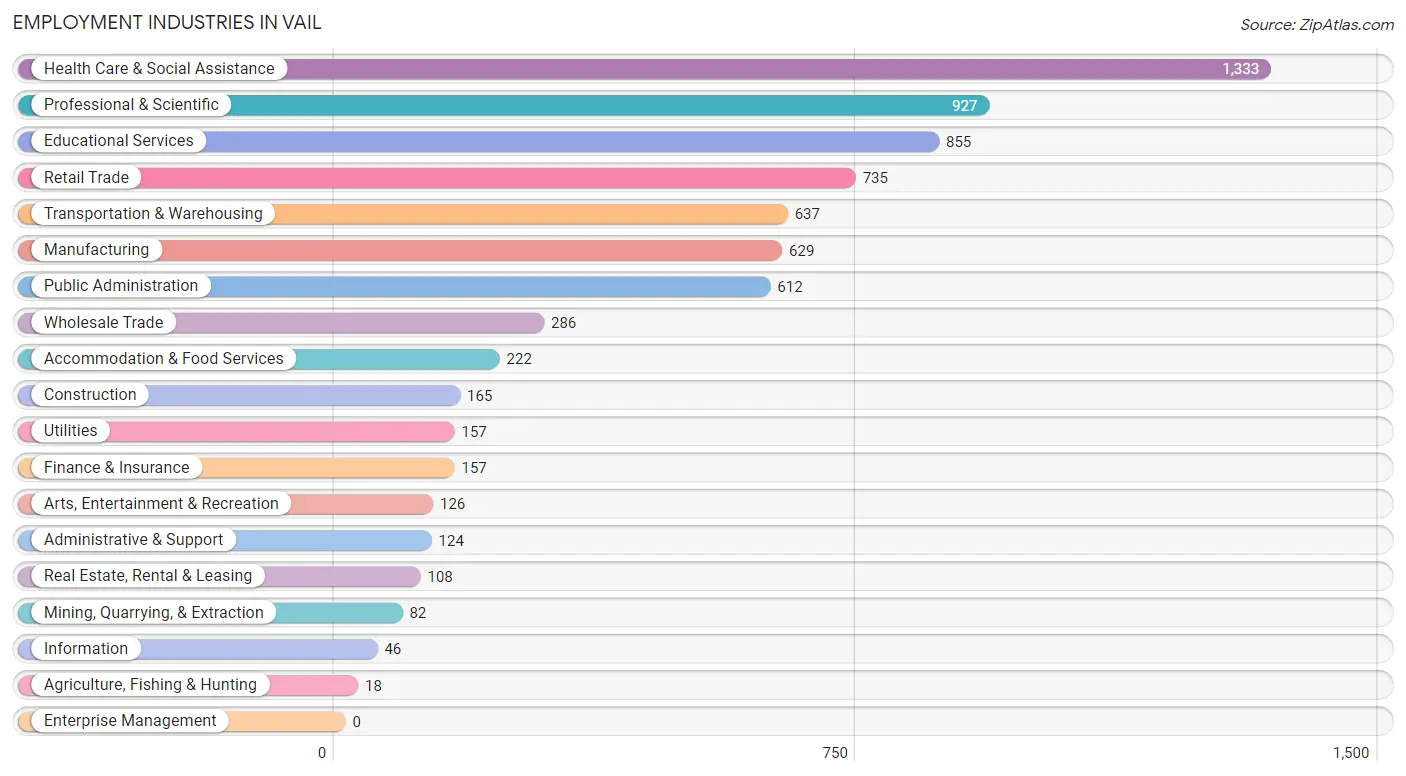
Employment Industries in Vail
The major employment industries in Vail include Health Care & Social Assistance (1,333 | 17.9%), Professional & Scientific (927 | 12.4%), Educational Services (855 | 11.5%), Retail Trade (735 | 9.9%), and Transportation & Warehousing (637 | 8.5%).
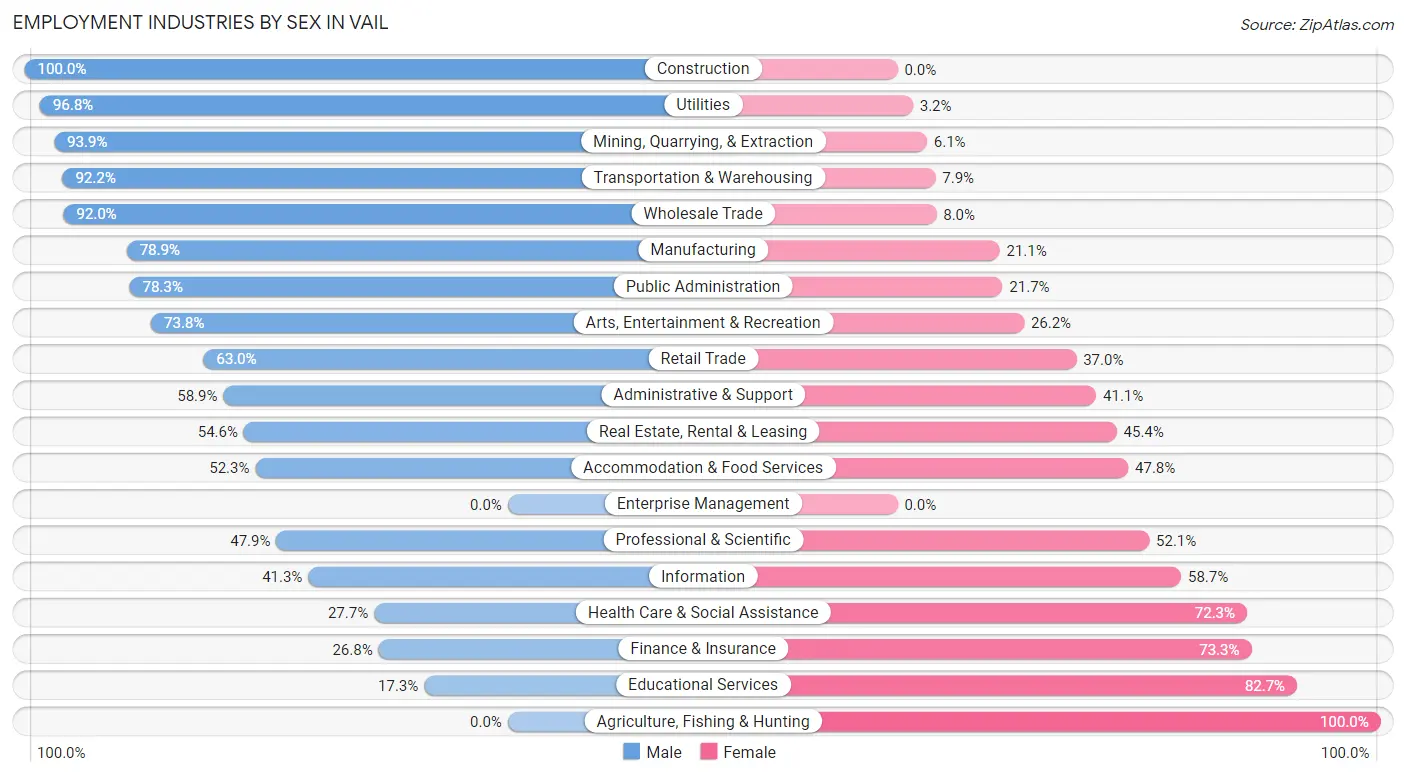
Employment Industries by Sex in Vail
The Vail industries that see more men than women are Construction (100.0%), Utilities (96.8%), and Mining, Quarrying, & Extraction (93.9%), whereas the industries that tend to have a higher number of women are Agriculture, Fishing & Hunting (100.0%), Educational Services (82.7%), and Finance & Insurance (73.3%).
| Industry | Male | Female |
| Agriculture, Fishing & Hunting | 0 (0.0%) | 18 (100.0%) |
| Mining, Quarrying, & Extraction | 77 (93.9%) | 5 (6.1%) |
| Construction | 165 (100.0%) | 0 (0.0%) |
| Manufacturing | 496 (78.9%) | 133 (21.1%) |
| Wholesale Trade | 263 (92.0%) | 23 (8.0%) |
| Retail Trade | 463 (63.0%) | 272 (37.0%) |
| Transportation & Warehousing | 587 (92.1%) | 50 (7.9%) |
| Utilities | 152 (96.8%) | 5 (3.2%) |
| Information | 19 (41.3%) | 27 (58.7%) |
| Finance & Insurance | 42 (26.8%) | 115 (73.3%) |
| Real Estate, Rental & Leasing | 59 (54.6%) | 49 (45.4%) |
| Professional & Scientific | 444 (47.9%) | 483 (52.1%) |
| Enterprise Management | 0 (0.0%) | 0 (0.0%) |
| Administrative & Support | 73 (58.9%) | 51 (41.1%) |
| Educational Services | 148 (17.3%) | 707 (82.7%) |
| Health Care & Social Assistance | 369 (27.7%) | 964 (72.3%) |
| Arts, Entertainment & Recreation | 93 (73.8%) | 33 (26.2%) |
| Accommodation & Food Services | 116 (52.2%) | 106 (47.7%) |
| Public Administration | 479 (78.3%) | 133 (21.7%) |
| Total | 4,184 (56.1%) | 3,278 (43.9%) |
Education in Vail
School Enrollment in Vail
The most common levels of schooling among the 4,056 students in Vail are elementary school (1,056 | 26.0%), college / undergraduate (903 | 22.3%), and middle school (658 | 16.2%).
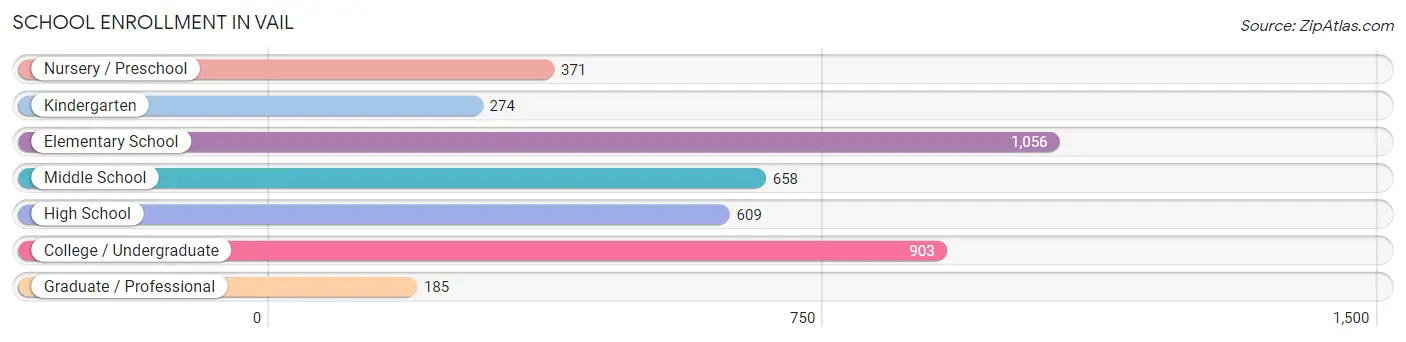
| School Level | # Students | % Students |
| Nursery / Preschool | 371 | 9.1% |
| Kindergarten | 274 | 6.8% |
| Elementary School | 1,056 | 26.0% |
| Middle School | 658 | 16.2% |
| High School | 609 | 15.0% |
| College / Undergraduate | 903 | 22.3% |
| Graduate / Professional | 185 | 4.6% |
| Total | 4,056 | 100.0% |
School Enrollment by Age by Funding Source in Vail
Out of a total of 4,056 students who are enrolled in schools in Vail, 369 (9.1%) attend a private institution, while the remaining 3,687 (90.9%) are enrolled in public schools. The age group of 3 to 4 year olds has the highest likelihood of being enrolled in private schools, with 81 (22.1% in the age bracket) enrolled. Conversely, the age group of 15 to 17 year olds has the lowest likelihood of being enrolled in a private school, with 417 (100.0% in the age bracket) attending a public institution.
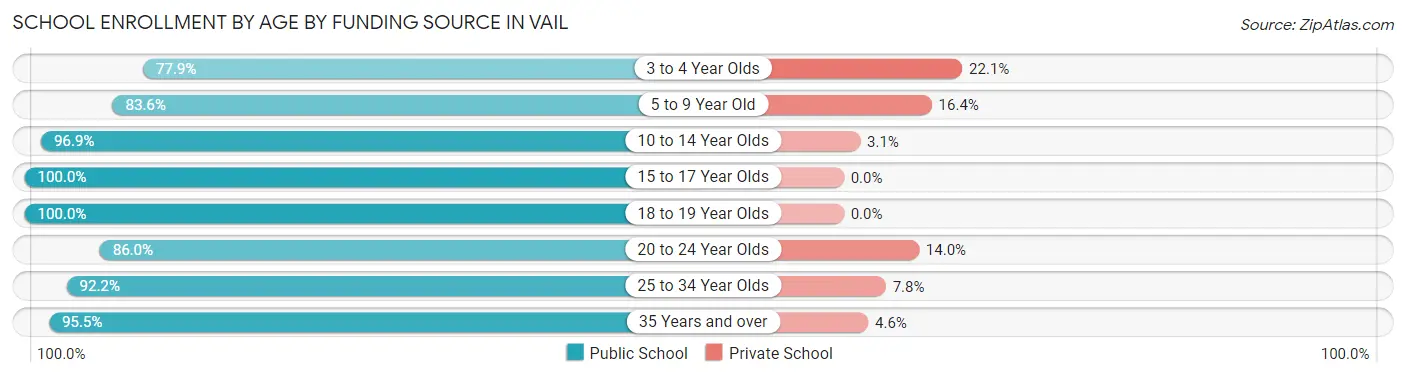
| Age Bracket | Public School | Private School |
| 3 to 4 Year Olds | 286 (77.9%) | 81 (22.1%) |
| 5 to 9 Year Old | 893 (83.6%) | 175 (16.4%) |
| 10 to 14 Year Olds | 982 (96.9%) | 31 (3.1%) |
| 15 to 17 Year Olds | 417 (100.0%) | 0 (0.0%) |
| 18 to 19 Year Olds | 213 (100.0%) | 0 (0.0%) |
| 20 to 24 Year Olds | 307 (86.0%) | 50 (14.0%) |
| 25 to 34 Year Olds | 106 (92.2%) | 9 (7.8%) |
| 35 Years and over | 483 (95.5%) | 23 (4.5%) |
| Total | 3,687 (90.9%) | 369 (9.1%) |
Educational Attainment by Field of Study in Vail
Business (879 | 19.3%), engineering (789 | 17.3%), education (630 | 13.8%), arts & humanities (404 | 8.8%), and science & technology (362 | 7.9%) are the most common fields of study among 4,565 individuals in Vail who have obtained a bachelor's degree or higher.
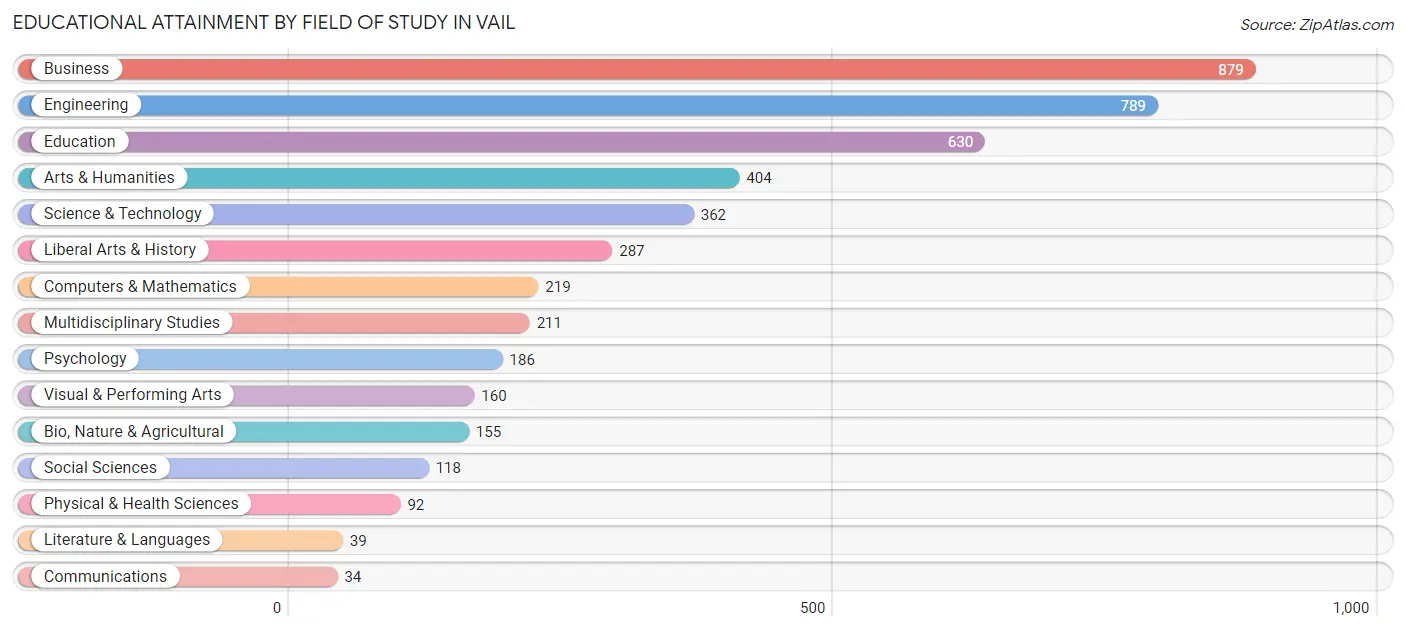
| Field of Study | # Graduates | % Graduates |
| Computers & Mathematics | 219 | 4.8% |
| Bio, Nature & Agricultural | 155 | 3.4% |
| Physical & Health Sciences | 92 | 2.0% |
| Psychology | 186 | 4.1% |
| Social Sciences | 118 | 2.6% |
| Engineering | 789 | 17.3% |
| Multidisciplinary Studies | 211 | 4.6% |
| Science & Technology | 362 | 7.9% |
| Business | 879 | 19.3% |
| Education | 630 | 13.8% |
| Literature & Languages | 39 | 0.9% |
| Liberal Arts & History | 287 | 6.3% |
| Visual & Performing Arts | 160 | 3.5% |
| Communications | 34 | 0.7% |
| Arts & Humanities | 404 | 8.8% |
| Total | 4,565 | 100.0% |
Transportation & Commute in Vail
Vehicle Availability by Sex in Vail
The most prevalent vehicle ownership categories in Vail are males with 2 vehicles (2,184, accounting for 51.6%) and females with 2 vehicles (1,673, making up 67.5%).
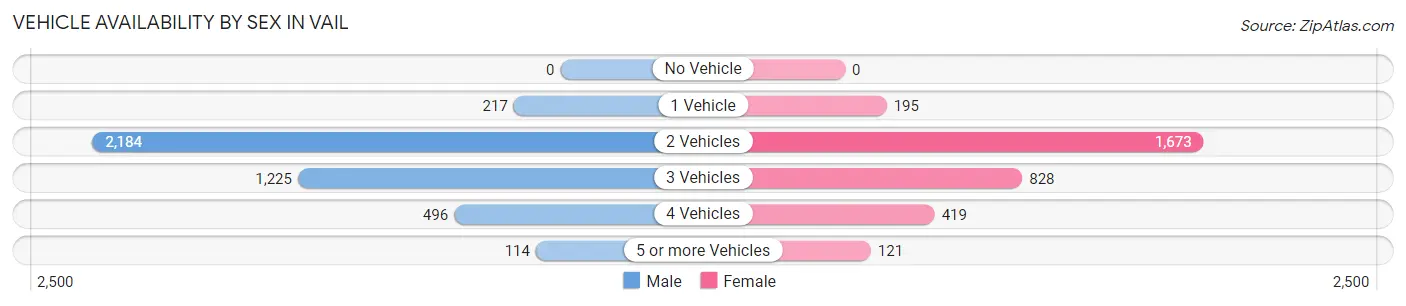
| Vehicles Available | Male | Female |
| No Vehicle | 0 (0.0%) | 0 (0.0%) |
| 1 Vehicle | 217 (5.1%) | 195 (6.0%) |
| 2 Vehicles | 2,184 (51.6%) | 1,673 (51.7%) |
| 3 Vehicles | 1,225 (28.9%) | 828 (25.6%) |
| 4 Vehicles | 496 (11.7%) | 419 (13.0%) |
| 5 or more Vehicles | 114 (2.7%) | 121 (3.7%) |
| Total | 4,236 (100.0%) | 3,236 (100.0%) |
Commute Time in Vail
The most frequently occuring commute durations in Vail are 30 to 34 minutes (1,645 commuters, 26.8%), 25 to 29 minutes (864 commuters, 14.1%), and 20 to 24 minutes (804 commuters, 13.1%).
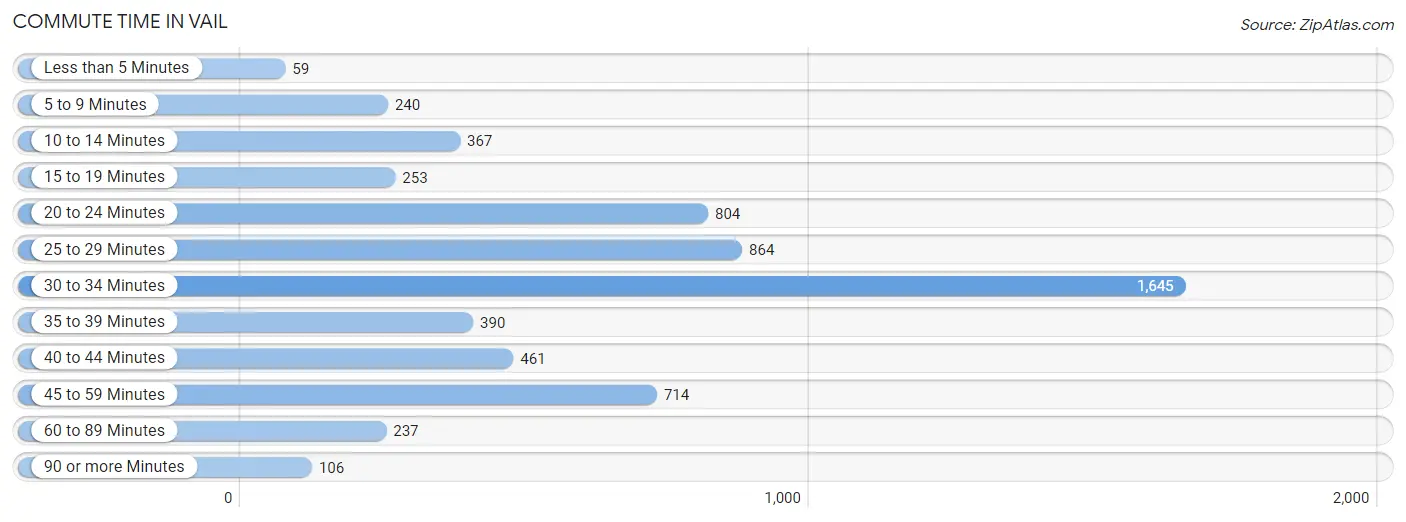
| Commute Time | # Commuters | % Commuters |
| Less than 5 Minutes | 59 | 1.0% |
| 5 to 9 Minutes | 240 | 3.9% |
| 10 to 14 Minutes | 367 | 6.0% |
| 15 to 19 Minutes | 253 | 4.1% |
| 20 to 24 Minutes | 804 | 13.1% |
| 25 to 29 Minutes | 864 | 14.1% |
| 30 to 34 Minutes | 1,645 | 26.8% |
| 35 to 39 Minutes | 390 | 6.4% |
| 40 to 44 Minutes | 461 | 7.5% |
| 45 to 59 Minutes | 714 | 11.6% |
| 60 to 89 Minutes | 237 | 3.9% |
| 90 or more Minutes | 106 | 1.7% |
Commute Time by Sex in Vail
The most common commute times in Vail are 30 to 34 minutes (1,440 commuters, 38.6%) for males and 25 to 29 minutes (498 commuters, 20.7%) for females.
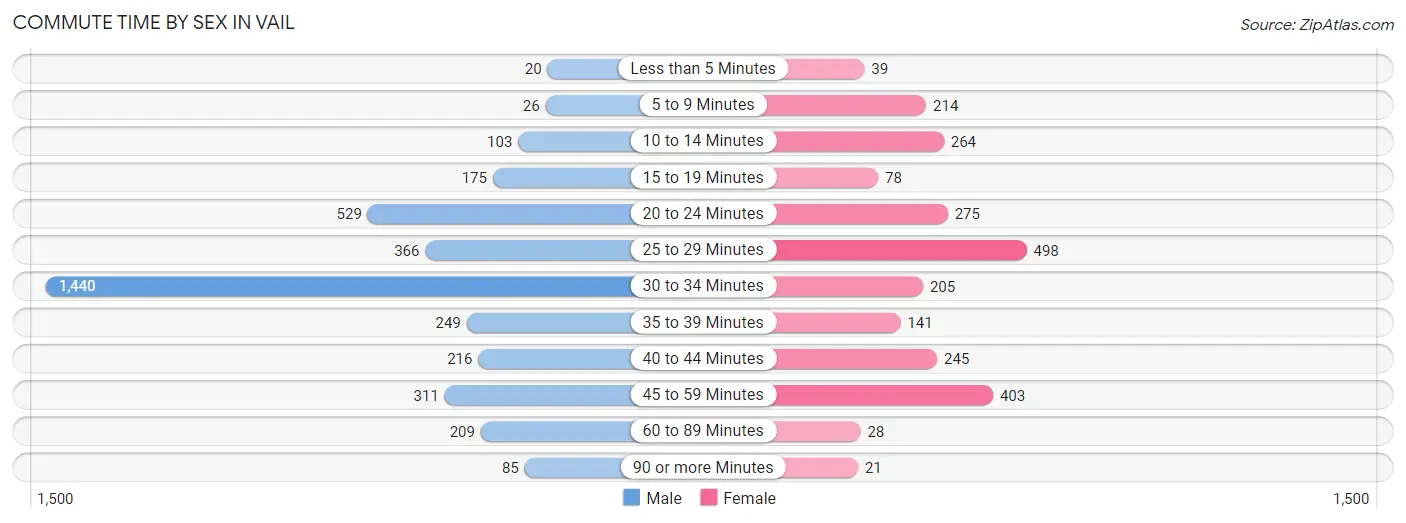
| Commute Time | Male | Female |
| Less than 5 Minutes | 20 (0.5%) | 39 (1.6%) |
| 5 to 9 Minutes | 26 (0.7%) | 214 (8.9%) |
| 10 to 14 Minutes | 103 (2.8%) | 264 (11.0%) |
| 15 to 19 Minutes | 175 (4.7%) | 78 (3.2%) |
| 20 to 24 Minutes | 529 (14.2%) | 275 (11.4%) |
| 25 to 29 Minutes | 366 (9.8%) | 498 (20.7%) |
| 30 to 34 Minutes | 1,440 (38.6%) | 205 (8.5%) |
| 35 to 39 Minutes | 249 (6.7%) | 141 (5.9%) |
| 40 to 44 Minutes | 216 (5.8%) | 245 (10.2%) |
| 45 to 59 Minutes | 311 (8.3%) | 403 (16.7%) |
| 60 to 89 Minutes | 209 (5.6%) | 28 (1.2%) |
| 90 or more Minutes | 85 (2.3%) | 21 (0.9%) |
Time of Departure to Work by Sex in Vail
The most frequent times of departure to work in Vail are 5:30 AM to 5:59 AM (543, 14.6%) for males and 7:00 AM to 7:29 AM (452, 18.8%) for females.
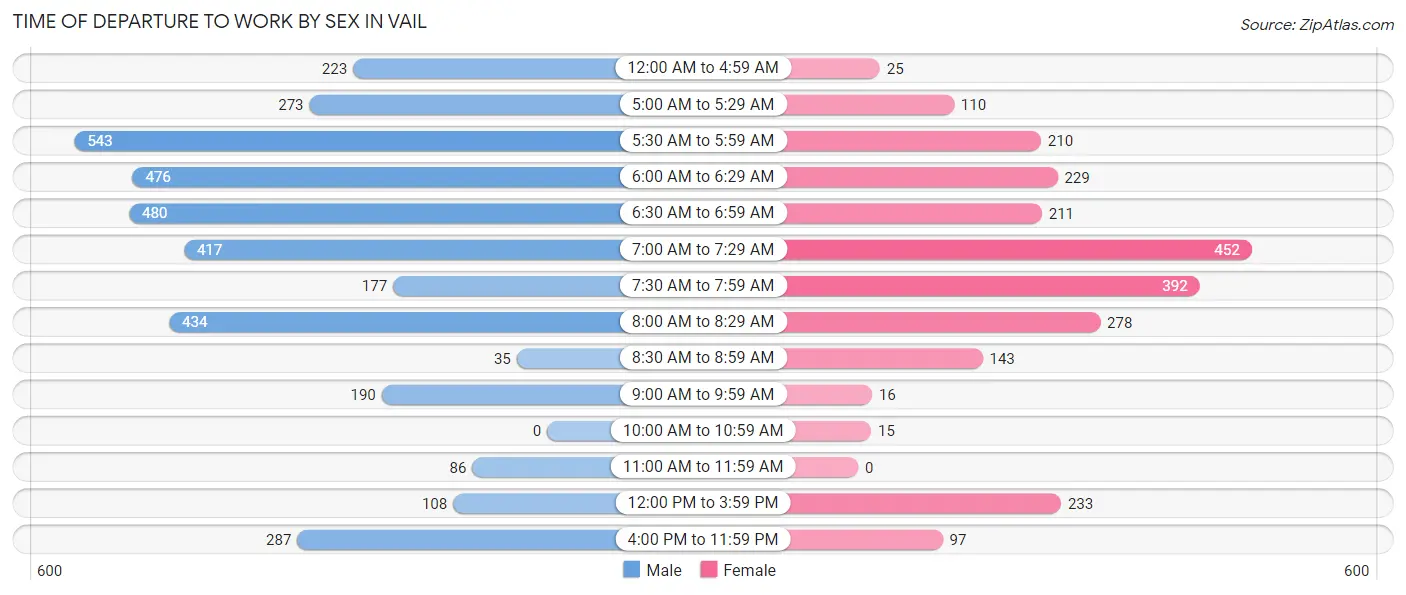
| Time of Departure | Male | Female |
| 12:00 AM to 4:59 AM | 223 (6.0%) | 25 (1.0%) |
| 5:00 AM to 5:29 AM | 273 (7.3%) | 110 (4.6%) |
| 5:30 AM to 5:59 AM | 543 (14.6%) | 210 (8.7%) |
| 6:00 AM to 6:29 AM | 476 (12.8%) | 229 (9.5%) |
| 6:30 AM to 6:59 AM | 480 (12.9%) | 211 (8.7%) |
| 7:00 AM to 7:29 AM | 417 (11.2%) | 452 (18.8%) |
| 7:30 AM to 7:59 AM | 177 (4.8%) | 392 (16.3%) |
| 8:00 AM to 8:29 AM | 434 (11.6%) | 278 (11.5%) |
| 8:30 AM to 8:59 AM | 35 (0.9%) | 143 (5.9%) |
| 9:00 AM to 9:59 AM | 190 (5.1%) | 16 (0.7%) |
| 10:00 AM to 10:59 AM | 0 (0.0%) | 15 (0.6%) |
| 11:00 AM to 11:59 AM | 86 (2.3%) | 0 (0.0%) |
| 12:00 PM to 3:59 PM | 108 (2.9%) | 233 (9.7%) |
| 4:00 PM to 11:59 PM | 287 (7.7%) | 97 (4.0%) |
| Total | 3,729 (100.0%) | 2,411 (100.0%) |
Housing Occupancy in Vail
Occupancy by Ownership in Vail
Of the total 5,221 dwellings in Vail, owner-occupied units account for 4,756 (91.1%), while renter-occupied units make up 465 (8.9%).
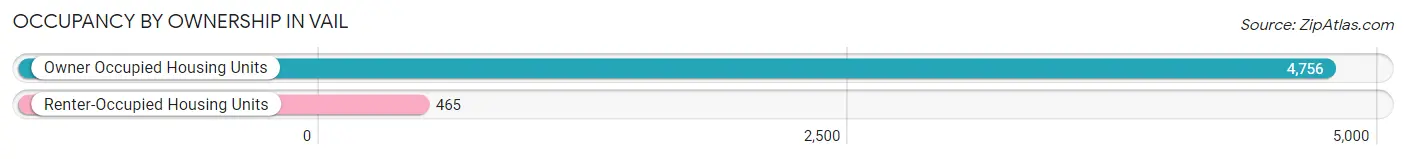
| Occupancy | # Housing Units | % Housing Units |
| Owner Occupied Housing Units | 4,756 | 91.1% |
| Renter-Occupied Housing Units | 465 | 8.9% |
| Total Occupied Housing Units | 5,221 | 100.0% |
Occupancy by Household Size in Vail
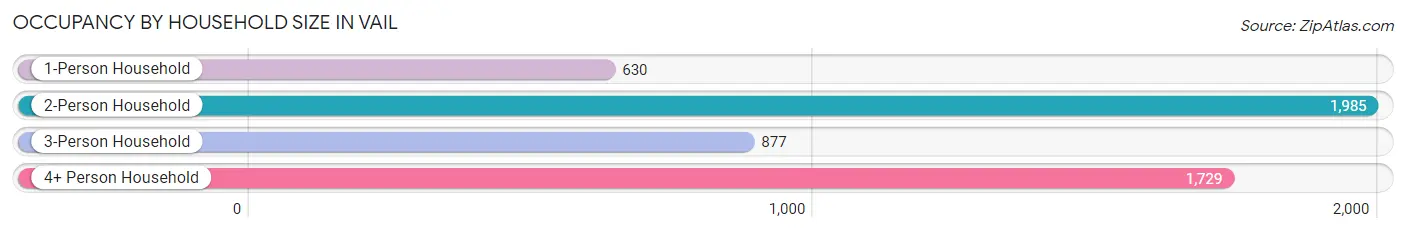
| Household Size | # Housing Units | % Housing Units |
| 1-Person Household | 630 | 12.1% |
| 2-Person Household | 1,985 | 38.0% |
| 3-Person Household | 877 | 16.8% |
| 4+ Person Household | 1,729 | 33.1% |
| Total Housing Units | 5,221 | 100.0% |
Occupancy by Ownership by Household Size in Vail
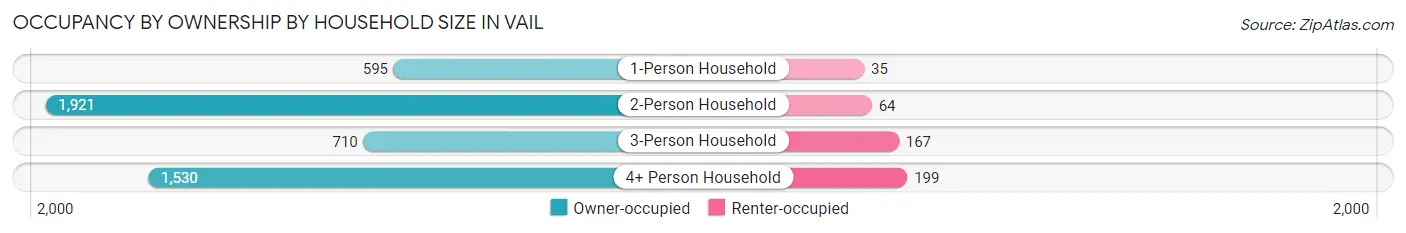
| Household Size | Owner-occupied | Renter-occupied |
| 1-Person Household | 595 (94.4%) | 35 (5.6%) |
| 2-Person Household | 1,921 (96.8%) | 64 (3.2%) |
| 3-Person Household | 710 (81.0%) | 167 (19.0%) |
| 4+ Person Household | 1,530 (88.5%) | 199 (11.5%) |
| Total Housing Units | 4,756 (91.1%) | 465 (8.9%) |
Occupancy by Educational Attainment in Vail
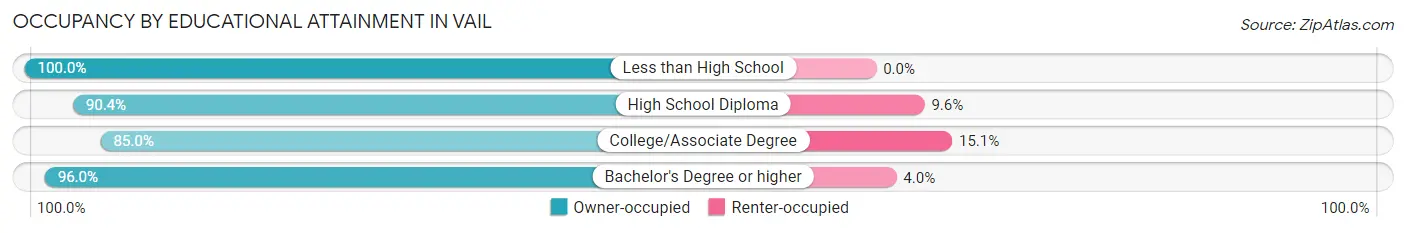
| Household Size | Owner-occupied | Renter-occupied |
| Less than High School | 136 (100.0%) | 0 (0.0%) |
| High School Diploma | 501 (90.4%) | 53 (9.6%) |
| College/Associate Degree | 1,772 (85.0%) | 314 (15.0%) |
| Bachelor's Degree or higher | 2,347 (96.0%) | 98 (4.0%) |
Occupancy by Age of Householder in Vail
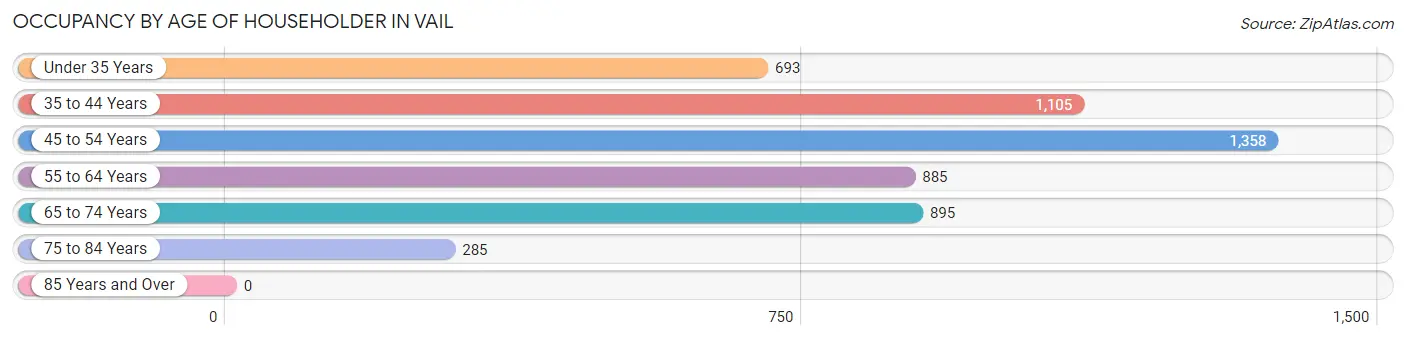
| Age Bracket | # Households | % Households |
| Under 35 Years | 693 | 13.3% |
| 35 to 44 Years | 1,105 | 21.2% |
| 45 to 54 Years | 1,358 | 26.0% |
| 55 to 64 Years | 885 | 17.0% |
| 65 to 74 Years | 895 | 17.1% |
| 75 to 84 Years | 285 | 5.5% |
| 85 Years and Over | 0 | 0.0% |
| Total | 5,221 | 100.0% |
Housing Finances in Vail
Median Income by Occupancy in Vail
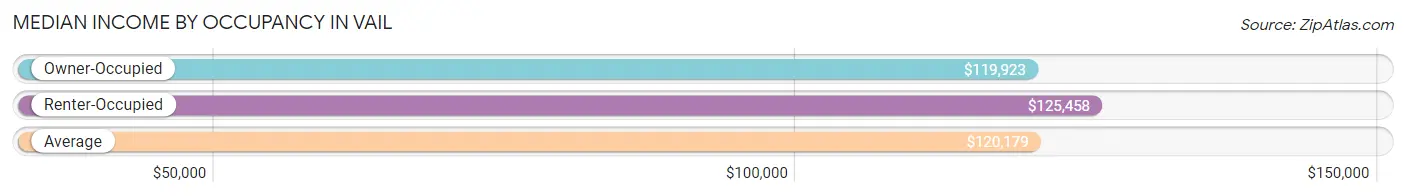
| Occupancy Type | # Households | Median Income |
| Owner-Occupied | 4,756 (91.1%) | $119,923 |
| Renter-Occupied | 465 (8.9%) | $125,458 |
| Average | 5,221 (100.0%) | $120,179 |
Occupancy by Householder Income Bracket in Vail
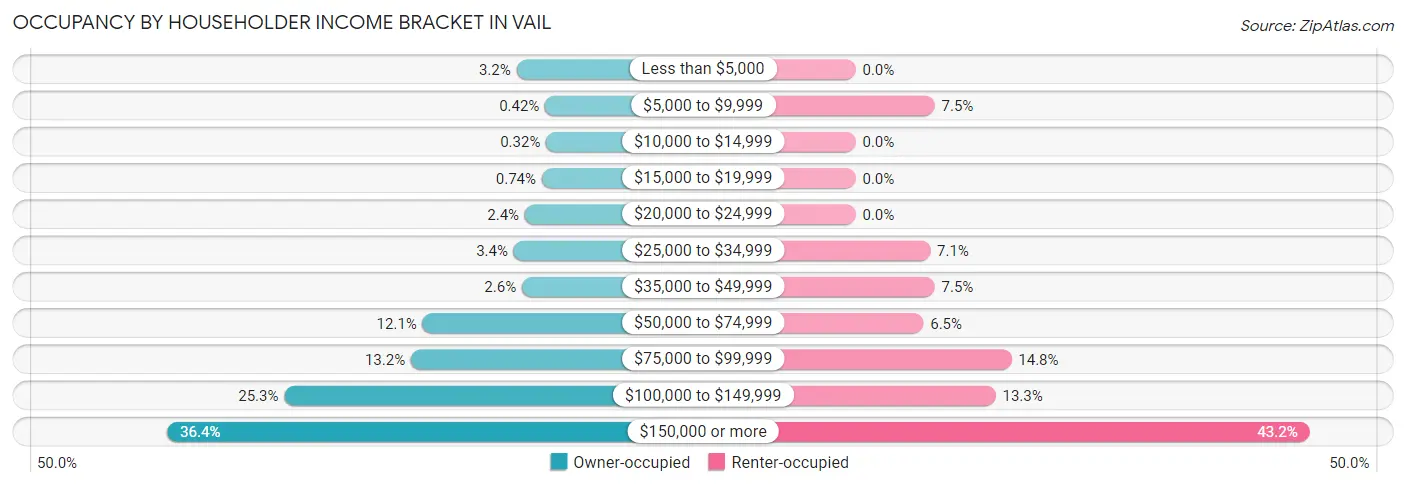
| Income Bracket | Owner-occupied | Renter-occupied |
| Less than $5,000 | 150 (3.2%) | 0 (0.0%) |
| $5,000 to $9,999 | 20 (0.4%) | 35 (7.5%) |
| $10,000 to $14,999 | 15 (0.3%) | 0 (0.0%) |
| $15,000 to $19,999 | 35 (0.7%) | 0 (0.0%) |
| $20,000 to $24,999 | 112 (2.4%) | 0 (0.0%) |
| $25,000 to $34,999 | 162 (3.4%) | 33 (7.1%) |
| $35,000 to $49,999 | 125 (2.6%) | 35 (7.5%) |
| $50,000 to $74,999 | 575 (12.1%) | 30 (6.5%) |
| $75,000 to $99,999 | 628 (13.2%) | 69 (14.8%) |
| $100,000 to $149,999 | 1,202 (25.3%) | 62 (13.3%) |
| $150,000 or more | 1,732 (36.4%) | 201 (43.2%) |
| Total | 4,756 (100.0%) | 465 (100.0%) |
Monthly Housing Cost Tiers in Vail
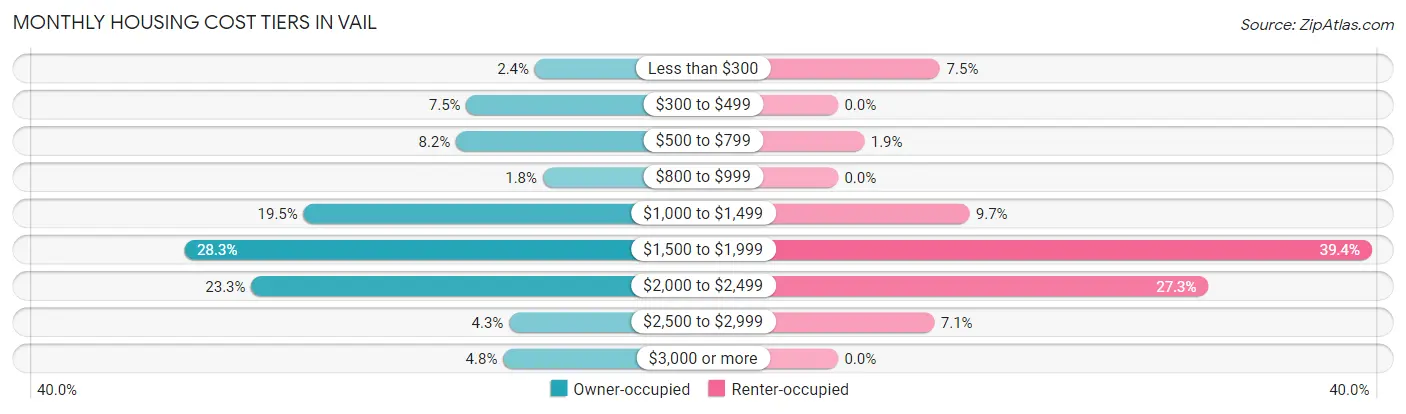
| Monthly Cost | Owner-occupied | Renter-occupied |
| Less than $300 | 115 (2.4%) | 35 (7.5%) |
| $300 to $499 | 355 (7.5%) | 0 (0.0%) |
| $500 to $799 | 391 (8.2%) | 9 (1.9%) |
| $800 to $999 | 87 (1.8%) | 0 (0.0%) |
| $1,000 to $1,499 | 925 (19.5%) | 45 (9.7%) |
| $1,500 to $1,999 | 1,344 (28.3%) | 183 (39.4%) |
| $2,000 to $2,499 | 1,108 (23.3%) | 127 (27.3%) |
| $2,500 to $2,999 | 205 (4.3%) | 33 (7.1%) |
| $3,000 or more | 226 (4.8%) | 0 (0.0%) |
| Total | 4,756 (100.0%) | 465 (100.0%) |
Physical Housing Characteristics in Vail
Housing Structures in Vail
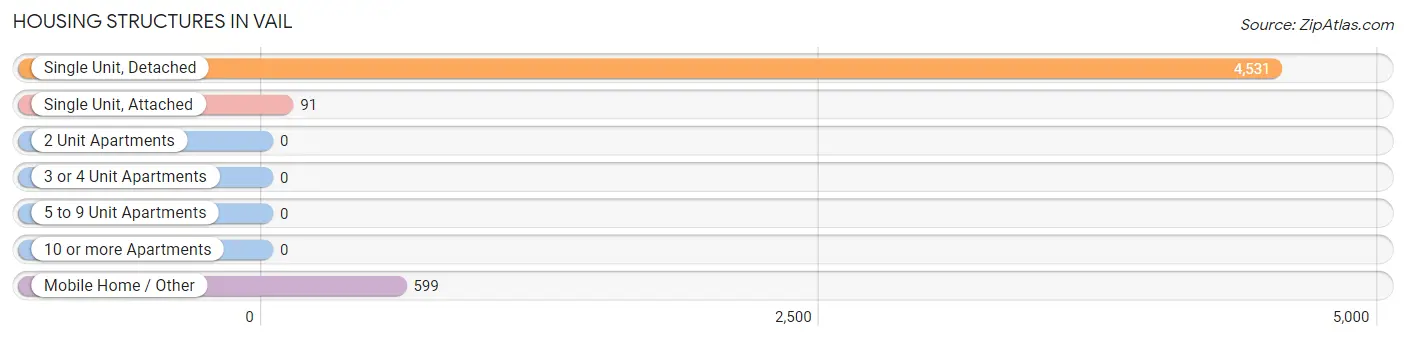
| Structure Type | # Housing Units | % Housing Units |
| Single Unit, Detached | 4,531 | 86.8% |
| Single Unit, Attached | 91 | 1.7% |
| 2 Unit Apartments | 0 | 0.0% |
| 3 or 4 Unit Apartments | 0 | 0.0% |
| 5 to 9 Unit Apartments | 0 | 0.0% |
| 10 or more Apartments | 0 | 0.0% |
| Mobile Home / Other | 599 | 11.5% |
| Total | 5,221 | 100.0% |
Housing Structures by Occupancy in Vail
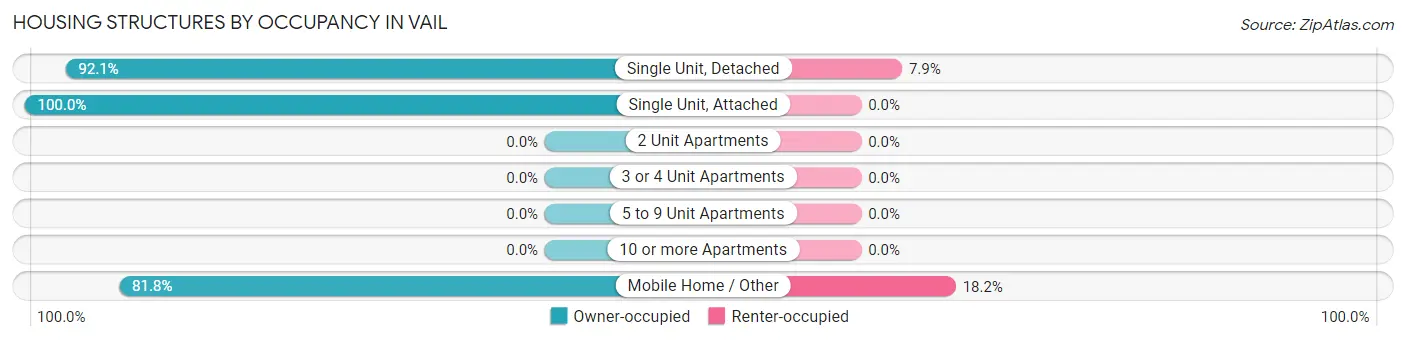
| Structure Type | Owner-occupied | Renter-occupied |
| Single Unit, Detached | 4,175 (92.1%) | 356 (7.9%) |
| Single Unit, Attached | 91 (100.0%) | 0 (0.0%) |
| 2 Unit Apartments | 0 (0.0%) | 0 (0.0%) |
| 3 or 4 Unit Apartments | 0 (0.0%) | 0 (0.0%) |
| 5 to 9 Unit Apartments | 0 (0.0%) | 0 (0.0%) |
| 10 or more Apartments | 0 (0.0%) | 0 (0.0%) |
| Mobile Home / Other | 490 (81.8%) | 109 (18.2%) |
| Total | 4,756 (91.1%) | 465 (8.9%) |
Housing Structures by Number of Rooms in Vail
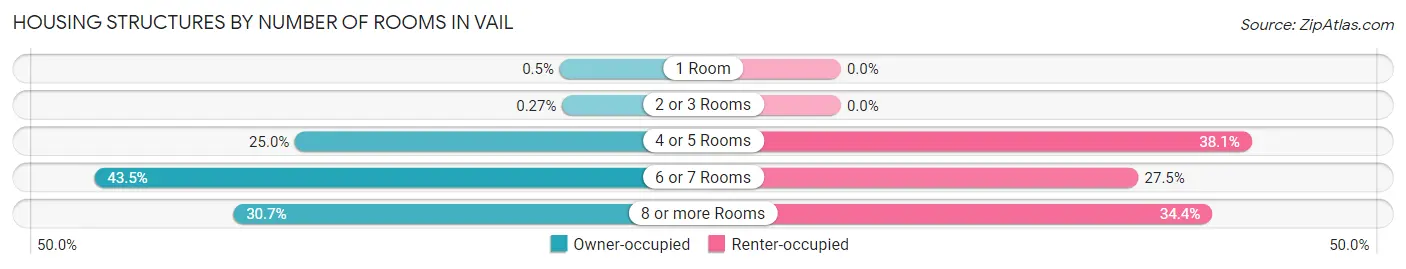
| Number of Rooms | Owner-occupied | Renter-occupied |
| 1 Room | 24 (0.5%) | 0 (0.0%) |
| 2 or 3 Rooms | 13 (0.3%) | 0 (0.0%) |
| 4 or 5 Rooms | 1,188 (25.0%) | 177 (38.1%) |
| 6 or 7 Rooms | 2,071 (43.5%) | 128 (27.5%) |
| 8 or more Rooms | 1,460 (30.7%) | 160 (34.4%) |
| Total | 4,756 (100.0%) | 465 (100.0%) |
Housing Structure by Heating Type in Vail
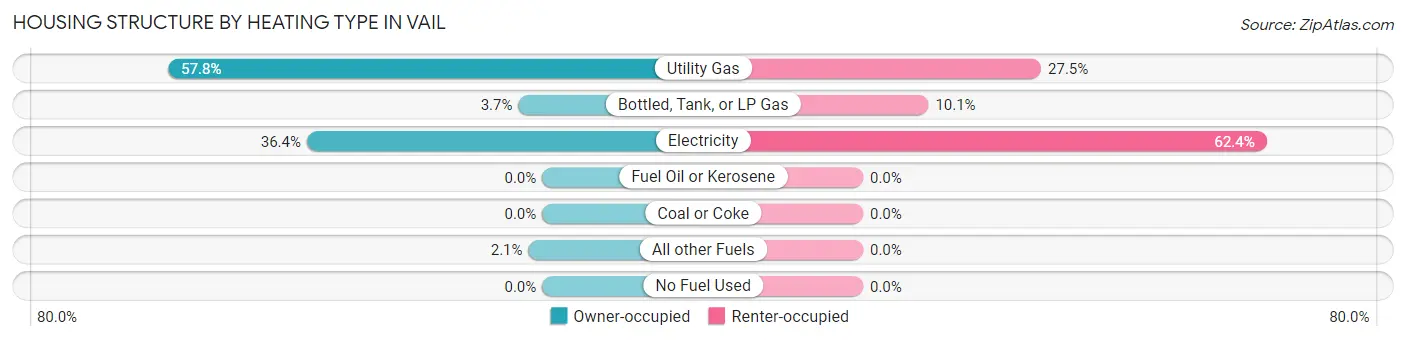
| Heating Type | Owner-occupied | Renter-occupied |
| Utility Gas | 2,750 (57.8%) | 128 (27.5%) |
| Bottled, Tank, or LP Gas | 175 (3.7%) | 47 (10.1%) |
| Electricity | 1,730 (36.4%) | 290 (62.4%) |
| Fuel Oil or Kerosene | 0 (0.0%) | 0 (0.0%) |
| Coal or Coke | 0 (0.0%) | 0 (0.0%) |
| All other Fuels | 101 (2.1%) | 0 (0.0%) |
| No Fuel Used | 0 (0.0%) | 0 (0.0%) |
| Total | 4,756 (100.0%) | 465 (100.0%) |
Household Vehicle Usage in Vail
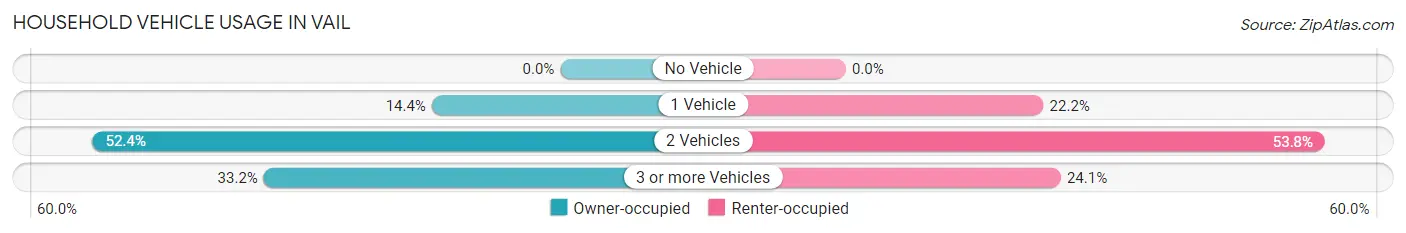
| Vehicles per Household | Owner-occupied | Renter-occupied |
| No Vehicle | 0 (0.0%) | 0 (0.0%) |
| 1 Vehicle | 685 (14.4%) | 103 (22.2%) |
| 2 Vehicles | 2,491 (52.4%) | 250 (53.8%) |
| 3 or more Vehicles | 1,580 (33.2%) | 112 (24.1%) |
| Total | 4,756 (100.0%) | 465 (100.0%) |
Real Estate & Mortgages in Vail
Real Estate and Mortgage Overview in Vail
| Characteristic | Without Mortgage | With Mortgage |
| Housing Units | 876 | 3,880 |
| Median Property Value | $333,300 | $341,400 |
| Median Household Income | $106,029 | $1,503 |
| Monthly Housing Costs | $495 | $226 |
| Real Estate Taxes | $3,066 | $156 |
Property Value by Mortgage Status in Vail
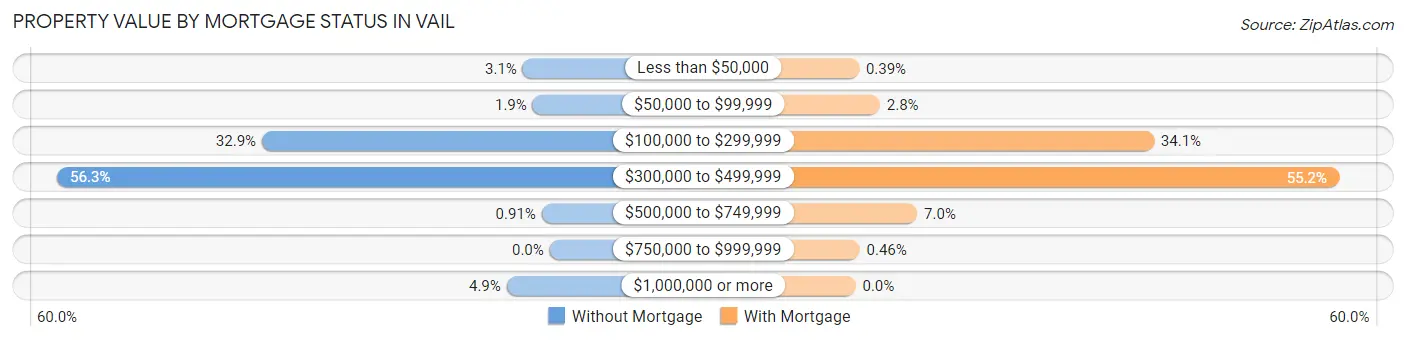
| Property Value | Without Mortgage | With Mortgage |
| Less than $50,000 | 27 (3.1%) | 15 (0.4%) |
| $50,000 to $99,999 | 17 (1.9%) | 108 (2.8%) |
| $100,000 to $299,999 | 288 (32.9%) | 1,323 (34.1%) |
| $300,000 to $499,999 | 493 (56.3%) | 2,143 (55.2%) |
| $500,000 to $749,999 | 8 (0.9%) | 273 (7.0%) |
| $750,000 to $999,999 | 0 (0.0%) | 18 (0.5%) |
| $1,000,000 or more | 43 (4.9%) | 0 (0.0%) |
| Total | 876 (100.0%) | 3,880 (100.0%) |
Household Income by Mortgage Status in Vail
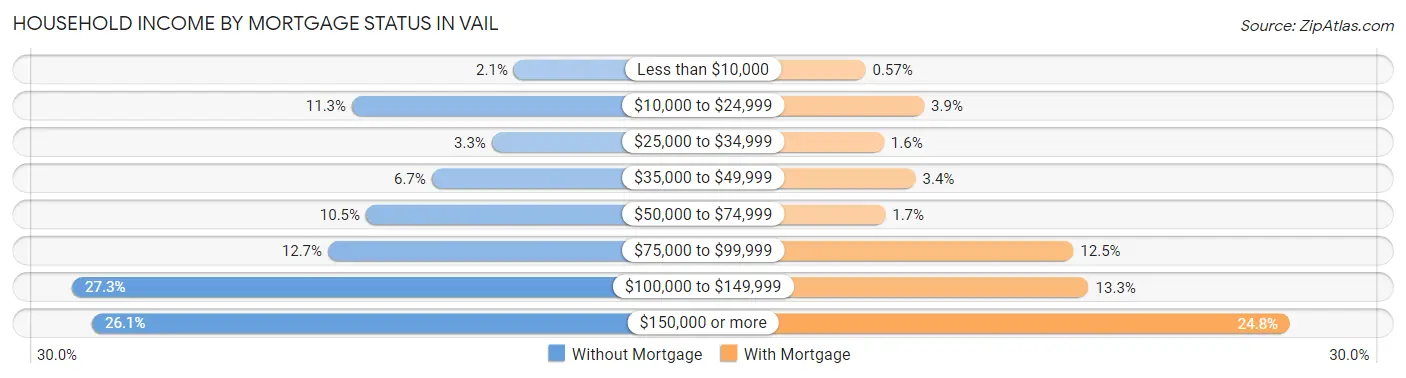
| Household Income | Without Mortgage | With Mortgage |
| Less than $10,000 | 18 (2.1%) | 22 (0.6%) |
| $10,000 to $24,999 | 99 (11.3%) | 152 (3.9%) |
| $25,000 to $34,999 | 29 (3.3%) | 63 (1.6%) |
| $35,000 to $49,999 | 59 (6.7%) | 133 (3.4%) |
| $50,000 to $74,999 | 92 (10.5%) | 66 (1.7%) |
| $75,000 to $99,999 | 111 (12.7%) | 483 (12.4%) |
| $100,000 to $149,999 | 239 (27.3%) | 517 (13.3%) |
| $150,000 or more | 229 (26.1%) | 963 (24.8%) |
| Total | 876 (100.0%) | 3,880 (100.0%) |
Property Value to Household Income Ratio in Vail
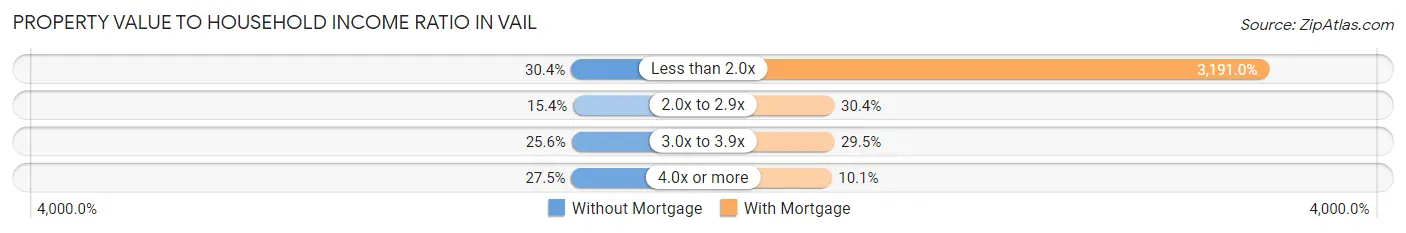
| Value-to-Income Ratio | Without Mortgage | With Mortgage |
| Less than 2.0x | 266 (30.4%) | 123,810 (3,191.0%) |
| 2.0x to 2.9x | 135 (15.4%) | 1,179 (30.4%) |
| 3.0x to 3.9x | 224 (25.6%) | 1,143 (29.5%) |
| 4.0x or more | 241 (27.5%) | 393 (10.1%) |
| Total | 876 (100.0%) | 3,880 (100.0%) |
Real Estate Taxes by Mortgage Status in Vail
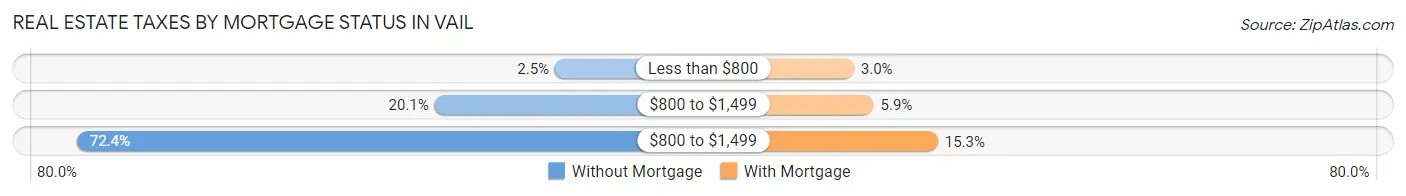
| Property Taxes | Without Mortgage | With Mortgage |
| Less than $800 | 22 (2.5%) | 118 (3.0%) |
| $800 to $1,499 | 176 (20.1%) | 230 (5.9%) |
| $800 to $1,499 | 634 (72.4%) | 594 (15.3%) |
| Total | 876 (100.0%) | 3,880 (100.0%) |
Health & Disability in Vail
Health Insurance Coverage by Age in Vail
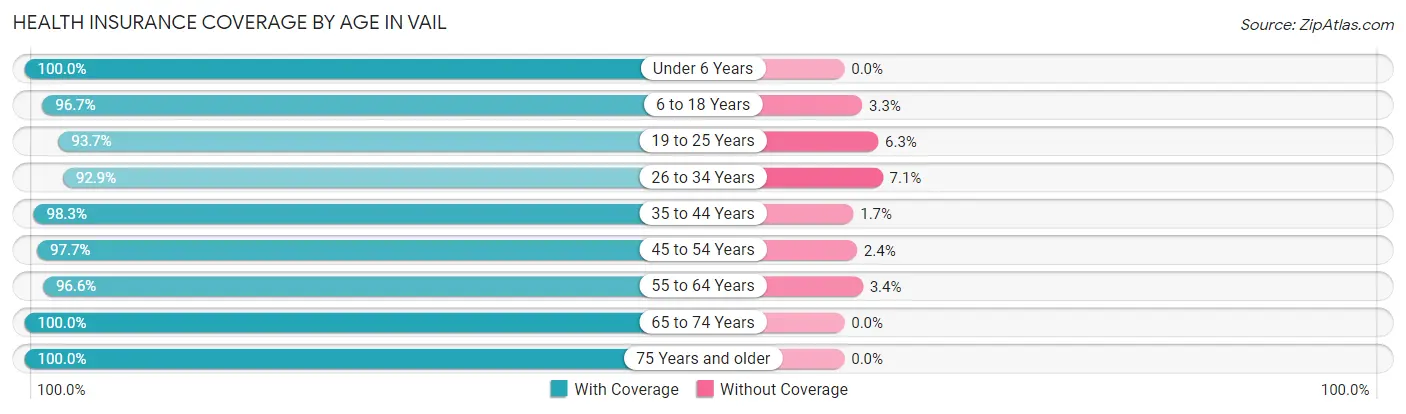
| Age Bracket | With Coverage | Without Coverage |
| Under 6 Years | 1,647 (100.0%) | 0 (0.0%) |
| 6 to 18 Years | 2,274 (96.7%) | 78 (3.3%) |
| 19 to 25 Years | 1,220 (93.7%) | 82 (6.3%) |
| 26 to 34 Years | 1,131 (92.9%) | 87 (7.1%) |
| 35 to 44 Years | 2,171 (98.3%) | 37 (1.7%) |
| 45 to 54 Years | 2,703 (97.7%) | 65 (2.4%) |
| 55 to 64 Years | 1,491 (96.6%) | 53 (3.4%) |
| 65 to 74 Years | 1,556 (100.0%) | 0 (0.0%) |
| 75 Years and older | 542 (100.0%) | 0 (0.0%) |
| Total | 14,735 (97.3%) | 402 (2.7%) |
Health Insurance Coverage by Citizenship Status in Vail
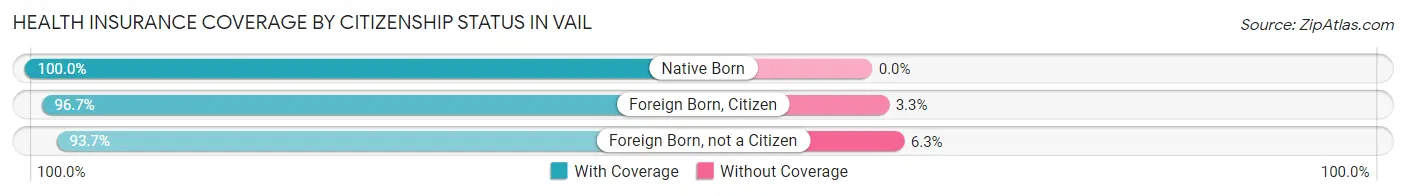
| Citizenship Status | With Coverage | Without Coverage |
| Native Born | 1,647 (100.0%) | 0 (0.0%) |
| Foreign Born, Citizen | 2,274 (96.7%) | 78 (3.3%) |
| Foreign Born, not a Citizen | 1,220 (93.7%) | 82 (6.3%) |
Health Insurance Coverage by Household Income in Vail
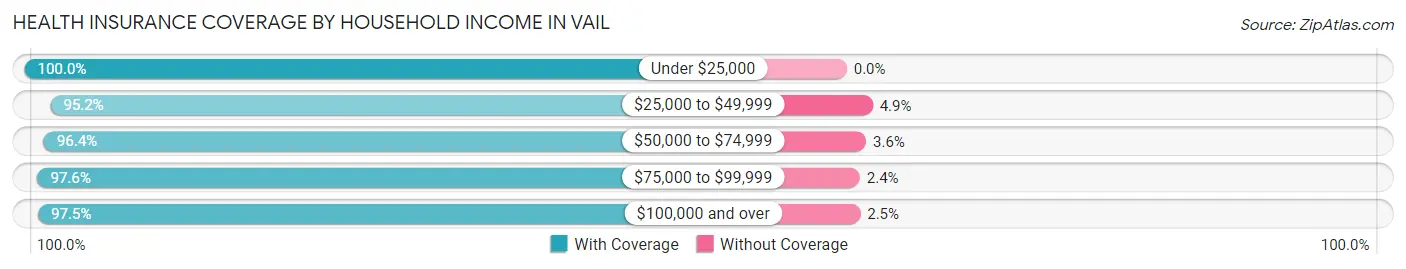
| Household Income | With Coverage | Without Coverage |
| Under $25,000 | 548 (100.0%) | 0 (0.0%) |
| $25,000 to $49,999 | 824 (95.2%) | 42 (4.9%) |
| $50,000 to $74,999 | 1,332 (96.4%) | 50 (3.6%) |
| $75,000 to $99,999 | 2,037 (97.6%) | 51 (2.4%) |
| $100,000 and over | 9,994 (97.5%) | 259 (2.5%) |
Public vs Private Health Insurance Coverage by Age in Vail
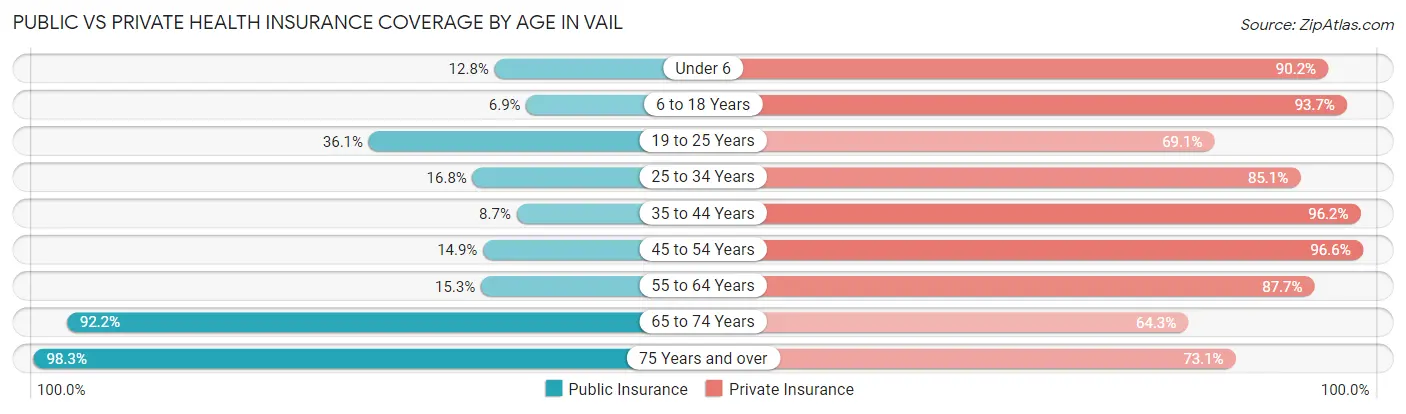
| Age Bracket | Public Insurance | Private Insurance |
| Under 6 | 210 (12.8%) | 1,486 (90.2%) |
| 6 to 18 Years | 161 (6.9%) | 2,204 (93.7%) |
| 19 to 25 Years | 470 (36.1%) | 900 (69.1%) |
| 25 to 34 Years | 205 (16.8%) | 1,036 (85.1%) |
| 35 to 44 Years | 191 (8.6%) | 2,125 (96.2%) |
| 45 to 54 Years | 412 (14.9%) | 2,675 (96.6%) |
| 55 to 64 Years | 236 (15.3%) | 1,354 (87.7%) |
| 65 to 74 Years | 1,434 (92.2%) | 1,000 (64.3%) |
| 75 Years and over | 533 (98.3%) | 396 (73.1%) |
| Total | 3,852 (25.5%) | 13,176 (87.0%) |
Disability Status by Sex by Age in Vail
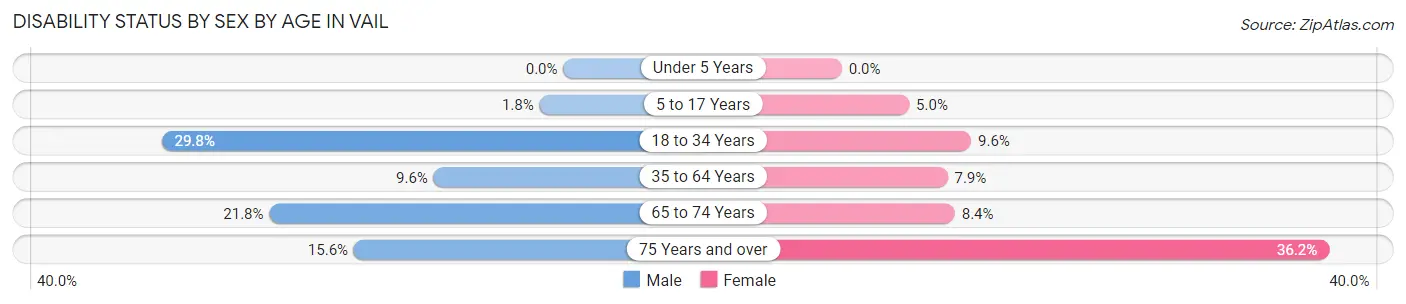
| Age Bracket | Male | Female |
| Under 5 Years | 0 (0.0%) | 0 (0.0%) |
| 5 to 17 Years | 24 (1.8%) | 58 (5.0%) |
| 18 to 34 Years | 431 (29.8%) | 114 (9.6%) |
| 35 to 64 Years | 325 (9.6%) | 247 (7.9%) |
| 65 to 74 Years | 181 (21.8%) | 61 (8.4%) |
| 75 Years and over | 37 (15.5%) | 110 (36.2%) |
Disability Class by Sex by Age in Vail
Disability Class: Hearing Difficulty
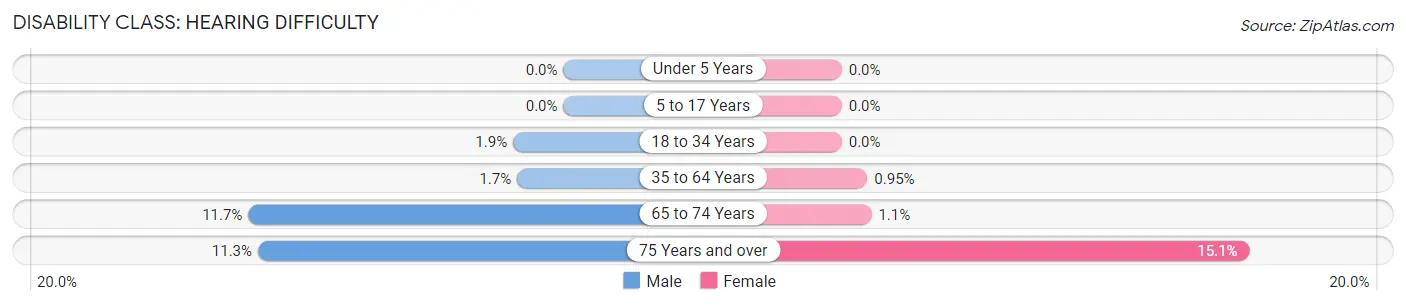
| Age Bracket | Male | Female |
| Under 5 Years | 0 (0.0%) | 0 (0.0%) |
| 5 to 17 Years | 0 (0.0%) | 0 (0.0%) |
| 18 to 34 Years | 27 (1.9%) | 0 (0.0%) |
| 35 to 64 Years | 58 (1.7%) | 30 (0.9%) |
| 65 to 74 Years | 97 (11.7%) | 8 (1.1%) |
| 75 Years and over | 27 (11.3%) | 46 (15.1%) |
Disability Class: Vision Difficulty
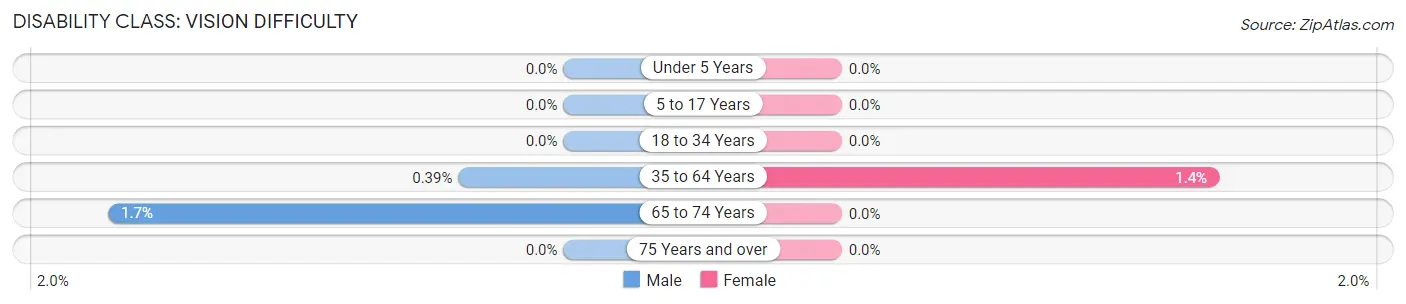
| Age Bracket | Male | Female |
| Under 5 Years | 0 (0.0%) | 0 (0.0%) |
| 5 to 17 Years | 0 (0.0%) | 0 (0.0%) |
| 18 to 34 Years | 0 (0.0%) | 0 (0.0%) |
| 35 to 64 Years | 13 (0.4%) | 44 (1.4%) |
| 65 to 74 Years | 14 (1.7%) | 0 (0.0%) |
| 75 Years and over | 0 (0.0%) | 0 (0.0%) |
Disability Class: Cognitive Difficulty
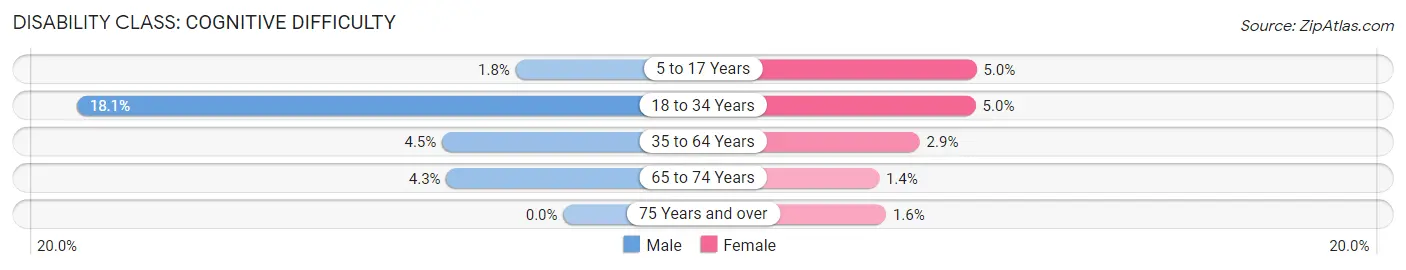
| Age Bracket | Male | Female |
| 5 to 17 Years | 24 (1.8%) | 58 (5.0%) |
| 18 to 34 Years | 261 (18.1%) | 59 (5.0%) |
| 35 to 64 Years | 152 (4.5%) | 91 (2.9%) |
| 65 to 74 Years | 36 (4.3%) | 10 (1.4%) |
| 75 Years and over | 0 (0.0%) | 5 (1.6%) |
Disability Class: Ambulatory Difficulty
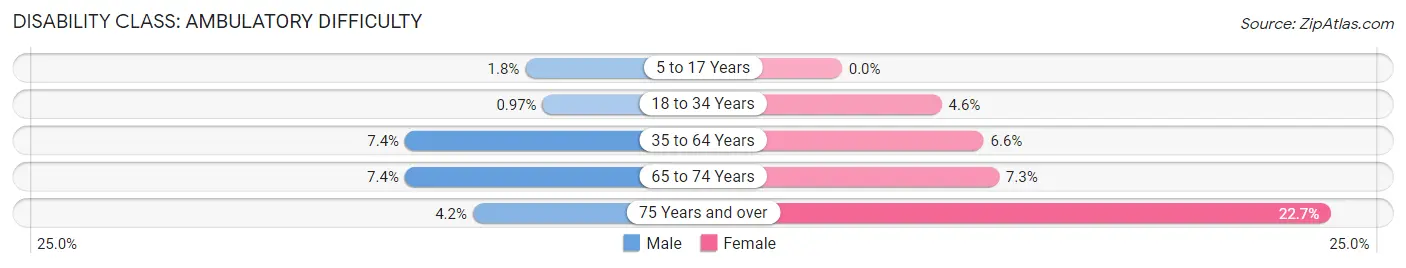
| Age Bracket | Male | Female |
| 5 to 17 Years | 24 (1.8%) | 0 (0.0%) |
| 18 to 34 Years | 14 (1.0%) | 55 (4.6%) |
| 35 to 64 Years | 248 (7.3%) | 207 (6.6%) |
| 65 to 74 Years | 61 (7.4%) | 53 (7.3%) |
| 75 Years and over | 10 (4.2%) | 69 (22.7%) |
Disability Class: Self-Care Difficulty
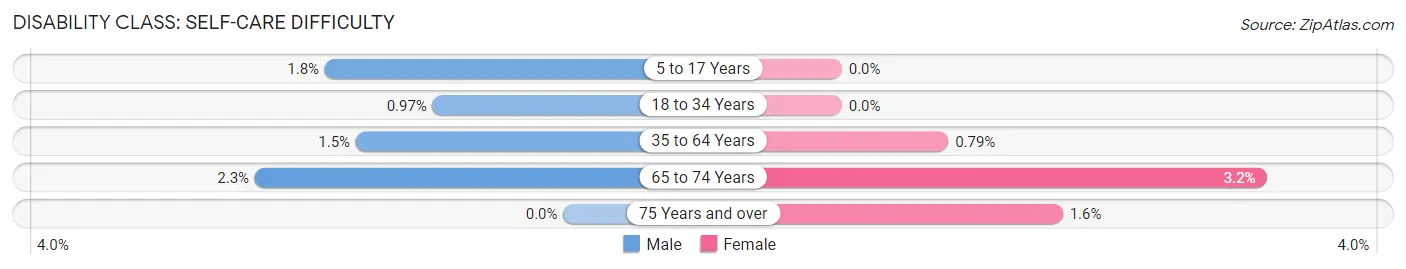
| Age Bracket | Male | Female |
| 5 to 17 Years | 24 (1.8%) | 0 (0.0%) |
| 18 to 34 Years | 14 (1.0%) | 0 (0.0%) |
| 35 to 64 Years | 52 (1.5%) | 25 (0.8%) |
| 65 to 74 Years | 19 (2.3%) | 23 (3.2%) |
| 75 Years and over | 0 (0.0%) | 5 (1.6%) |
Technology Access in Vail
Computing Device Access in Vail
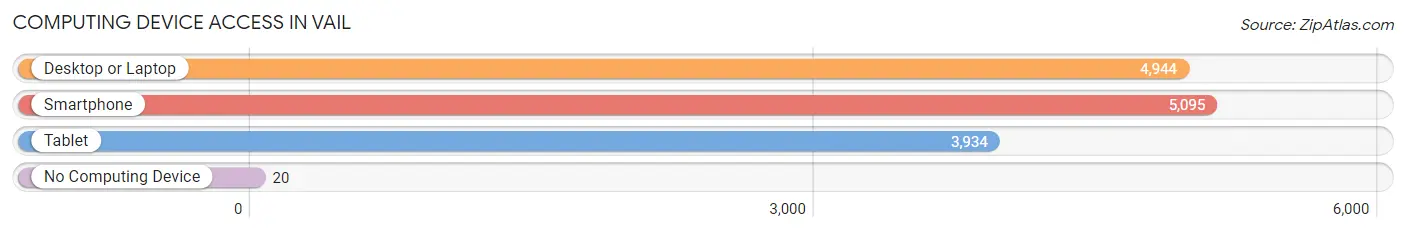
| Device Type | # Households | % Households |
| Desktop or Laptop | 4,944 | 94.7% |
| Smartphone | 5,095 | 97.6% |
| Tablet | 3,934 | 75.3% |
| No Computing Device | 20 | 0.4% |
| Total | 5,221 | 100.0% |
Internet Access in Vail
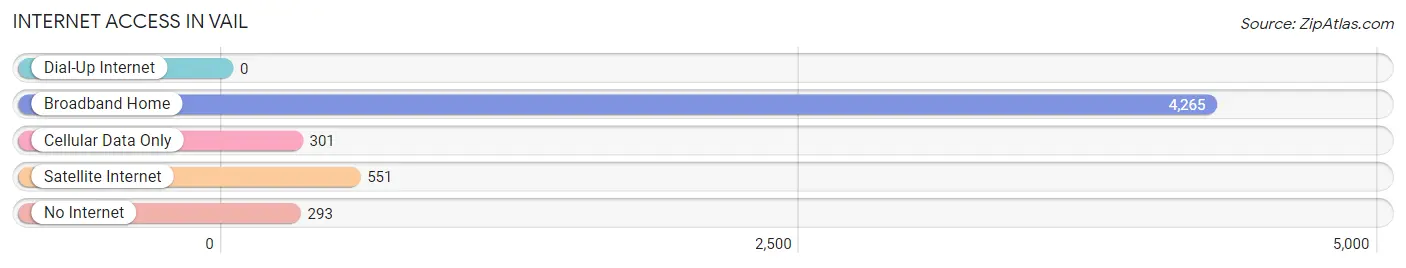
| Internet Type | # Households | % Households |
| Dial-Up Internet | 0 | 0.0% |
| Broadband Home | 4,265 | 81.7% |
| Cellular Data Only | 301 | 5.8% |
| Satellite Internet | 551 | 10.5% |
| No Internet | 293 | 5.6% |
| Total | 5,221 | 100.0% |
Vail Summary
Vail, Arizona is a small town located in the southeastern part of the state, about 25 miles southeast of Tucson. It is situated in the Sonoran Desert, and is surrounded by the Rincon Mountains to the east and the Santa Rita Mountains to the west. The town is located in Pima County, and is part of the Tucson Metropolitan Statistical Area.
History
Vail was founded in the late 1800s by a group of ranchers and farmers who were looking for a place to settle. The town was originally called “Rincon”, but was later changed to “Vail” in honor of the Vail family, who were among the first settlers. The town was officially incorporated in 1974.
Geography
Vail is located in the Sonoran Desert, and is surrounded by the Rincon Mountains to the east and the Santa Rita Mountains to the west. The town is situated at an elevation of 2,637 feet, and has a total area of 8.3 square miles. The climate is arid, with hot summers and mild winters.
Economy
Vail’s economy is largely based on agriculture and tourism. The town is home to several farms and ranches, which produce a variety of crops, including cotton, alfalfa, and wheat. The town is also home to several tourist attractions, including the Arizona-Sonora Desert Museum, the Saguaro National Park, and the Old Tucson Studios.
Demographics
As of the 2010 census, Vail had a population of 10,208. The racial makeup of the town was 79.3% White, 0.7% African American, 0.7% Native American, 0.7% Asian, 0.1% Pacific Islander, 16.2% from other races, and 2.4% from two or more races. Hispanic or Latino of any race were 33.2% of the population.
The median income for a household in Vail was $45,938, and the median income for a family was $50,938. The per capita income for the town was $20,938. About 11.2% of families and 14.2% of the population were below the poverty line, including 18.2% of those under age 18 and 8.2% of those age 65 or over.
Vail is a small town with a rich history and a diverse population. It is home to a variety of businesses and attractions, and is a popular destination for tourists. The town is also home to a number of farms and ranches, which provide a significant source of income for the local economy.
Common Questions
What is Per Capita Income in Vail?
Per Capita income in Vail is $43,646.
What is the Median Family Income in Vail?
Median Family Income in Vail is $130,696.
What is the Median Household income in Vail?
Median Household Income in Vail is $120,179.
What is Income or Wage Gap in Vail?
Income or Wage Gap in Vail is 45.6%.
Women in Vail earn 54.4 cents for every dollar earned by a man.
What is Inequality or Gini Index in Vail?
Inequality or Gini Index in Vail is 0.32.
What is the Total Population of Vail?
Total Population of Vail is 15,248.
What is the Total Male Population of Vail?
Total Male Population of Vail is 8,249.
What is the Total Female Population of Vail?
Total Female Population of Vail is 6,999.
What is the Ratio of Males per 100 Females in Vail?
There are 117.86 Males per 100 Females in Vail.
What is the Ratio of Females per 100 Males in Vail?
There are 84.85 Females per 100 Males in Vail.
What is the Median Population Age in Vail?
Median Population Age in Vail is 39.1 Years.
What is the Average Family Size in Vail
Average Family Size in Vail is 3.2 People.
What is the Average Household Size in Vail
Average Household Size in Vail is 2.9 People.
How Large is the Labor Force in Vail?
There are 7,715 People in the Labor Forcein in Vail.
What is the Percentage of People in the Labor Force in Vail?
66.3% of People are in the Labor Force in Vail.
What is the Unemployment Rate in Vail?
Unemployment Rate in Vail is 1.9%.