Rincon Valley, AZ Map & Demographics
Rincon Valley Map
Rincon Valley Overview
$51,313
PER CAPITA INCOME
$147,220
AVG FAMILY INCOME
$137,500
AVG HOUSEHOLD INCOME
55.3%
WAGE / INCOME GAP [ % ]
44.7¢/ $1
WAGE / INCOME GAP [ $ ]
0.32
INEQUALITY / GINI INDEX
5,712
TOTAL POPULATION
3,036
MALE POPULATION
2,676
FEMALE POPULATION
113.45
MALES / 100 FEMALES
88.14
FEMALES / 100 MALES
44.8
MEDIAN AGE
3.1
AVG FAMILY SIZE
2.8
AVG HOUSEHOLD SIZE
2,494
LABOR FORCE [ PEOPLE ]
53.6%
PERCENT IN LABOR FORCE
1.8%
UNEMPLOYMENT RATE
Income in Rincon Valley
Income Overview in Rincon Valley
Per Capita Income in Rincon Valley is $51,313, while median incomes of families and households are $147,220 and $137,500 respectively.
| Characteristic | Number | Measure |
| Per Capita Income | 5,712 | $51,313 |
| Median Family Income | 1,647 | $147,220 |
| Mean Family Income | 1,647 | $148,846 |
| Median Household Income | 2,024 | $137,500 |
| Mean Household Income | 2,024 | $141,389 |
| Income Deficit | 1,647 | $0 |
| Wage / Income Gap (%) | 5,712 | 55.28% |
| Wage / Income Gap ($) | 5,712 | 44.72¢ per $1 |
| Gini / Inequality Index | 5,712 | 0.32 |
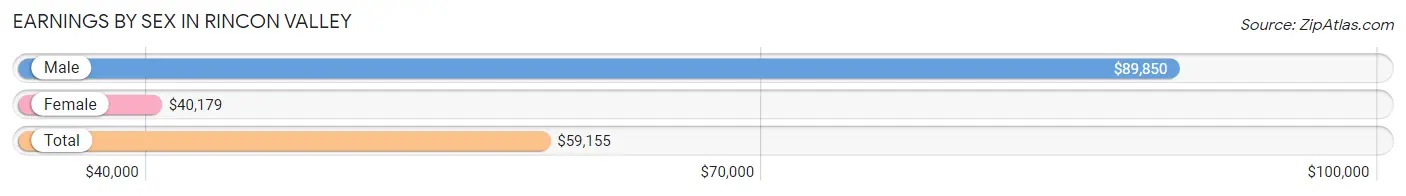
Earnings by Sex in Rincon Valley
Average Earnings in Rincon Valley are $59,155, $89,850 for men and $40,179 for women, a difference of 55.3%.
| Sex | Number | Average Earnings |
| Male | 1,415 (53.5%) | $89,850 |
| Female | 1,229 (46.5%) | $40,179 |
| Total | 2,644 (100.0%) | $59,155 |
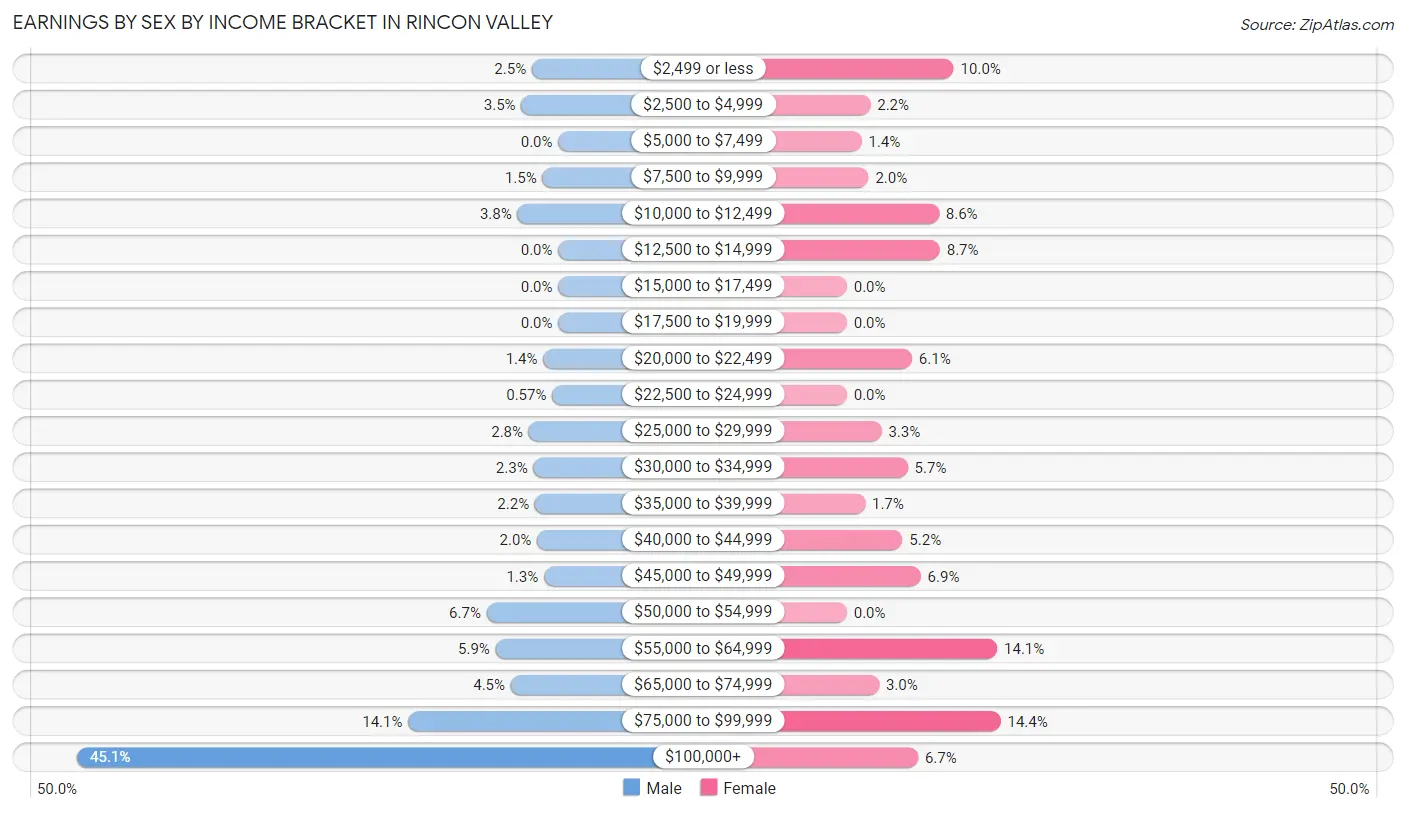
Earnings by Sex by Income Bracket in Rincon Valley
The most common earnings brackets in Rincon Valley are $100,000+ for men (638 | 45.1%) and $75,000 to $99,999 for women (177 | 14.4%).
| Income | Male | Female |
| $2,499 or less | 35 (2.5%) | 123 (10.0%) |
| $2,500 to $4,999 | 49 (3.5%) | 27 (2.2%) |
| $5,000 to $7,499 | 0 (0.0%) | 17 (1.4%) |
| $7,500 to $9,999 | 21 (1.5%) | 25 (2.0%) |
| $10,000 to $12,499 | 54 (3.8%) | 106 (8.6%) |
| $12,500 to $14,999 | 0 (0.0%) | 107 (8.7%) |
| $15,000 to $17,499 | 0 (0.0%) | 0 (0.0%) |
| $17,500 to $19,999 | 0 (0.0%) | 0 (0.0%) |
| $20,000 to $22,499 | 20 (1.4%) | 75 (6.1%) |
| $22,500 to $24,999 | 8 (0.6%) | 0 (0.0%) |
| $25,000 to $29,999 | 39 (2.8%) | 40 (3.3%) |
| $30,000 to $34,999 | 33 (2.3%) | 70 (5.7%) |
| $35,000 to $39,999 | 31 (2.2%) | 21 (1.7%) |
| $40,000 to $44,999 | 28 (2.0%) | 64 (5.2%) |
| $45,000 to $49,999 | 19 (1.3%) | 85 (6.9%) |
| $50,000 to $54,999 | 95 (6.7%) | 0 (0.0%) |
| $55,000 to $64,999 | 83 (5.9%) | 173 (14.1%) |
| $65,000 to $74,999 | 63 (4.4%) | 37 (3.0%) |
| $75,000 to $99,999 | 199 (14.1%) | 177 (14.4%) |
| $100,000+ | 638 (45.1%) | 82 (6.7%) |
| Total | 1,415 (100.0%) | 1,229 (100.0%) |
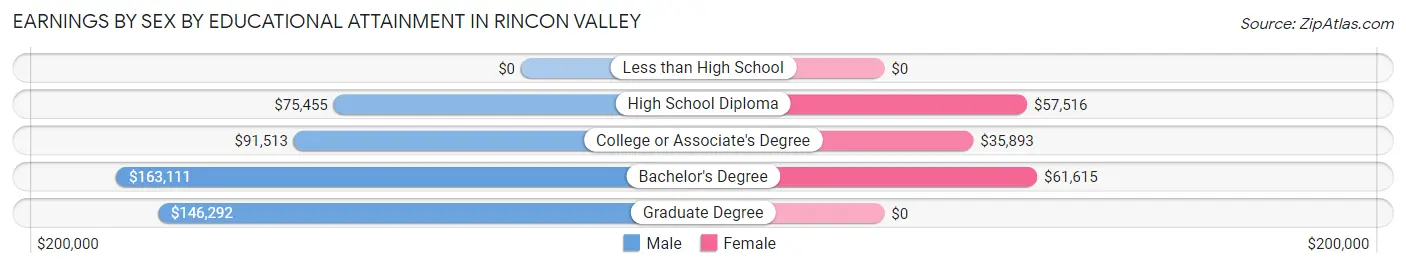
Earnings by Sex by Educational Attainment in Rincon Valley
Average earnings in Rincon Valley are $103,382 for men and $46,265 for women, a difference of 55.2%. Men with an educational attainment of bachelor's degree enjoy the highest average annual earnings of $163,111, while those with high school diploma education earn the least with $75,455. Women with an educational attainment of bachelor's degree earn the most with the average annual earnings of $61,615, while those with college or associate's degree education have the smallest earnings of $35,893.
| Educational Attainment | Male Income | Female Income |
| Less than High School | - | - |
| High School Diploma | $75,455 | $57,516 |
| College or Associate's Degree | $91,513 | $35,893 |
| Bachelor's Degree | $163,111 | $61,615 |
| Graduate Degree | $146,292 | $0 |
| Total | $103,382 | $46,265 |
Family Income in Rincon Valley
Family Income Brackets in Rincon Valley
According to the Rincon Valley family income data, there are 422 families falling into the $200,000+ income range, which is the most common income bracket and makes up 25.6% of all families.
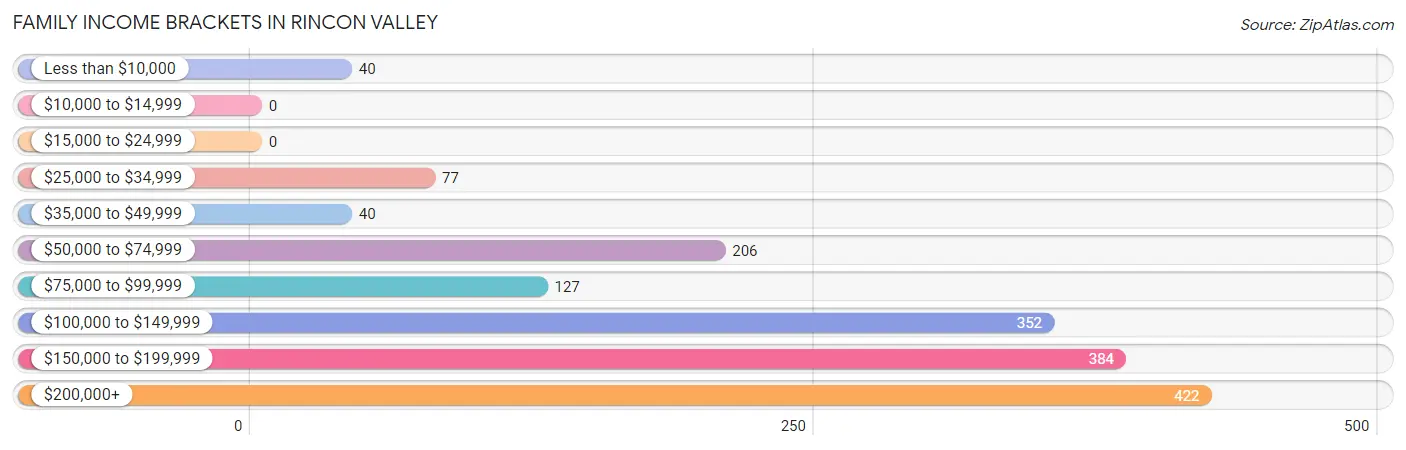
| Income Bracket | # Families | % Families |
| Less than $10,000 | 40 | 2.4% |
| $10,000 to $14,999 | 0 | 0.0% |
| $15,000 to $24,999 | 0 | 0.0% |
| $25,000 to $34,999 | 77 | 4.7% |
| $35,000 to $49,999 | 40 | 2.4% |
| $50,000 to $74,999 | 206 | 12.5% |
| $75,000 to $99,999 | 127 | 7.7% |
| $100,000 to $149,999 | 352 | 21.4% |
| $150,000 to $199,999 | 384 | 23.3% |
| $200,000+ | 422 | 25.6% |
Family Income by Famaliy Size in Rincon Valley
4-person families (227 | 13.8%) account for the highest median family income in Rincon Valley with $185,481 per family, while 3-person families (394 | 23.9%) have the highest median income of $56,983 per family member.
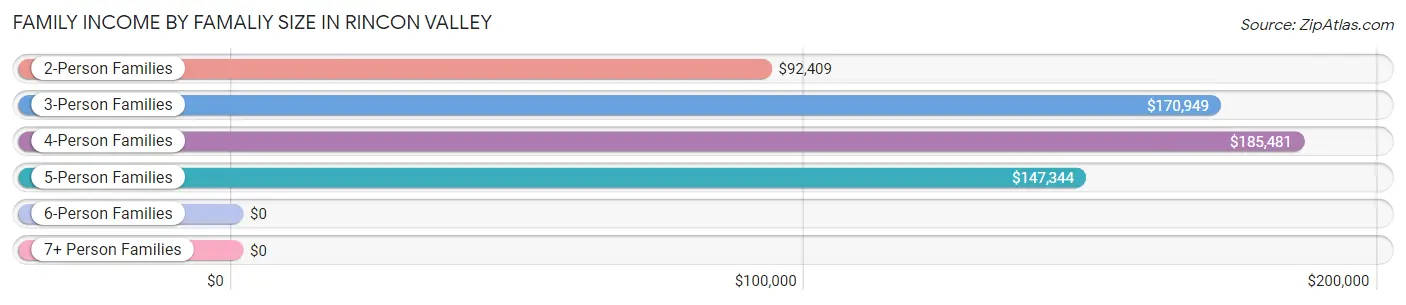
| Income Bracket | # Families | Median Income |
| 2-Person Families | 823 (50.0%) | $92,409 |
| 3-Person Families | 394 (23.9%) | $170,949 |
| 4-Person Families | 227 (13.8%) | $185,481 |
| 5-Person Families | 151 (9.2%) | $147,344 |
| 6-Person Families | 52 (3.2%) | $0 |
| 7+ Person Families | 0 (0.0%) | $0 |
| Total | 1,647 (100.0%) | $147,220 |
Family Income by Number of Earners in Rincon Valley
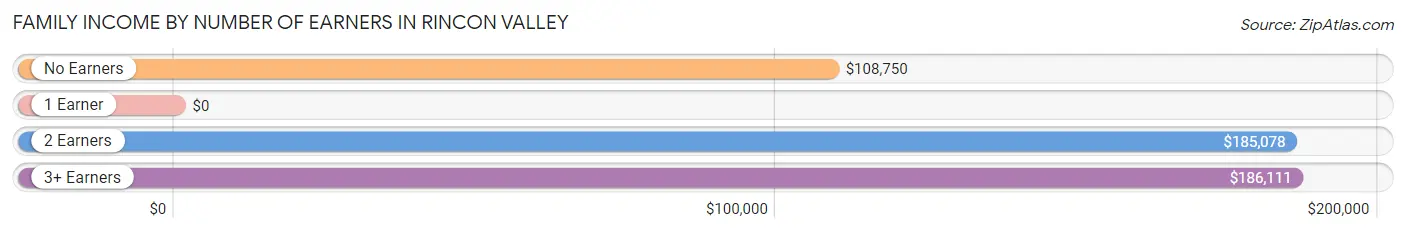
| Number of Earners | # Families | Median Income |
| No Earners | 432 (26.2%) | $108,750 |
| 1 Earner | 495 (30.0%) | $0 |
| 2 Earners | 530 (32.2%) | $185,078 |
| 3+ Earners | 190 (11.5%) | $186,111 |
| Total | 1,647 (100.0%) | $147,220 |
Household Income in Rincon Valley
Household Income Brackets in Rincon Valley
With 463 households falling in the category, the $200,000+ income range is the most frequent in Rincon Valley, accounting for 22.9% of all households.
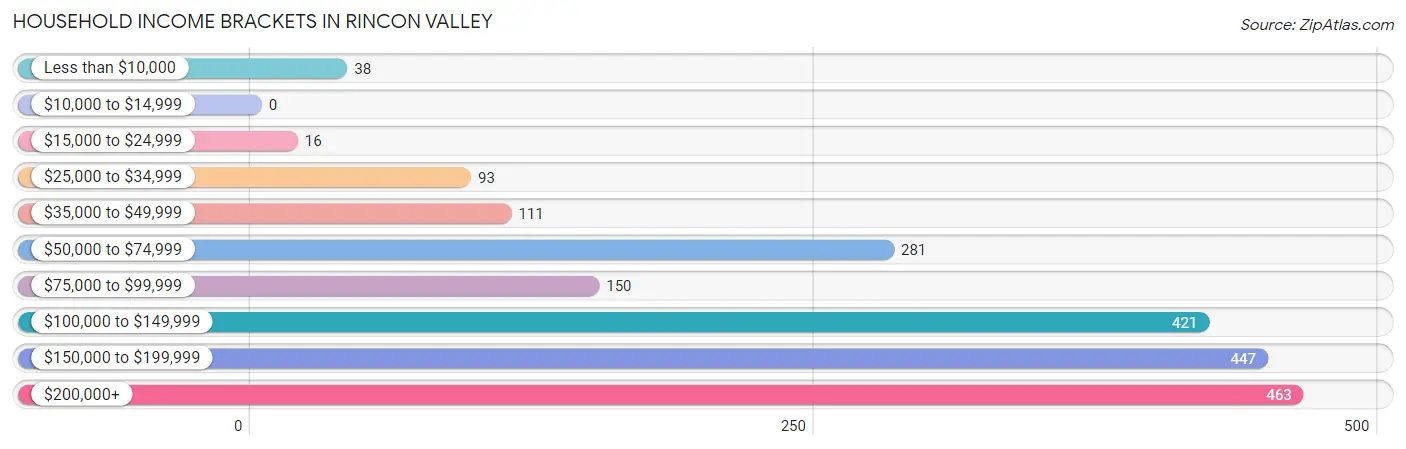
| Income Bracket | # Households | % Households |
| Less than $10,000 | 38 | 1.9% |
| $10,000 to $14,999 | 0 | 0.0% |
| $15,000 to $24,999 | 16 | 0.8% |
| $25,000 to $34,999 | 93 | 4.6% |
| $35,000 to $49,999 | 111 | 5.5% |
| $50,000 to $74,999 | 281 | 13.9% |
| $75,000 to $99,999 | 150 | 7.4% |
| $100,000 to $149,999 | 421 | 20.8% |
| $150,000 to $199,999 | 447 | 22.1% |
| $200,000+ | 463 | 22.9% |
Household Income by Householder Age in Rincon Valley
The median household income in Rincon Valley is $137,500, with the highest median household income of $171,123 found in the 45 to 64 years age bracket for the primary householder. A total of 879 households (43.4%) fall into this category.
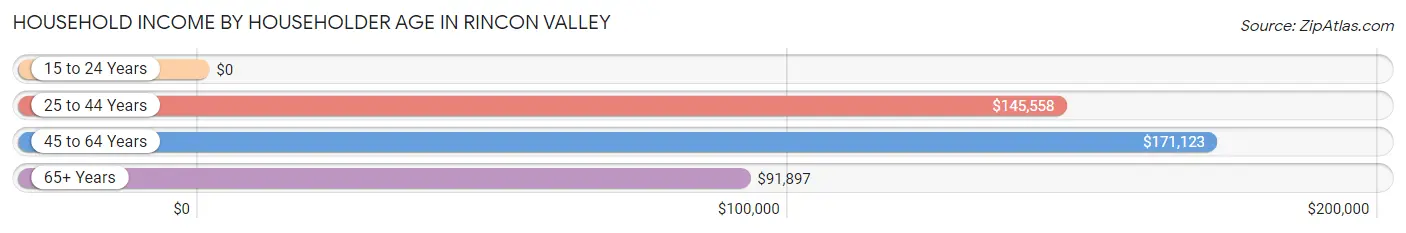
| Income Bracket | # Households | Median Income |
| 15 to 24 Years | 0 (0.0%) | $0 |
| 25 to 44 Years | 495 (24.5%) | $145,558 |
| 45 to 64 Years | 879 (43.4%) | $171,123 |
| 65+ Years | 650 (32.1%) | $91,897 |
| Total | 2,024 (100.0%) | $137,500 |
Poverty in Rincon Valley
Income Below Poverty by Sex and Age in Rincon Valley
With 2.2% poverty level for males and 3.6% for females among the residents of Rincon Valley, 16 and 17 year old males and 15 year old females are the most vulnerable to poverty, with 20 males (10.7%) and 20 females (100.0%) in their respective age groups living below the poverty level.
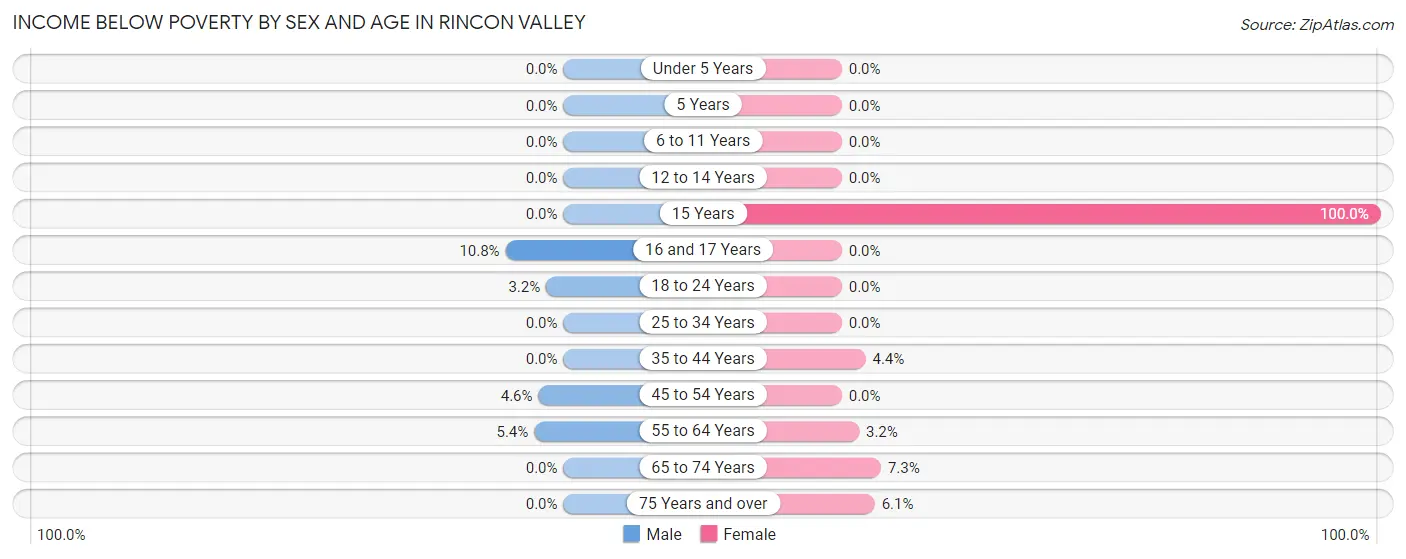
| Age Bracket | Male | Female |
| Under 5 Years | 0 (0.0%) | 0 (0.0%) |
| 5 Years | 0 (0.0%) | 0 (0.0%) |
| 6 to 11 Years | 0 (0.0%) | 0 (0.0%) |
| 12 to 14 Years | 0 (0.0%) | 0 (0.0%) |
| 15 Years | 0 (0.0%) | 20 (100.0%) |
| 16 and 17 Years | 20 (10.7%) | 0 (0.0%) |
| 18 to 24 Years | 6 (3.2%) | 0 (0.0%) |
| 25 to 34 Years | 0 (0.0%) | 0 (0.0%) |
| 35 to 44 Years | 0 (0.0%) | 22 (4.4%) |
| 45 to 54 Years | 20 (4.6%) | 0 (0.0%) |
| 55 to 64 Years | 20 (5.4%) | 18 (3.2%) |
| 65 to 74 Years | 0 (0.0%) | 21 (7.3%) |
| 75 Years and over | 0 (0.0%) | 16 (6.1%) |
| Total | 66 (2.2%) | 97 (3.6%) |
Income Above Poverty by Sex and Age in Rincon Valley
According to the poverty statistics in Rincon Valley, males aged under 5 years and females aged under 5 years are the age groups that are most secure financially, with 100.0% of males and 100.0% of females in these age groups living above the poverty line.
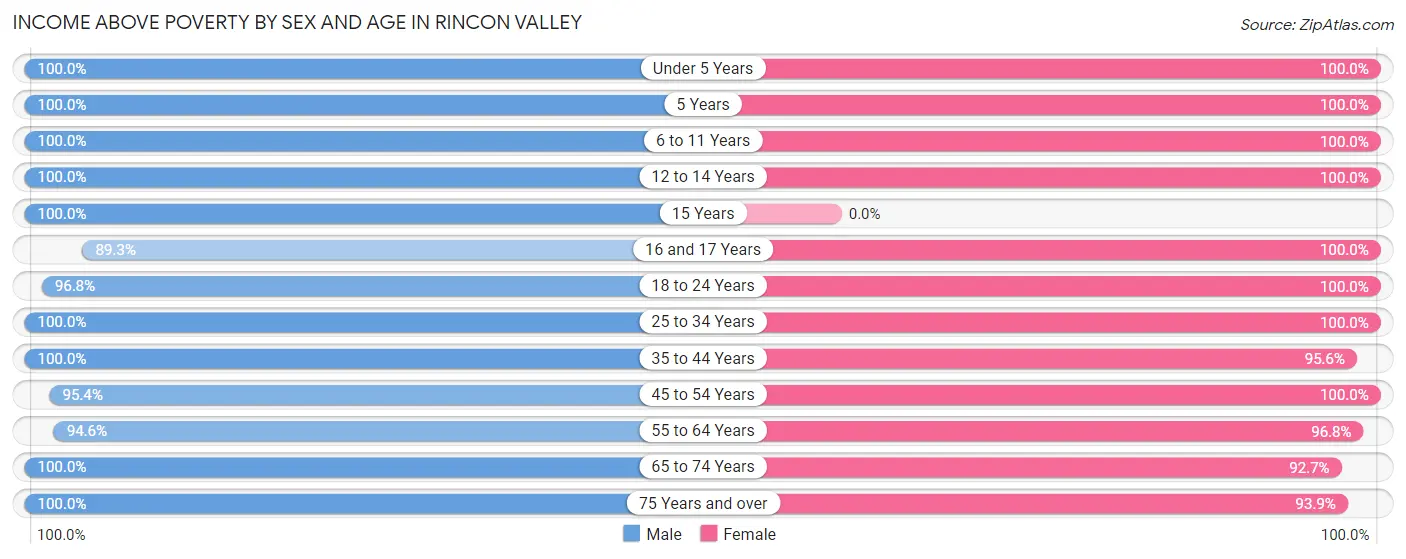
| Age Bracket | Male | Female |
| Under 5 Years | 132 (100.0%) | 35 (100.0%) |
| 5 Years | 23 (100.0%) | 21 (100.0%) |
| 6 to 11 Years | 415 (100.0%) | 118 (100.0%) |
| 12 to 14 Years | 101 (100.0%) | 154 (100.0%) |
| 15 Years | 22 (100.0%) | 0 (0.0%) |
| 16 and 17 Years | 166 (89.2%) | 165 (100.0%) |
| 18 to 24 Years | 181 (96.8%) | 177 (100.0%) |
| 25 to 34 Years | 91 (100.0%) | 131 (100.0%) |
| 35 to 44 Years | 389 (100.0%) | 477 (95.6%) |
| 45 to 54 Years | 411 (95.4%) | 243 (100.0%) |
| 55 to 64 Years | 349 (94.6%) | 544 (96.8%) |
| 65 to 74 Years | 291 (100.0%) | 268 (92.7%) |
| 75 Years and over | 381 (100.0%) | 246 (93.9%) |
| Total | 2,952 (97.8%) | 2,579 (96.4%) |
Income Below Poverty Among Married-Couple Families in Rincon Valley
The poverty statistics for married-couple families in Rincon Valley show that 1.3% or 19 of the total 1,465 families live below the poverty line. Families with no children have the highest poverty rate of 2.1%, comprising of 19 families. On the other hand, families with 1 or 2 children have the lowest poverty rate of 0.0%, which includes 0 families.
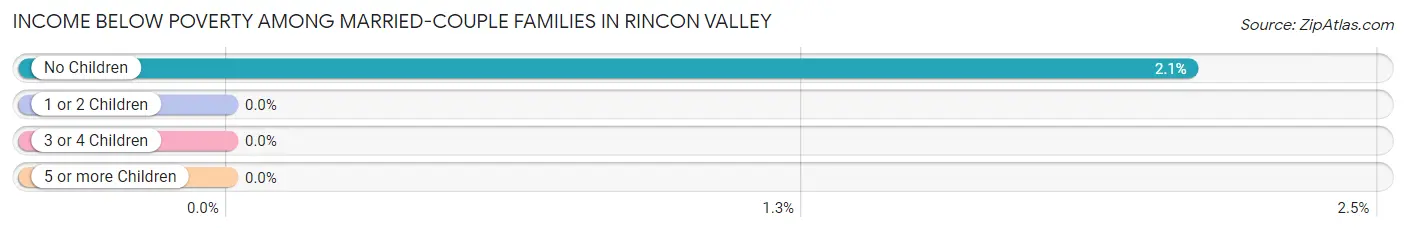
| Children | Above Poverty | Below Poverty |
| No Children | 891 (97.9%) | 19 (2.1%) |
| 1 or 2 Children | 403 (100.0%) | 0 (0.0%) |
| 3 or 4 Children | 152 (100.0%) | 0 (0.0%) |
| 5 or more Children | 0 (0.0%) | 0 (0.0%) |
| Total | 1,446 (98.7%) | 19 (1.3%) |
Income Below Poverty Among Single-Parent Households in Rincon Valley
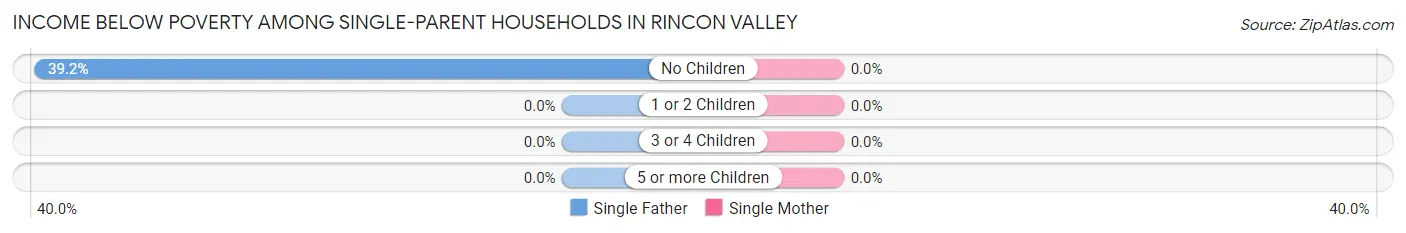
| Children | Single Father | Single Mother |
| No Children | 20 (39.2%) | 0 (0.0%) |
| 1 or 2 Children | 0 (0.0%) | 0 (0.0%) |
| 3 or 4 Children | 0 (0.0%) | 0 (0.0%) |
| 5 or more Children | 0 (0.0%) | 0 (0.0%) |
| Total | 20 (22.7%) | 0 (0.0%) |
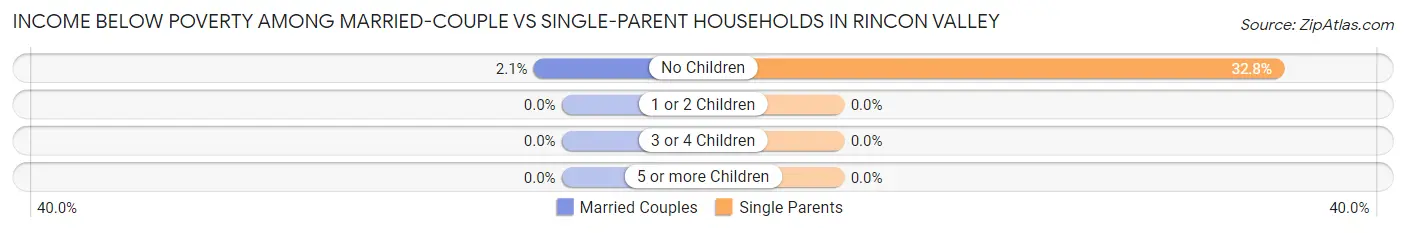
Income Below Poverty Among Married-Couple vs Single-Parent Households in Rincon Valley
The poverty data for Rincon Valley shows that 19 of the married-couple family households (1.3%) and 20 of the single-parent households (11.0%) are living below the poverty level. Within the married-couple family households, those with no children have the highest poverty rate, with 19 households (2.1%) falling below the poverty line. Among the single-parent households, those with no children have the highest poverty rate, with 20 household (32.8%) living below poverty.
| Children | Married-Couple Families | Single-Parent Households |
| No Children | 19 (2.1%) | 20 (32.8%) |
| 1 or 2 Children | 0 (0.0%) | 0 (0.0%) |
| 3 or 4 Children | 0 (0.0%) | 0 (0.0%) |
| 5 or more Children | 0 (0.0%) | 0 (0.0%) |
| Total | 19 (1.3%) | 20 (11.0%) |
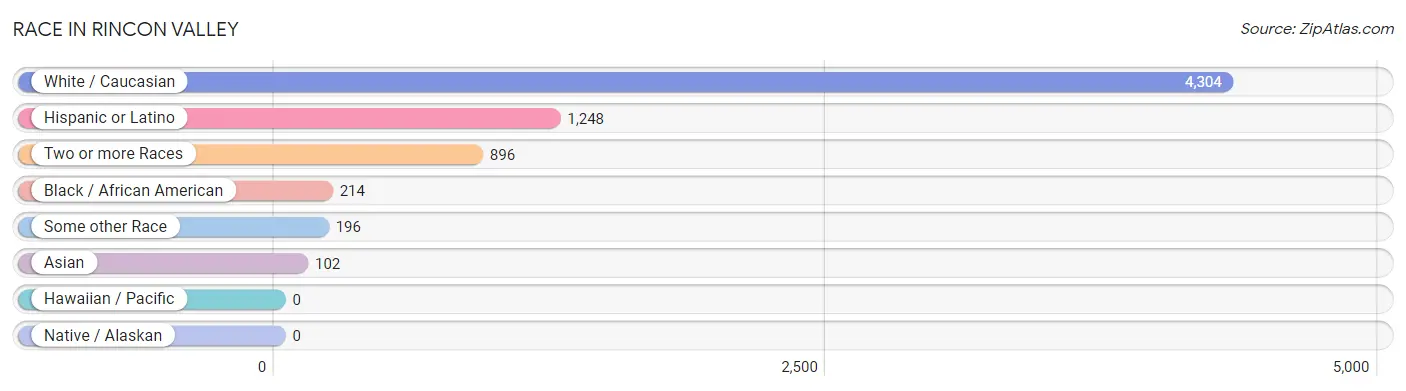
Race in Rincon Valley
The most populous races in Rincon Valley are White / Caucasian (4,304 | 75.3%), Hispanic or Latino (1,248 | 21.8%), and Two or more Races (896 | 15.7%).
| Race | # Population | % Population |
| Asian | 102 | 1.8% |
| Black / African American | 214 | 3.7% |
| Hawaiian / Pacific | 0 | 0.0% |
| Hispanic or Latino | 1,248 | 21.8% |
| Native / Alaskan | 0 | 0.0% |
| White / Caucasian | 4,304 | 75.3% |
| Two or more Races | 896 | 15.7% |
| Some other Race | 196 | 3.4% |
| Total | 5,712 | 100.0% |
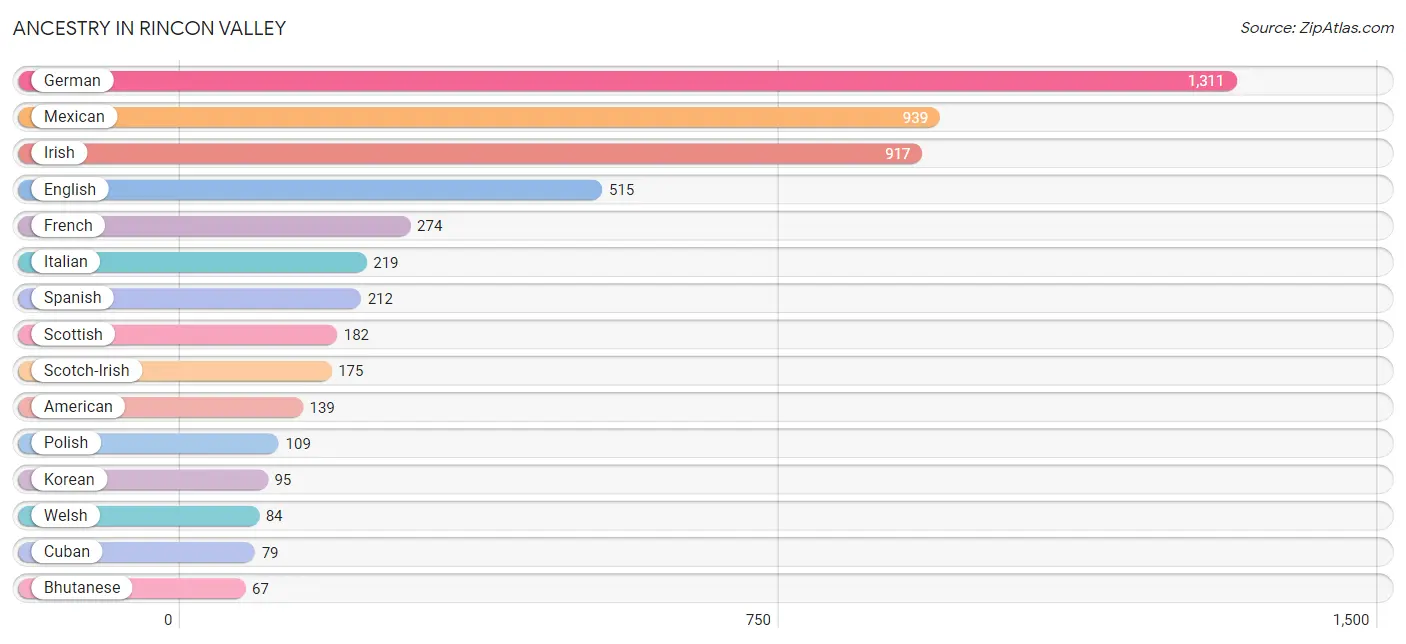
Ancestry in Rincon Valley
The most populous ancestries reported in Rincon Valley are German (1,311 | 23.0%), Mexican (939 | 16.4%), Irish (917 | 16.1%), English (515 | 9.0%), and French (274 | 4.8%), together accounting for 69.3% of all Rincon Valley residents.
| Ancestry | # Population | % Population |
| African | 36 | 0.6% |
| American | 139 | 2.4% |
| Arab | 40 | 0.7% |
| Armenian | 16 | 0.3% |
| Bhutanese | 67 | 1.2% |
| Blackfeet | 15 | 0.3% |
| British | 42 | 0.7% |
| Burmese | 39 | 0.7% |
| Cuban | 79 | 1.4% |
| Danish | 37 | 0.6% |
| Dutch | 29 | 0.5% |
| Eastern European | 16 | 0.3% |
| English | 515 | 9.0% |
| European | 66 | 1.2% |
| French | 274 | 4.8% |
| German | 1,311 | 23.0% |
| Greek | 17 | 0.3% |
| Hungarian | 35 | 0.6% |
| Irish | 917 | 16.1% |
| Israeli | 47 | 0.8% |
| Italian | 219 | 3.8% |
| Korean | 95 | 1.7% |
| Lebanese | 40 | 0.7% |
| Lithuanian | 33 | 0.6% |
| Mexican | 939 | 16.4% |
| Polish | 109 | 1.9% |
| Russian | 23 | 0.4% |
| Scandinavian | 21 | 0.4% |
| Scotch-Irish | 175 | 3.1% |
| Scottish | 182 | 3.2% |
| Slovak | 25 | 0.4% |
| Spaniard | 18 | 0.3% |
| Spanish | 212 | 3.7% |
| Sri Lankan | 14 | 0.3% |
| Subsaharan African | 36 | 0.6% |
| Swedish | 34 | 0.6% |
| Swiss | 12 | 0.2% |
| Welsh | 84 | 1.5% | View All 38 Rows |
Immigrants in Rincon Valley
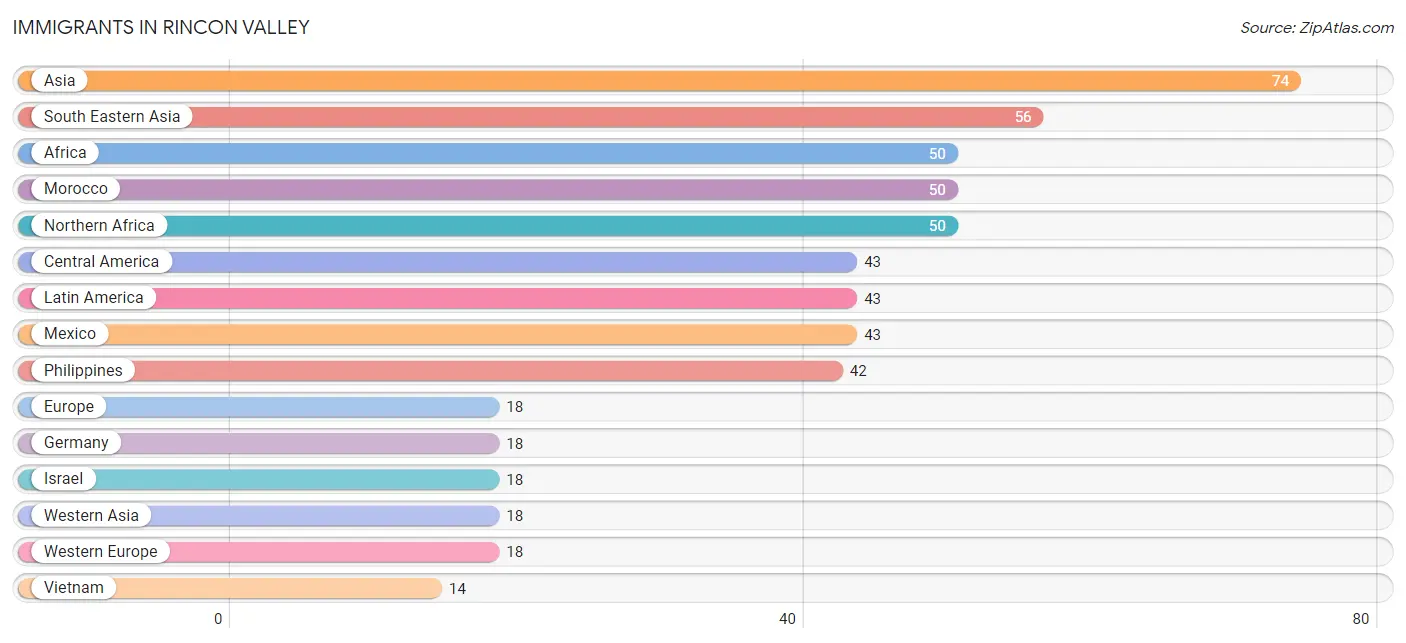
The most numerous immigrant groups reported in Rincon Valley came from Asia (74 | 1.3%), South Eastern Asia (56 | 1.0%), Africa (50 | 0.9%), Morocco (50 | 0.9%), and Northern Africa (50 | 0.9%), together accounting for 4.9% of all Rincon Valley residents.
| Immigration Origin | # Population | % Population |
| Africa | 50 | 0.9% |
| Asia | 74 | 1.3% |
| Central America | 43 | 0.7% |
| Europe | 18 | 0.3% |
| Germany | 18 | 0.3% |
| Israel | 18 | 0.3% |
| Latin America | 43 | 0.7% |
| Mexico | 43 | 0.7% |
| Morocco | 50 | 0.9% |
| Northern Africa | 50 | 0.9% |
| Philippines | 42 | 0.7% |
| South Eastern Asia | 56 | 1.0% |
| Vietnam | 14 | 0.3% |
| Western Asia | 18 | 0.3% |
| Western Europe | 18 | 0.3% | View All 15 Rows |
Sex and Age in Rincon Valley
Sex and Age in Rincon Valley
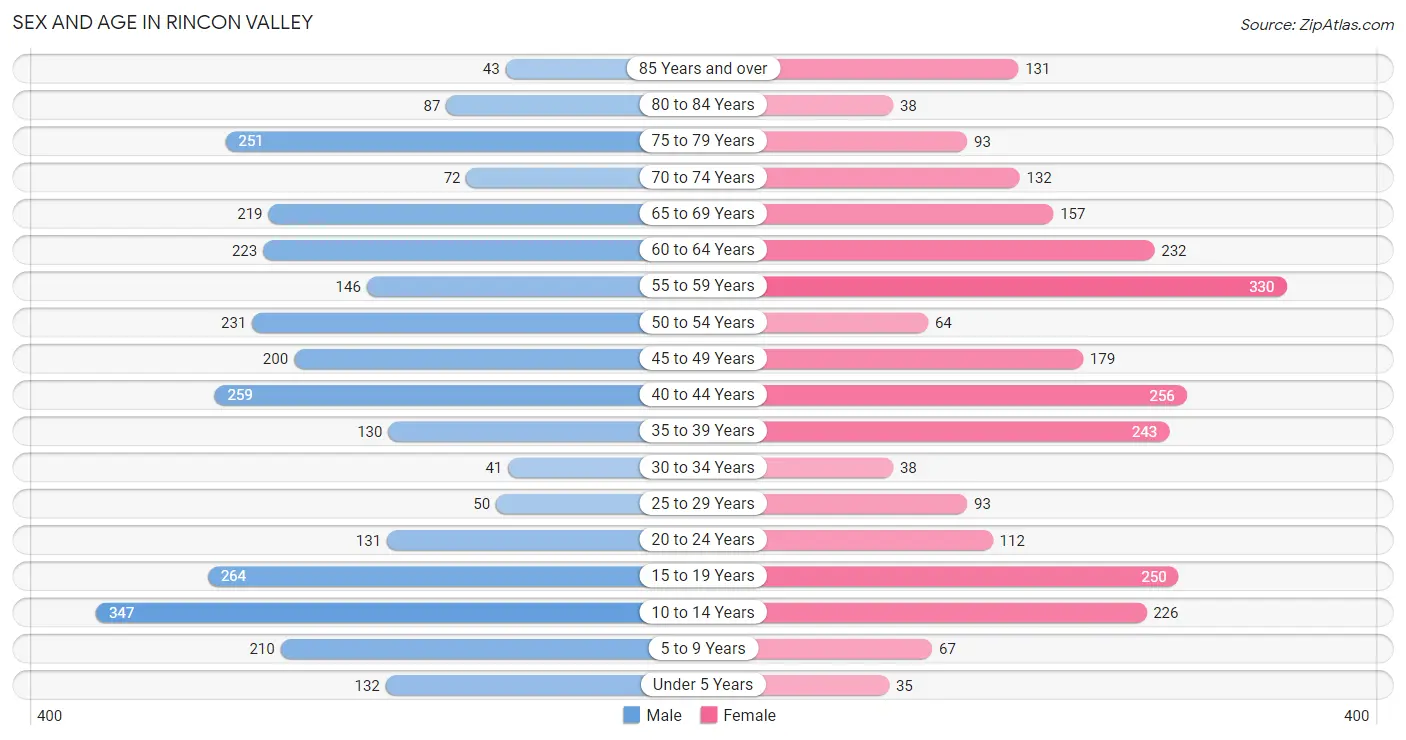
The most populous age groups in Rincon Valley are 10 to 14 Years (347 | 11.4%) for men and 55 to 59 Years (330 | 12.3%) for women.
| Age Bracket | Male | Female |
| Under 5 Years | 132 (4.3%) | 35 (1.3%) |
| 5 to 9 Years | 210 (6.9%) | 67 (2.5%) |
| 10 to 14 Years | 347 (11.4%) | 226 (8.5%) |
| 15 to 19 Years | 264 (8.7%) | 250 (9.3%) |
| 20 to 24 Years | 131 (4.3%) | 112 (4.2%) |
| 25 to 29 Years | 50 (1.7%) | 93 (3.5%) |
| 30 to 34 Years | 41 (1.3%) | 38 (1.4%) |
| 35 to 39 Years | 130 (4.3%) | 243 (9.1%) |
| 40 to 44 Years | 259 (8.5%) | 256 (9.6%) |
| 45 to 49 Years | 200 (6.6%) | 179 (6.7%) |
| 50 to 54 Years | 231 (7.6%) | 64 (2.4%) |
| 55 to 59 Years | 146 (4.8%) | 330 (12.3%) |
| 60 to 64 Years | 223 (7.3%) | 232 (8.7%) |
| 65 to 69 Years | 219 (7.2%) | 157 (5.9%) |
| 70 to 74 Years | 72 (2.4%) | 132 (4.9%) |
| 75 to 79 Years | 251 (8.3%) | 93 (3.5%) |
| 80 to 84 Years | 87 (2.9%) | 38 (1.4%) |
| 85 Years and over | 43 (1.4%) | 131 (4.9%) |
| Total | 3,036 (100.0%) | 2,676 (100.0%) |
Families and Households in Rincon Valley
Median Family Size in Rincon Valley
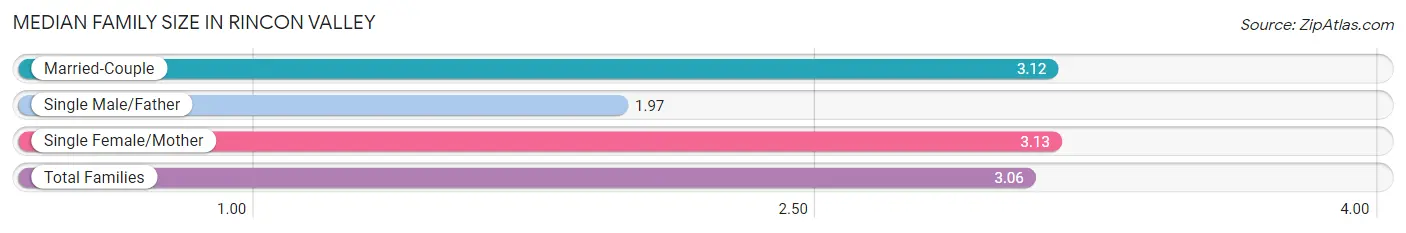
The median family size in Rincon Valley is 3.06 persons per family, with single female/mother families (94 | 5.7%) accounting for the largest median family size of 3.13 persons per family. On the other hand, single male/father families (88 | 5.3%) represent the smallest median family size with 1.97 persons per family.
| Family Type | # Families | Family Size |
| Married-Couple | 1,465 (88.9%) | 3.12 |
| Single Male/Father | 88 (5.3%) | 1.97 |
| Single Female/Mother | 94 (5.7%) | 3.13 |
| Total Families | 1,647 (100.0%) | 3.06 |
Median Household Size in Rincon Valley
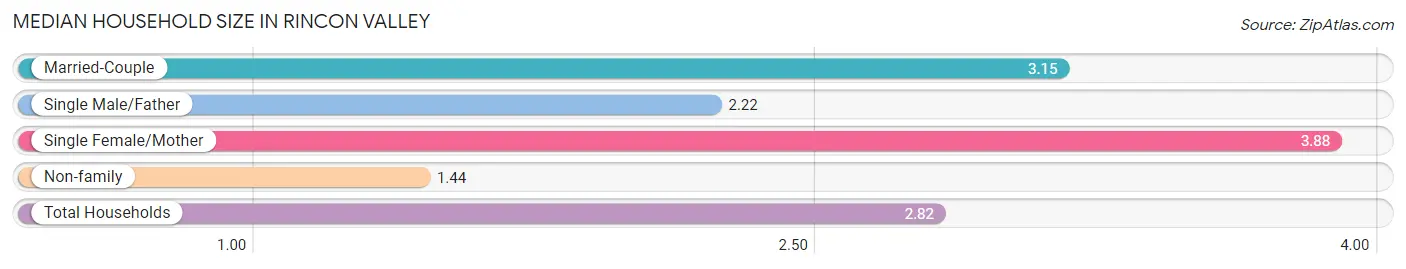
The median household size in Rincon Valley is 2.82 persons per household, with single female/mother households (94 | 4.6%) accounting for the largest median household size of 3.88 persons per household. non-family households (377 | 18.6%) represent the smallest median household size with 1.44 persons per household.
| Household Type | # Households | Household Size |
| Married-Couple | 1,465 (72.4%) | 3.15 |
| Single Male/Father | 88 (4.3%) | 2.22 |
| Single Female/Mother | 94 (4.6%) | 3.88 |
| Non-family | 377 (18.6%) | 1.44 |
| Total Households | 2,024 (100.0%) | 2.82 |
Household Size by Marriage Status in Rincon Valley
Out of a total of 2,024 households in Rincon Valley, 1,647 (81.4%) are family households, while 377 (18.6%) are nonfamily households. The most numerous type of family households are 2-person households, comprising 762, and the most common type of nonfamily households are 1-person households, comprising 211.
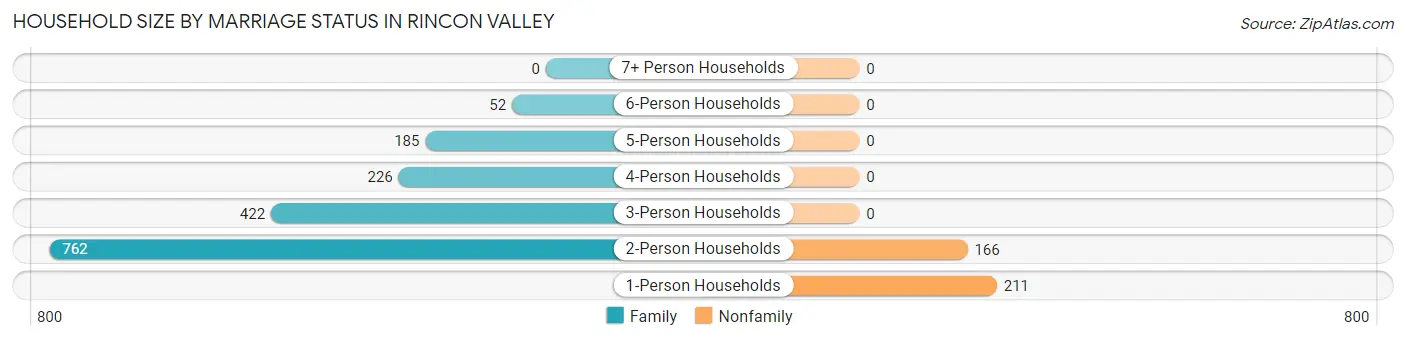
| Household Size | Family Households | Nonfamily Households |
| 1-Person Households | - | 211 (10.4%) |
| 2-Person Households | 762 (37.7%) | 166 (8.2%) |
| 3-Person Households | 422 (20.8%) | 0 (0.0%) |
| 4-Person Households | 226 (11.2%) | 0 (0.0%) |
| 5-Person Households | 185 (9.1%) | 0 (0.0%) |
| 6-Person Households | 52 (2.6%) | 0 (0.0%) |
| 7+ Person Households | 0 (0.0%) | 0 (0.0%) |
| Total | 1,647 (81.4%) | 377 (18.6%) |
Female Fertility in Rincon Valley
Fertility by Age in Rincon Valley
| Age Bracket | Women with Births | Births / 1,000 Women |
| 15 to 19 years | 0 (0.0%) | 0.0 |
| 20 to 34 years | 0 (0.0%) | 0.0 |
| 35 to 50 years | 0 (0.0%) | 0.0 |
| Total | 0 (0.0%) | 0.0 |
Fertility by Age by Marriage Status in Rincon Valley
| Age Bracket | Married | Unmarried |
| 15 to 19 years | 0 (0.0%) | 0 (0.0%) |
| 20 to 34 years | 0 (0.0%) | 0 (0.0%) |
| 35 to 50 years | 0 (0.0%) | 0 (0.0%) |
| Total | 0 (0.0%) | 0 (0.0%) |
Fertility by Education in Rincon Valley
| Educational Attainment | Women with Births | Births / 1,000 Women |
| Less than High School | 0 (0.0%) | 0.0 |
| High School Diploma | 0 (0.0%) | 0.0 |
| College or Associate's Degree | 0 (0.0%) | 0.0 |
| Bachelor's Degree | 0 (0.0%) | 0.0 |
| Graduate Degree | 0 (0.0%) | 0.0 |
| Total | 0 (0.0%) | 0.0 |
Fertility by Education by Marriage Status in Rincon Valley
| Educational Attainment | Married | Unmarried |
| Less than High School | 0 (0.0%) | 0 (0.0%) |
| High School Diploma | 0 (0.0%) | 0 (0.0%) |
| College or Associate's Degree | 0 (0.0%) | 0 (0.0%) |
| Bachelor's Degree | 0 (0.0%) | 0 (0.0%) |
| Graduate Degree | 0 (0.0%) | 0 (0.0%) |
| Total | 0 (0.0%) | 0 (0.0%) |
Employment Characteristics in Rincon Valley
Employment by Class of Employer in Rincon Valley
Among the 2,382 employed individuals in Rincon Valley, private company employees (1,456 | 61.1%), self-employed (not incorporated) (221 | 9.3%), and federal government employees (218 | 9.1%) make up the most common classes of employment.
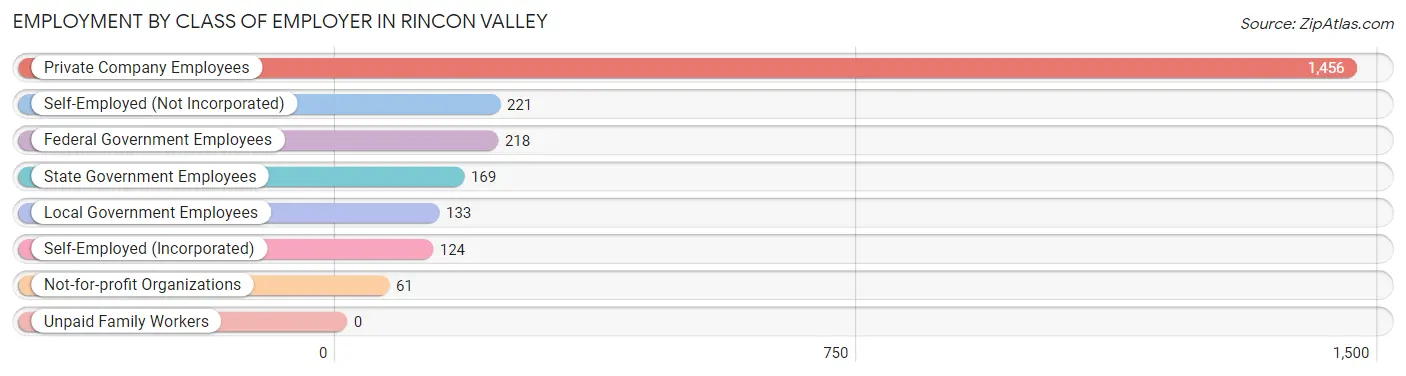
| Employer Class | # Employees | % Employees |
| Private Company Employees | 1,456 | 61.1% |
| Self-Employed (Incorporated) | 124 | 5.2% |
| Self-Employed (Not Incorporated) | 221 | 9.3% |
| Not-for-profit Organizations | 61 | 2.6% |
| Local Government Employees | 133 | 5.6% |
| State Government Employees | 169 | 7.1% |
| Federal Government Employees | 218 | 9.1% |
| Unpaid Family Workers | 0 | 0.0% |
| Total | 2,382 | 100.0% |
Employment Status by Age in Rincon Valley
According to the labor force statistics for Rincon Valley, out of the total population over 16 years of age (4,653), 53.6% or 2,494 individuals are in the labor force, with 1.8% or 45 of them unemployed. The age group with the highest labor force participation rate is 30 to 34 years, with 100.0% or 79 individuals in the labor force. Within the labor force, the 25 to 29 years age range has the highest percentage of unemployed individuals, with 13.1% or 17 of them being unemployed.
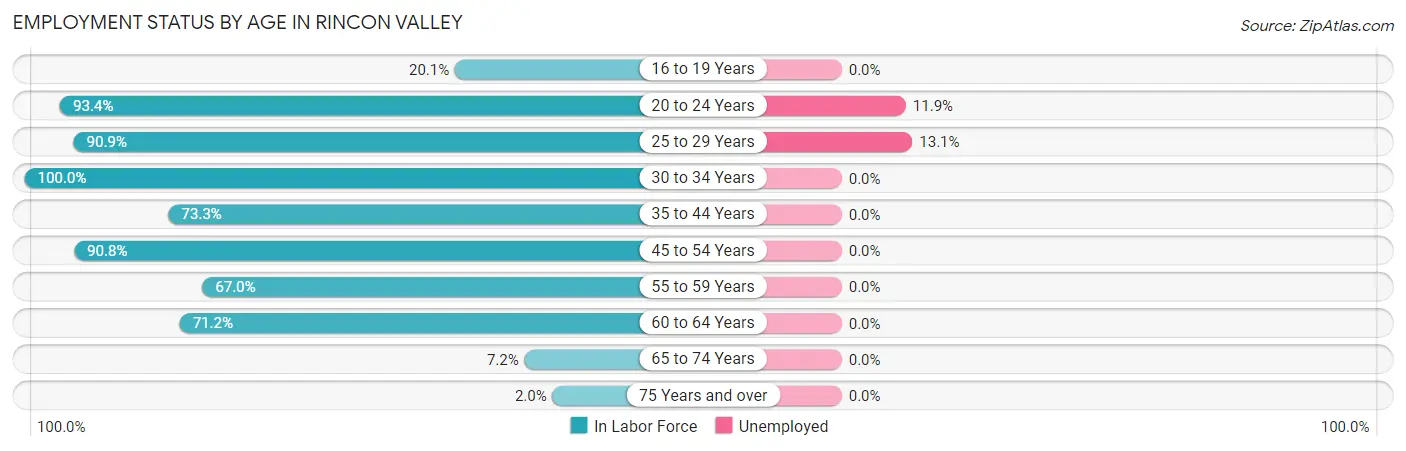
| Age Bracket | In Labor Force | Unemployed |
| 16 to 19 Years | 95 (20.1%) | 0 (0.0%) |
| 20 to 24 Years | 227 (93.4%) | 27 (11.9%) |
| 25 to 29 Years | 130 (90.9%) | 17 (13.1%) |
| 30 to 34 Years | 79 (100.0%) | 0 (0.0%) |
| 35 to 44 Years | 651 (73.3%) | 0 (0.0%) |
| 45 to 54 Years | 612 (90.8%) | 0 (0.0%) |
| 55 to 59 Years | 319 (67.0%) | 0 (0.0%) |
| 60 to 64 Years | 324 (71.2%) | 0 (0.0%) |
| 65 to 74 Years | 42 (7.2%) | 0 (0.0%) |
| 75 Years and over | 13 (2.0%) | 0 (0.0%) |
| Total | 2,494 (53.6%) | 45 (1.8%) |
Employment Status by Educational Attainment in Rincon Valley
According to labor force statistics for Rincon Valley, 77.9% of individuals (2,115) out of the total population between 25 and 64 years of age (2,715) are in the labor force, with 0.8% or 17 of them being unemployed. The group with the highest labor force participation rate are those with the educational attainment of less than high school, with 100.0% or 23 individuals in the labor force. Within the labor force, individuals with bachelor's degree or higher education have the highest percentage of unemployment, with 1.7% or 17 of them being unemployed.
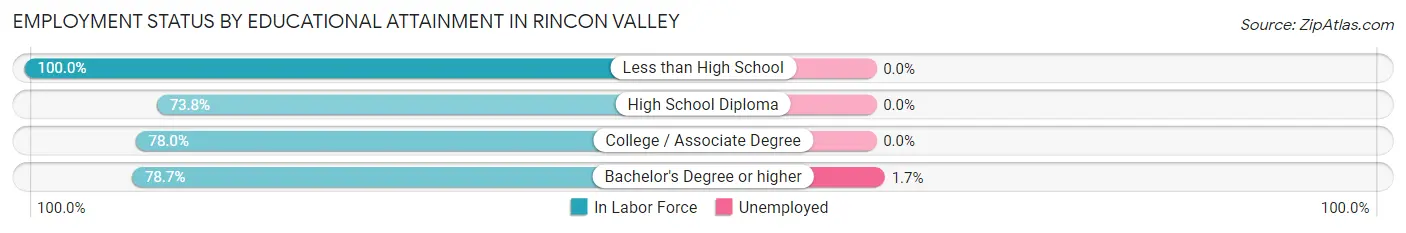
| Educational Attainment | In Labor Force | Unemployed |
| Less than High School | 23 (100.0%) | 0 (0.0%) |
| High School Diploma | 296 (73.8%) | 0 (0.0%) |
| College / Associate Degree | 810 (78.0%) | 0 (0.0%) |
| Bachelor's Degree or higher | 986 (78.7%) | 21 (1.7%) |
| Total | 2,115 (77.9%) | 22 (0.8%) |
Employment Occupations by Sex in Rincon Valley
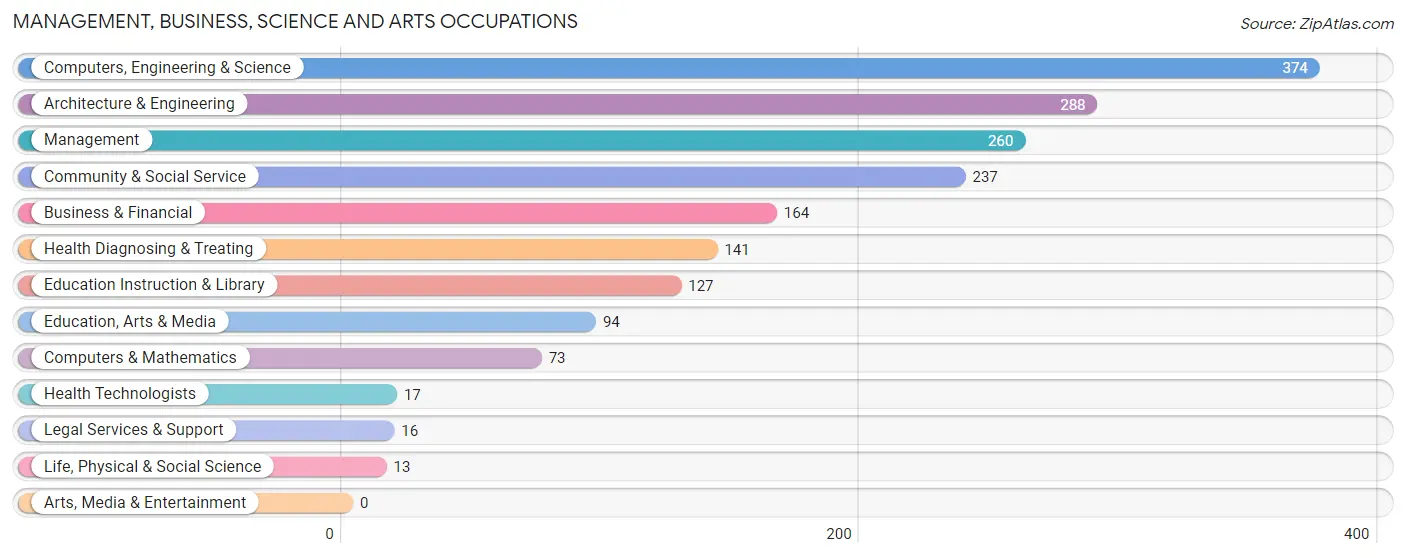
Management, Business, Science and Arts Occupations
The most common Management, Business, Science and Arts occupations in Rincon Valley are Computers, Engineering & Science (374 | 15.4%), Architecture & Engineering (288 | 11.9%), Management (260 | 10.7%), Community & Social Service (237 | 9.8%), and Business & Financial (164 | 6.8%).
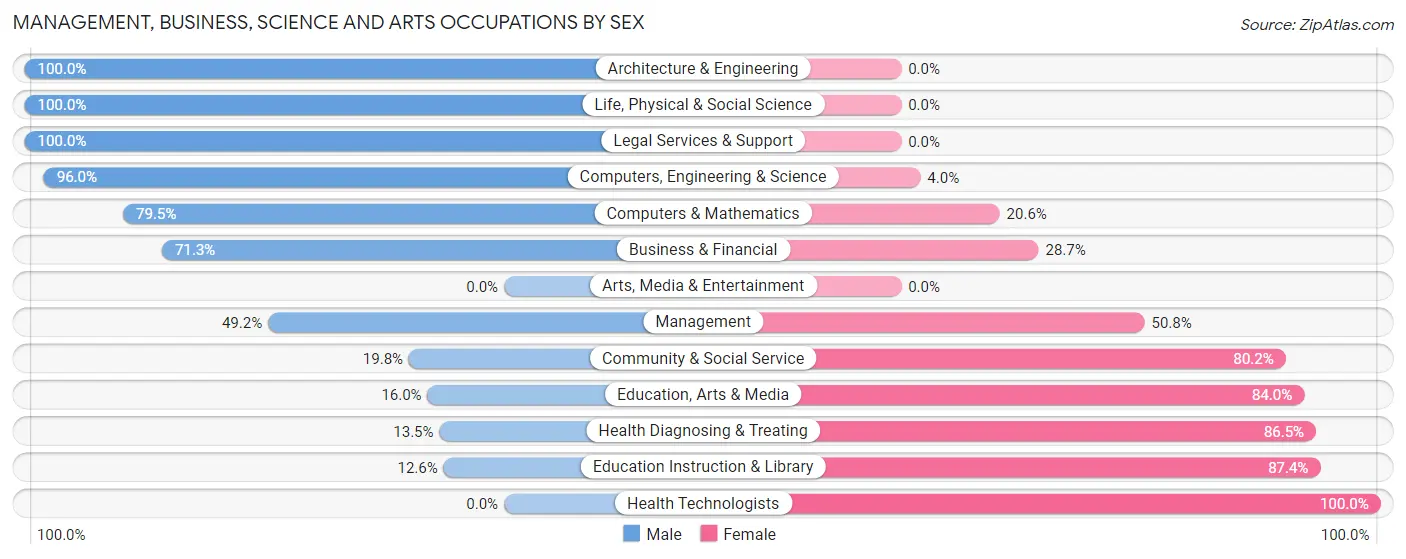
Management, Business, Science and Arts Occupations by Sex
Within the Management, Business, Science and Arts occupations in Rincon Valley, the most male-oriented occupations are Architecture & Engineering (100.0%), Life, Physical & Social Science (100.0%), and Legal Services & Support (100.0%), while the most female-oriented occupations are Health Technologists (100.0%), Education Instruction & Library (87.4%), and Health Diagnosing & Treating (86.5%).
| Occupation | Male | Female |
| Management | 128 (49.2%) | 132 (50.8%) |
| Business & Financial | 117 (71.3%) | 47 (28.7%) |
| Computers, Engineering & Science | 359 (96.0%) | 15 (4.0%) |
| Computers & Mathematics | 58 (79.4%) | 15 (20.5%) |
| Architecture & Engineering | 288 (100.0%) | 0 (0.0%) |
| Life, Physical & Social Science | 13 (100.0%) | 0 (0.0%) |
| Community & Social Service | 47 (19.8%) | 190 (80.2%) |
| Education, Arts & Media | 15 (16.0%) | 79 (84.0%) |
| Legal Services & Support | 16 (100.0%) | 0 (0.0%) |
| Education Instruction & Library | 16 (12.6%) | 111 (87.4%) |
| Arts, Media & Entertainment | 0 (0.0%) | 0 (0.0%) |
| Health Diagnosing & Treating | 19 (13.5%) | 122 (86.5%) |
| Health Technologists | 0 (0.0%) | 17 (100.0%) |
| Total (Category) | 670 (57.0%) | 506 (43.0%) |
| Total (Overall) | 1,327 (54.7%) | 1,100 (45.3%) |
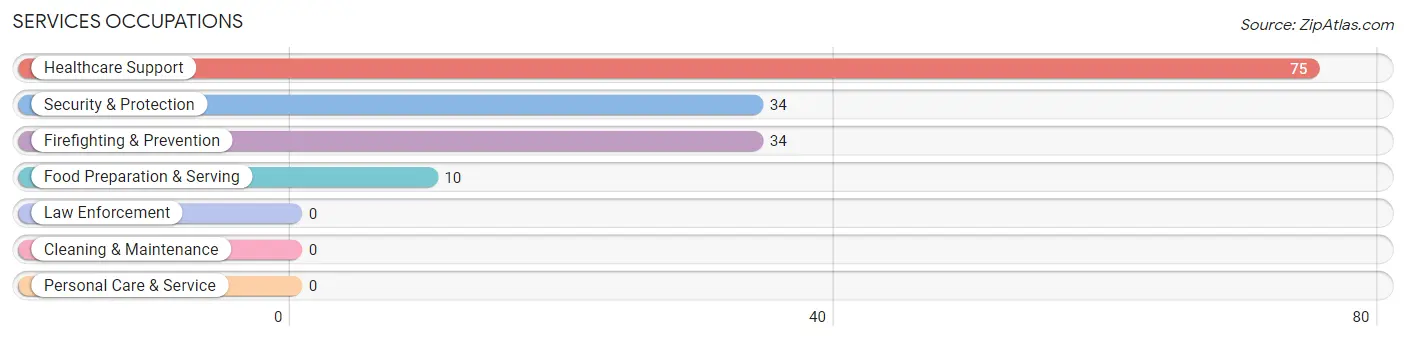
Services Occupations
The most common Services occupations in Rincon Valley are Healthcare Support (75 | 3.1%), Security & Protection (34 | 1.4%), Firefighting & Prevention (34 | 1.4%), and Food Preparation & Serving (10 | 0.4%).
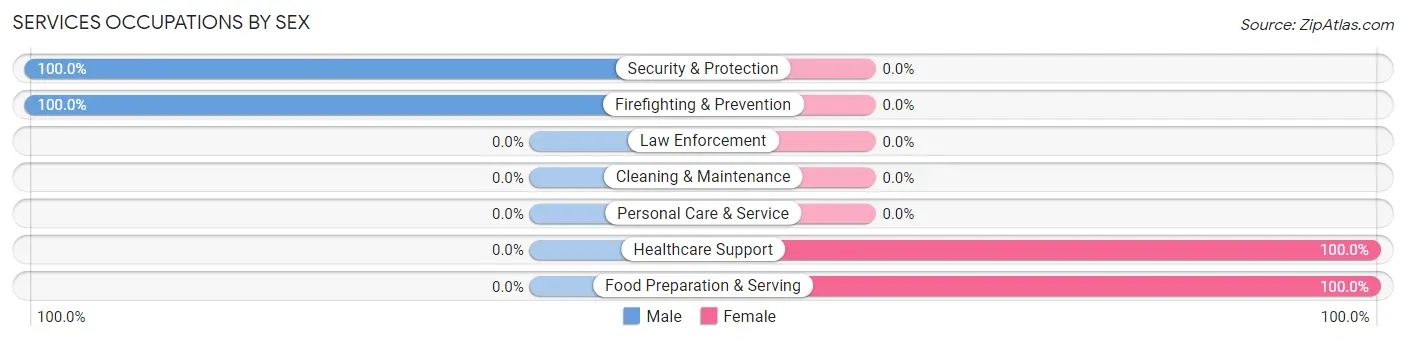
Services Occupations by Sex
Within the Services occupations in Rincon Valley, the most male-oriented occupations are Security & Protection (100.0%), and Firefighting & Prevention (100.0%), while the most female-oriented occupations are Healthcare Support (100.0%), and Food Preparation & Serving (100.0%).
| Occupation | Male | Female |
| Healthcare Support | 0 (0.0%) | 75 (100.0%) |
| Security & Protection | 34 (100.0%) | 0 (0.0%) |
| Firefighting & Prevention | 34 (100.0%) | 0 (0.0%) |
| Law Enforcement | 0 (0.0%) | 0 (0.0%) |
| Food Preparation & Serving | 0 (0.0%) | 10 (100.0%) |
| Cleaning & Maintenance | 0 (0.0%) | 0 (0.0%) |
| Personal Care & Service | 0 (0.0%) | 0 (0.0%) |
| Total (Category) | 34 (28.6%) | 85 (71.4%) |
| Total (Overall) | 1,327 (54.7%) | 1,100 (45.3%) |
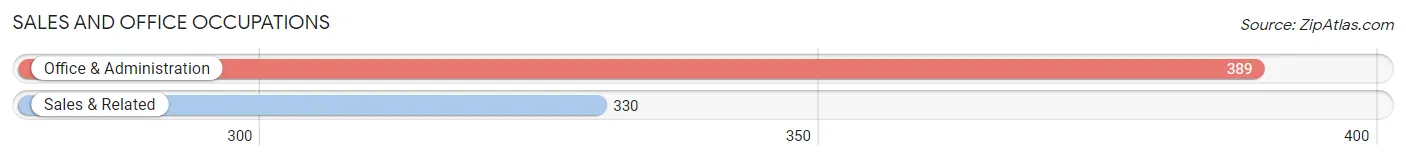
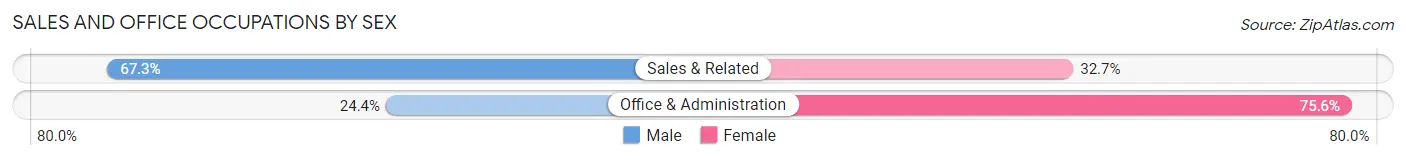
Sales and Office Occupations
The most common Sales and Office occupations in Rincon Valley are Office & Administration (389 | 16.0%), and Sales & Related (330 | 13.6%).
Sales and Office Occupations by Sex
| Occupation | Male | Female |
| Sales & Related | 222 (67.3%) | 108 (32.7%) |
| Office & Administration | 95 (24.4%) | 294 (75.6%) |
| Total (Category) | 317 (44.1%) | 402 (55.9%) |
| Total (Overall) | 1,327 (54.7%) | 1,100 (45.3%) |
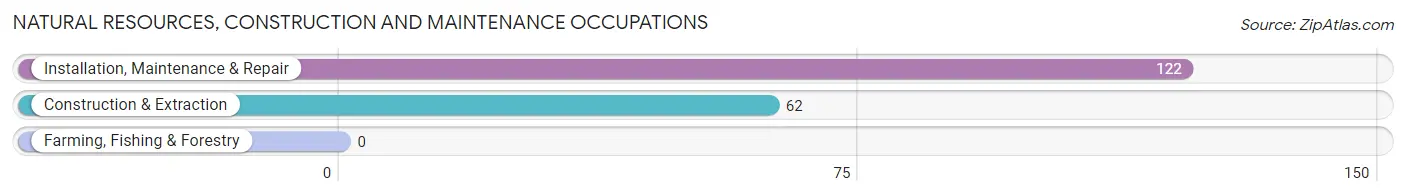
Natural Resources, Construction and Maintenance Occupations
The most common Natural Resources, Construction and Maintenance occupations in Rincon Valley are Installation, Maintenance & Repair (122 | 5.0%), and Construction & Extraction (62 | 2.5%).
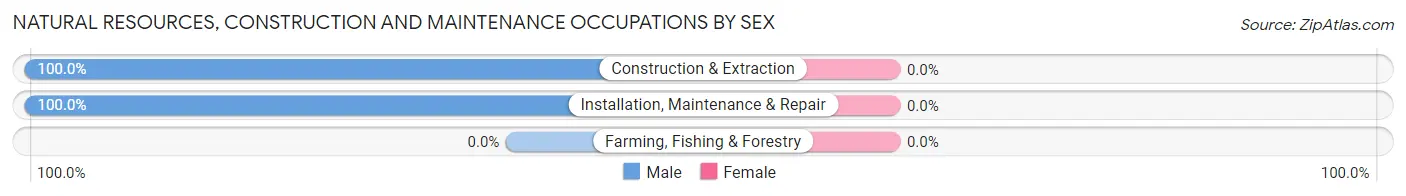
Natural Resources, Construction and Maintenance Occupations by Sex
| Occupation | Male | Female |
| Farming, Fishing & Forestry | 0 (0.0%) | 0 (0.0%) |
| Construction & Extraction | 62 (100.0%) | 0 (0.0%) |
| Installation, Maintenance & Repair | 122 (100.0%) | 0 (0.0%) |
| Total (Category) | 184 (100.0%) | 0 (0.0%) |
| Total (Overall) | 1,327 (54.7%) | 1,100 (45.3%) |
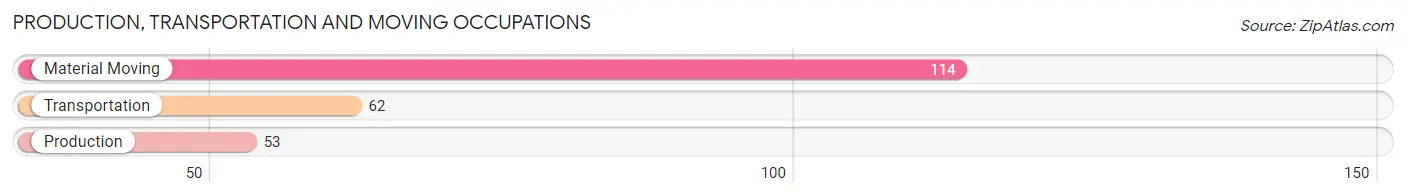
Production, Transportation and Moving Occupations
The most common Production, Transportation and Moving occupations in Rincon Valley are Material Moving (114 | 4.7%), Transportation (62 | 2.5%), and Production (53 | 2.2%).
Production, Transportation and Moving Occupations by Sex
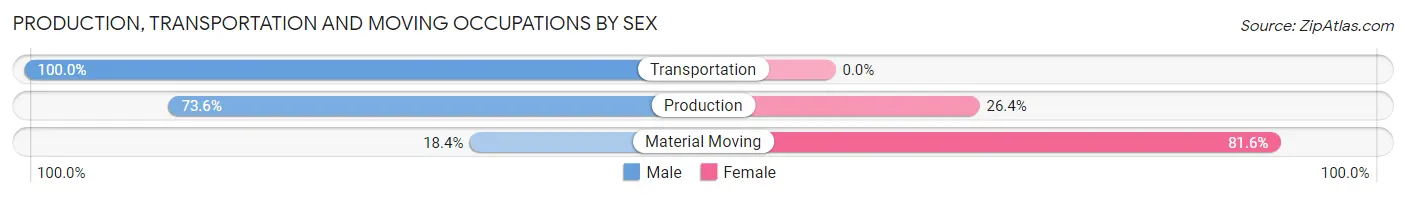
| Occupation | Male | Female |
| Production | 39 (73.6%) | 14 (26.4%) |
| Transportation | 62 (100.0%) | 0 (0.0%) |
| Material Moving | 21 (18.4%) | 93 (81.6%) |
| Total (Category) | 122 (53.3%) | 107 (46.7%) |
| Total (Overall) | 1,327 (54.7%) | 1,100 (45.3%) |
Employment Industries by Sex in Rincon Valley
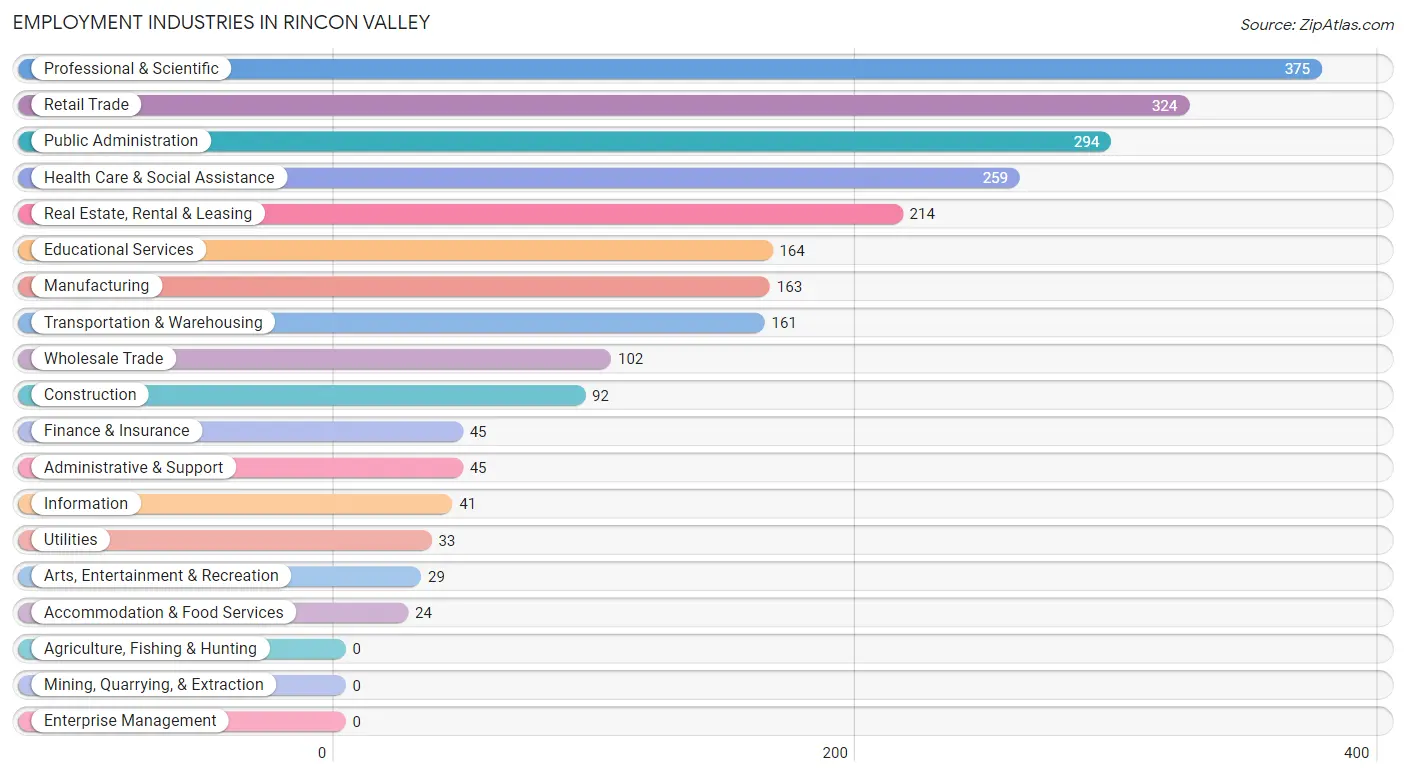
Employment Industries in Rincon Valley
The major employment industries in Rincon Valley include Professional & Scientific (375 | 15.4%), Retail Trade (324 | 13.4%), Public Administration (294 | 12.1%), Health Care & Social Assistance (259 | 10.7%), and Real Estate, Rental & Leasing (214 | 8.8%).
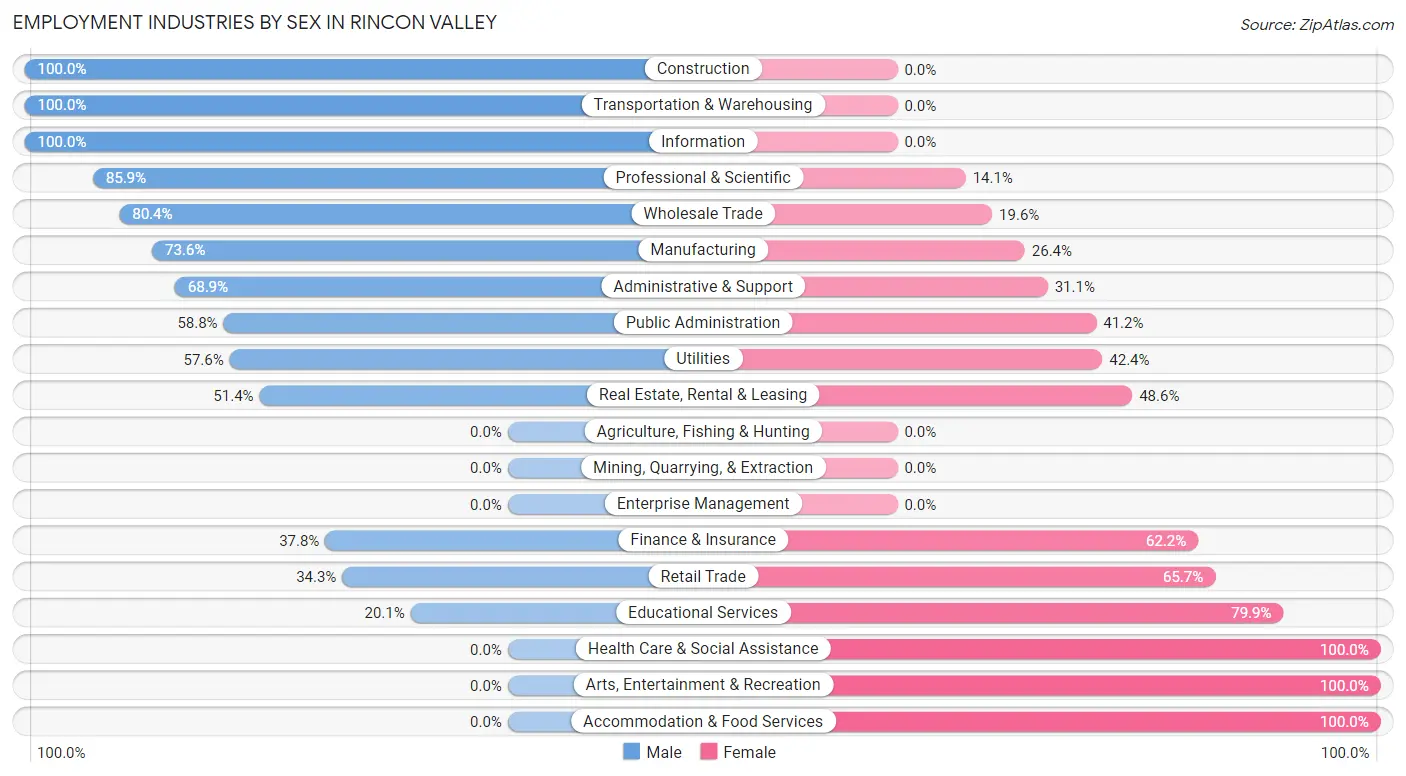
Employment Industries by Sex in Rincon Valley
The Rincon Valley industries that see more men than women are Construction (100.0%), Transportation & Warehousing (100.0%), and Information (100.0%), whereas the industries that tend to have a higher number of women are Health Care & Social Assistance (100.0%), Arts, Entertainment & Recreation (100.0%), and Accommodation & Food Services (100.0%).
| Industry | Male | Female |
| Agriculture, Fishing & Hunting | 0 (0.0%) | 0 (0.0%) |
| Mining, Quarrying, & Extraction | 0 (0.0%) | 0 (0.0%) |
| Construction | 92 (100.0%) | 0 (0.0%) |
| Manufacturing | 120 (73.6%) | 43 (26.4%) |
| Wholesale Trade | 82 (80.4%) | 20 (19.6%) |
| Retail Trade | 111 (34.3%) | 213 (65.7%) |
| Transportation & Warehousing | 161 (100.0%) | 0 (0.0%) |
| Utilities | 19 (57.6%) | 14 (42.4%) |
| Information | 41 (100.0%) | 0 (0.0%) |
| Finance & Insurance | 17 (37.8%) | 28 (62.2%) |
| Real Estate, Rental & Leasing | 110 (51.4%) | 104 (48.6%) |
| Professional & Scientific | 322 (85.9%) | 53 (14.1%) |
| Enterprise Management | 0 (0.0%) | 0 (0.0%) |
| Administrative & Support | 31 (68.9%) | 14 (31.1%) |
| Educational Services | 33 (20.1%) | 131 (79.9%) |
| Health Care & Social Assistance | 0 (0.0%) | 259 (100.0%) |
| Arts, Entertainment & Recreation | 0 (0.0%) | 29 (100.0%) |
| Accommodation & Food Services | 0 (0.0%) | 24 (100.0%) |
| Public Administration | 173 (58.8%) | 121 (41.2%) |
| Total | 1,327 (54.7%) | 1,100 (45.3%) |
Education in Rincon Valley
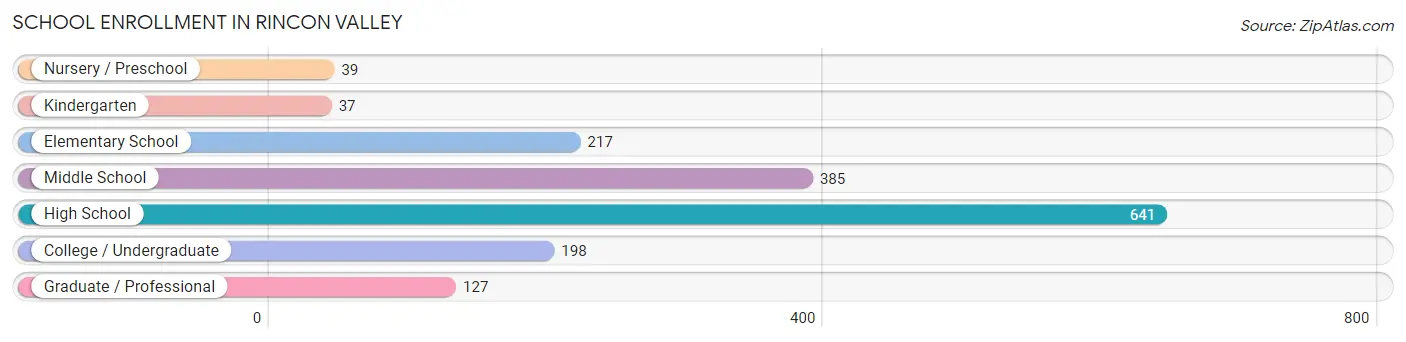
School Enrollment in Rincon Valley
The most common levels of schooling among the 1,644 students in Rincon Valley are high school (641 | 39.0%), middle school (385 | 23.4%), and elementary school (217 | 13.2%).
| School Level | # Students | % Students |
| Nursery / Preschool | 39 | 2.4% |
| Kindergarten | 37 | 2.2% |
| Elementary School | 217 | 13.2% |
| Middle School | 385 | 23.4% |
| High School | 641 | 39.0% |
| College / Undergraduate | 198 | 12.0% |
| Graduate / Professional | 127 | 7.7% |
| Total | 1,644 | 100.0% |
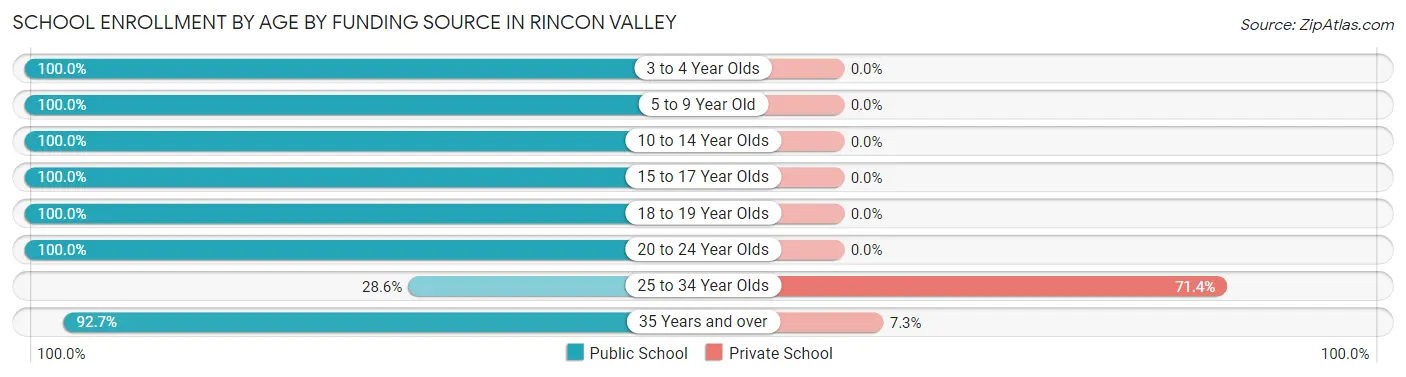
School Enrollment by Age by Funding Source in Rincon Valley
Out of a total of 1,644 students who are enrolled in schools in Rincon Valley, 61 (3.7%) attend a private institution, while the remaining 1,583 (96.3%) are enrolled in public schools. The age group of 25 to 34 year olds has the highest likelihood of being enrolled in private schools, with 50 (71.4% in the age bracket) enrolled. Conversely, the age group of 3 to 4 year olds has the lowest likelihood of being enrolled in a private school, with 16 (100.0% in the age bracket) attending a public institution.
| Age Bracket | Public School | Private School |
| 3 to 4 Year Olds | 16 (100.0%) | 0 (0.0%) |
| 5 to 9 Year Old | 277 (100.0%) | 0 (0.0%) |
| 10 to 14 Year Olds | 556 (100.0%) | 0 (0.0%) |
| 15 to 17 Year Olds | 393 (100.0%) | 0 (0.0%) |
| 18 to 19 Year Olds | 56 (100.0%) | 0 (0.0%) |
| 20 to 24 Year Olds | 125 (100.0%) | 0 (0.0%) |
| 25 to 34 Year Olds | 20 (28.6%) | 50 (71.4%) |
| 35 Years and over | 140 (92.7%) | 11 (7.3%) |
| Total | 1,583 (96.3%) | 61 (3.7%) |
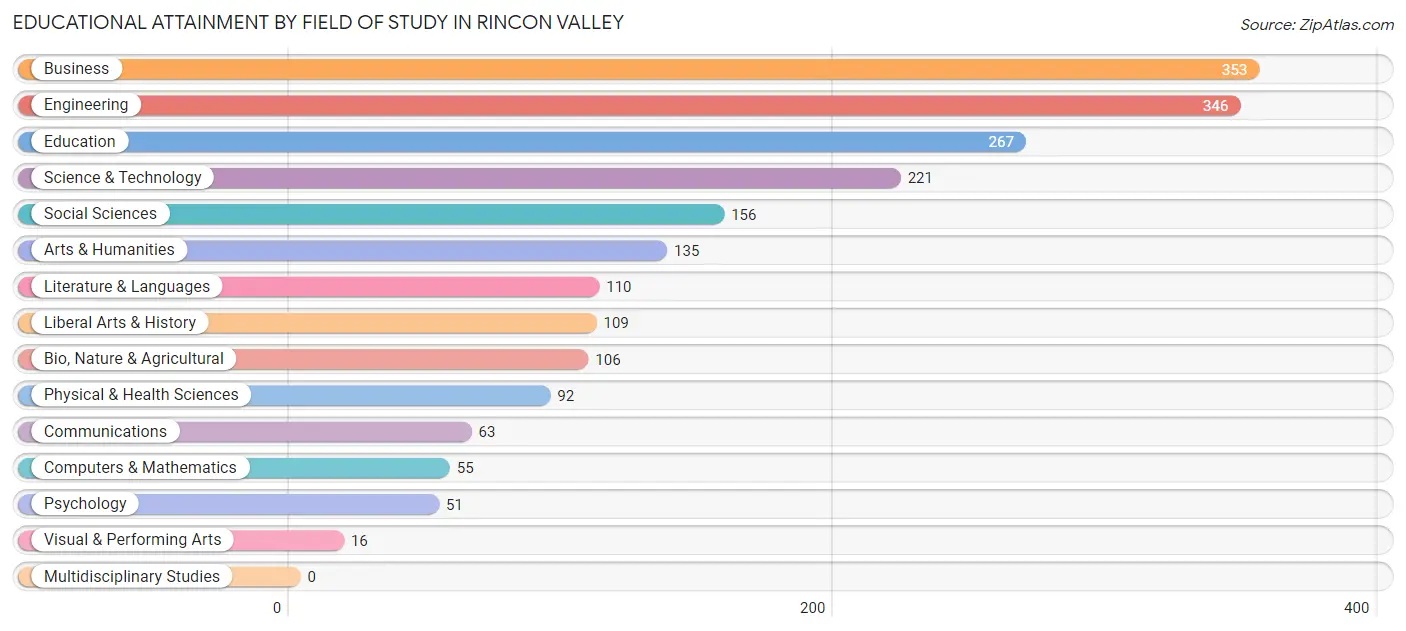
Educational Attainment by Field of Study in Rincon Valley
Business (353 | 17.0%), engineering (346 | 16.6%), education (267 | 12.8%), science & technology (221 | 10.6%), and social sciences (156 | 7.5%) are the most common fields of study among 2,080 individuals in Rincon Valley who have obtained a bachelor's degree or higher.
| Field of Study | # Graduates | % Graduates |
| Computers & Mathematics | 55 | 2.6% |
| Bio, Nature & Agricultural | 106 | 5.1% |
| Physical & Health Sciences | 92 | 4.4% |
| Psychology | 51 | 2.5% |
| Social Sciences | 156 | 7.5% |
| Engineering | 346 | 16.6% |
| Multidisciplinary Studies | 0 | 0.0% |
| Science & Technology | 221 | 10.6% |
| Business | 353 | 17.0% |
| Education | 267 | 12.8% |
| Literature & Languages | 110 | 5.3% |
| Liberal Arts & History | 109 | 5.2% |
| Visual & Performing Arts | 16 | 0.8% |
| Communications | 63 | 3.0% |
| Arts & Humanities | 135 | 6.5% |
| Total | 2,080 | 100.0% |
Transportation & Commute in Rincon Valley
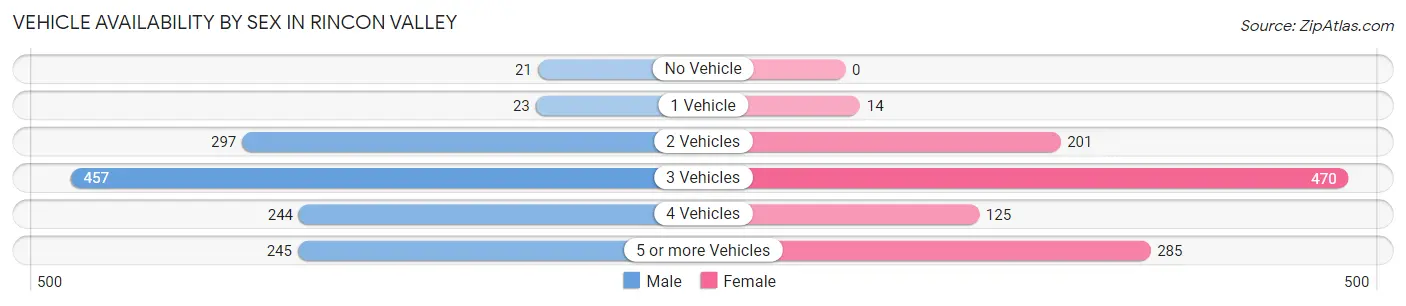
Vehicle Availability by Sex in Rincon Valley
The most prevalent vehicle ownership categories in Rincon Valley are males with 3 vehicles (457, accounting for 35.5%) and females with 3 vehicles (470, making up 41.7%).
| Vehicles Available | Male | Female |
| No Vehicle | 21 (1.6%) | 0 (0.0%) |
| 1 Vehicle | 23 (1.8%) | 14 (1.3%) |
| 2 Vehicles | 297 (23.1%) | 201 (18.4%) |
| 3 Vehicles | 457 (35.5%) | 470 (42.9%) |
| 4 Vehicles | 244 (19.0%) | 125 (11.4%) |
| 5 or more Vehicles | 245 (19.0%) | 285 (26.0%) |
| Total | 1,287 (100.0%) | 1,095 (100.0%) |
Commute Time in Rincon Valley
The most frequently occuring commute durations in Rincon Valley are 30 to 34 minutes (646 commuters, 33.0%), 20 to 24 minutes (387 commuters, 19.8%), and 35 to 39 minutes (204 commuters, 10.4%).
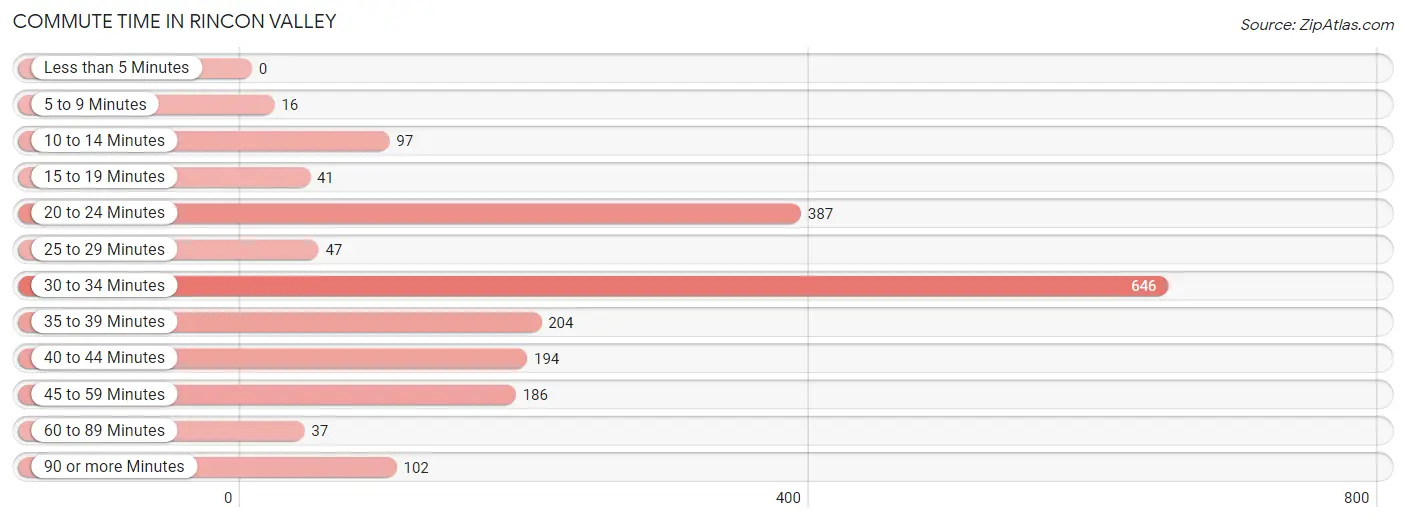
| Commute Time | # Commuters | % Commuters |
| Less than 5 Minutes | 0 | 0.0% |
| 5 to 9 Minutes | 16 | 0.8% |
| 10 to 14 Minutes | 97 | 5.0% |
| 15 to 19 Minutes | 41 | 2.1% |
| 20 to 24 Minutes | 387 | 19.8% |
| 25 to 29 Minutes | 47 | 2.4% |
| 30 to 34 Minutes | 646 | 33.0% |
| 35 to 39 Minutes | 204 | 10.4% |
| 40 to 44 Minutes | 194 | 9.9% |
| 45 to 59 Minutes | 186 | 9.5% |
| 60 to 89 Minutes | 37 | 1.9% |
| 90 or more Minutes | 102 | 5.2% |
Commute Time by Sex in Rincon Valley
The most common commute times in Rincon Valley are 30 to 34 minutes (381 commuters, 35.5%) for males and 30 to 34 minutes (265 commuters, 30.0%) for females.
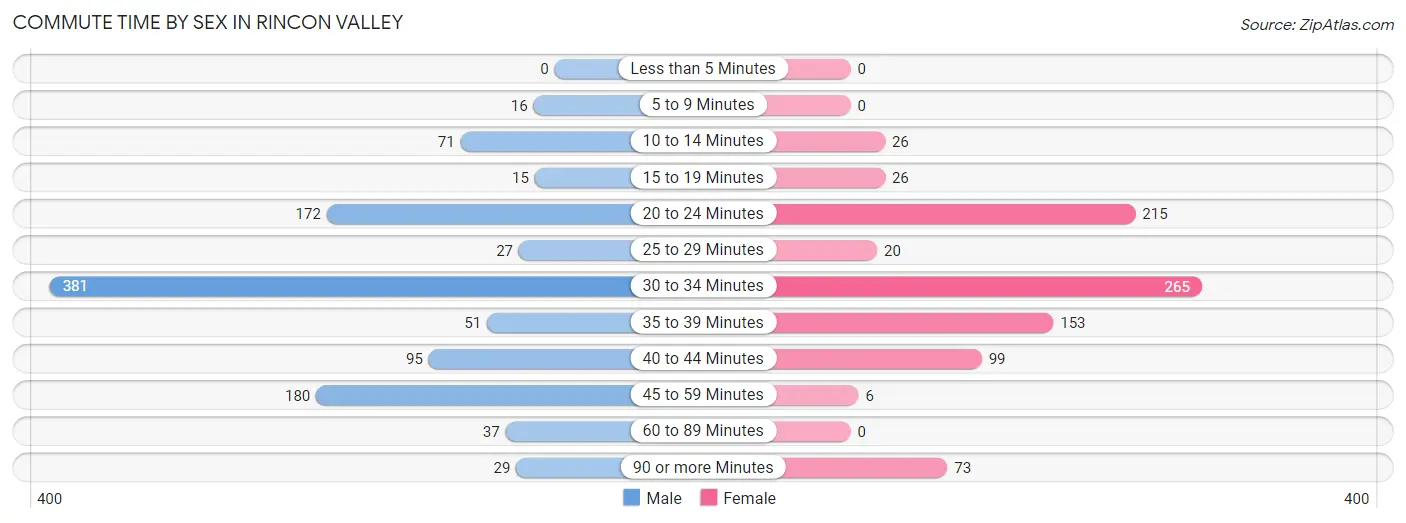
| Commute Time | Male | Female |
| Less than 5 Minutes | 0 (0.0%) | 0 (0.0%) |
| 5 to 9 Minutes | 16 (1.5%) | 0 (0.0%) |
| 10 to 14 Minutes | 71 (6.6%) | 26 (2.9%) |
| 15 to 19 Minutes | 15 (1.4%) | 26 (2.9%) |
| 20 to 24 Minutes | 172 (16.0%) | 215 (24.3%) |
| 25 to 29 Minutes | 27 (2.5%) | 20 (2.3%) |
| 30 to 34 Minutes | 381 (35.5%) | 265 (30.0%) |
| 35 to 39 Minutes | 51 (4.8%) | 153 (17.3%) |
| 40 to 44 Minutes | 95 (8.8%) | 99 (11.2%) |
| 45 to 59 Minutes | 180 (16.8%) | 6 (0.7%) |
| 60 to 89 Minutes | 37 (3.5%) | 0 (0.0%) |
| 90 or more Minutes | 29 (2.7%) | 73 (8.3%) |
Time of Departure to Work by Sex in Rincon Valley
The most frequent times of departure to work in Rincon Valley are 7:00 AM to 7:29 AM (219, 20.4%) for males and 6:00 AM to 6:29 AM (204, 23.1%) for females.
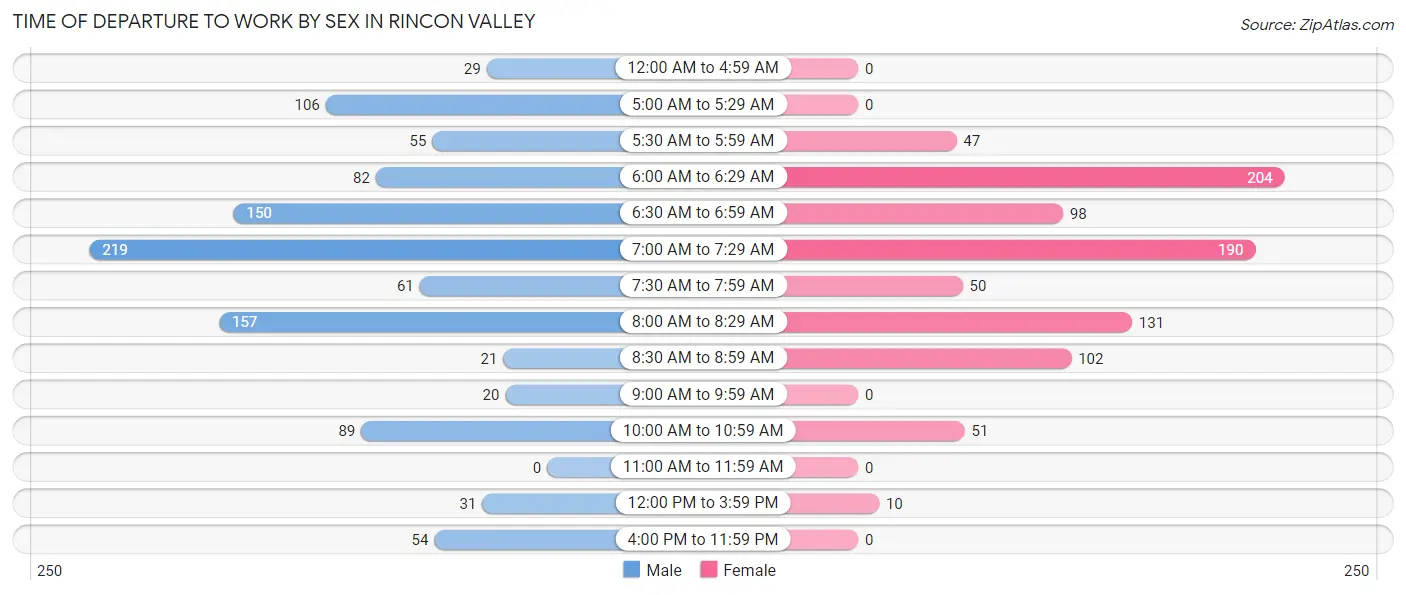
| Time of Departure | Male | Female |
| 12:00 AM to 4:59 AM | 29 (2.7%) | 0 (0.0%) |
| 5:00 AM to 5:29 AM | 106 (9.9%) | 0 (0.0%) |
| 5:30 AM to 5:59 AM | 55 (5.1%) | 47 (5.3%) |
| 6:00 AM to 6:29 AM | 82 (7.6%) | 204 (23.1%) |
| 6:30 AM to 6:59 AM | 150 (14.0%) | 98 (11.1%) |
| 7:00 AM to 7:29 AM | 219 (20.4%) | 190 (21.5%) |
| 7:30 AM to 7:59 AM | 61 (5.7%) | 50 (5.7%) |
| 8:00 AM to 8:29 AM | 157 (14.6%) | 131 (14.8%) |
| 8:30 AM to 8:59 AM | 21 (2.0%) | 102 (11.6%) |
| 9:00 AM to 9:59 AM | 20 (1.9%) | 0 (0.0%) |
| 10:00 AM to 10:59 AM | 89 (8.3%) | 51 (5.8%) |
| 11:00 AM to 11:59 AM | 0 (0.0%) | 0 (0.0%) |
| 12:00 PM to 3:59 PM | 31 (2.9%) | 10 (1.1%) |
| 4:00 PM to 11:59 PM | 54 (5.0%) | 0 (0.0%) |
| Total | 1,074 (100.0%) | 883 (100.0%) |
Housing Occupancy in Rincon Valley
Occupancy by Ownership in Rincon Valley
Of the total 2,024 dwellings in Rincon Valley, owner-occupied units account for 2,004 (99.0%), while renter-occupied units make up 20 (1.0%).
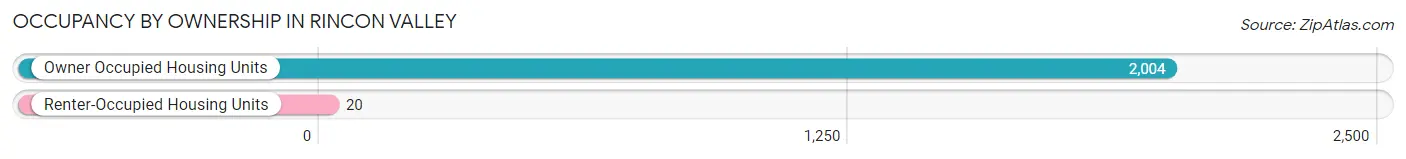
| Occupancy | # Housing Units | % Housing Units |
| Owner Occupied Housing Units | 2,004 | 99.0% |
| Renter-Occupied Housing Units | 20 | 1.0% |
| Total Occupied Housing Units | 2,024 | 100.0% |
Occupancy by Household Size in Rincon Valley
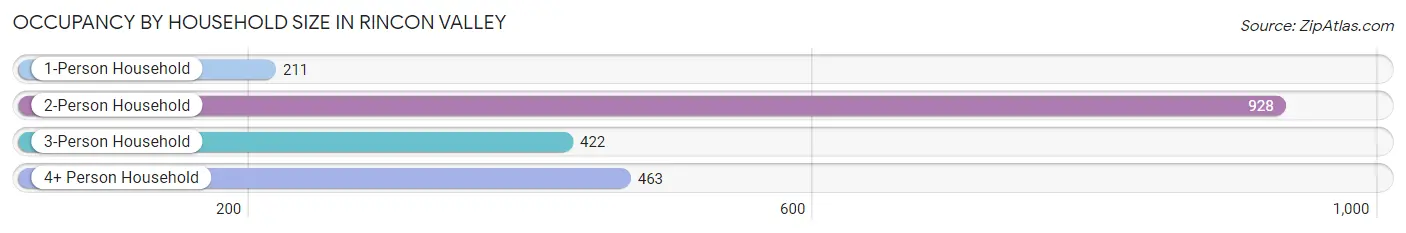
| Household Size | # Housing Units | % Housing Units |
| 1-Person Household | 211 | 10.4% |
| 2-Person Household | 928 | 45.9% |
| 3-Person Household | 422 | 20.8% |
| 4+ Person Household | 463 | 22.9% |
| Total Housing Units | 2,024 | 100.0% |
Occupancy by Ownership by Household Size in Rincon Valley
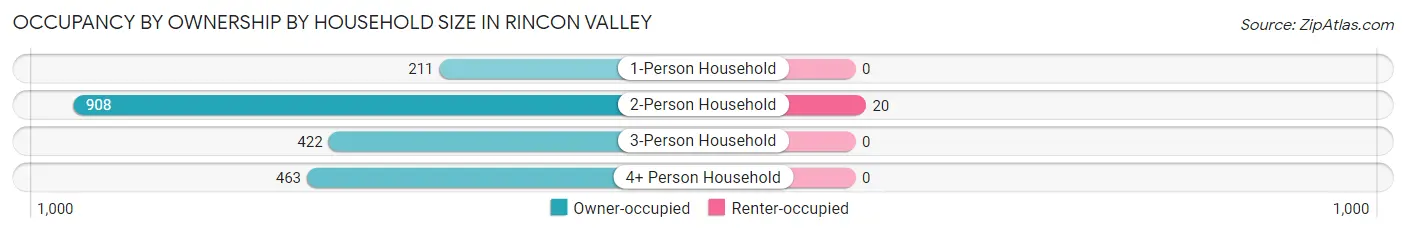
| Household Size | Owner-occupied | Renter-occupied |
| 1-Person Household | 211 (100.0%) | 0 (0.0%) |
| 2-Person Household | 908 (97.8%) | 20 (2.2%) |
| 3-Person Household | 422 (100.0%) | 0 (0.0%) |
| 4+ Person Household | 463 (100.0%) | 0 (0.0%) |
| Total Housing Units | 2,004 (99.0%) | 20 (1.0%) |
Occupancy by Educational Attainment in Rincon Valley
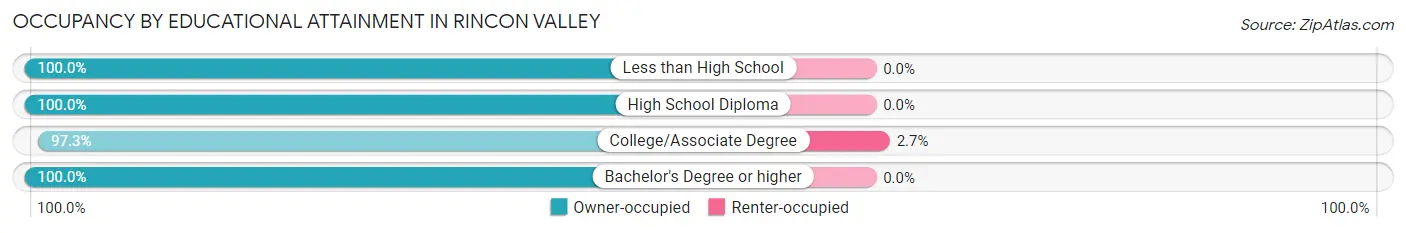
| Household Size | Owner-occupied | Renter-occupied |
| Less than High School | 16 (100.0%) | 0 (0.0%) |
| High School Diploma | 274 (100.0%) | 0 (0.0%) |
| College/Associate Degree | 727 (97.3%) | 20 (2.7%) |
| Bachelor's Degree or higher | 987 (100.0%) | 0 (0.0%) |
Occupancy by Age of Householder in Rincon Valley
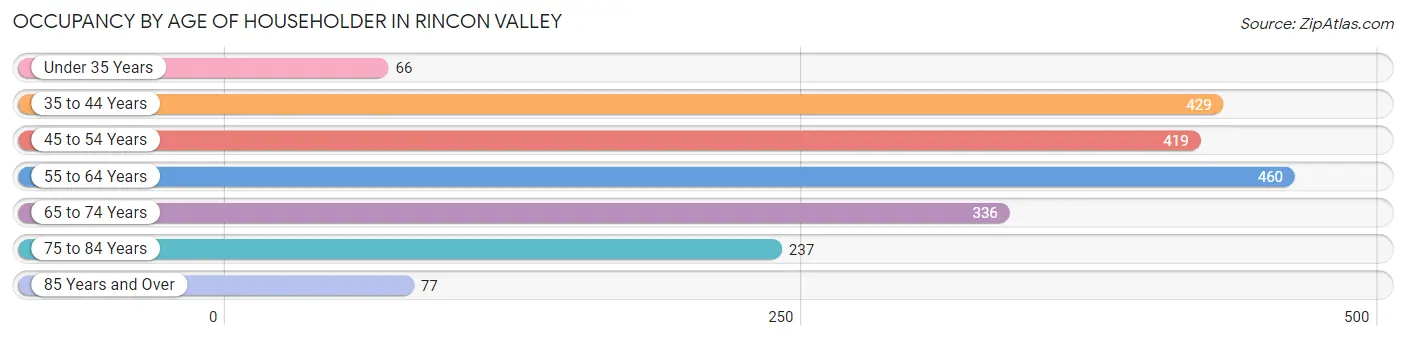
| Age Bracket | # Households | % Households |
| Under 35 Years | 66 | 3.3% |
| 35 to 44 Years | 429 | 21.2% |
| 45 to 54 Years | 419 | 20.7% |
| 55 to 64 Years | 460 | 22.7% |
| 65 to 74 Years | 336 | 16.6% |
| 75 to 84 Years | 237 | 11.7% |
| 85 Years and Over | 77 | 3.8% |
| Total | 2,024 | 100.0% |
Housing Finances in Rincon Valley
Median Income by Occupancy in Rincon Valley
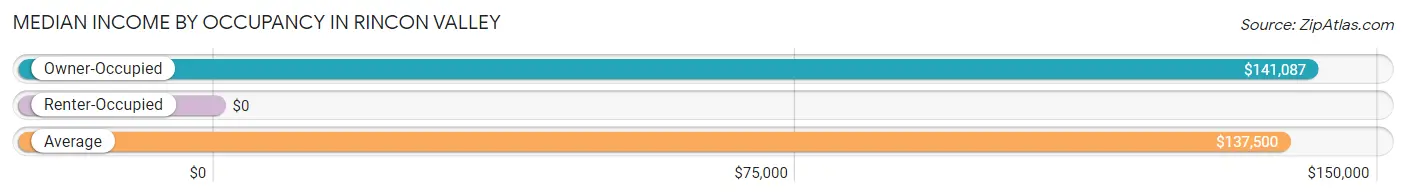
| Occupancy Type | # Households | Median Income |
| Owner-Occupied | 2,004 (99.0%) | $141,087 |
| Renter-Occupied | 20 (1.0%) | $0 |
| Average | 2,024 (100.0%) | $137,500 |
Occupancy by Householder Income Bracket in Rincon Valley
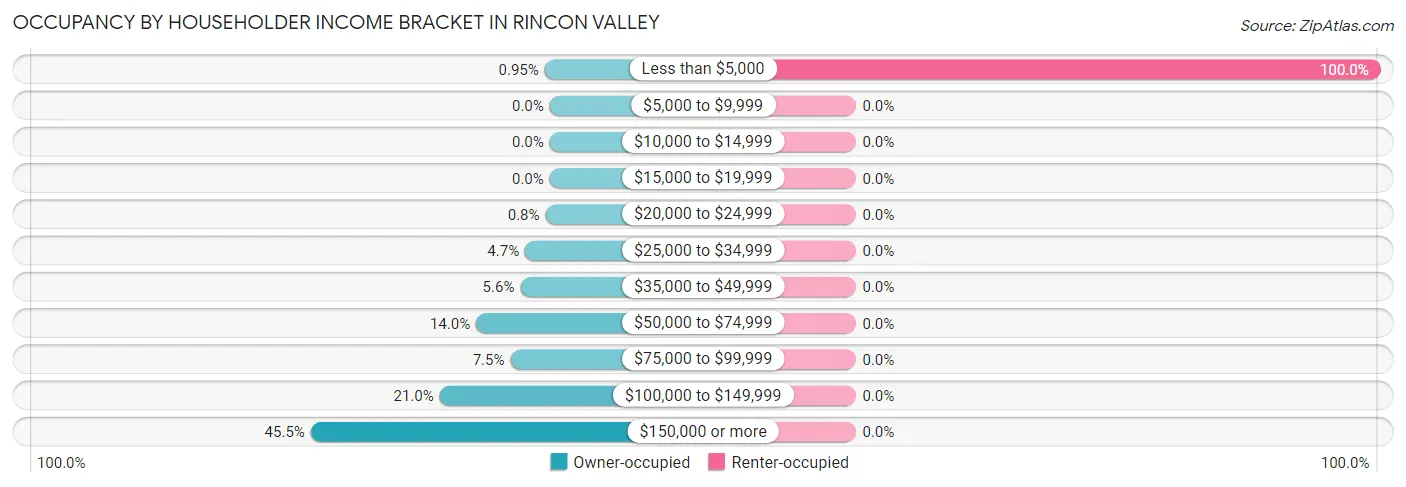
| Income Bracket | Owner-occupied | Renter-occupied |
| Less than $5,000 | 19 (0.9%) | 20 (100.0%) |
| $5,000 to $9,999 | 0 (0.0%) | 0 (0.0%) |
| $10,000 to $14,999 | 0 (0.0%) | 0 (0.0%) |
| $15,000 to $19,999 | 0 (0.0%) | 0 (0.0%) |
| $20,000 to $24,999 | 16 (0.8%) | 0 (0.0%) |
| $25,000 to $34,999 | 94 (4.7%) | 0 (0.0%) |
| $35,000 to $49,999 | 112 (5.6%) | 0 (0.0%) |
| $50,000 to $74,999 | 281 (14.0%) | 0 (0.0%) |
| $75,000 to $99,999 | 150 (7.5%) | 0 (0.0%) |
| $100,000 to $149,999 | 420 (21.0%) | 0 (0.0%) |
| $150,000 or more | 912 (45.5%) | 0 (0.0%) |
| Total | 2,004 (100.0%) | 20 (100.0%) |
Monthly Housing Cost Tiers in Rincon Valley
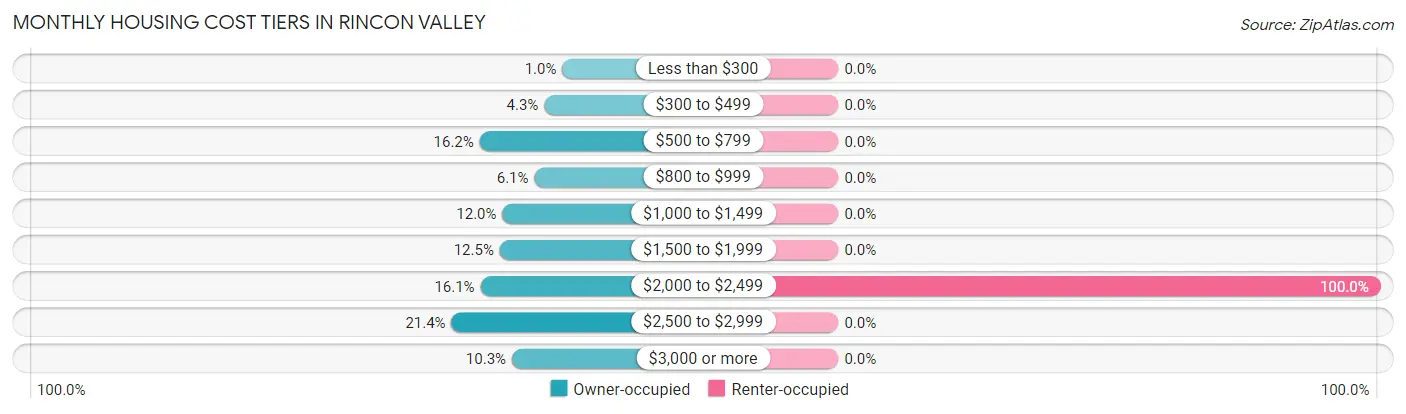
| Monthly Cost | Owner-occupied | Renter-occupied |
| Less than $300 | 20 (1.0%) | 0 (0.0%) |
| $300 to $499 | 87 (4.3%) | 0 (0.0%) |
| $500 to $799 | 325 (16.2%) | 0 (0.0%) |
| $800 to $999 | 123 (6.1%) | 0 (0.0%) |
| $1,000 to $1,499 | 241 (12.0%) | 0 (0.0%) |
| $1,500 to $1,999 | 251 (12.5%) | 0 (0.0%) |
| $2,000 to $2,499 | 322 (16.1%) | 20 (100.0%) |
| $2,500 to $2,999 | 429 (21.4%) | 0 (0.0%) |
| $3,000 or more | 206 (10.3%) | 0 (0.0%) |
| Total | 2,004 (100.0%) | 20 (100.0%) |
Physical Housing Characteristics in Rincon Valley
Housing Structures in Rincon Valley
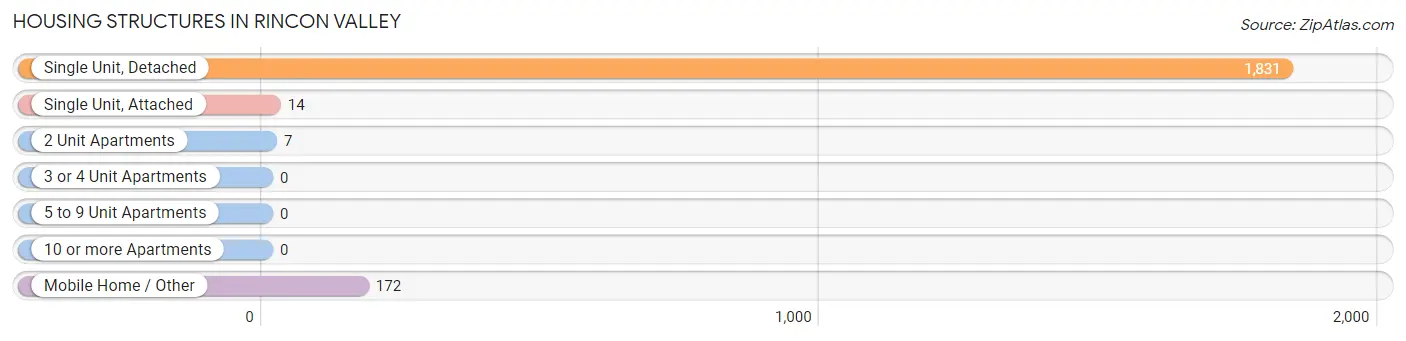
| Structure Type | # Housing Units | % Housing Units |
| Single Unit, Detached | 1,831 | 90.5% |
| Single Unit, Attached | 14 | 0.7% |
| 2 Unit Apartments | 7 | 0.4% |
| 3 or 4 Unit Apartments | 0 | 0.0% |
| 5 to 9 Unit Apartments | 0 | 0.0% |
| 10 or more Apartments | 0 | 0.0% |
| Mobile Home / Other | 172 | 8.5% |
| Total | 2,024 | 100.0% |
Housing Structures by Occupancy in Rincon Valley
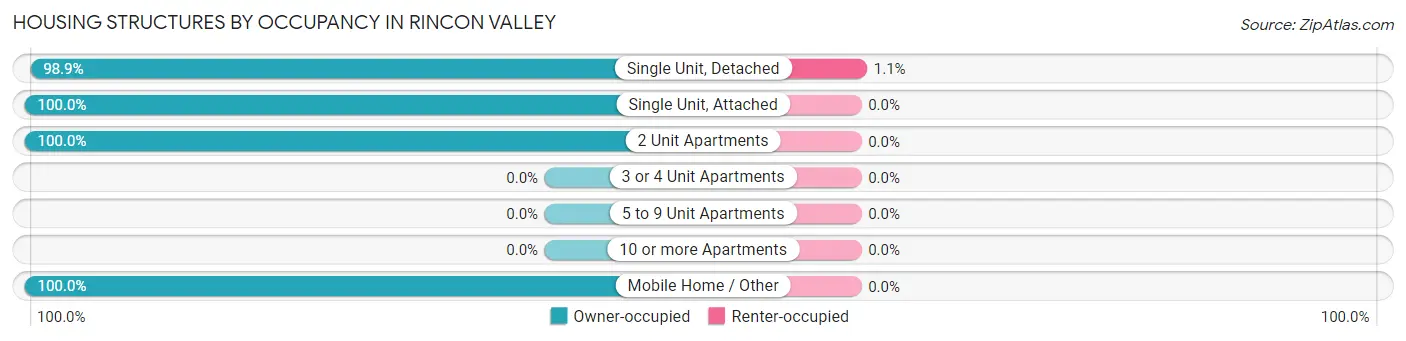
| Structure Type | Owner-occupied | Renter-occupied |
| Single Unit, Detached | 1,811 (98.9%) | 20 (1.1%) |
| Single Unit, Attached | 14 (100.0%) | 0 (0.0%) |
| 2 Unit Apartments | 7 (100.0%) | 0 (0.0%) |
| 3 or 4 Unit Apartments | 0 (0.0%) | 0 (0.0%) |
| 5 to 9 Unit Apartments | 0 (0.0%) | 0 (0.0%) |
| 10 or more Apartments | 0 (0.0%) | 0 (0.0%) |
| Mobile Home / Other | 172 (100.0%) | 0 (0.0%) |
| Total | 2,004 (99.0%) | 20 (1.0%) |
Housing Structures by Number of Rooms in Rincon Valley
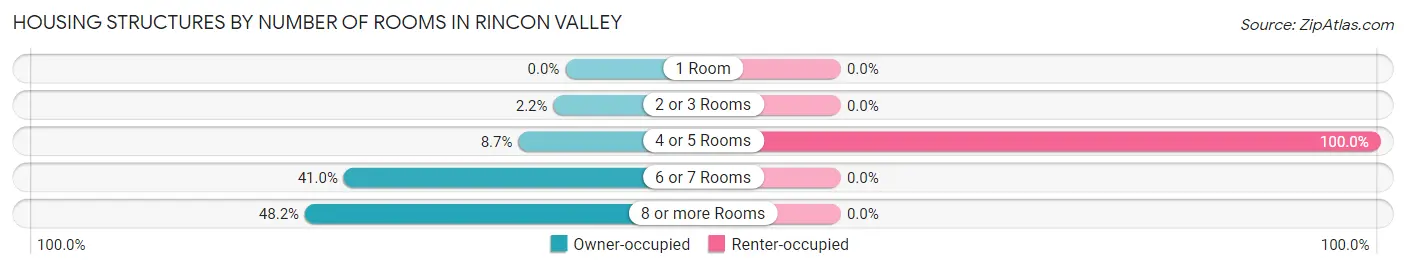
| Number of Rooms | Owner-occupied | Renter-occupied |
| 1 Room | 0 (0.0%) | 0 (0.0%) |
| 2 or 3 Rooms | 44 (2.2%) | 0 (0.0%) |
| 4 or 5 Rooms | 174 (8.7%) | 20 (100.0%) |
| 6 or 7 Rooms | 821 (41.0%) | 0 (0.0%) |
| 8 or more Rooms | 965 (48.1%) | 0 (0.0%) |
| Total | 2,004 (100.0%) | 20 (100.0%) |
Housing Structure by Heating Type in Rincon Valley
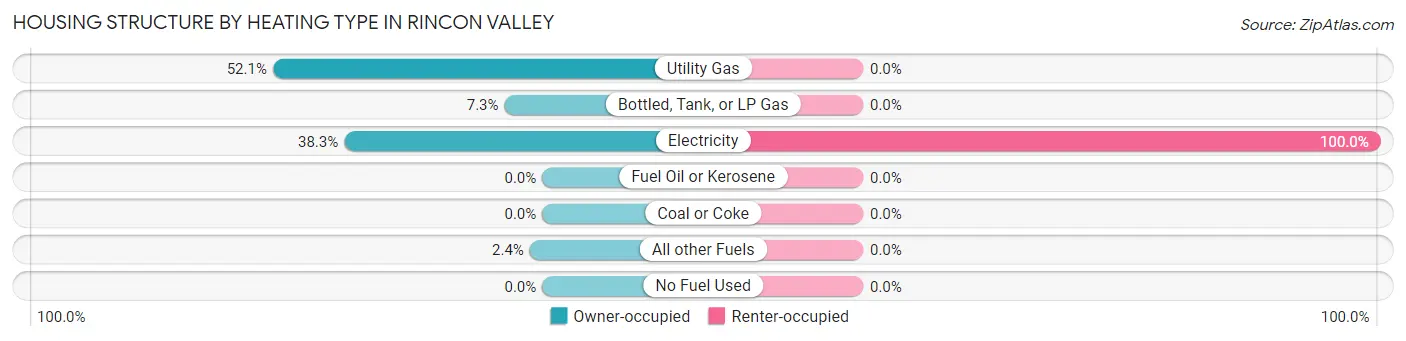
| Heating Type | Owner-occupied | Renter-occupied |
| Utility Gas | 1,043 (52.0%) | 0 (0.0%) |
| Bottled, Tank, or LP Gas | 146 (7.3%) | 0 (0.0%) |
| Electricity | 767 (38.3%) | 20 (100.0%) |
| Fuel Oil or Kerosene | 0 (0.0%) | 0 (0.0%) |
| Coal or Coke | 0 (0.0%) | 0 (0.0%) |
| All other Fuels | 48 (2.4%) | 0 (0.0%) |
| No Fuel Used | 0 (0.0%) | 0 (0.0%) |
| Total | 2,004 (100.0%) | 20 (100.0%) |
Household Vehicle Usage in Rincon Valley
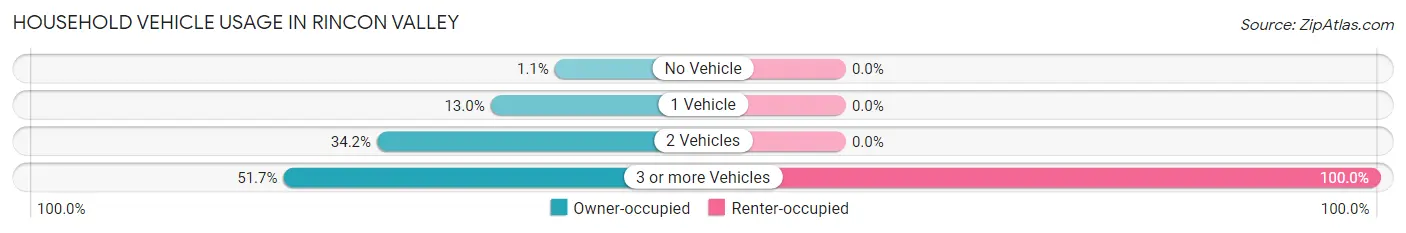
| Vehicles per Household | Owner-occupied | Renter-occupied |
| No Vehicle | 21 (1.1%) | 0 (0.0%) |
| 1 Vehicle | 261 (13.0%) | 0 (0.0%) |
| 2 Vehicles | 686 (34.2%) | 0 (0.0%) |
| 3 or more Vehicles | 1,036 (51.7%) | 20 (100.0%) |
| Total | 2,004 (100.0%) | 20 (100.0%) |
Real Estate & Mortgages in Rincon Valley
Real Estate and Mortgage Overview in Rincon Valley
| Characteristic | Without Mortgage | With Mortgage |
| Housing Units | 646 | 1,358 |
| Median Property Value | $556,100 | $459,100 |
| Median Household Income | $141,458 | $604 |
| Monthly Housing Costs | $719 | $206 |
| Real Estate Taxes | $4,379 | $43 |
Property Value by Mortgage Status in Rincon Valley
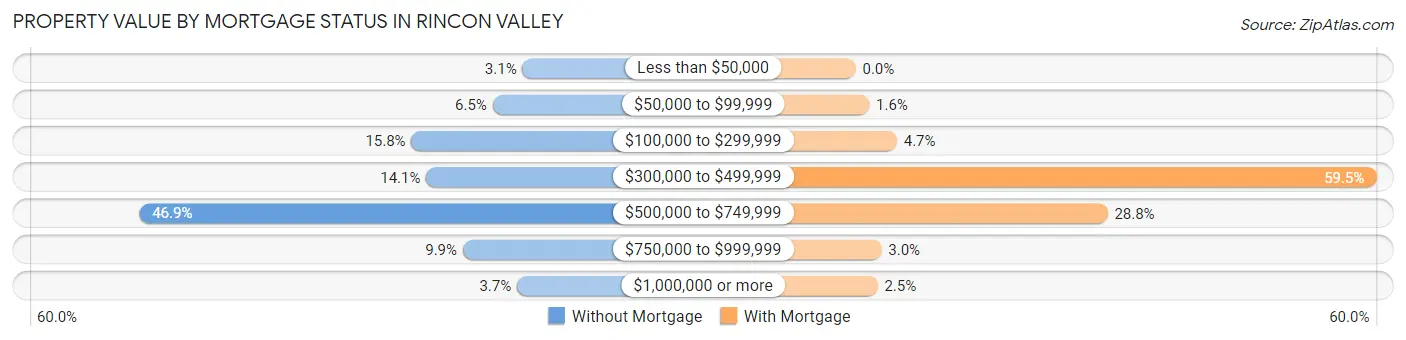
| Property Value | Without Mortgage | With Mortgage |
| Less than $50,000 | 20 (3.1%) | 0 (0.0%) |
| $50,000 to $99,999 | 42 (6.5%) | 21 (1.5%) |
| $100,000 to $299,999 | 102 (15.8%) | 64 (4.7%) |
| $300,000 to $499,999 | 91 (14.1%) | 808 (59.5%) |
| $500,000 to $749,999 | 303 (46.9%) | 391 (28.8%) |
| $750,000 to $999,999 | 64 (9.9%) | 40 (2.9%) |
| $1,000,000 or more | 24 (3.7%) | 34 (2.5%) |
| Total | 646 (100.0%) | 1,358 (100.0%) |
Household Income by Mortgage Status in Rincon Valley
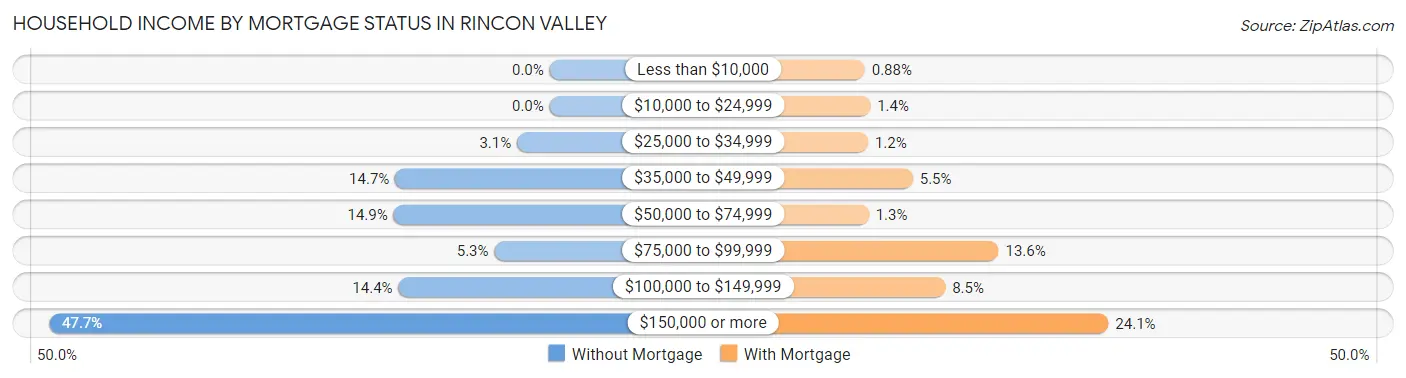
| Household Income | Without Mortgage | With Mortgage |
| Less than $10,000 | 0 (0.0%) | 12 (0.9%) |
| $10,000 to $24,999 | 0 (0.0%) | 19 (1.4%) |
| $25,000 to $34,999 | 20 (3.1%) | 16 (1.2%) |
| $35,000 to $49,999 | 95 (14.7%) | 74 (5.4%) |
| $50,000 to $74,999 | 96 (14.9%) | 17 (1.3%) |
| $75,000 to $99,999 | 34 (5.3%) | 185 (13.6%) |
| $100,000 to $149,999 | 93 (14.4%) | 116 (8.5%) |
| $150,000 or more | 308 (47.7%) | 327 (24.1%) |
| Total | 646 (100.0%) | 1,358 (100.0%) |
Property Value to Household Income Ratio in Rincon Valley
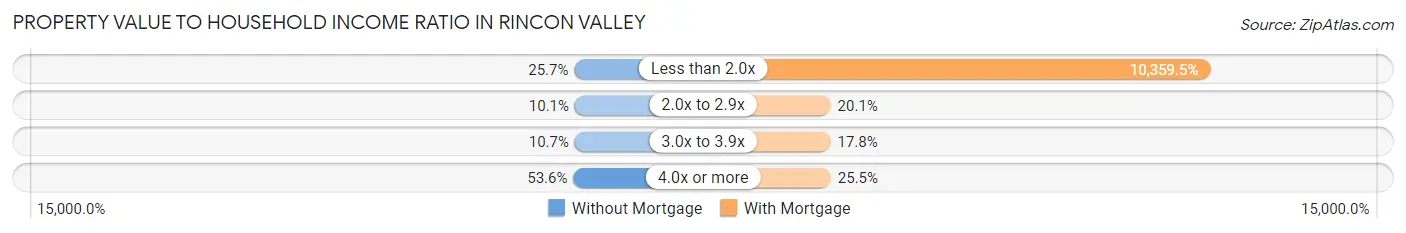
| Value-to-Income Ratio | Without Mortgage | With Mortgage |
| Less than 2.0x | 166 (25.7%) | 140,682 (10,359.5%) |
| 2.0x to 2.9x | 65 (10.1%) | 273 (20.1%) |
| 3.0x to 3.9x | 69 (10.7%) | 242 (17.8%) |
| 4.0x or more | 346 (53.6%) | 346 (25.5%) |
| Total | 646 (100.0%) | 1,358 (100.0%) |
Real Estate Taxes by Mortgage Status in Rincon Valley
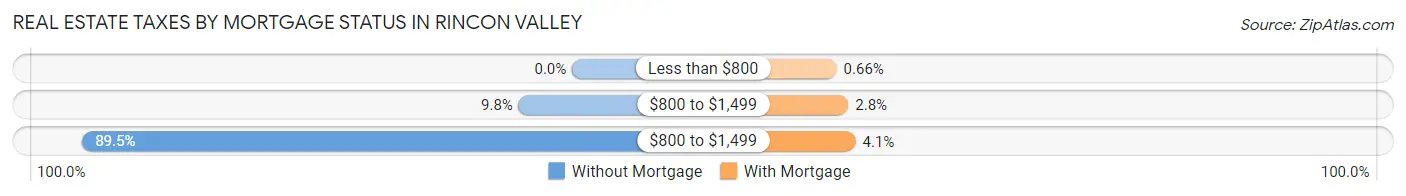
| Property Taxes | Without Mortgage | With Mortgage |
| Less than $800 | 0 (0.0%) | 9 (0.7%) |
| $800 to $1,499 | 63 (9.8%) | 38 (2.8%) |
| $800 to $1,499 | 578 (89.5%) | 56 (4.1%) |
| Total | 646 (100.0%) | 1,358 (100.0%) |
Health & Disability in Rincon Valley
Health Insurance Coverage by Age in Rincon Valley
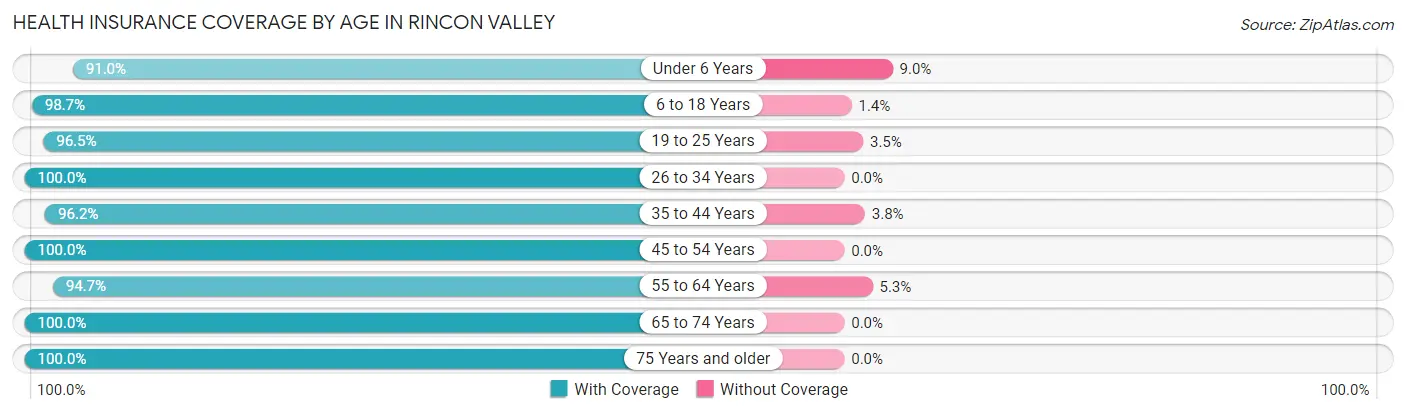
| Age Bracket | With Coverage | Without Coverage |
| Under 6 Years | 192 (91.0%) | 19 (9.0%) |
| 6 to 18 Years | 1,238 (98.7%) | 17 (1.3%) |
| 19 to 25 Years | 358 (96.5%) | 13 (3.5%) |
| 26 to 34 Years | 138 (100.0%) | 0 (0.0%) |
| 35 to 44 Years | 854 (96.2%) | 34 (3.8%) |
| 45 to 54 Years | 674 (100.0%) | 0 (0.0%) |
| 55 to 64 Years | 882 (94.7%) | 49 (5.3%) |
| 65 to 74 Years | 580 (100.0%) | 0 (0.0%) |
| 75 Years and older | 643 (100.0%) | 0 (0.0%) |
| Total | 5,559 (97.7%) | 132 (2.3%) |
Health Insurance Coverage by Citizenship Status in Rincon Valley
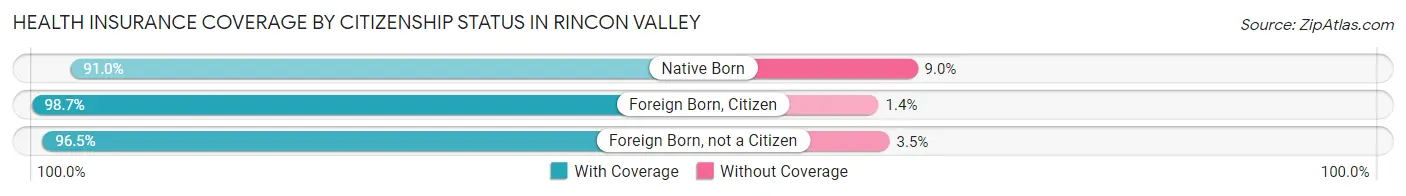
| Citizenship Status | With Coverage | Without Coverage |
| Native Born | 192 (91.0%) | 19 (9.0%) |
| Foreign Born, Citizen | 1,238 (98.7%) | 17 (1.3%) |
| Foreign Born, not a Citizen | 358 (96.5%) | 13 (3.5%) |
Health Insurance Coverage by Household Income in Rincon Valley
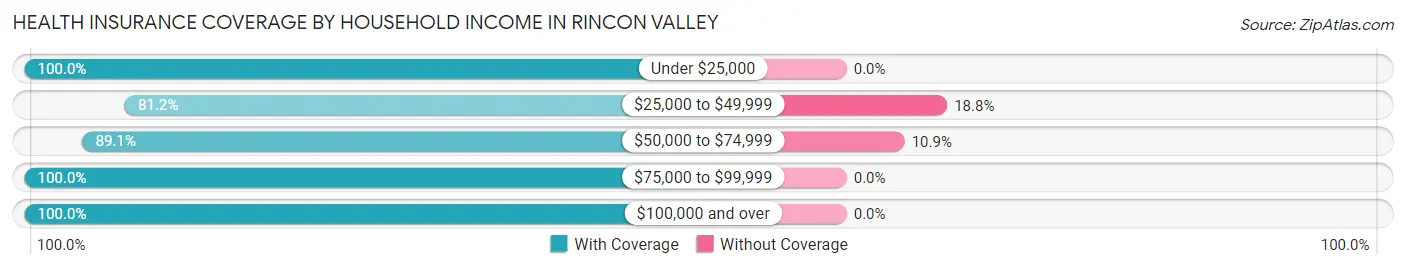
| Household Income | With Coverage | Without Coverage |
| Under $25,000 | 80 (100.0%) | 0 (0.0%) |
| $25,000 to $49,999 | 302 (81.2%) | 70 (18.8%) |
| $50,000 to $74,999 | 509 (89.1%) | 62 (10.9%) |
| $75,000 to $99,999 | 260 (100.0%) | 0 (0.0%) |
| $100,000 and over | 4,408 (100.0%) | 0 (0.0%) |
Public vs Private Health Insurance Coverage by Age in Rincon Valley
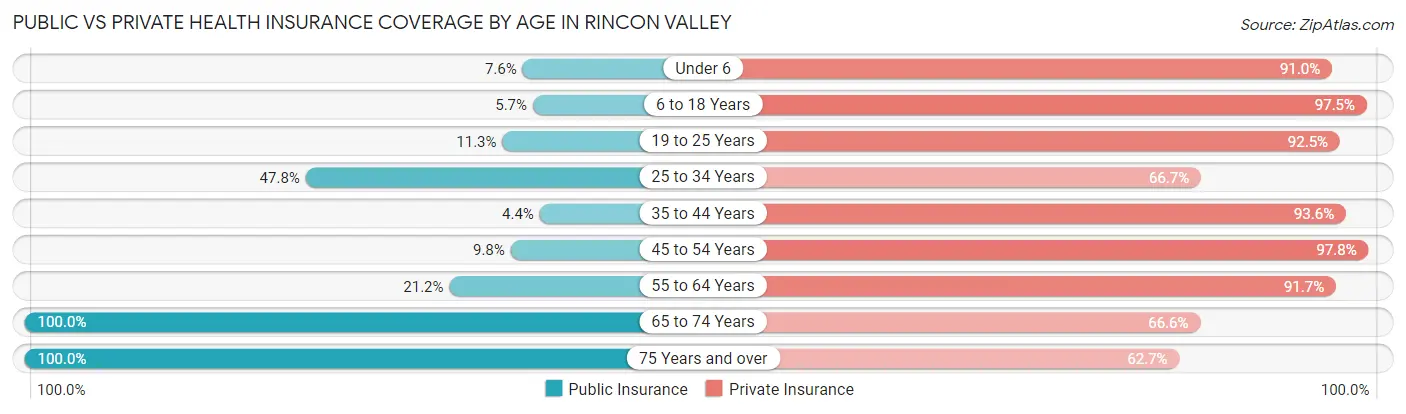
| Age Bracket | Public Insurance | Private Insurance |
| Under 6 | 16 (7.6%) | 192 (91.0%) |
| 6 to 18 Years | 71 (5.7%) | 1,223 (97.5%) |
| 19 to 25 Years | 42 (11.3%) | 343 (92.4%) |
| 25 to 34 Years | 66 (47.8%) | 92 (66.7%) |
| 35 to 44 Years | 39 (4.4%) | 831 (93.6%) |
| 45 to 54 Years | 66 (9.8%) | 659 (97.8%) |
| 55 to 64 Years | 197 (21.2%) | 854 (91.7%) |
| 65 to 74 Years | 580 (100.0%) | 386 (66.5%) |
| 75 Years and over | 643 (100.0%) | 403 (62.7%) |
| Total | 1,720 (30.2%) | 4,983 (87.6%) |
Disability Status by Sex by Age in Rincon Valley
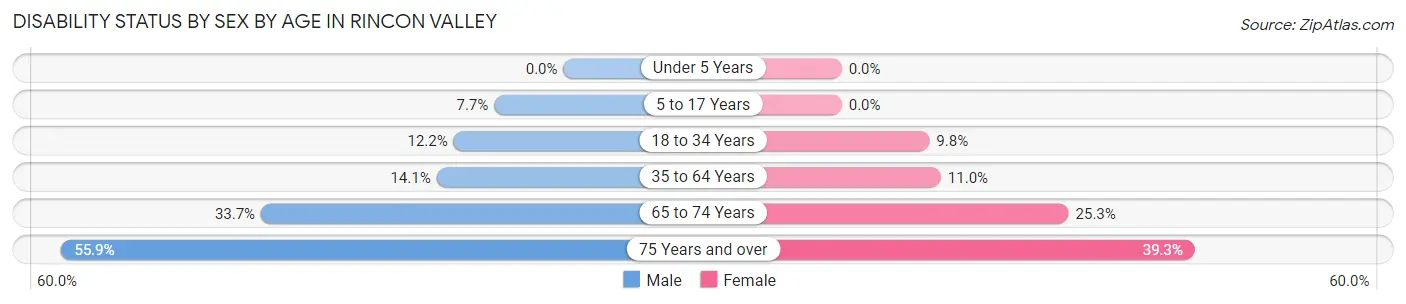
| Age Bracket | Male | Female |
| Under 5 Years | 0 (0.0%) | 0 (0.0%) |
| 5 to 17 Years | 59 (7.7%) | 0 (0.0%) |
| 18 to 34 Years | 34 (12.2%) | 28 (9.8%) |
| 35 to 64 Years | 168 (14.1%) | 144 (11.0%) |
| 65 to 74 Years | 98 (33.7%) | 73 (25.3%) |
| 75 Years and over | 213 (55.9%) | 103 (39.3%) |
Disability Class by Sex by Age in Rincon Valley
Disability Class: Hearing Difficulty
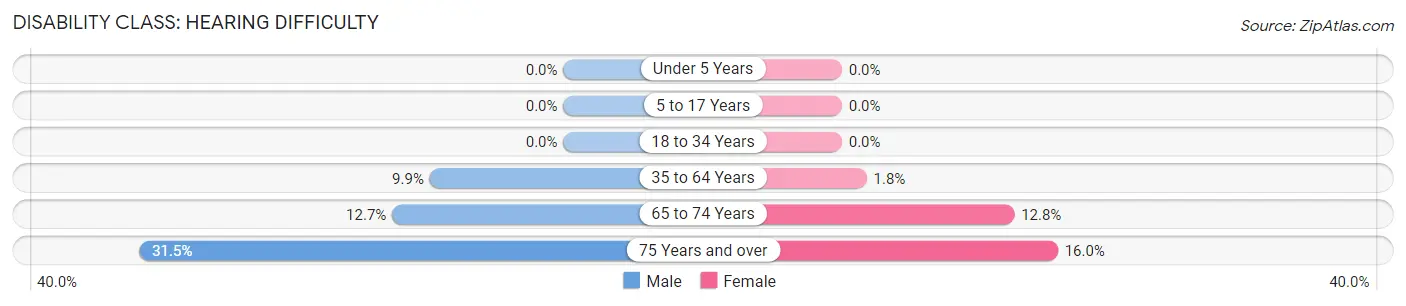
| Age Bracket | Male | Female |
| Under 5 Years | 0 (0.0%) | 0 (0.0%) |
| 5 to 17 Years | 0 (0.0%) | 0 (0.0%) |
| 18 to 34 Years | 0 (0.0%) | 0 (0.0%) |
| 35 to 64 Years | 118 (9.9%) | 24 (1.8%) |
| 65 to 74 Years | 37 (12.7%) | 37 (12.8%) |
| 75 Years and over | 120 (31.5%) | 42 (16.0%) |
Disability Class: Vision Difficulty
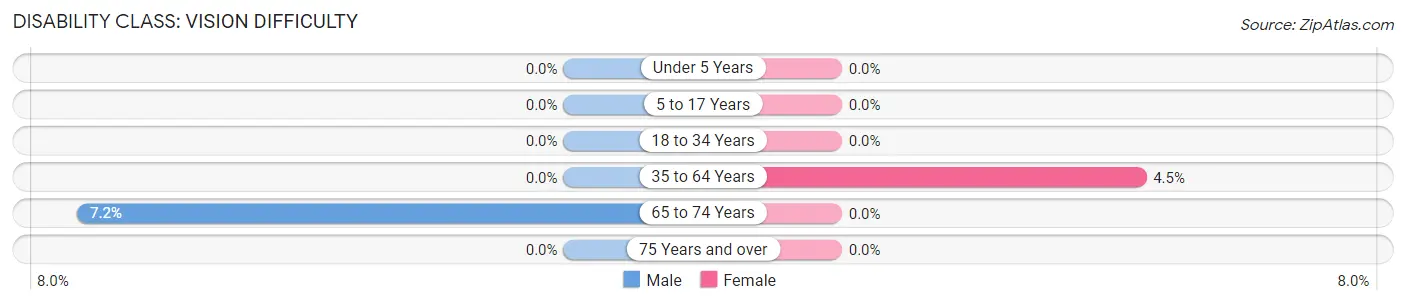
| Age Bracket | Male | Female |
| Under 5 Years | 0 (0.0%) | 0 (0.0%) |
| 5 to 17 Years | 0 (0.0%) | 0 (0.0%) |
| 18 to 34 Years | 0 (0.0%) | 0 (0.0%) |
| 35 to 64 Years | 0 (0.0%) | 59 (4.5%) |
| 65 to 74 Years | 21 (7.2%) | 0 (0.0%) |
| 75 Years and over | 0 (0.0%) | 0 (0.0%) |
Disability Class: Cognitive Difficulty
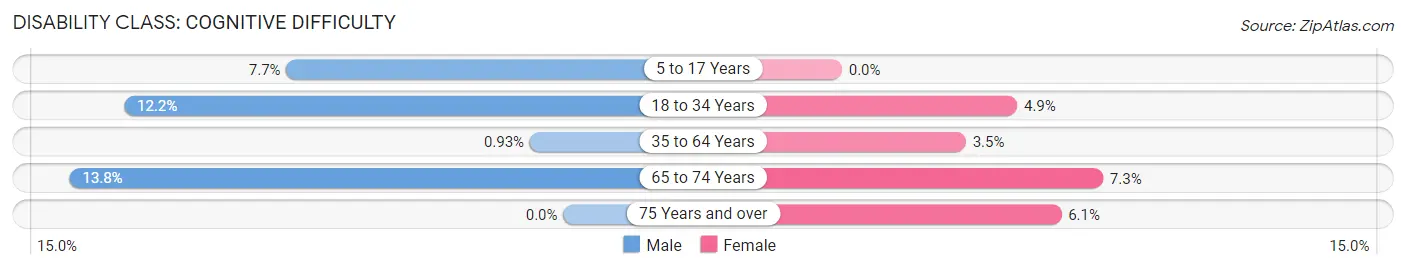
| Age Bracket | Male | Female |
| 5 to 17 Years | 59 (7.7%) | 0 (0.0%) |
| 18 to 34 Years | 34 (12.2%) | 14 (4.9%) |
| 35 to 64 Years | 11 (0.9%) | 45 (3.5%) |
| 65 to 74 Years | 40 (13.8%) | 21 (7.3%) |
| 75 Years and over | 0 (0.0%) | 16 (6.1%) |
Disability Class: Ambulatory Difficulty
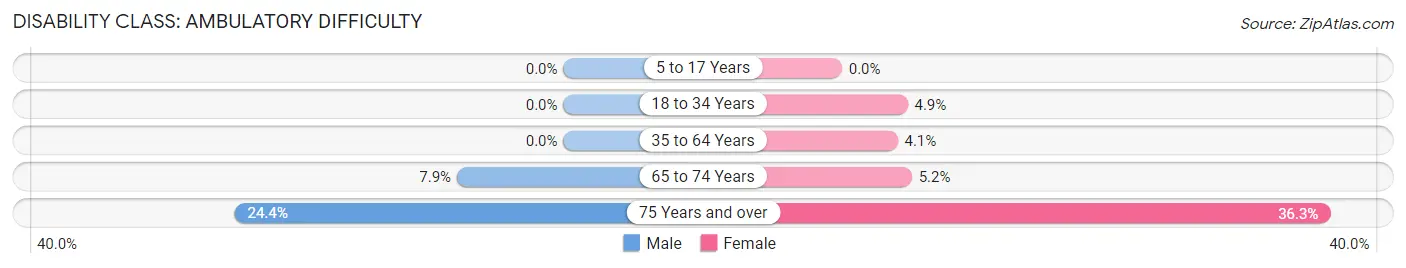
| Age Bracket | Male | Female |
| 5 to 17 Years | 0 (0.0%) | 0 (0.0%) |
| 18 to 34 Years | 0 (0.0%) | 14 (4.9%) |
| 35 to 64 Years | 0 (0.0%) | 54 (4.1%) |
| 65 to 74 Years | 23 (7.9%) | 15 (5.2%) |
| 75 Years and over | 93 (24.4%) | 95 (36.3%) |
Disability Class: Self-Care Difficulty
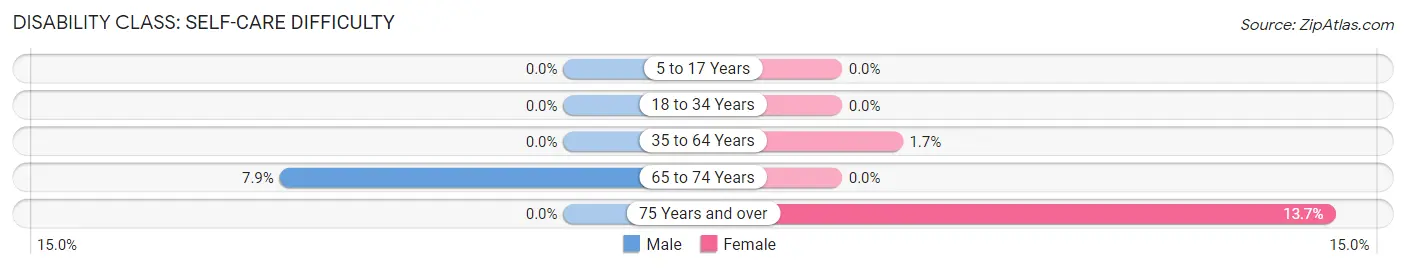
| Age Bracket | Male | Female |
| 5 to 17 Years | 0 (0.0%) | 0 (0.0%) |
| 18 to 34 Years | 0 (0.0%) | 0 (0.0%) |
| 35 to 64 Years | 0 (0.0%) | 22 (1.7%) |
| 65 to 74 Years | 23 (7.9%) | 0 (0.0%) |
| 75 Years and over | 0 (0.0%) | 36 (13.7%) |
Technology Access in Rincon Valley
Computing Device Access in Rincon Valley
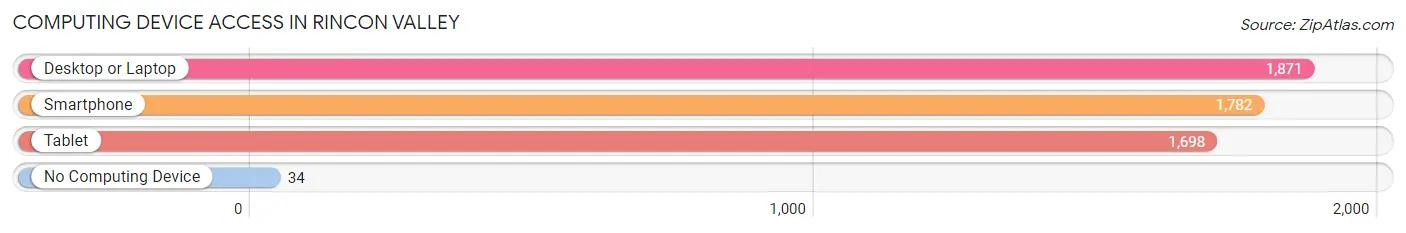
| Device Type | # Households | % Households |
| Desktop or Laptop | 1,871 | 92.4% |
| Smartphone | 1,782 | 88.0% |
| Tablet | 1,698 | 83.9% |
| No Computing Device | 34 | 1.7% |
| Total | 2,024 | 100.0% |
Internet Access in Rincon Valley
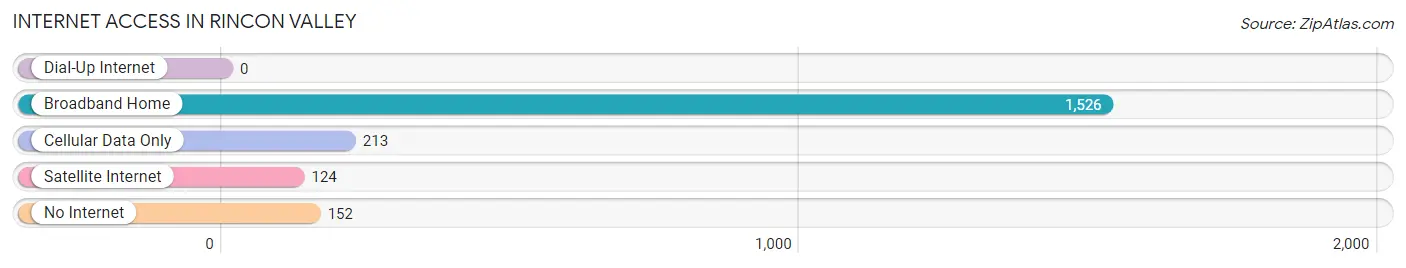
| Internet Type | # Households | % Households |
| Dial-Up Internet | 0 | 0.0% |
| Broadband Home | 1,526 | 75.4% |
| Cellular Data Only | 213 | 10.5% |
| Satellite Internet | 124 | 6.1% |
| No Internet | 152 | 7.5% |
| Total | 2,024 | 100.0% |
Rincon Valley Summary
Rincon Valley is a small unincorporated community located in Pima County, Arizona. It is situated in the foothills of the Rincon Mountains, approximately 25 miles east of Tucson. The area is known for its rural lifestyle and scenic views of the surrounding mountains.
History
Rincon Valley was first settled in the late 1800s by ranchers and farmers. The area was originally part of the San Xavier Indian Reservation, but was opened up to homesteaders in the early 1900s. The first post office was established in the area in 1912.
The area was primarily used for ranching and farming until the 1950s, when the population began to grow as people moved to the area for its rural lifestyle and scenic views. The population continued to grow throughout the 1960s and 1970s, and the area was eventually incorporated as a town in 1980.
Geography
Rincon Valley is located in the foothills of the Rincon Mountains, approximately 25 miles east of Tucson. The area is characterized by rolling hills and valleys, with elevations ranging from 2,000 to 4,000 feet. The area is home to a variety of wildlife, including deer, javelina, coyotes, and bobcats.
The climate in Rincon Valley is semi-arid, with hot summers and mild winters. The average annual temperature is around 70 degrees Fahrenheit, with temperatures ranging from the mid-90s in the summer to the mid-50s in the winter.
Economy
Rincon Valley’s economy is primarily based on agriculture and tourism. The area is home to several small farms and ranches, which produce a variety of crops, including alfalfa, cotton, and wheat. The area is also popular with tourists, who come to enjoy the scenic views and outdoor activities.
The area is also home to several small businesses, including restaurants, shops, and art galleries. The area is also home to a number of wineries, which produce a variety of wines.
Demographics
As of the 2010 census, the population of Rincon Valley was 2,845. The population is primarily white (90.3%), with a small Hispanic population (7.2%). The median household income is $50,000, and the median age is 44.
Rincon Valley is a small, rural community with a strong sense of community. The area is known for its scenic views and rural lifestyle, and is a popular destination for tourists and outdoor enthusiasts.
Common Questions
What is Per Capita Income in Rincon Valley?
Per Capita income in Rincon Valley is $51,313.
What is the Median Family Income in Rincon Valley?
Median Family Income in Rincon Valley is $147,220.
What is the Median Household income in Rincon Valley?
Median Household Income in Rincon Valley is $137,500.
What is Income or Wage Gap in Rincon Valley?
Income or Wage Gap in Rincon Valley is 55.3%.
Women in Rincon Valley earn 44.7 cents for every dollar earned by a man.
What is Inequality or Gini Index in Rincon Valley?
Inequality or Gini Index in Rincon Valley is 0.32.
What is the Total Population of Rincon Valley?
Total Population of Rincon Valley is 5,712.
What is the Total Male Population of Rincon Valley?
Total Male Population of Rincon Valley is 3,036.
What is the Total Female Population of Rincon Valley?
Total Female Population of Rincon Valley is 2,676.
What is the Ratio of Males per 100 Females in Rincon Valley?
There are 113.45 Males per 100 Females in Rincon Valley.
What is the Ratio of Females per 100 Males in Rincon Valley?
There are 88.14 Females per 100 Males in Rincon Valley.
What is the Median Population Age in Rincon Valley?
Median Population Age in Rincon Valley is 44.8 Years.
What is the Average Family Size in Rincon Valley
Average Family Size in Rincon Valley is 3.1 People.
What is the Average Household Size in Rincon Valley
Average Household Size in Rincon Valley is 2.8 People.
How Large is the Labor Force in Rincon Valley?
There are 2,494 People in the Labor Forcein in Rincon Valley.
What is the Percentage of People in the Labor Force in Rincon Valley?
53.6% of People are in the Labor Force in Rincon Valley.
What is the Unemployment Rate in Rincon Valley?
Unemployment Rate in Rincon Valley is 1.8%.