Pima, AZ Map & Demographics
Pima Map
Pima Overview
$27,424
PER CAPITA INCOME
$93,250
AVG FAMILY INCOME
$67,880
AVG HOUSEHOLD INCOME
42.5%
WAGE / INCOME GAP [ % ]
57.5¢/ $1
WAGE / INCOME GAP [ $ ]
0.33
INEQUALITY / GINI INDEX
2,847
TOTAL POPULATION
1,411
MALE POPULATION
1,436
FEMALE POPULATION
98.26
MALES / 100 FEMALES
101.77
FEMALES / 100 MALES
33.2
MEDIAN AGE
3.3
AVG FAMILY SIZE
2.9
AVG HOUSEHOLD SIZE
1,329
LABOR FORCE [ PEOPLE ]
61.7%
PERCENT IN LABOR FORCE
1.8%
UNEMPLOYMENT RATE
Pima Zip Codes
Pima Area Codes
Income in Pima
Income Overview in Pima
Per Capita Income in Pima is $27,424, while median incomes of families and households are $93,250 and $67,880 respectively.
| Characteristic | Number | Measure |
| Per Capita Income | 2,847 | $27,424 |
| Median Family Income | 765 | $93,250 |
| Mean Family Income | 765 | $93,977 |
| Median Household Income | 981 | $67,880 |
| Mean Household Income | 981 | $83,091 |
| Income Deficit | 765 | $0 |
| Wage / Income Gap (%) | 2,847 | 42.54% |
| Wage / Income Gap ($) | 2,847 | 57.46¢ per $1 |
| Gini / Inequality Index | 2,847 | 0.33 |
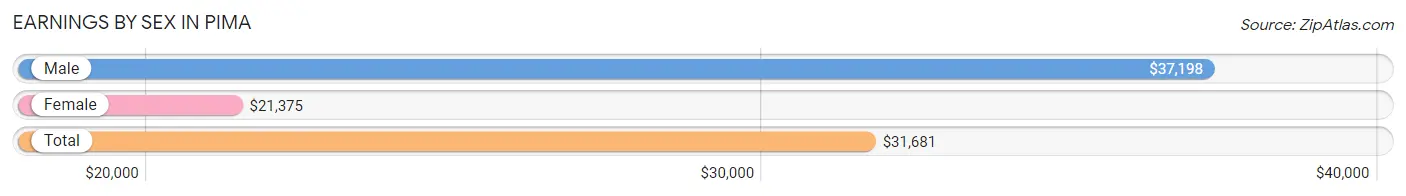
Earnings by Sex in Pima
Average Earnings in Pima are $31,681, $37,198 for men and $21,375 for women, a difference of 42.5%.
| Sex | Number | Average Earnings |
| Male | 737 (51.5%) | $37,198 |
| Female | 693 (48.5%) | $21,375 |
| Total | 1,430 (100.0%) | $31,681 |
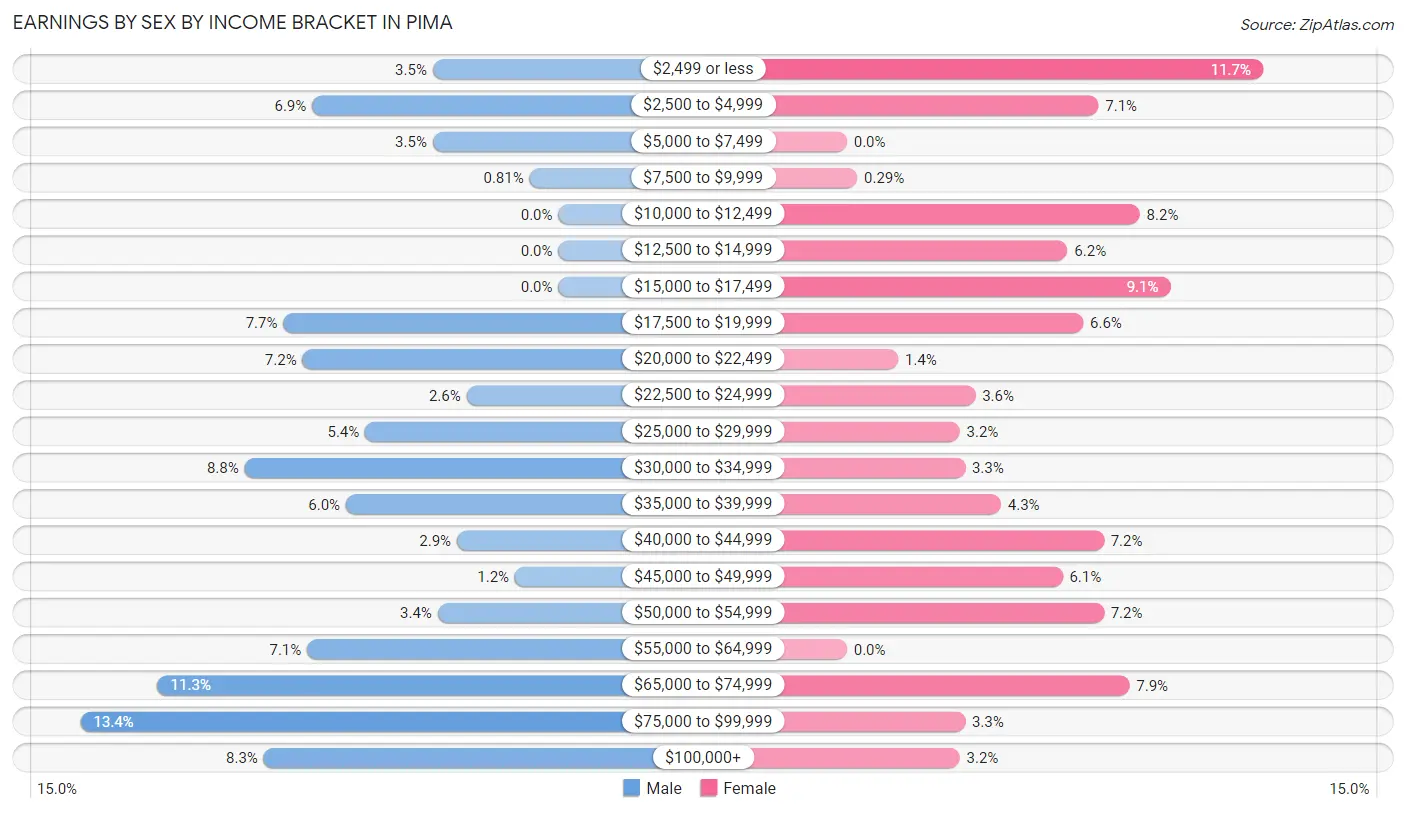
Earnings by Sex by Income Bracket in Pima
The most common earnings brackets in Pima are $75,000 to $99,999 for men (99 | 13.4%) and $2,499 or less for women (81 | 11.7%).
| Income | Male | Female |
| $2,499 or less | 26 (3.5%) | 81 (11.7%) |
| $2,500 to $4,999 | 51 (6.9%) | 49 (7.1%) |
| $5,000 to $7,499 | 26 (3.5%) | 0 (0.0%) |
| $7,500 to $9,999 | 6 (0.8%) | 2 (0.3%) |
| $10,000 to $12,499 | 0 (0.0%) | 57 (8.2%) |
| $12,500 to $14,999 | 0 (0.0%) | 43 (6.2%) |
| $15,000 to $17,499 | 0 (0.0%) | 63 (9.1%) |
| $17,500 to $19,999 | 57 (7.7%) | 46 (6.6%) |
| $20,000 to $22,499 | 53 (7.2%) | 10 (1.4%) |
| $22,500 to $24,999 | 19 (2.6%) | 25 (3.6%) |
| $25,000 to $29,999 | 40 (5.4%) | 22 (3.2%) |
| $30,000 to $34,999 | 65 (8.8%) | 23 (3.3%) |
| $35,000 to $39,999 | 44 (6.0%) | 30 (4.3%) |
| $40,000 to $44,999 | 21 (2.9%) | 50 (7.2%) |
| $45,000 to $49,999 | 9 (1.2%) | 42 (6.1%) |
| $50,000 to $54,999 | 25 (3.4%) | 50 (7.2%) |
| $55,000 to $64,999 | 52 (7.1%) | 0 (0.0%) |
| $65,000 to $74,999 | 83 (11.3%) | 55 (7.9%) |
| $75,000 to $99,999 | 99 (13.4%) | 23 (3.3%) |
| $100,000+ | 61 (8.3%) | 22 (3.2%) |
| Total | 737 (100.0%) | 693 (100.0%) |
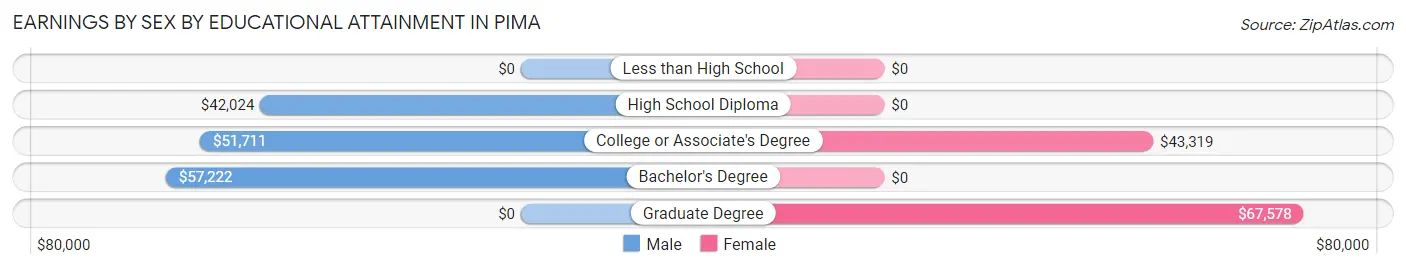
Earnings by Sex by Educational Attainment in Pima
Average earnings in Pima are $51,316 for men and $43,257 for women, a difference of 15.7%. Men with an educational attainment of bachelor's degree enjoy the highest average annual earnings of $57,222, while those with high school diploma education earn the least with $42,024. Women with an educational attainment of graduate degree earn the most with the average annual earnings of $67,578, while those with college or associate's degree education have the smallest earnings of $43,319.
| Educational Attainment | Male Income | Female Income |
| Less than High School | - | - |
| High School Diploma | $42,024 | $0 |
| College or Associate's Degree | $51,711 | $43,319 |
| Bachelor's Degree | $57,222 | $0 |
| Graduate Degree | - | - |
| Total | $51,316 | $43,257 |
Family Income in Pima
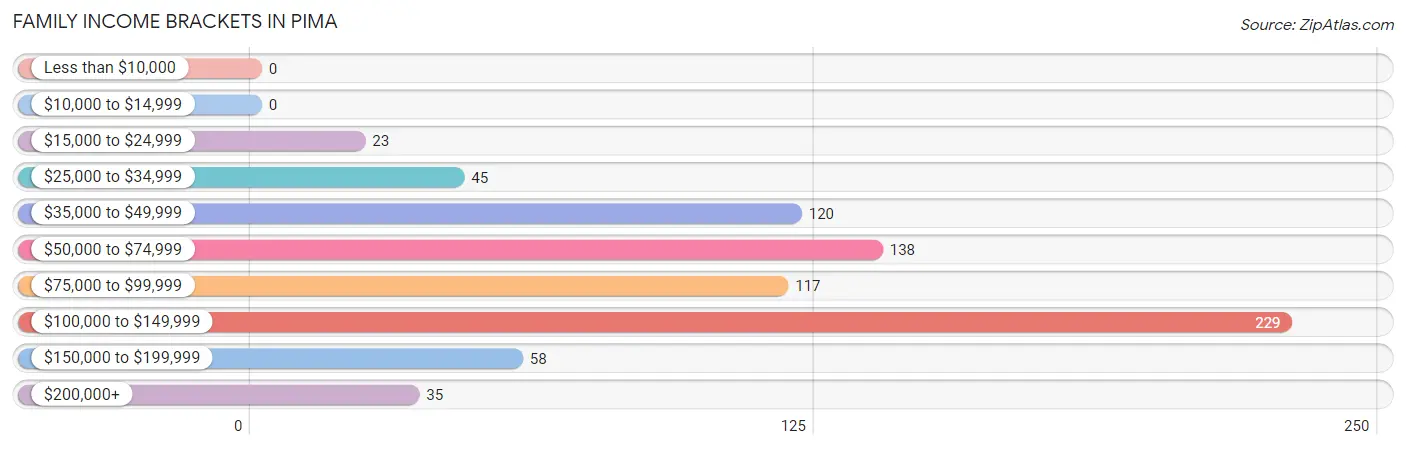
Family Income Brackets in Pima
According to the Pima family income data, there are 229 families falling into the $100,000 to $149,999 income range, which is the most common income bracket and makes up 29.9% of all families.
| Income Bracket | # Families | % Families |
| Less than $10,000 | 0 | 0.0% |
| $10,000 to $14,999 | 0 | 0.0% |
| $15,000 to $24,999 | 23 | 3.0% |
| $25,000 to $34,999 | 45 | 5.9% |
| $35,000 to $49,999 | 120 | 15.7% |
| $50,000 to $74,999 | 138 | 18.0% |
| $75,000 to $99,999 | 117 | 15.3% |
| $100,000 to $149,999 | 229 | 29.9% |
| $150,000 to $199,999 | 58 | 7.6% |
| $200,000+ | 35 | 4.6% |
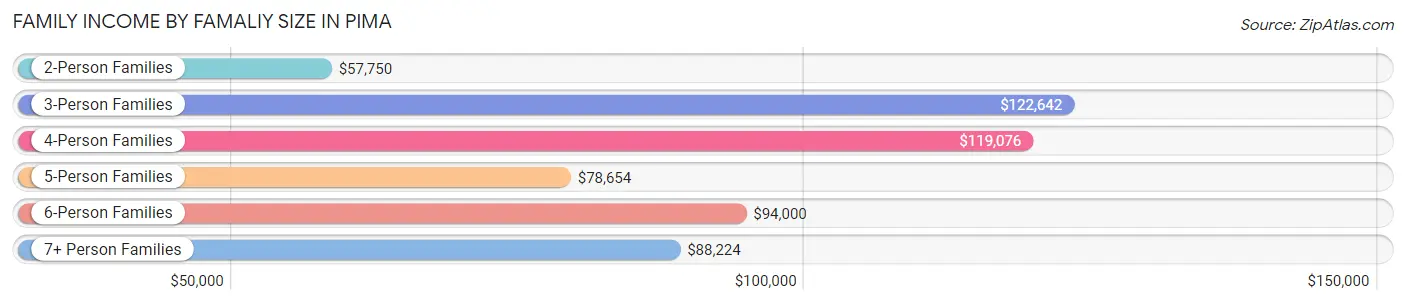
Family Income by Famaliy Size in Pima
3-person families (149 | 19.5%) account for the highest median family income in Pima with $122,642 per family, while 3-person families (149 | 19.5%) have the highest median income of $40,881 per family member.
| Income Bracket | # Families | Median Income |
| 2-Person Families | 296 (38.7%) | $57,750 |
| 3-Person Families | 149 (19.5%) | $122,642 |
| 4-Person Families | 187 (24.4%) | $119,076 |
| 5-Person Families | 66 (8.6%) | $78,654 |
| 6-Person Families | 24 (3.1%) | $94,000 |
| 7+ Person Families | 43 (5.6%) | $88,224 |
| Total | 765 (100.0%) | $93,250 |
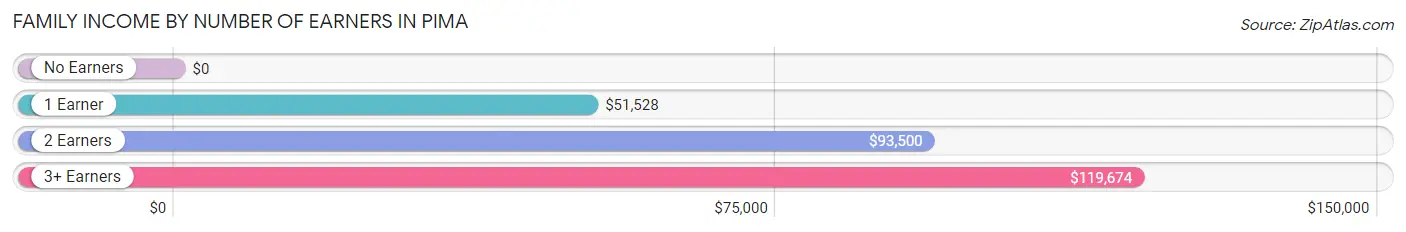
Family Income by Number of Earners in Pima
| Number of Earners | # Families | Median Income |
| No Earners | 156 (20.4%) | $0 |
| 1 Earner | 157 (20.5%) | $51,528 |
| 2 Earners | 310 (40.5%) | $93,500 |
| 3+ Earners | 142 (18.6%) | $119,674 |
| Total | 765 (100.0%) | $93,250 |
Household Income in Pima
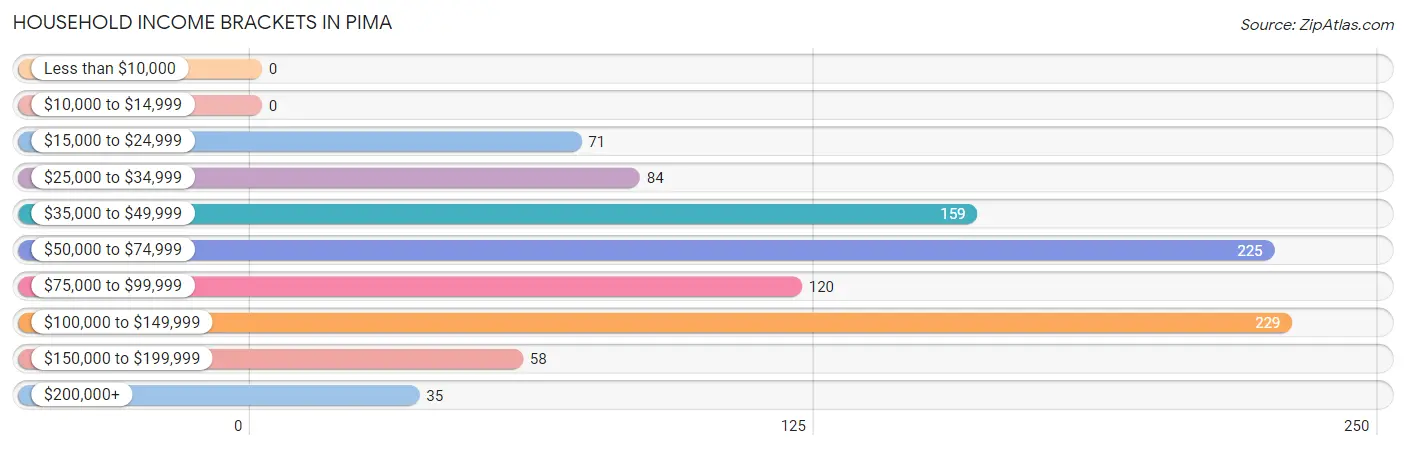
Household Income Brackets in Pima
With 229 households falling in the category, the $100,000 to $149,999 income range is the most frequent in Pima, accounting for 23.3% of all households.
| Income Bracket | # Households | % Households |
| Less than $10,000 | 0 | 0.0% |
| $10,000 to $14,999 | 0 | 0.0% |
| $15,000 to $24,999 | 71 | 7.2% |
| $25,000 to $34,999 | 84 | 8.6% |
| $35,000 to $49,999 | 159 | 16.2% |
| $50,000 to $74,999 | 225 | 22.9% |
| $75,000 to $99,999 | 120 | 12.2% |
| $100,000 to $149,999 | 229 | 23.3% |
| $150,000 to $199,999 | 58 | 5.9% |
| $200,000+ | 35 | 3.6% |
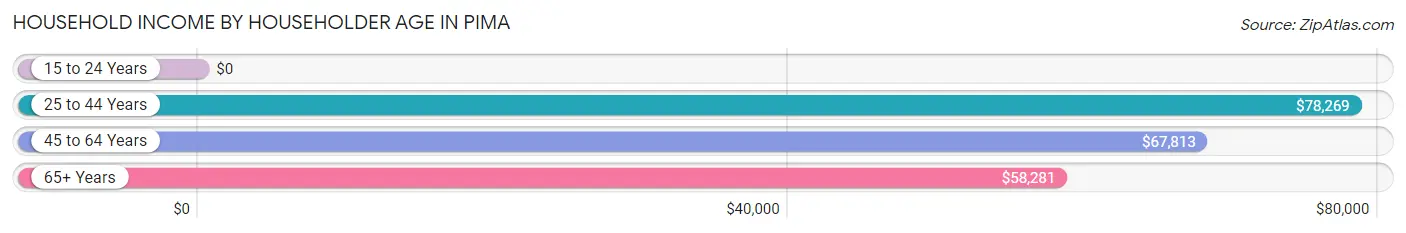
Household Income by Householder Age in Pima
The median household income in Pima is $67,880, with the highest median household income of $78,269 found in the 25 to 44 years age bracket for the primary householder. A total of 286 households (29.1%) fall into this category. Meanwhile, the 15 to 24 years age bracket for the primary householder has the lowest median household income of $0, with 64 households (6.5%) in this group.
| Income Bracket | # Households | Median Income |
| 15 to 24 Years | 64 (6.5%) | $0 |
| 25 to 44 Years | 286 (29.1%) | $78,269 |
| 45 to 64 Years | 351 (35.8%) | $67,813 |
| 65+ Years | 280 (28.5%) | $58,281 |
| Total | 981 (100.0%) | $67,880 |
Poverty in Pima
Income Below Poverty by Sex and Age in Pima
With 7.1% poverty level for males and 3.8% for females among the residents of Pima, 5 year old males and 55 to 64 year old females are the most vulnerable to poverty, with 22 males (73.3%) and 21 females (27.6%) in their respective age groups living below the poverty level.
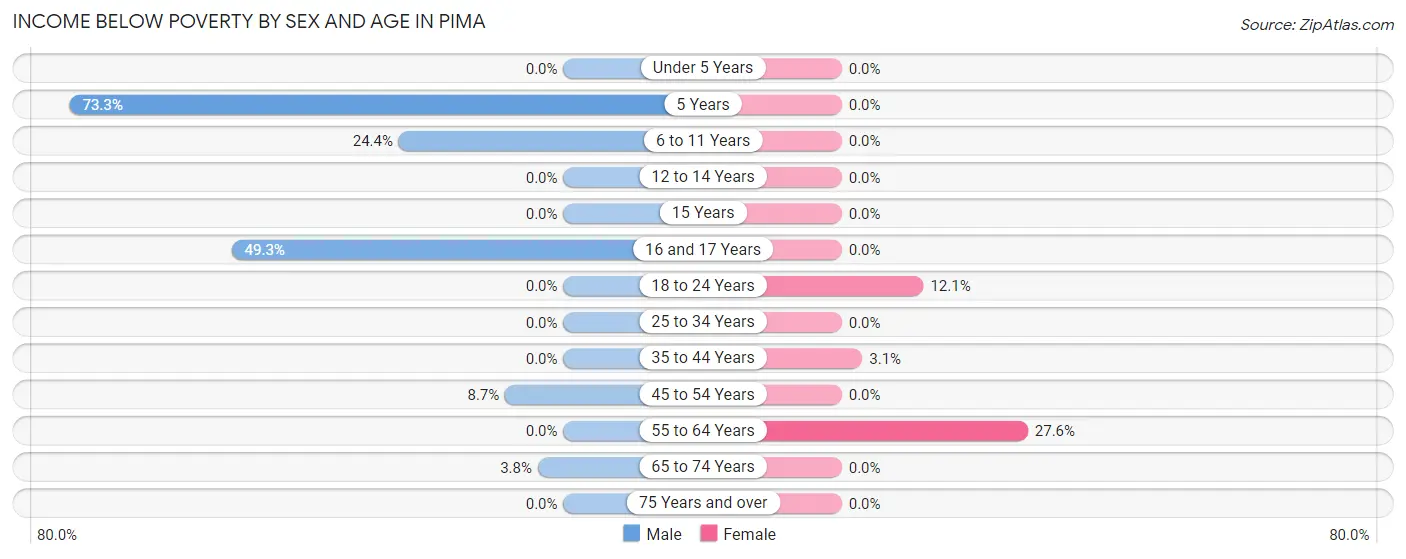
| Age Bracket | Male | Female |
| Under 5 Years | 0 (0.0%) | 0 (0.0%) |
| 5 Years | 22 (73.3%) | 0 (0.0%) |
| 6 to 11 Years | 22 (24.4%) | 0 (0.0%) |
| 12 to 14 Years | 0 (0.0%) | 0 (0.0%) |
| 15 Years | 0 (0.0%) | 0 (0.0%) |
| 16 and 17 Years | 33 (49.2%) | 0 (0.0%) |
| 18 to 24 Years | 0 (0.0%) | 29 (12.1%) |
| 25 to 34 Years | 0 (0.0%) | 0 (0.0%) |
| 35 to 44 Years | 0 (0.0%) | 5 (3.0%) |
| 45 to 54 Years | 18 (8.6%) | 0 (0.0%) |
| 55 to 64 Years | 0 (0.0%) | 21 (27.6%) |
| 65 to 74 Years | 5 (3.8%) | 0 (0.0%) |
| 75 Years and over | 0 (0.0%) | 0 (0.0%) |
| Total | 100 (7.1%) | 55 (3.8%) |
Income Above Poverty by Sex and Age in Pima
According to the poverty statistics in Pima, males aged under 5 years and females aged under 5 years are the age groups that are most secure financially, with 100.0% of males and 100.0% of females in these age groups living above the poverty line.
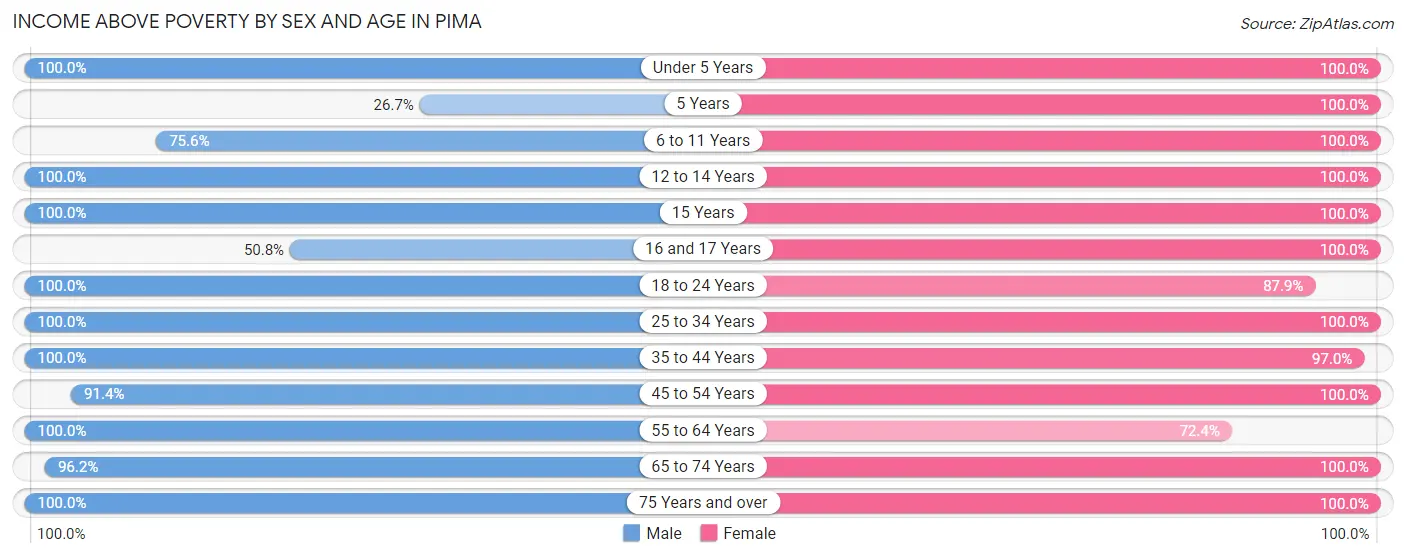
| Age Bracket | Male | Female |
| Under 5 Years | 69 (100.0%) | 75 (100.0%) |
| 5 Years | 8 (26.7%) | 26 (100.0%) |
| 6 to 11 Years | 68 (75.6%) | 143 (100.0%) |
| 12 to 14 Years | 116 (100.0%) | 76 (100.0%) |
| 15 Years | 9 (100.0%) | 54 (100.0%) |
| 16 and 17 Years | 34 (50.7%) | 23 (100.0%) |
| 18 to 24 Years | 159 (100.0%) | 210 (87.9%) |
| 25 to 34 Years | 114 (100.0%) | 198 (100.0%) |
| 35 to 44 Years | 153 (100.0%) | 159 (97.0%) |
| 45 to 54 Years | 190 (91.3%) | 149 (100.0%) |
| 55 to 64 Years | 153 (100.0%) | 55 (72.4%) |
| 65 to 74 Years | 127 (96.2%) | 130 (100.0%) |
| 75 Years and over | 106 (100.0%) | 83 (100.0%) |
| Total | 1,306 (92.9%) | 1,381 (96.2%) |
Income Below Poverty Among Married-Couple Families in Pima
The poverty statistics for married-couple families in Pima show that 0.9% or 5 of the total 580 families live below the poverty line. Families with no children have the highest poverty rate of 1.6%, comprising of 5 families. On the other hand, families with 1 or 2 children have the lowest poverty rate of 0.0%, which includes 0 families.
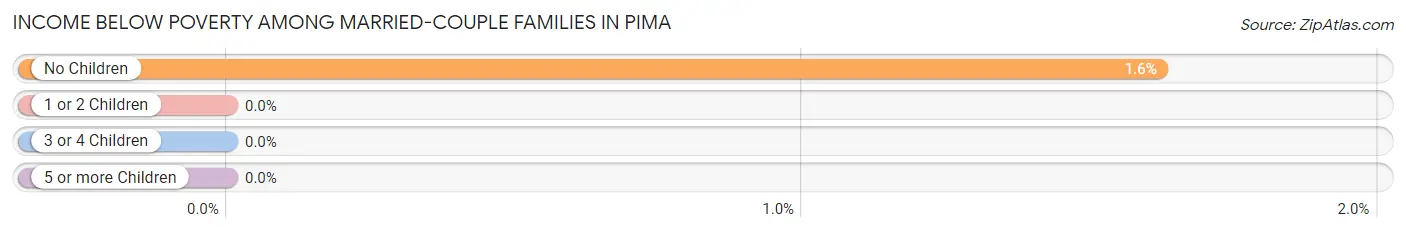
| Children | Above Poverty | Below Poverty |
| No Children | 303 (98.4%) | 5 (1.6%) |
| 1 or 2 Children | 193 (100.0%) | 0 (0.0%) |
| 3 or 4 Children | 55 (100.0%) | 0 (0.0%) |
| 5 or more Children | 24 (100.0%) | 0 (0.0%) |
| Total | 575 (99.1%) | 5 (0.9%) |
Income Below Poverty Among Single-Parent Households in Pima
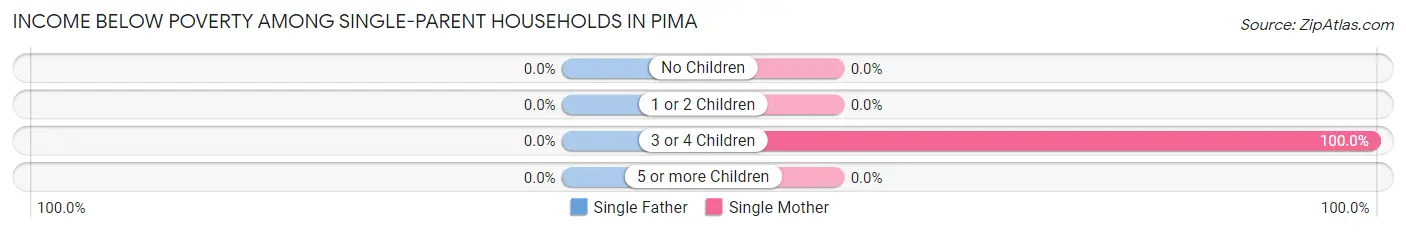
| Children | Single Father | Single Mother |
| No Children | 0 (0.0%) | 0 (0.0%) |
| 1 or 2 Children | 0 (0.0%) | 0 (0.0%) |
| 3 or 4 Children | 0 (0.0%) | 17 (100.0%) |
| 5 or more Children | 0 (0.0%) | 0 (0.0%) |
| Total | 0 (0.0%) | 17 (24.3%) |
Income Below Poverty Among Married-Couple vs Single-Parent Households in Pima
The poverty data for Pima shows that 5 of the married-couple family households (0.9%) and 17 of the single-parent households (9.2%) are living below the poverty level. Within the married-couple family households, those with no children have the highest poverty rate, with 5 households (1.6%) falling below the poverty line. Among the single-parent households, those with 3 or 4 children have the highest poverty rate, with 17 household (100.0%) living below poverty.
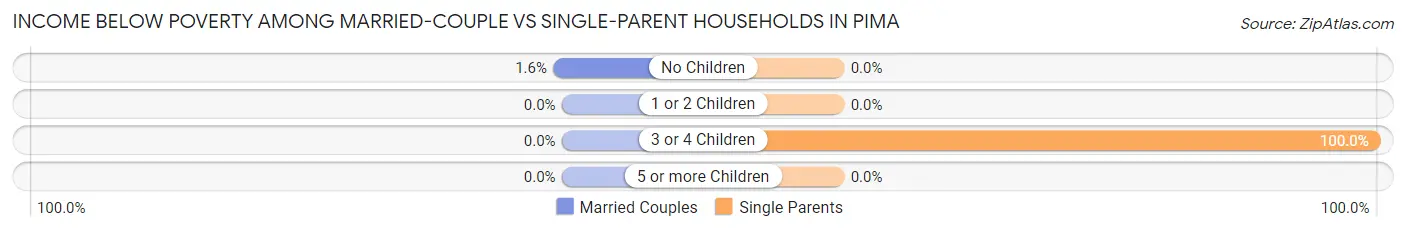
| Children | Married-Couple Families | Single-Parent Households |
| No Children | 5 (1.6%) | 0 (0.0%) |
| 1 or 2 Children | 0 (0.0%) | 0 (0.0%) |
| 3 or 4 Children | 0 (0.0%) | 17 (100.0%) |
| 5 or more Children | 0 (0.0%) | 0 (0.0%) |
| Total | 5 (0.9%) | 17 (9.2%) |
Race in Pima
The most populous races in Pima are White / Caucasian (2,564 | 90.1%), Hispanic or Latino (699 | 24.5%), and Two or more Races (177 | 6.2%).
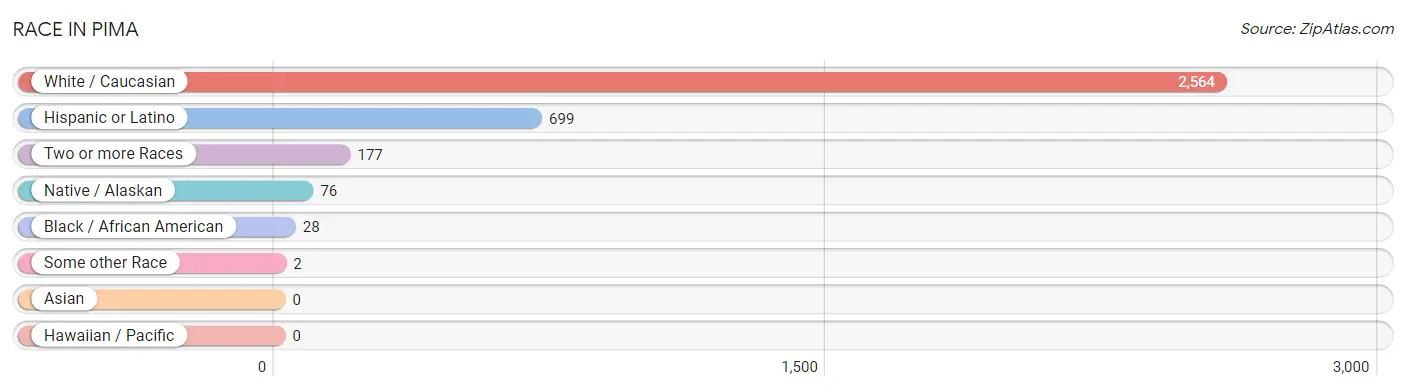
| Race | # Population | % Population |
| Asian | 0 | 0.0% |
| Black / African American | 28 | 1.0% |
| Hawaiian / Pacific | 0 | 0.0% |
| Hispanic or Latino | 699 | 24.5% |
| Native / Alaskan | 76 | 2.7% |
| White / Caucasian | 2,564 | 90.1% |
| Two or more Races | 177 | 6.2% |
| Some other Race | 2 | 0.1% |
| Total | 2,847 | 100.0% |
Ancestry in Pima
The most populous ancestries reported in Pima are Mexican (618 | 21.7%), English (463 | 16.3%), German (300 | 10.5%), Danish (185 | 6.5%), and Irish (169 | 5.9%), together accounting for 61.0% of all Pima residents.
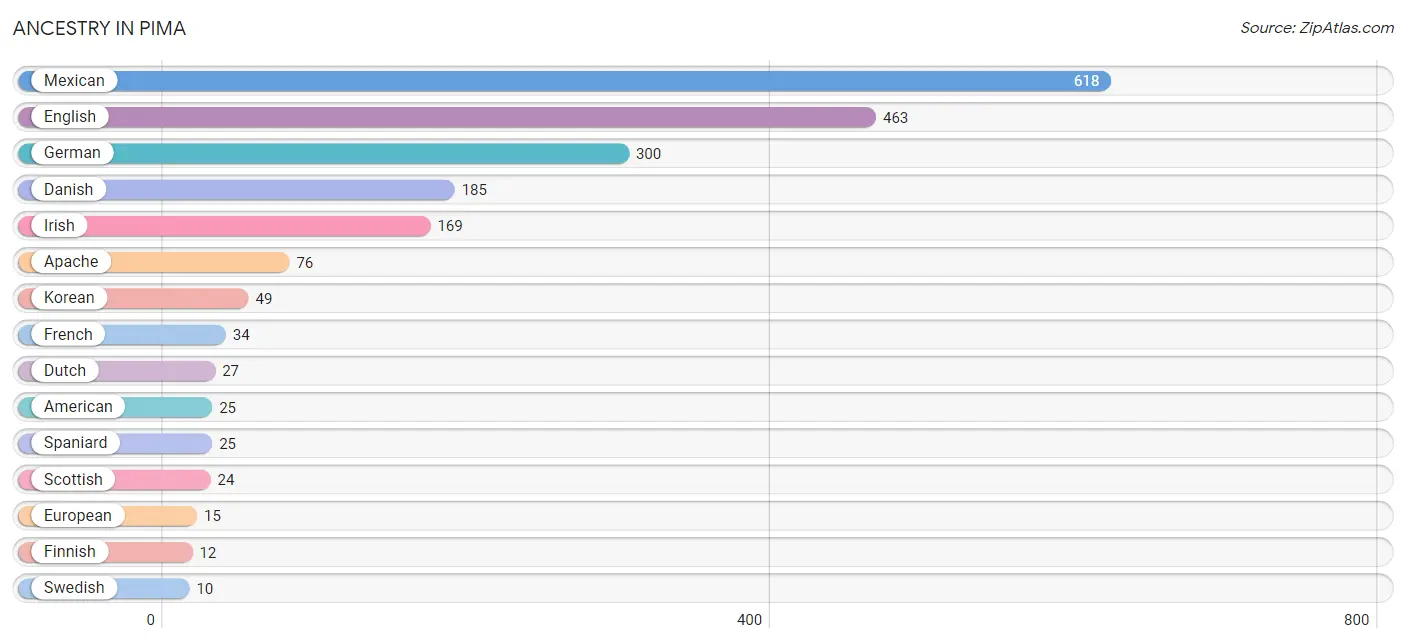
| Ancestry | # Population | % Population |
| American | 25 | 0.9% |
| Apache | 76 | 2.7% |
| Danish | 185 | 6.5% |
| Dutch | 27 | 0.9% |
| English | 463 | 16.3% |
| European | 15 | 0.5% |
| Finnish | 12 | 0.4% |
| French | 34 | 1.2% |
| German | 300 | 10.5% |
| Greek | 5 | 0.2% |
| Irish | 169 | 5.9% |
| Italian | 4 | 0.1% |
| Korean | 49 | 1.7% |
| Mexican | 618 | 21.7% |
| Russian | 3 | 0.1% |
| Scandinavian | 4 | 0.1% |
| Scottish | 24 | 0.8% |
| Spaniard | 25 | 0.9% |
| Spanish | 5 | 0.2% |
| Swedish | 10 | 0.4% | View All 20 Rows |
Immigrants in Pima
The most numerous immigrant groups reported in Pima came from , and Canada (27 | 0.9%), together accounting for 0.9% of all Pima residents.

| Immigration Origin | # Population | % Population |
| Canada | 27 | 0.9% | View All 1 Rows |
Sex and Age in Pima
Sex and Age in Pima
The most populous age groups in Pima are 15 to 19 Years (159 | 11.3%) for men and 15 to 19 Years (163 | 11.4%) for women.
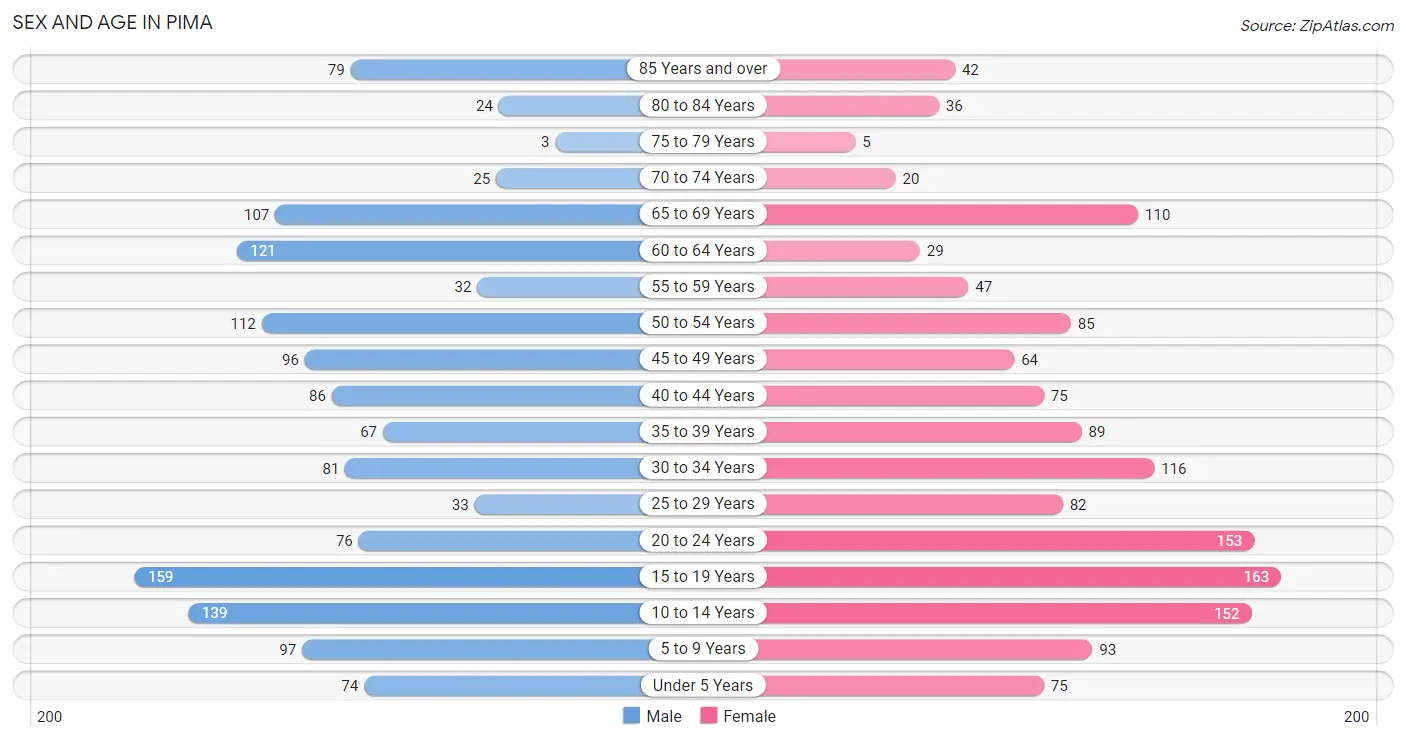
| Age Bracket | Male | Female |
| Under 5 Years | 74 (5.2%) | 75 (5.2%) |
| 5 to 9 Years | 97 (6.9%) | 93 (6.5%) |
| 10 to 14 Years | 139 (9.9%) | 152 (10.6%) |
| 15 to 19 Years | 159 (11.3%) | 163 (11.4%) |
| 20 to 24 Years | 76 (5.4%) | 153 (10.6%) |
| 25 to 29 Years | 33 (2.3%) | 82 (5.7%) |
| 30 to 34 Years | 81 (5.7%) | 116 (8.1%) |
| 35 to 39 Years | 67 (4.8%) | 89 (6.2%) |
| 40 to 44 Years | 86 (6.1%) | 75 (5.2%) |
| 45 to 49 Years | 96 (6.8%) | 64 (4.5%) |
| 50 to 54 Years | 112 (7.9%) | 85 (5.9%) |
| 55 to 59 Years | 32 (2.3%) | 47 (3.3%) |
| 60 to 64 Years | 121 (8.6%) | 29 (2.0%) |
| 65 to 69 Years | 107 (7.6%) | 110 (7.7%) |
| 70 to 74 Years | 25 (1.8%) | 20 (1.4%) |
| 75 to 79 Years | 3 (0.2%) | 5 (0.4%) |
| 80 to 84 Years | 24 (1.7%) | 36 (2.5%) |
| 85 Years and over | 79 (5.6%) | 42 (2.9%) |
| Total | 1,411 (100.0%) | 1,436 (100.0%) |
Families and Households in Pima
Median Family Size in Pima
The median family size in Pima is 3.32 persons per family, with single female/mother families (70 | 9.1%) accounting for the largest median family size of 3.56 persons per family. On the other hand, single male/father families (115 | 15.0%) represent the smallest median family size with 2.19 persons per family.
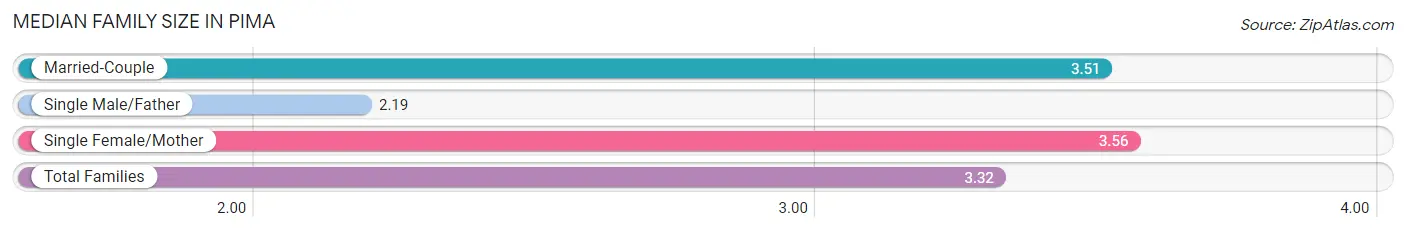
| Family Type | # Families | Family Size |
| Married-Couple | 580 (75.8%) | 3.51 |
| Single Male/Father | 115 (15.0%) | 2.19 |
| Single Female/Mother | 70 (9.1%) | 3.56 |
| Total Families | 765 (100.0%) | 3.32 |
Median Household Size in Pima
The median household size in Pima is 2.90 persons per household, with single female/mother households (70 | 7.1%) accounting for the largest median household size of 3.81 persons per household. non-family households (216 | 22.0%) represent the smallest median household size with 1.35 persons per household.
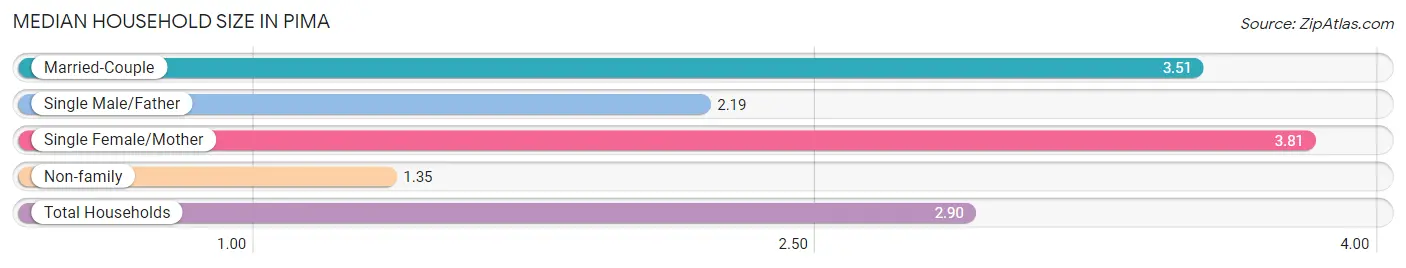
| Household Type | # Households | Household Size |
| Married-Couple | 580 (59.1%) | 3.51 |
| Single Male/Father | 115 (11.7%) | 2.19 |
| Single Female/Mother | 70 (7.1%) | 3.81 |
| Non-family | 216 (22.0%) | 1.35 |
| Total Households | 981 (100.0%) | 2.90 |
Household Size by Marriage Status in Pima
Out of a total of 981 households in Pima, 765 (78.0%) are family households, while 216 (22.0%) are nonfamily households. The most numerous type of family households are 2-person households, comprising 269, and the most common type of nonfamily households are 1-person households, comprising 194.
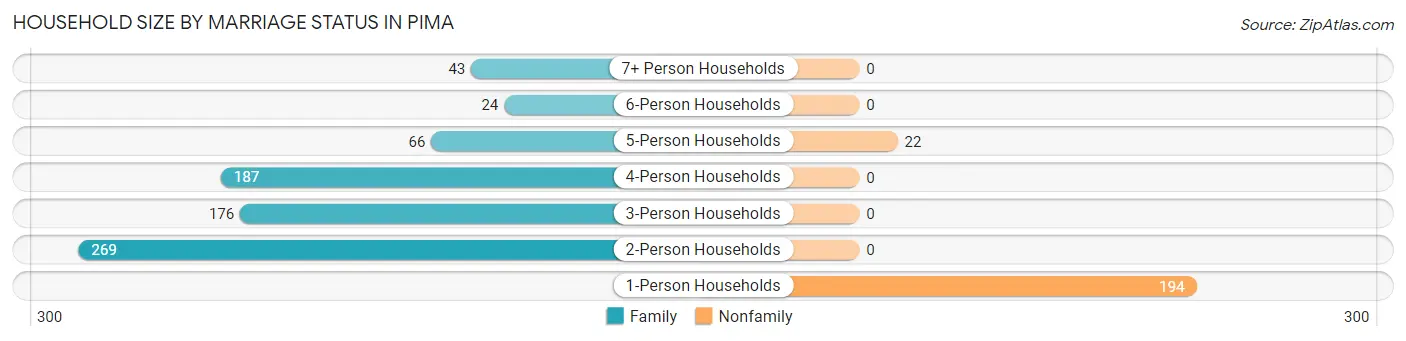
| Household Size | Family Households | Nonfamily Households |
| 1-Person Households | - | 194 (19.8%) |
| 2-Person Households | 269 (27.4%) | 0 (0.0%) |
| 3-Person Households | 176 (17.9%) | 0 (0.0%) |
| 4-Person Households | 187 (19.1%) | 0 (0.0%) |
| 5-Person Households | 66 (6.7%) | 22 (2.2%) |
| 6-Person Households | 24 (2.5%) | 0 (0.0%) |
| 7+ Person Households | 43 (4.4%) | 0 (0.0%) |
| Total | 765 (78.0%) | 216 (22.0%) |
Female Fertility in Pima
Fertility by Age in Pima
Average fertility rate in Pima is 61.0 births per 1,000 women. Women in the age bracket of 20 to 34 years have the highest fertility rate with 140.0 births per 1,000 women. Women in the age bracket of 20 to 34 years acount for 100.0% of all women with births.
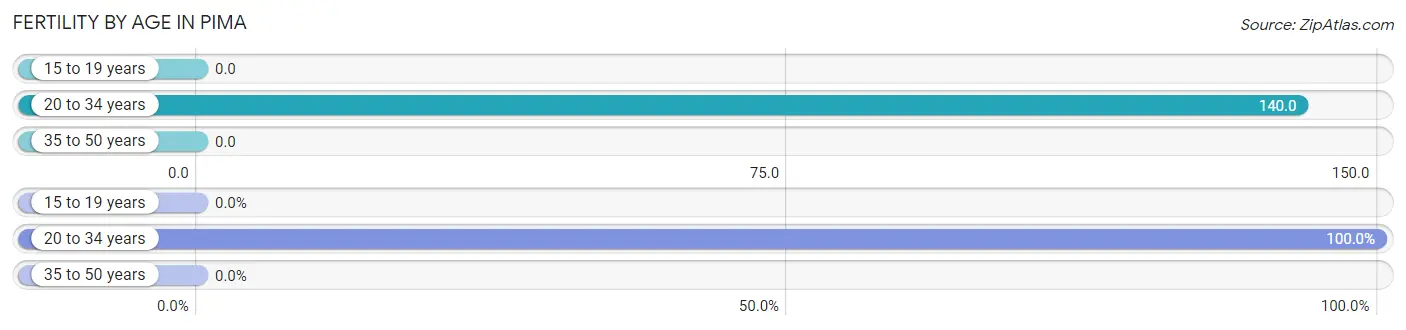
| Age Bracket | Women with Births | Births / 1,000 Women |
| 15 to 19 years | 0 (0.0%) | 0.0 |
| 20 to 34 years | 49 (100.0%) | 140.0 |
| 35 to 50 years | 0 (0.0%) | 0.0 |
| Total | 49 (100.0%) | 61.0 |
Fertility by Age by Marriage Status in Pima
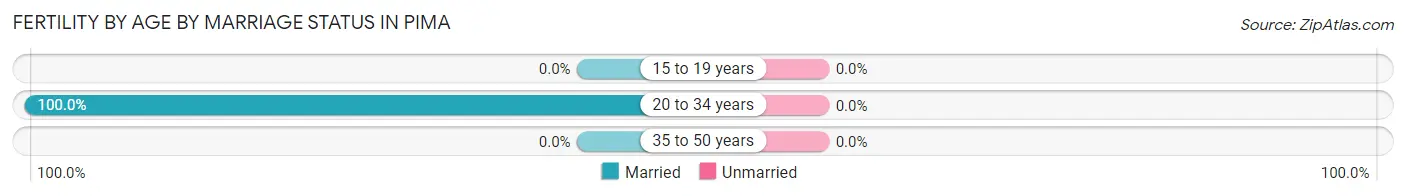
| Age Bracket | Married | Unmarried |
| 15 to 19 years | 0 (0.0%) | 0 (0.0%) |
| 20 to 34 years | 49 (100.0%) | 0 (0.0%) |
| 35 to 50 years | 0 (0.0%) | 0 (0.0%) |
| Total | 49 (100.0%) | 0 (0.0%) |
Fertility by Education in Pima
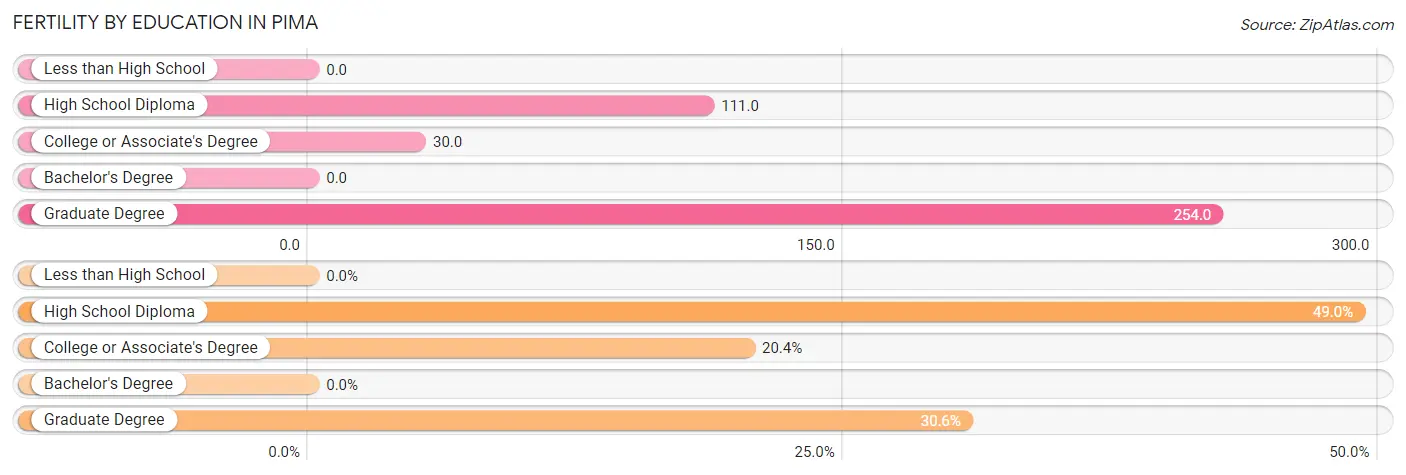
| Educational Attainment | Women with Births | Births / 1,000 Women |
| Less than High School | 0 (0.0%) | 0.0 |
| High School Diploma | 24 (49.0%) | 111.0 |
| College or Associate's Degree | 10 (20.4%) | 30.0 |
| Bachelor's Degree | 0 (0.0%) | 0.0 |
| Graduate Degree | 15 (30.6%) | 254.0 |
| Total | 49 (100.0%) | 61.0 |
Fertility by Education by Marriage Status in Pima
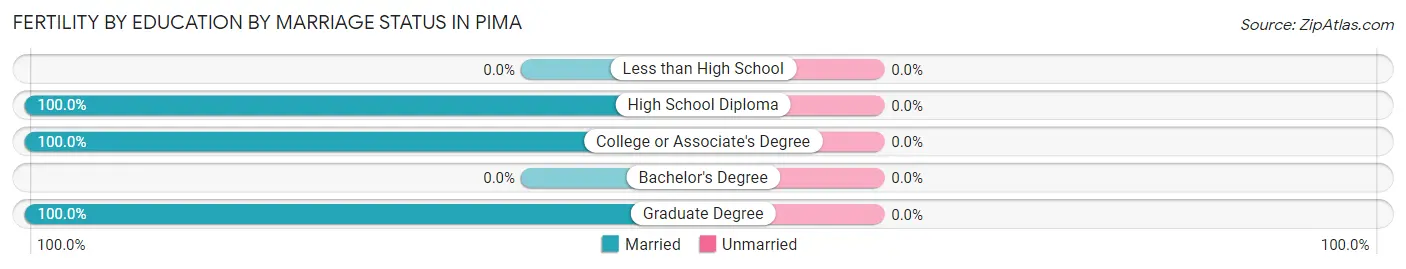
| Educational Attainment | Married | Unmarried |
| Less than High School | 0 (0.0%) | 0 (0.0%) |
| High School Diploma | 24 (100.0%) | 0 (0.0%) |
| College or Associate's Degree | 10 (100.0%) | 0 (0.0%) |
| Bachelor's Degree | 0 (0.0%) | 0 (0.0%) |
| Graduate Degree | 15 (100.0%) | 0 (0.0%) |
| Total | 49 (100.0%) | 0 (0.0%) |
Employment Characteristics in Pima
Employment by Class of Employer in Pima
Among the 1,282 employed individuals in Pima, private company employees (795 | 62.0%), local government employees (173 | 13.5%), and self-employed (not incorporated) (132 | 10.3%) make up the most common classes of employment.
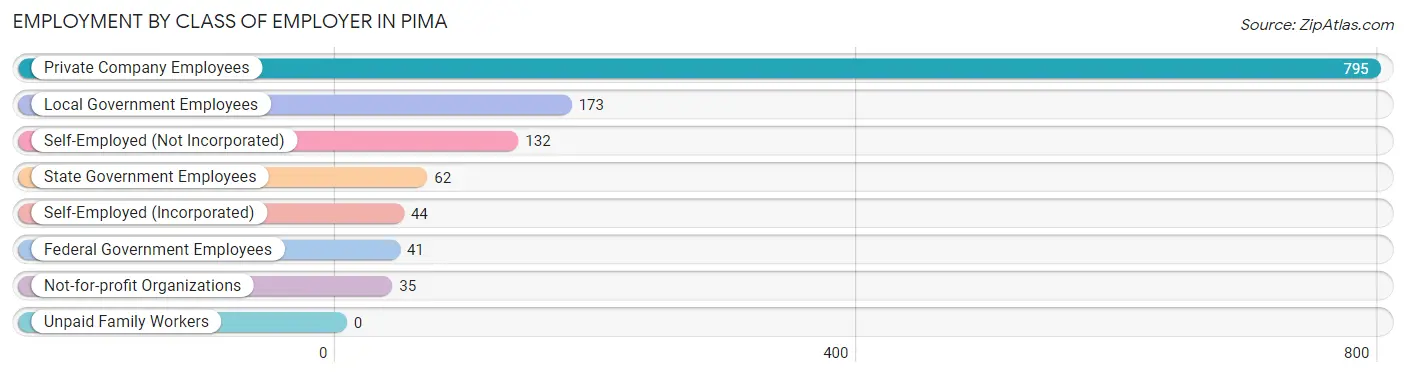
| Employer Class | # Employees | % Employees |
| Private Company Employees | 795 | 62.0% |
| Self-Employed (Incorporated) | 44 | 3.4% |
| Self-Employed (Not Incorporated) | 132 | 10.3% |
| Not-for-profit Organizations | 35 | 2.7% |
| Local Government Employees | 173 | 13.5% |
| State Government Employees | 62 | 4.8% |
| Federal Government Employees | 41 | 3.2% |
| Unpaid Family Workers | 0 | 0.0% |
| Total | 1,282 | 100.0% |
Employment Status by Age in Pima
According to the labor force statistics for Pima, out of the total population over 16 years of age (2,154), 61.7% or 1,329 individuals are in the labor force, with 1.8% or 24 of them unemployed. The age group with the highest labor force participation rate is 20 to 24 years, with 100.0% or 229 individuals in the labor force. Within the labor force, the 30 to 34 years age range has the highest percentage of unemployed individuals, with 15.9% or 18 of them being unemployed.
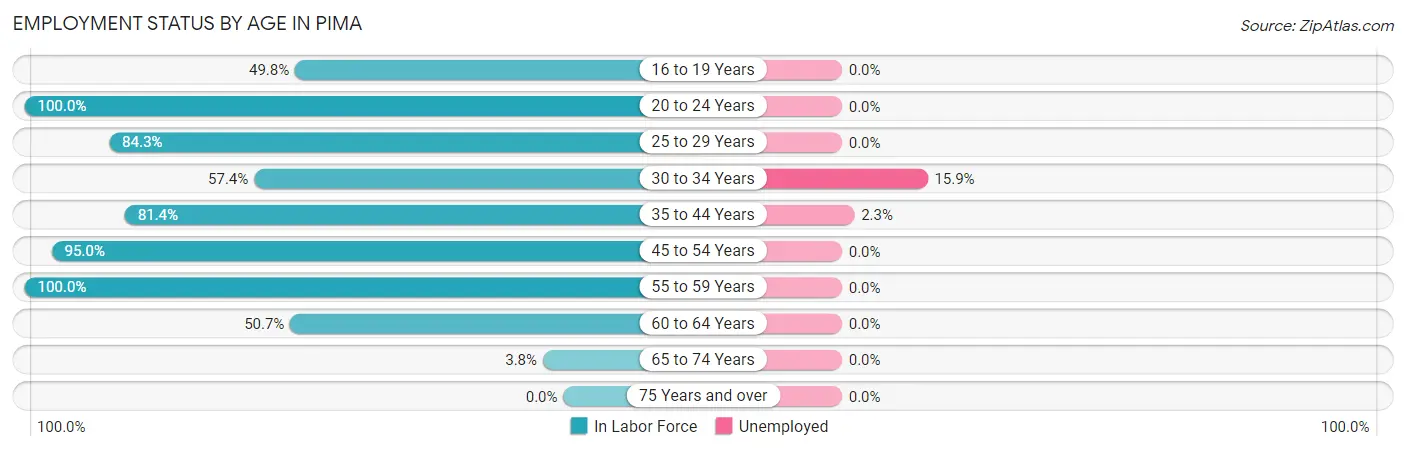
| Age Bracket | In Labor Force | Unemployed |
| 16 to 19 Years | 129 (49.8%) | 0 (0.0%) |
| 20 to 24 Years | 229 (100.0%) | 0 (0.0%) |
| 25 to 29 Years | 97 (84.3%) | 0 (0.0%) |
| 30 to 34 Years | 113 (57.4%) | 18 (15.9%) |
| 35 to 44 Years | 258 (81.4%) | 6 (2.3%) |
| 45 to 54 Years | 339 (95.0%) | 0 (0.0%) |
| 55 to 59 Years | 79 (100.0%) | 0 (0.0%) |
| 60 to 64 Years | 76 (50.7%) | 0 (0.0%) |
| 65 to 74 Years | 10 (3.8%) | 0 (0.0%) |
| 75 Years and over | 0 (0.0%) | 0 (0.0%) |
| Total | 1,329 (61.7%) | 24 (1.8%) |
Employment Status by Educational Attainment in Pima
According to labor force statistics for Pima, 79.2% of individuals (962) out of the total population between 25 and 64 years of age (1,215) are in the labor force, with 2.5% or 24 of them being unemployed. The group with the highest labor force participation rate are those with the educational attainment of college / associate degree, with 86.8% or 538 individuals in the labor force. Within the labor force, individuals with bachelor's degree or higher education have the highest percentage of unemployment, with 8.5% or 18 of them being unemployed.
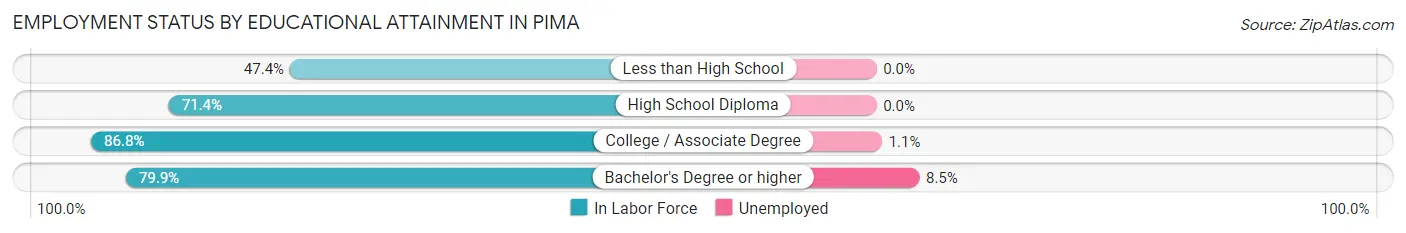
| Educational Attainment | In Labor Force | Unemployed |
| Less than High School | 46 (47.4%) | 0 (0.0%) |
| High School Diploma | 167 (71.4%) | 0 (0.0%) |
| College / Associate Degree | 538 (86.8%) | 7 (1.1%) |
| Bachelor's Degree or higher | 211 (79.9%) | 22 (8.5%) |
| Total | 962 (79.2%) | 30 (2.5%) |
Employment Occupations by Sex in Pima
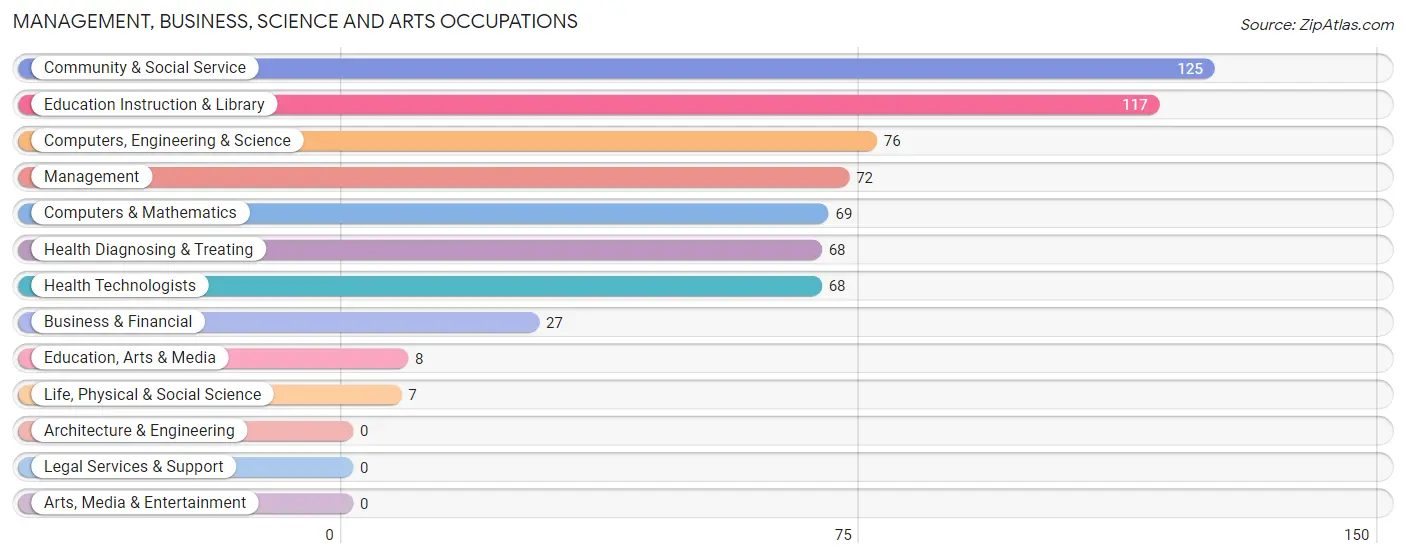
Management, Business, Science and Arts Occupations
The most common Management, Business, Science and Arts occupations in Pima are Community & Social Service (125 | 9.6%), Education Instruction & Library (117 | 9.0%), Computers, Engineering & Science (76 | 5.8%), Management (72 | 5.5%), and Computers & Mathematics (69 | 5.3%).
Management, Business, Science and Arts Occupations by Sex
Within the Management, Business, Science and Arts occupations in Pima, the most male-oriented occupations are Computers, Engineering & Science (100.0%), Computers & Mathematics (100.0%), and Life, Physical & Social Science (100.0%), while the most female-oriented occupations are Education, Arts & Media (100.0%), Business & Financial (74.1%), and Management (66.7%).
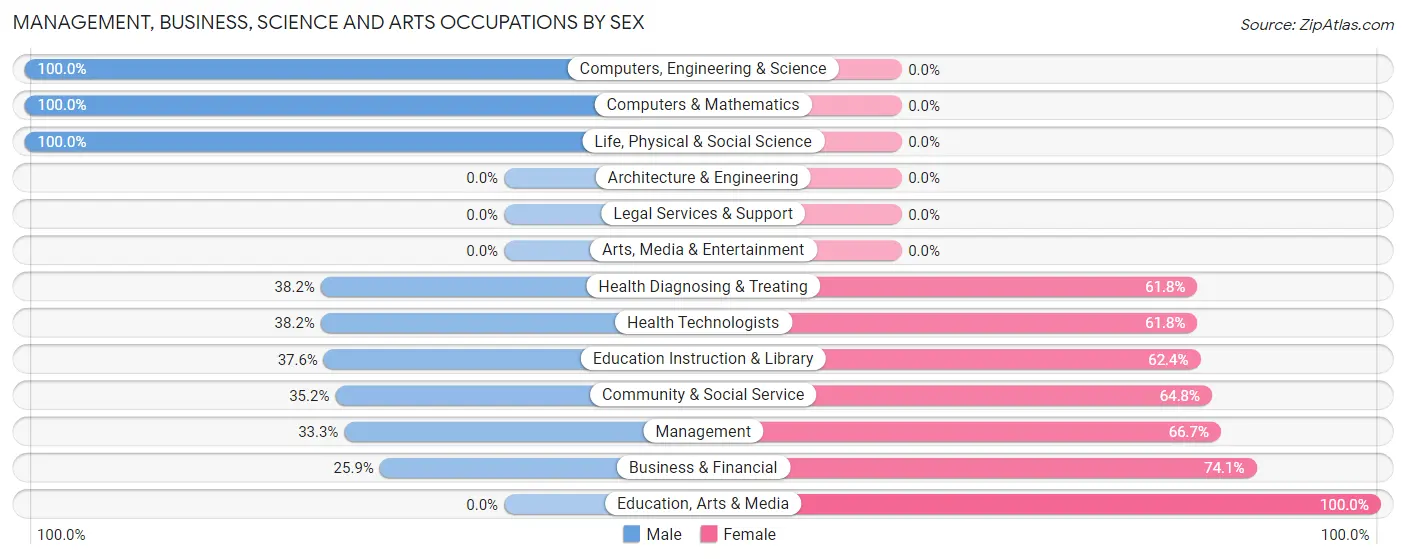
| Occupation | Male | Female |
| Management | 24 (33.3%) | 48 (66.7%) |
| Business & Financial | 7 (25.9%) | 20 (74.1%) |
| Computers, Engineering & Science | 76 (100.0%) | 0 (0.0%) |
| Computers & Mathematics | 69 (100.0%) | 0 (0.0%) |
| Architecture & Engineering | 0 (0.0%) | 0 (0.0%) |
| Life, Physical & Social Science | 7 (100.0%) | 0 (0.0%) |
| Community & Social Service | 44 (35.2%) | 81 (64.8%) |
| Education, Arts & Media | 0 (0.0%) | 8 (100.0%) |
| Legal Services & Support | 0 (0.0%) | 0 (0.0%) |
| Education Instruction & Library | 44 (37.6%) | 73 (62.4%) |
| Arts, Media & Entertainment | 0 (0.0%) | 0 (0.0%) |
| Health Diagnosing & Treating | 26 (38.2%) | 42 (61.8%) |
| Health Technologists | 26 (38.2%) | 42 (61.8%) |
| Total (Category) | 177 (48.1%) | 191 (51.9%) |
| Total (Overall) | 660 (50.5%) | 646 (49.5%) |
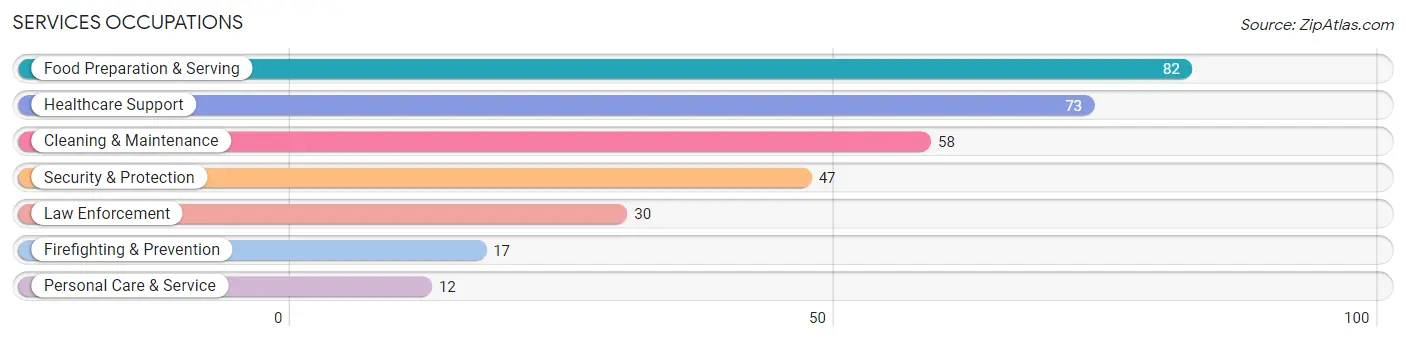
Services Occupations
The most common Services occupations in Pima are Food Preparation & Serving (82 | 6.3%), Healthcare Support (73 | 5.6%), Cleaning & Maintenance (58 | 4.4%), Security & Protection (47 | 3.6%), and Law Enforcement (30 | 2.3%).
Services Occupations by Sex
Within the Services occupations in Pima, the most male-oriented occupations are Firefighting & Prevention (100.0%), Security & Protection (87.2%), and Law Enforcement (80.0%), while the most female-oriented occupations are Healthcare Support (100.0%), Personal Care & Service (100.0%), and Food Preparation & Serving (69.5%).
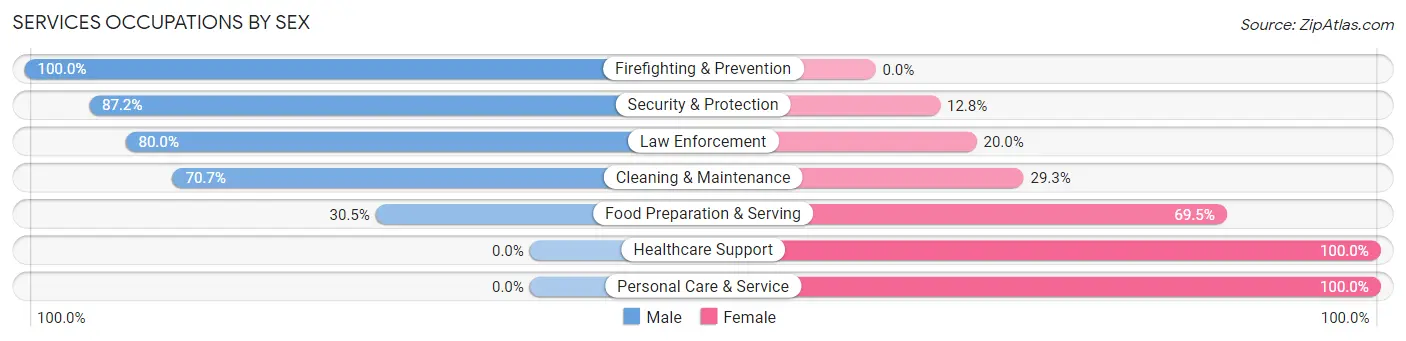
| Occupation | Male | Female |
| Healthcare Support | 0 (0.0%) | 73 (100.0%) |
| Security & Protection | 41 (87.2%) | 6 (12.8%) |
| Firefighting & Prevention | 17 (100.0%) | 0 (0.0%) |
| Law Enforcement | 24 (80.0%) | 6 (20.0%) |
| Food Preparation & Serving | 25 (30.5%) | 57 (69.5%) |
| Cleaning & Maintenance | 41 (70.7%) | 17 (29.3%) |
| Personal Care & Service | 0 (0.0%) | 12 (100.0%) |
| Total (Category) | 107 (39.3%) | 165 (60.7%) |
| Total (Overall) | 660 (50.5%) | 646 (49.5%) |
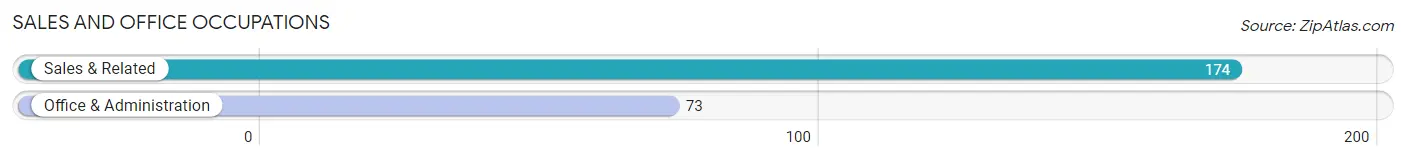
Sales and Office Occupations
The most common Sales and Office occupations in Pima are Sales & Related (174 | 13.3%), and Office & Administration (73 | 5.6%).
Sales and Office Occupations by Sex
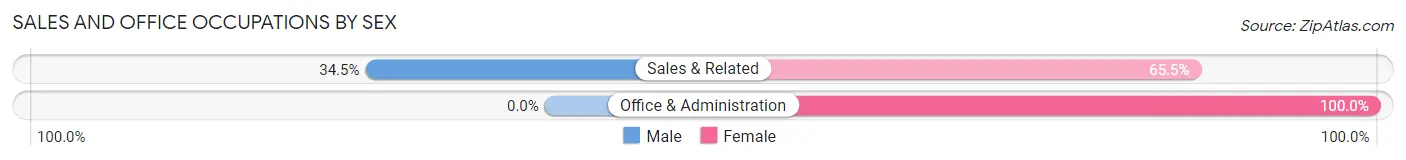
| Occupation | Male | Female |
| Sales & Related | 60 (34.5%) | 114 (65.5%) |
| Office & Administration | 0 (0.0%) | 73 (100.0%) |
| Total (Category) | 60 (24.3%) | 187 (75.7%) |
| Total (Overall) | 660 (50.5%) | 646 (49.5%) |
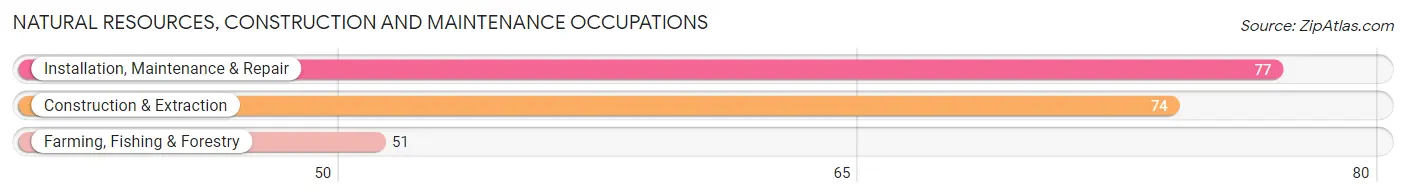
Natural Resources, Construction and Maintenance Occupations
The most common Natural Resources, Construction and Maintenance occupations in Pima are Installation, Maintenance & Repair (77 | 5.9%), Construction & Extraction (74 | 5.7%), and Farming, Fishing & Forestry (51 | 3.9%).
Natural Resources, Construction and Maintenance Occupations by Sex
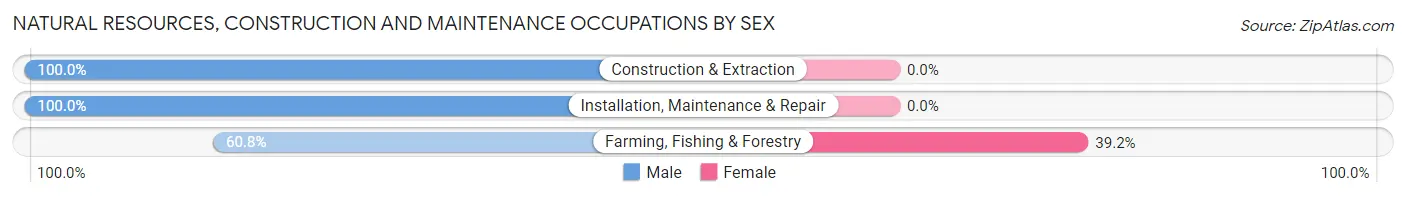
| Occupation | Male | Female |
| Farming, Fishing & Forestry | 31 (60.8%) | 20 (39.2%) |
| Construction & Extraction | 74 (100.0%) | 0 (0.0%) |
| Installation, Maintenance & Repair | 77 (100.0%) | 0 (0.0%) |
| Total (Category) | 182 (90.1%) | 20 (9.9%) |
| Total (Overall) | 660 (50.5%) | 646 (49.5%) |
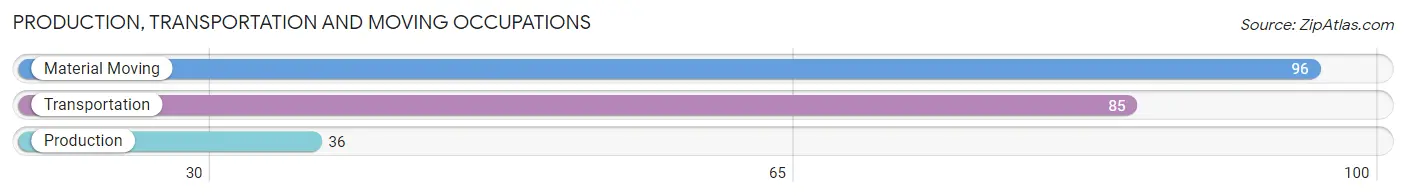
Production, Transportation and Moving Occupations
The most common Production, Transportation and Moving occupations in Pima are Material Moving (96 | 7.3%), Transportation (85 | 6.5%), and Production (36 | 2.8%).
Production, Transportation and Moving Occupations by Sex
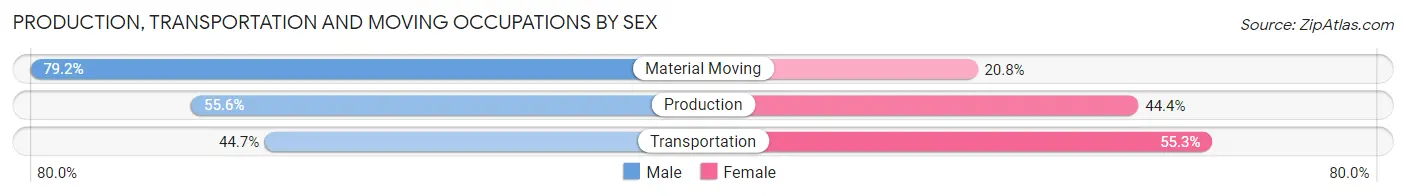
| Occupation | Male | Female |
| Production | 20 (55.6%) | 16 (44.4%) |
| Transportation | 38 (44.7%) | 47 (55.3%) |
| Material Moving | 76 (79.2%) | 20 (20.8%) |
| Total (Category) | 134 (61.8%) | 83 (38.3%) |
| Total (Overall) | 660 (50.5%) | 646 (49.5%) |
Employment Industries by Sex in Pima
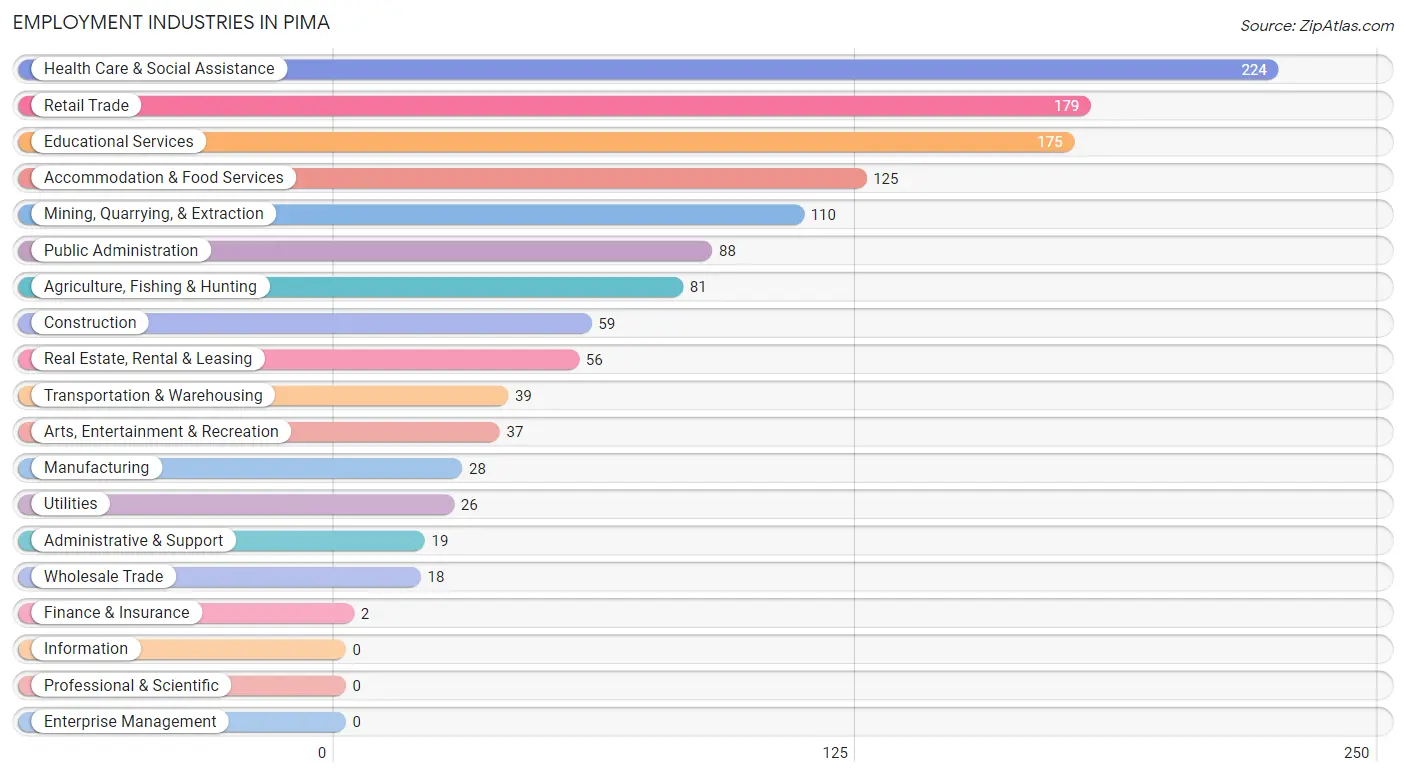
Employment Industries in Pima
The major employment industries in Pima include Health Care & Social Assistance (224 | 17.2%), Retail Trade (179 | 13.7%), Educational Services (175 | 13.4%), Accommodation & Food Services (125 | 9.6%), and Mining, Quarrying, & Extraction (110 | 8.4%).
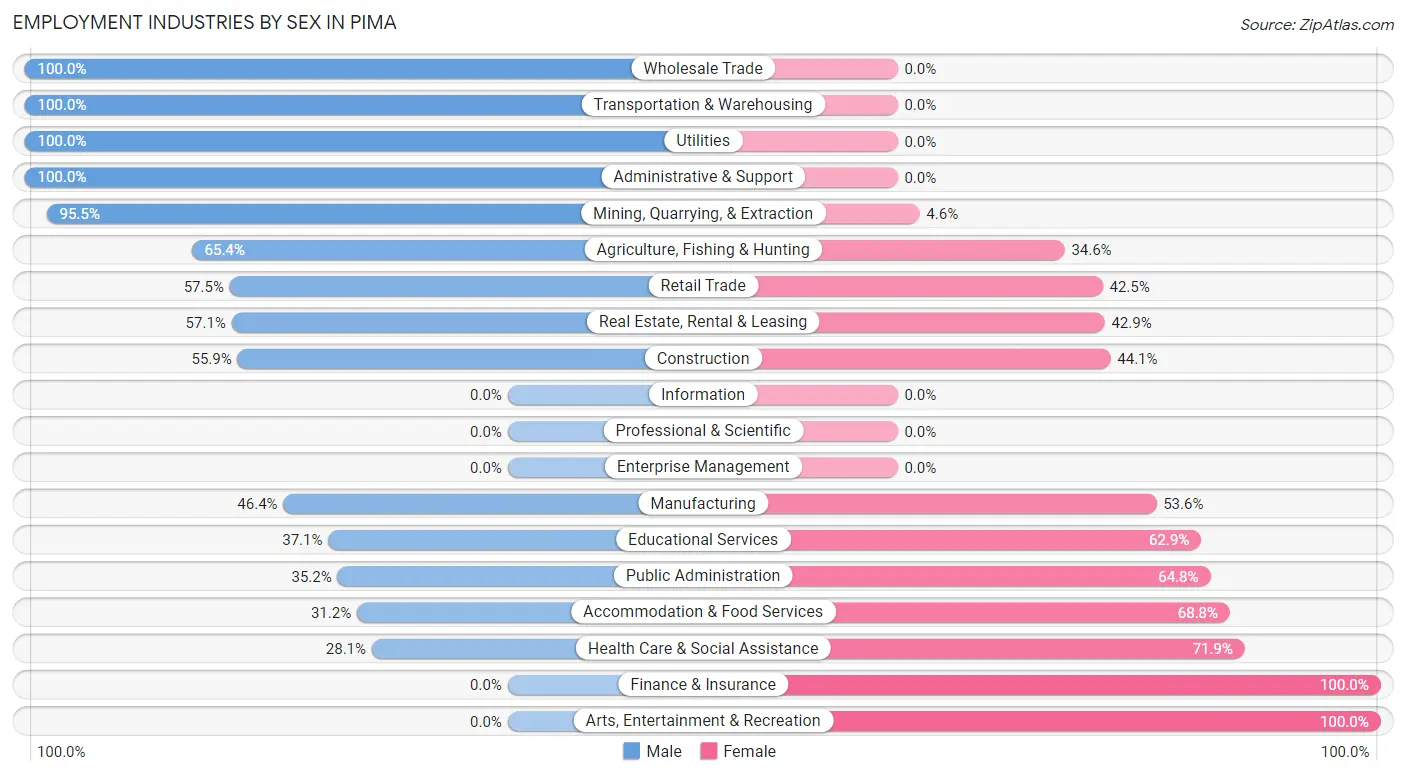
Employment Industries by Sex in Pima
The Pima industries that see more men than women are Wholesale Trade (100.0%), Transportation & Warehousing (100.0%), and Utilities (100.0%), whereas the industries that tend to have a higher number of women are Finance & Insurance (100.0%), Arts, Entertainment & Recreation (100.0%), and Health Care & Social Assistance (71.9%).
| Industry | Male | Female |
| Agriculture, Fishing & Hunting | 53 (65.4%) | 28 (34.6%) |
| Mining, Quarrying, & Extraction | 105 (95.5%) | 5 (4.5%) |
| Construction | 33 (55.9%) | 26 (44.1%) |
| Manufacturing | 13 (46.4%) | 15 (53.6%) |
| Wholesale Trade | 18 (100.0%) | 0 (0.0%) |
| Retail Trade | 103 (57.5%) | 76 (42.5%) |
| Transportation & Warehousing | 39 (100.0%) | 0 (0.0%) |
| Utilities | 26 (100.0%) | 0 (0.0%) |
| Information | 0 (0.0%) | 0 (0.0%) |
| Finance & Insurance | 0 (0.0%) | 2 (100.0%) |
| Real Estate, Rental & Leasing | 32 (57.1%) | 24 (42.9%) |
| Professional & Scientific | 0 (0.0%) | 0 (0.0%) |
| Enterprise Management | 0 (0.0%) | 0 (0.0%) |
| Administrative & Support | 19 (100.0%) | 0 (0.0%) |
| Educational Services | 65 (37.1%) | 110 (62.9%) |
| Health Care & Social Assistance | 63 (28.1%) | 161 (71.9%) |
| Arts, Entertainment & Recreation | 0 (0.0%) | 37 (100.0%) |
| Accommodation & Food Services | 39 (31.2%) | 86 (68.8%) |
| Public Administration | 31 (35.2%) | 57 (64.8%) |
| Total | 660 (50.5%) | 646 (49.5%) |
Education in Pima
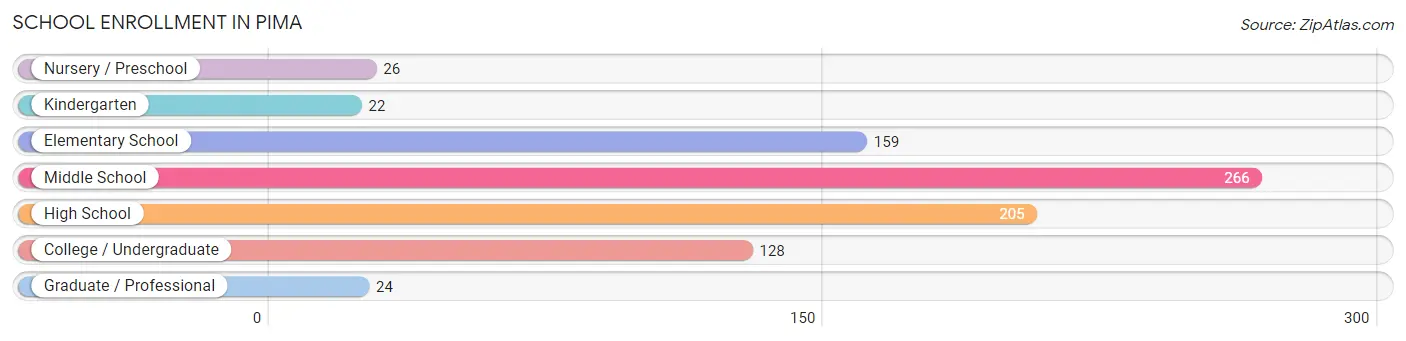
School Enrollment in Pima
The most common levels of schooling among the 830 students in Pima are middle school (266 | 32.1%), high school (205 | 24.7%), and elementary school (159 | 19.2%).
| School Level | # Students | % Students |
| Nursery / Preschool | 26 | 3.1% |
| Kindergarten | 22 | 2.6% |
| Elementary School | 159 | 19.2% |
| Middle School | 266 | 32.1% |
| High School | 205 | 24.7% |
| College / Undergraduate | 128 | 15.4% |
| Graduate / Professional | 24 | 2.9% |
| Total | 830 | 100.0% |
School Enrollment by Age by Funding Source in Pima
Out of a total of 830 students who are enrolled in schools in Pima, 38 (4.6%) attend a private institution, while the remaining 792 (95.4%) are enrolled in public schools. The age group of 35 years and over has the highest likelihood of being enrolled in private schools, with 24 (45.3% in the age bracket) enrolled. Conversely, the age group of 15 to 17 year olds has the lowest likelihood of being enrolled in a private school, with 153 (100.0% in the age bracket) attending a public institution.
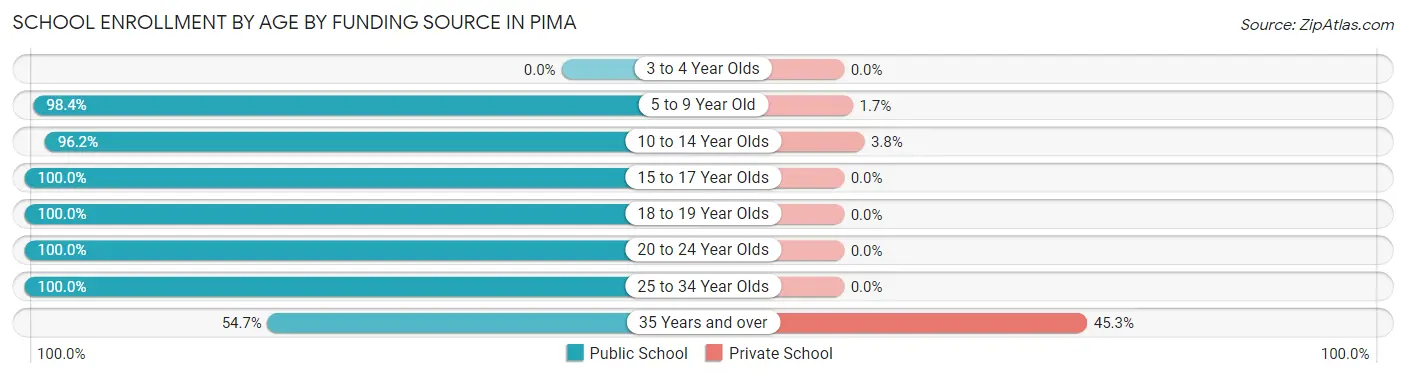
| Age Bracket | Public School | Private School |
| 3 to 4 Year Olds | 0 (0.0%) | 0 (0.0%) |
| 5 to 9 Year Old | 179 (98.4%) | 3 (1.7%) |
| 10 to 14 Year Olds | 280 (96.2%) | 11 (3.8%) |
| 15 to 17 Year Olds | 153 (100.0%) | 0 (0.0%) |
| 18 to 19 Year Olds | 111 (100.0%) | 0 (0.0%) |
| 20 to 24 Year Olds | 12 (100.0%) | 0 (0.0%) |
| 25 to 34 Year Olds | 28 (100.0%) | 0 (0.0%) |
| 35 Years and over | 29 (54.7%) | 24 (45.3%) |
| Total | 792 (95.4%) | 38 (4.6%) |
Educational Attainment by Field of Study in Pima
Education (99 | 25.7%), computers & mathematics (64 | 16.6%), science & technology (63 | 16.4%), liberal arts & history (43 | 11.2%), and arts & humanities (39 | 10.1%) are the most common fields of study among 385 individuals in Pima who have obtained a bachelor's degree or higher.
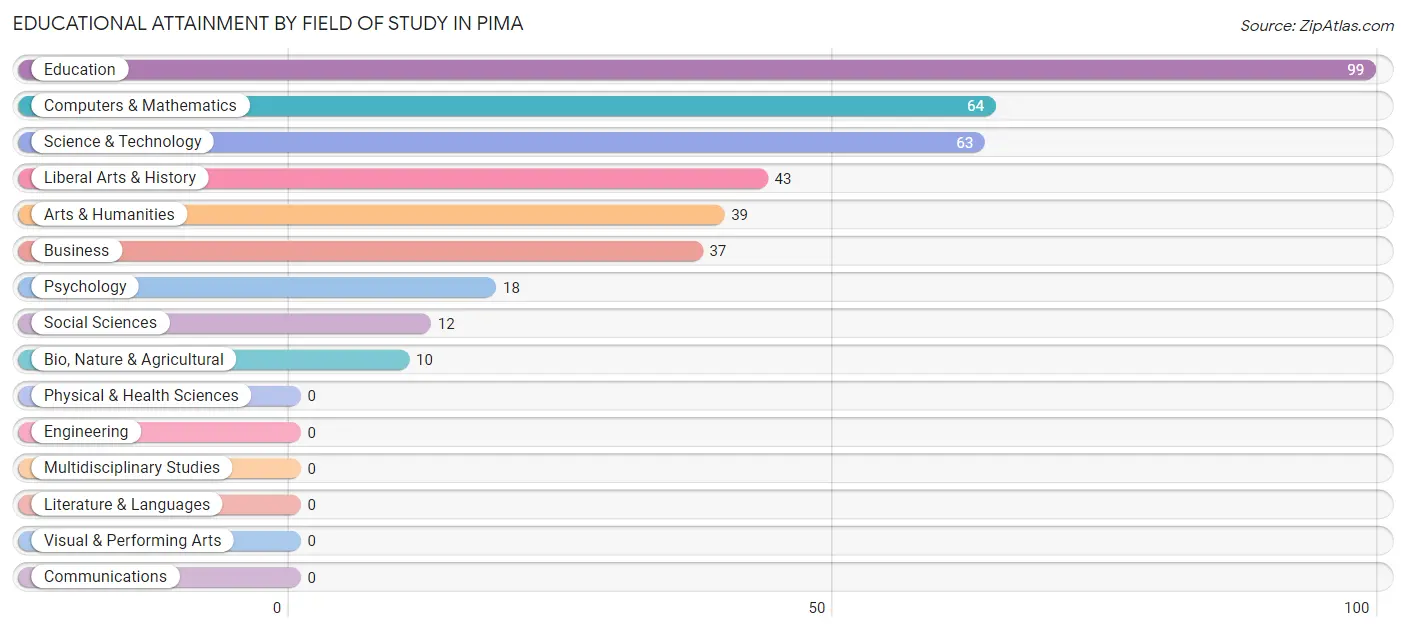
| Field of Study | # Graduates | % Graduates |
| Computers & Mathematics | 64 | 16.6% |
| Bio, Nature & Agricultural | 10 | 2.6% |
| Physical & Health Sciences | 0 | 0.0% |
| Psychology | 18 | 4.7% |
| Social Sciences | 12 | 3.1% |
| Engineering | 0 | 0.0% |
| Multidisciplinary Studies | 0 | 0.0% |
| Science & Technology | 63 | 16.4% |
| Business | 37 | 9.6% |
| Education | 99 | 25.7% |
| Literature & Languages | 0 | 0.0% |
| Liberal Arts & History | 43 | 11.2% |
| Visual & Performing Arts | 0 | 0.0% |
| Communications | 0 | 0.0% |
| Arts & Humanities | 39 | 10.1% |
| Total | 385 | 100.0% |
Transportation & Commute in Pima
Vehicle Availability by Sex in Pima
The most prevalent vehicle ownership categories in Pima are males with 2 vehicles (218, accounting for 33.0%) and females with 2 vehicles (196, making up 35.0%).
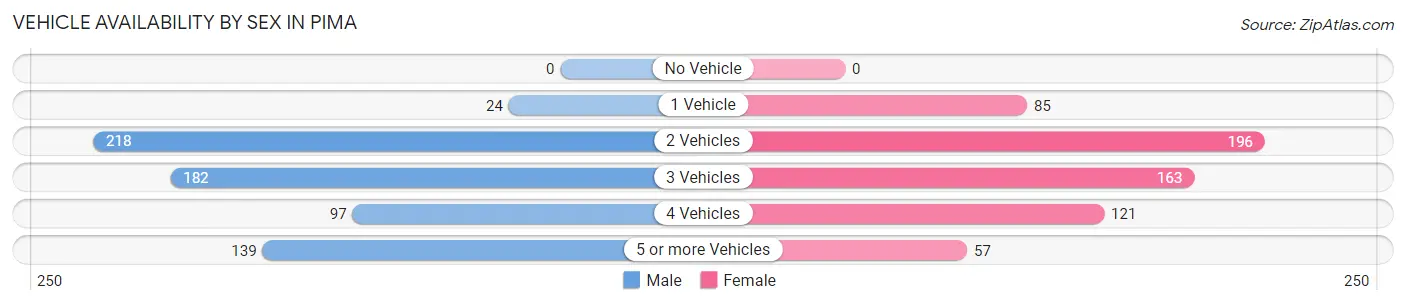
| Vehicles Available | Male | Female |
| No Vehicle | 0 (0.0%) | 0 (0.0%) |
| 1 Vehicle | 24 (3.6%) | 85 (13.7%) |
| 2 Vehicles | 218 (33.0%) | 196 (31.5%) |
| 3 Vehicles | 182 (27.6%) | 163 (26.2%) |
| 4 Vehicles | 97 (14.7%) | 121 (19.5%) |
| 5 or more Vehicles | 139 (21.1%) | 57 (9.2%) |
| Total | 660 (100.0%) | 622 (100.0%) |
Commute Time in Pima
The most frequently occuring commute durations in Pima are 15 to 19 minutes (307 commuters, 25.6%), 20 to 24 minutes (218 commuters, 18.2%), and 5 to 9 minutes (204 commuters, 17.0%).
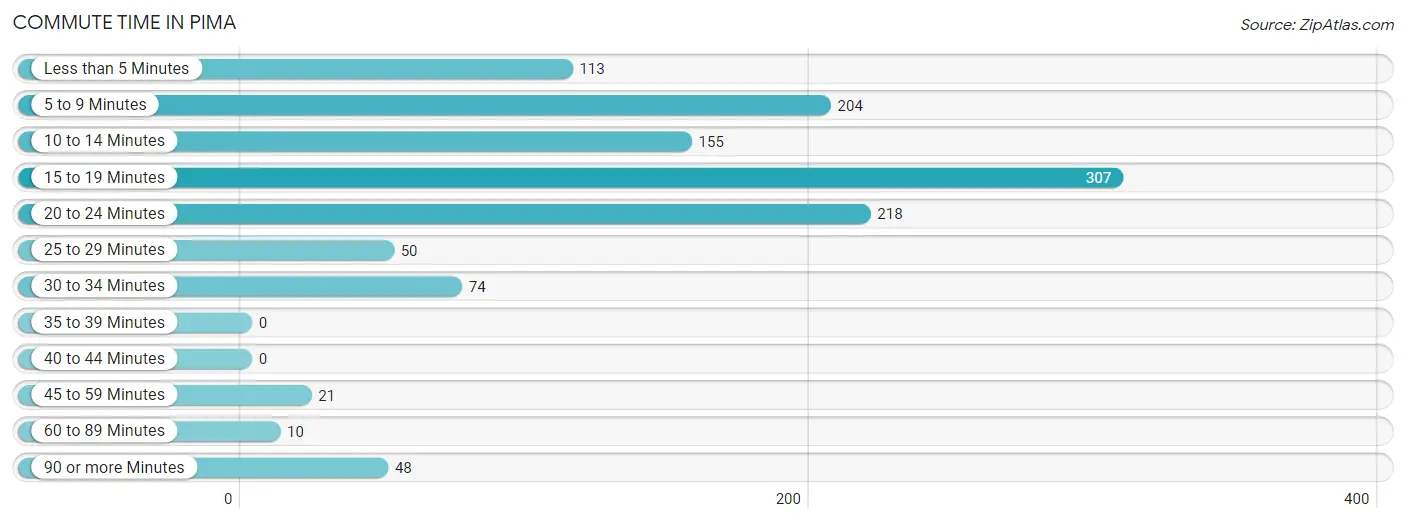
| Commute Time | # Commuters | % Commuters |
| Less than 5 Minutes | 113 | 9.4% |
| 5 to 9 Minutes | 204 | 17.0% |
| 10 to 14 Minutes | 155 | 12.9% |
| 15 to 19 Minutes | 307 | 25.6% |
| 20 to 24 Minutes | 218 | 18.2% |
| 25 to 29 Minutes | 50 | 4.2% |
| 30 to 34 Minutes | 74 | 6.2% |
| 35 to 39 Minutes | 0 | 0.0% |
| 40 to 44 Minutes | 0 | 0.0% |
| 45 to 59 Minutes | 21 | 1.8% |
| 60 to 89 Minutes | 10 | 0.8% |
| 90 or more Minutes | 48 | 4.0% |
Commute Time by Sex in Pima
The most common commute times in Pima are 15 to 19 minutes (145 commuters, 23.8%) for males and 15 to 19 minutes (162 commuters, 27.5%) for females.
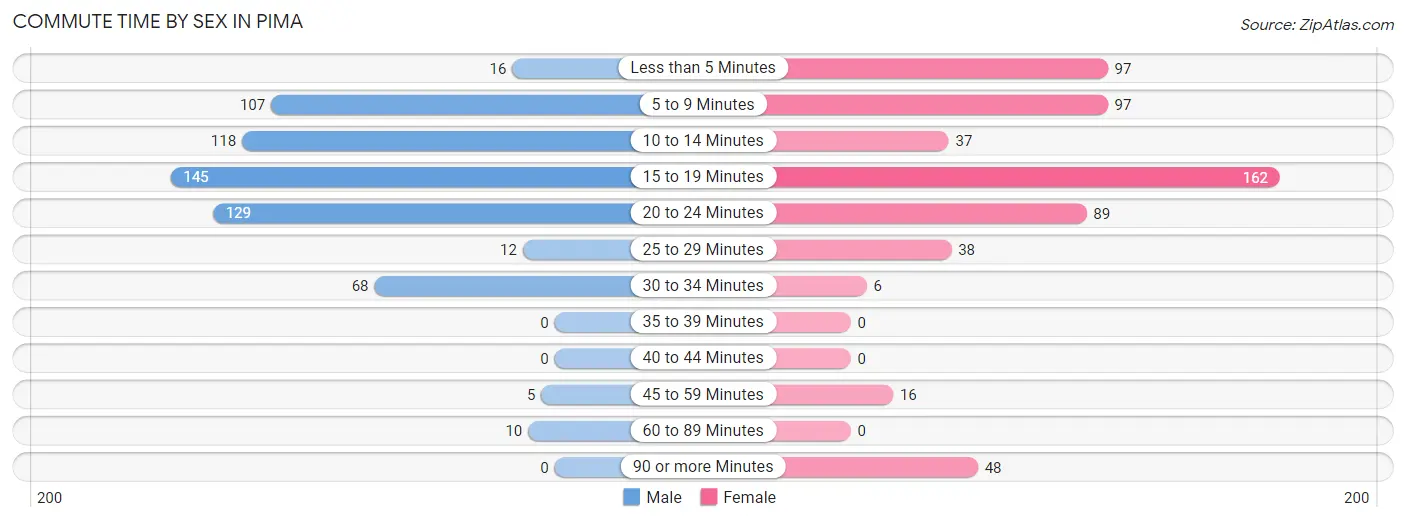
| Commute Time | Male | Female |
| Less than 5 Minutes | 16 (2.6%) | 97 (16.4%) |
| 5 to 9 Minutes | 107 (17.5%) | 97 (16.4%) |
| 10 to 14 Minutes | 118 (19.3%) | 37 (6.3%) |
| 15 to 19 Minutes | 145 (23.8%) | 162 (27.5%) |
| 20 to 24 Minutes | 129 (21.1%) | 89 (15.1%) |
| 25 to 29 Minutes | 12 (2.0%) | 38 (6.4%) |
| 30 to 34 Minutes | 68 (11.2%) | 6 (1.0%) |
| 35 to 39 Minutes | 0 (0.0%) | 0 (0.0%) |
| 40 to 44 Minutes | 0 (0.0%) | 0 (0.0%) |
| 45 to 59 Minutes | 5 (0.8%) | 16 (2.7%) |
| 60 to 89 Minutes | 10 (1.6%) | 0 (0.0%) |
| 90 or more Minutes | 0 (0.0%) | 48 (8.1%) |
Time of Departure to Work by Sex in Pima
The most frequent times of departure to work in Pima are 12:00 PM to 3:59 PM (108, 17.7%) for males and 7:00 AM to 7:29 AM (155, 26.3%) for females.
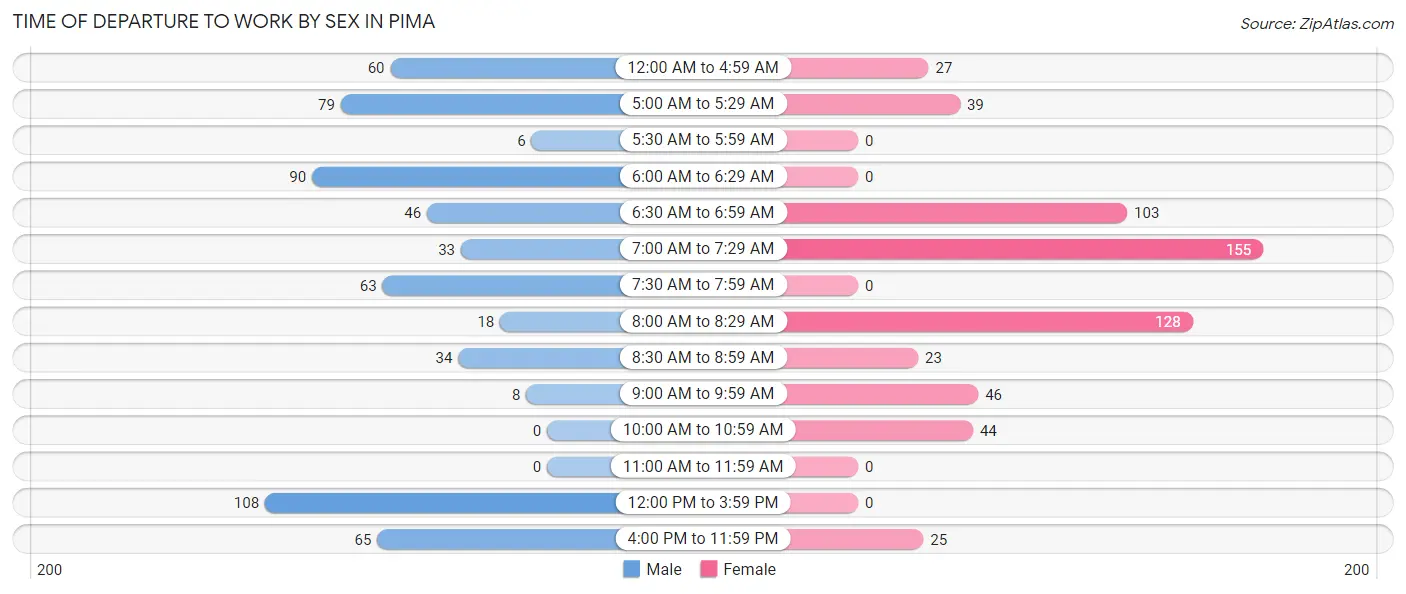
| Time of Departure | Male | Female |
| 12:00 AM to 4:59 AM | 60 (9.8%) | 27 (4.6%) |
| 5:00 AM to 5:29 AM | 79 (13.0%) | 39 (6.6%) |
| 5:30 AM to 5:59 AM | 6 (1.0%) | 0 (0.0%) |
| 6:00 AM to 6:29 AM | 90 (14.7%) | 0 (0.0%) |
| 6:30 AM to 6:59 AM | 46 (7.5%) | 103 (17.5%) |
| 7:00 AM to 7:29 AM | 33 (5.4%) | 155 (26.3%) |
| 7:30 AM to 7:59 AM | 63 (10.3%) | 0 (0.0%) |
| 8:00 AM to 8:29 AM | 18 (2.9%) | 128 (21.7%) |
| 8:30 AM to 8:59 AM | 34 (5.6%) | 23 (3.9%) |
| 9:00 AM to 9:59 AM | 8 (1.3%) | 46 (7.8%) |
| 10:00 AM to 10:59 AM | 0 (0.0%) | 44 (7.5%) |
| 11:00 AM to 11:59 AM | 0 (0.0%) | 0 (0.0%) |
| 12:00 PM to 3:59 PM | 108 (17.7%) | 0 (0.0%) |
| 4:00 PM to 11:59 PM | 65 (10.7%) | 25 (4.2%) |
| Total | 610 (100.0%) | 590 (100.0%) |
Housing Occupancy in Pima
Occupancy by Ownership in Pima
Of the total 981 dwellings in Pima, owner-occupied units account for 690 (70.3%), while renter-occupied units make up 291 (29.7%).
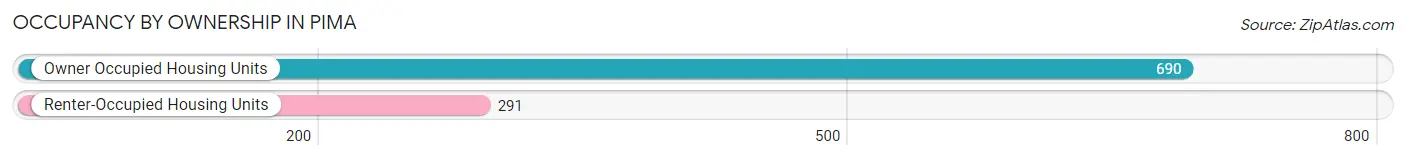
| Occupancy | # Housing Units | % Housing Units |
| Owner Occupied Housing Units | 690 | 70.3% |
| Renter-Occupied Housing Units | 291 | 29.7% |
| Total Occupied Housing Units | 981 | 100.0% |
Occupancy by Household Size in Pima
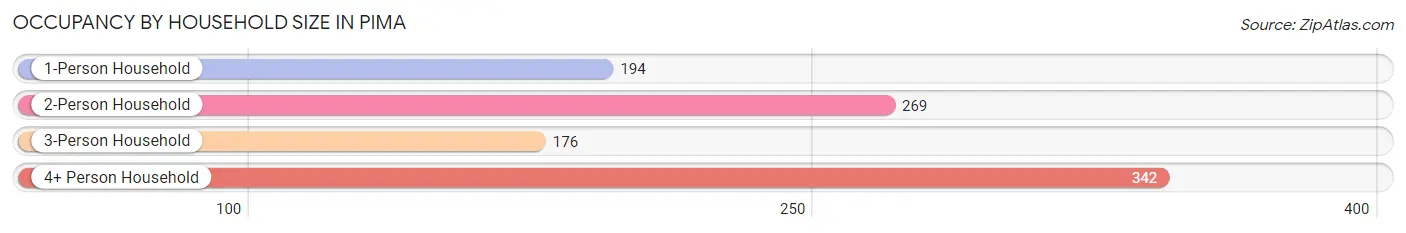
| Household Size | # Housing Units | % Housing Units |
| 1-Person Household | 194 | 19.8% |
| 2-Person Household | 269 | 27.4% |
| 3-Person Household | 176 | 17.9% |
| 4+ Person Household | 342 | 34.9% |
| Total Housing Units | 981 | 100.0% |
Occupancy by Ownership by Household Size in Pima
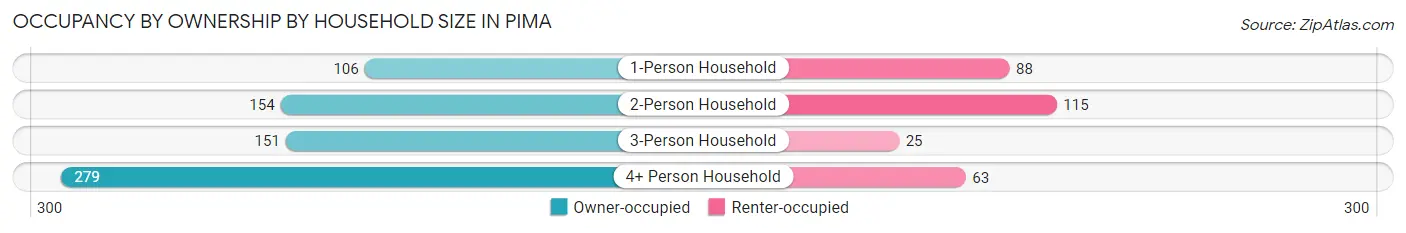
| Household Size | Owner-occupied | Renter-occupied |
| 1-Person Household | 106 (54.6%) | 88 (45.4%) |
| 2-Person Household | 154 (57.3%) | 115 (42.7%) |
| 3-Person Household | 151 (85.8%) | 25 (14.2%) |
| 4+ Person Household | 279 (81.6%) | 63 (18.4%) |
| Total Housing Units | 690 (70.3%) | 291 (29.7%) |
Occupancy by Educational Attainment in Pima
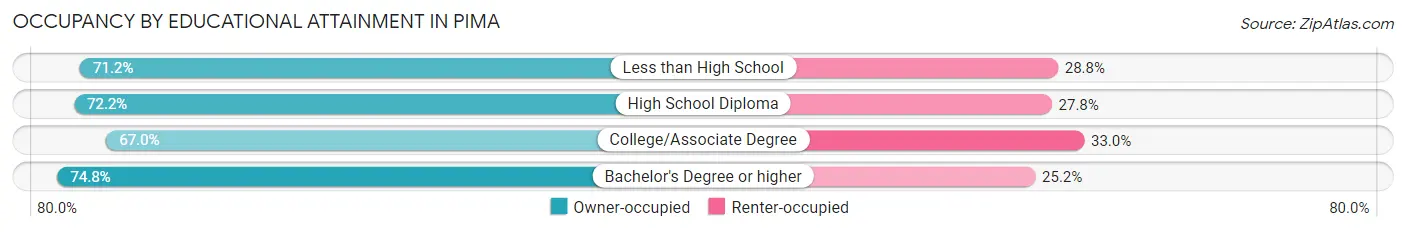
| Household Size | Owner-occupied | Renter-occupied |
| Less than High School | 42 (71.2%) | 17 (28.8%) |
| High School Diploma | 166 (72.2%) | 64 (27.8%) |
| College/Associate Degree | 307 (67.0%) | 151 (33.0%) |
| Bachelor's Degree or higher | 175 (74.8%) | 59 (25.2%) |
Occupancy by Age of Householder in Pima
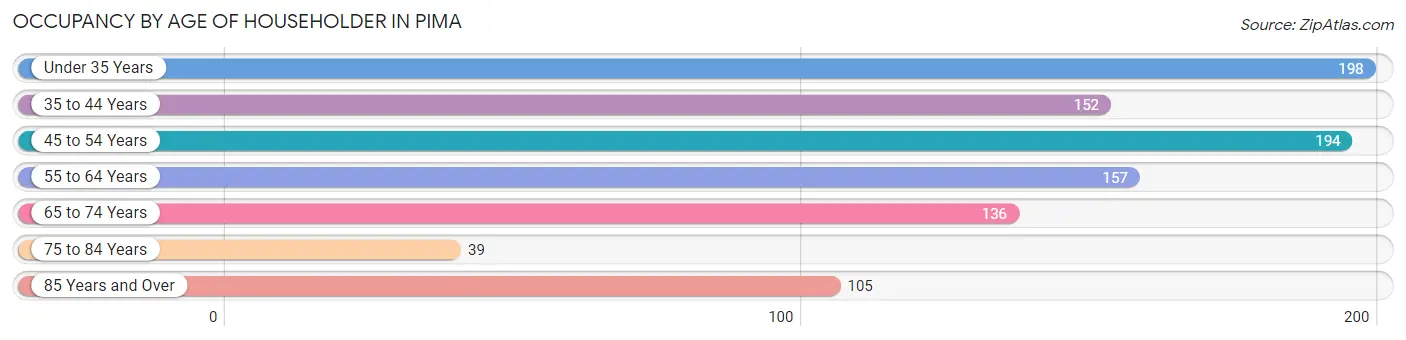
| Age Bracket | # Households | % Households |
| Under 35 Years | 198 | 20.2% |
| 35 to 44 Years | 152 | 15.5% |
| 45 to 54 Years | 194 | 19.8% |
| 55 to 64 Years | 157 | 16.0% |
| 65 to 74 Years | 136 | 13.9% |
| 75 to 84 Years | 39 | 4.0% |
| 85 Years and Over | 105 | 10.7% |
| Total | 981 | 100.0% |
Housing Finances in Pima
Median Income by Occupancy in Pima
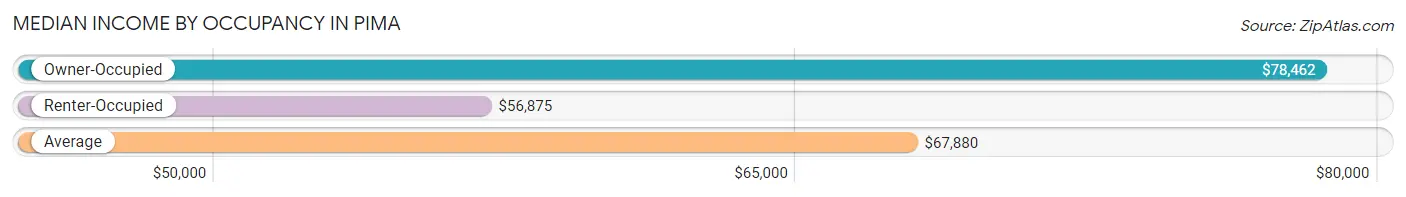
| Occupancy Type | # Households | Median Income |
| Owner-Occupied | 690 (70.3%) | $78,462 |
| Renter-Occupied | 291 (29.7%) | $56,875 |
| Average | 981 (100.0%) | $67,880 |
Occupancy by Householder Income Bracket in Pima
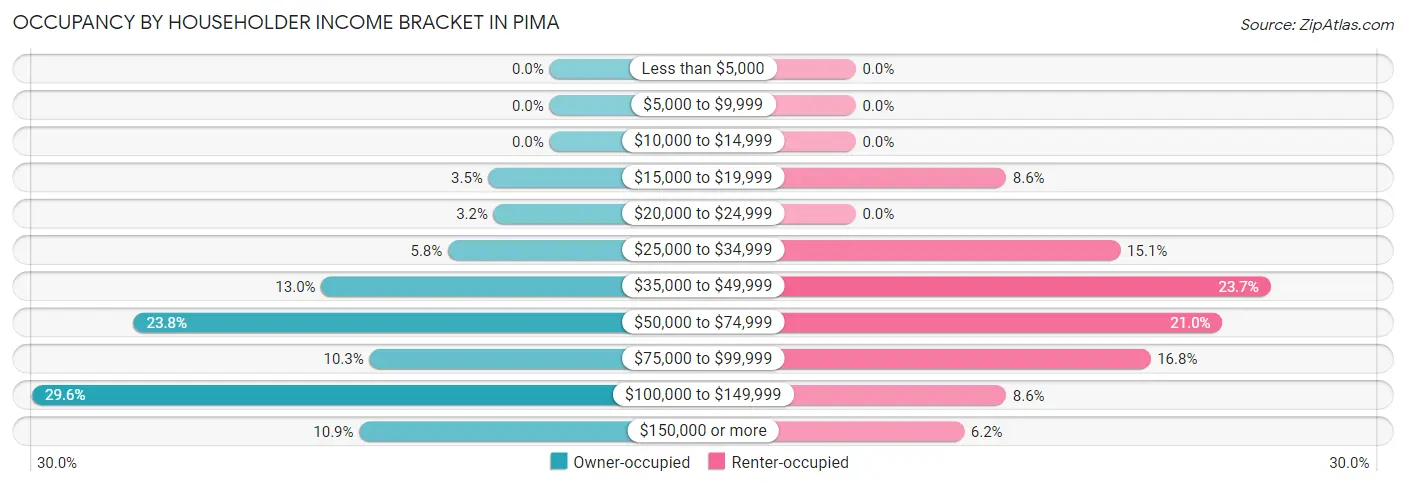
| Income Bracket | Owner-occupied | Renter-occupied |
| Less than $5,000 | 0 (0.0%) | 0 (0.0%) |
| $5,000 to $9,999 | 0 (0.0%) | 0 (0.0%) |
| $10,000 to $14,999 | 0 (0.0%) | 0 (0.0%) |
| $15,000 to $19,999 | 24 (3.5%) | 25 (8.6%) |
| $20,000 to $24,999 | 22 (3.2%) | 0 (0.0%) |
| $25,000 to $34,999 | 40 (5.8%) | 44 (15.1%) |
| $35,000 to $49,999 | 90 (13.0%) | 69 (23.7%) |
| $50,000 to $74,999 | 164 (23.8%) | 61 (21.0%) |
| $75,000 to $99,999 | 71 (10.3%) | 49 (16.8%) |
| $100,000 to $149,999 | 204 (29.6%) | 25 (8.6%) |
| $150,000 or more | 75 (10.9%) | 18 (6.2%) |
| Total | 690 (100.0%) | 291 (100.0%) |
Monthly Housing Cost Tiers in Pima
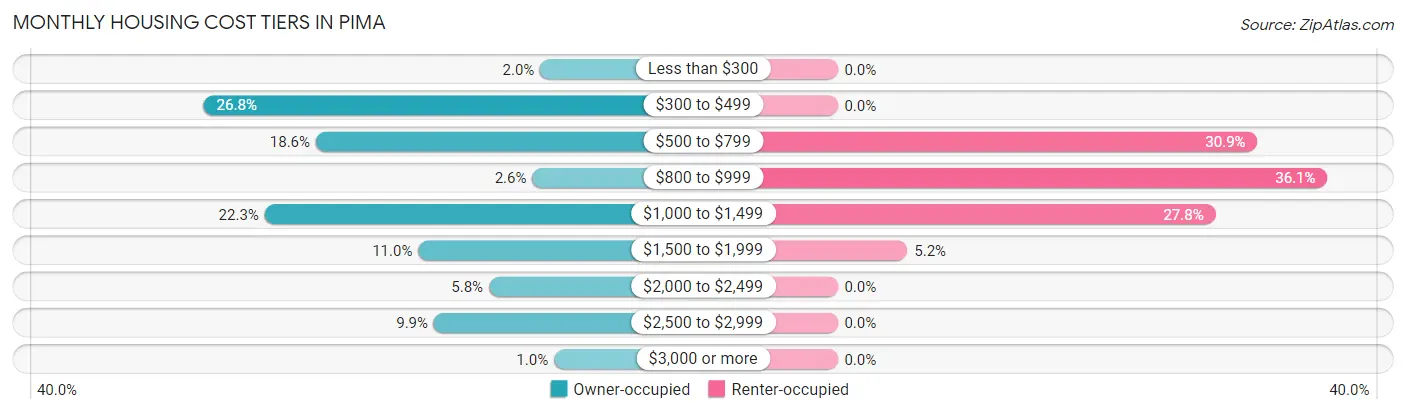
| Monthly Cost | Owner-occupied | Renter-occupied |
| Less than $300 | 14 (2.0%) | 0 (0.0%) |
| $300 to $499 | 185 (26.8%) | 0 (0.0%) |
| $500 to $799 | 128 (18.5%) | 90 (30.9%) |
| $800 to $999 | 18 (2.6%) | 105 (36.1%) |
| $1,000 to $1,499 | 154 (22.3%) | 81 (27.8%) |
| $1,500 to $1,999 | 76 (11.0%) | 15 (5.1%) |
| $2,000 to $2,499 | 40 (5.8%) | 0 (0.0%) |
| $2,500 to $2,999 | 68 (9.9%) | 0 (0.0%) |
| $3,000 or more | 7 (1.0%) | 0 (0.0%) |
| Total | 690 (100.0%) | 291 (100.0%) |
Physical Housing Characteristics in Pima
Housing Structures in Pima
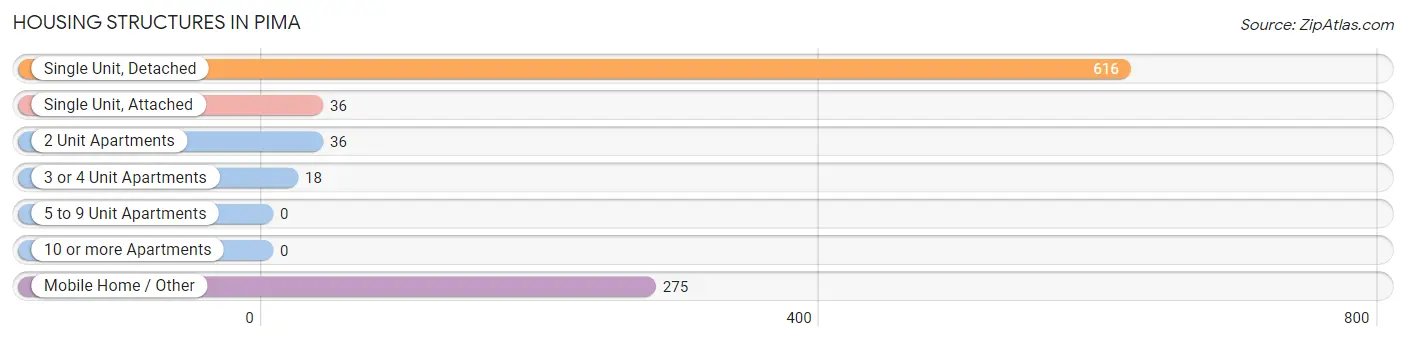
| Structure Type | # Housing Units | % Housing Units |
| Single Unit, Detached | 616 | 62.8% |
| Single Unit, Attached | 36 | 3.7% |
| 2 Unit Apartments | 36 | 3.7% |
| 3 or 4 Unit Apartments | 18 | 1.8% |
| 5 to 9 Unit Apartments | 0 | 0.0% |
| 10 or more Apartments | 0 | 0.0% |
| Mobile Home / Other | 275 | 28.0% |
| Total | 981 | 100.0% |
Housing Structures by Occupancy in Pima
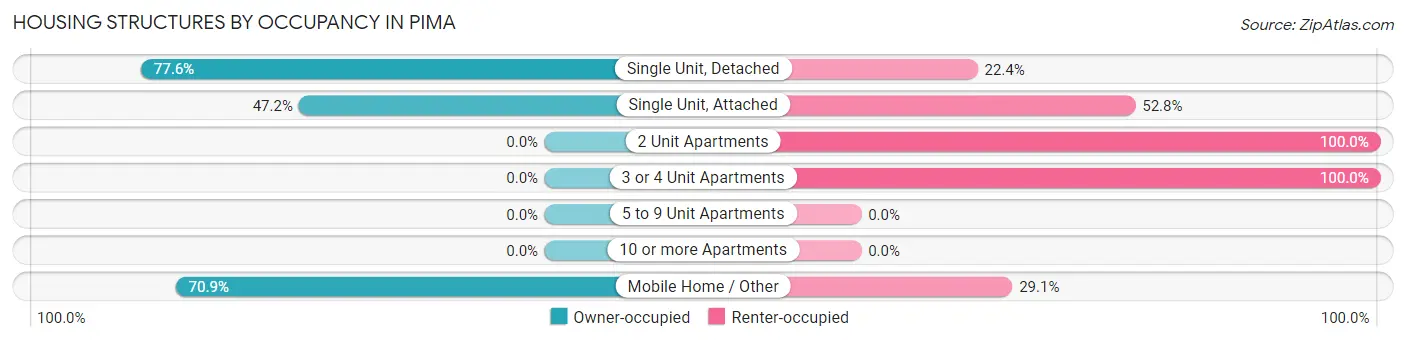
| Structure Type | Owner-occupied | Renter-occupied |
| Single Unit, Detached | 478 (77.6%) | 138 (22.4%) |
| Single Unit, Attached | 17 (47.2%) | 19 (52.8%) |
| 2 Unit Apartments | 0 (0.0%) | 36 (100.0%) |
| 3 or 4 Unit Apartments | 0 (0.0%) | 18 (100.0%) |
| 5 to 9 Unit Apartments | 0 (0.0%) | 0 (0.0%) |
| 10 or more Apartments | 0 (0.0%) | 0 (0.0%) |
| Mobile Home / Other | 195 (70.9%) | 80 (29.1%) |
| Total | 690 (70.3%) | 291 (29.7%) |
Housing Structures by Number of Rooms in Pima
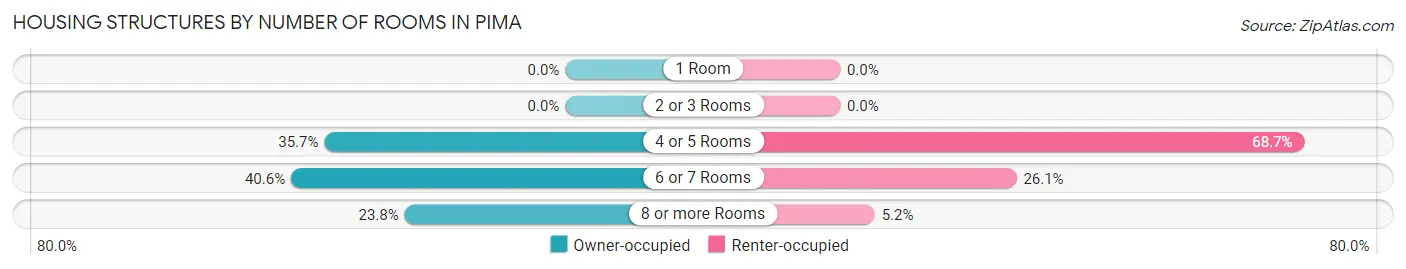
| Number of Rooms | Owner-occupied | Renter-occupied |
| 1 Room | 0 (0.0%) | 0 (0.0%) |
| 2 or 3 Rooms | 0 (0.0%) | 0 (0.0%) |
| 4 or 5 Rooms | 246 (35.6%) | 200 (68.7%) |
| 6 or 7 Rooms | 280 (40.6%) | 76 (26.1%) |
| 8 or more Rooms | 164 (23.8%) | 15 (5.1%) |
| Total | 690 (100.0%) | 291 (100.0%) |
Housing Structure by Heating Type in Pima
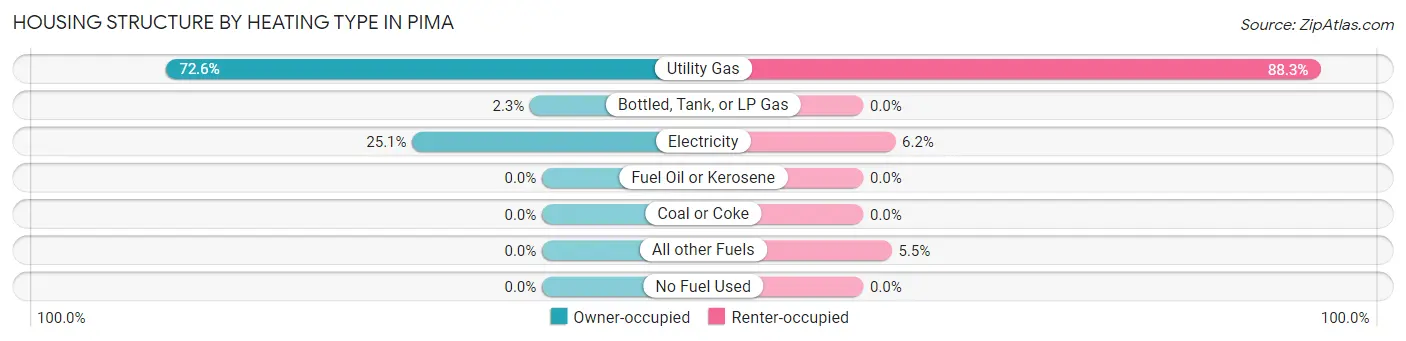
| Heating Type | Owner-occupied | Renter-occupied |
| Utility Gas | 501 (72.6%) | 257 (88.3%) |
| Bottled, Tank, or LP Gas | 16 (2.3%) | 0 (0.0%) |
| Electricity | 173 (25.1%) | 18 (6.2%) |
| Fuel Oil or Kerosene | 0 (0.0%) | 0 (0.0%) |
| Coal or Coke | 0 (0.0%) | 0 (0.0%) |
| All other Fuels | 0 (0.0%) | 16 (5.5%) |
| No Fuel Used | 0 (0.0%) | 0 (0.0%) |
| Total | 690 (100.0%) | 291 (100.0%) |
Household Vehicle Usage in Pima
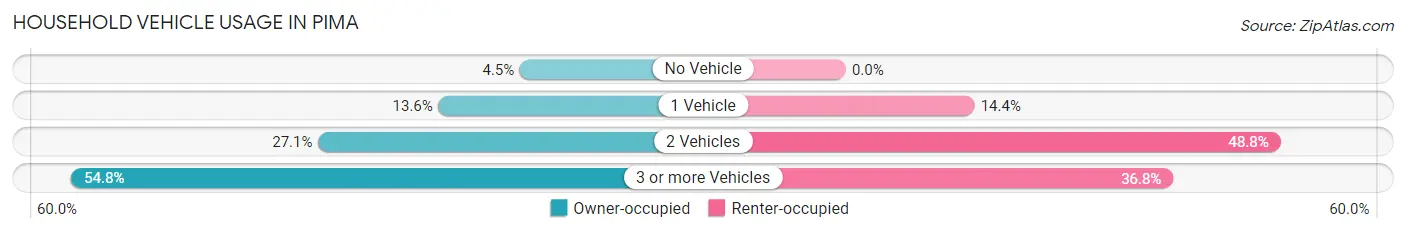
| Vehicles per Household | Owner-occupied | Renter-occupied |
| No Vehicle | 31 (4.5%) | 0 (0.0%) |
| 1 Vehicle | 94 (13.6%) | 42 (14.4%) |
| 2 Vehicles | 187 (27.1%) | 142 (48.8%) |
| 3 or more Vehicles | 378 (54.8%) | 107 (36.8%) |
| Total | 690 (100.0%) | 291 (100.0%) |
Real Estate & Mortgages in Pima
Real Estate and Mortgage Overview in Pima
| Characteristic | Without Mortgage | With Mortgage |
| Housing Units | 312 | 378 |
| Median Property Value | $110,700 | $245,600 |
| Median Household Income | $72,639 | $55 |
| Monthly Housing Costs | $463 | $7 |
| Real Estate Taxes | $560 | $9 |
Property Value by Mortgage Status in Pima
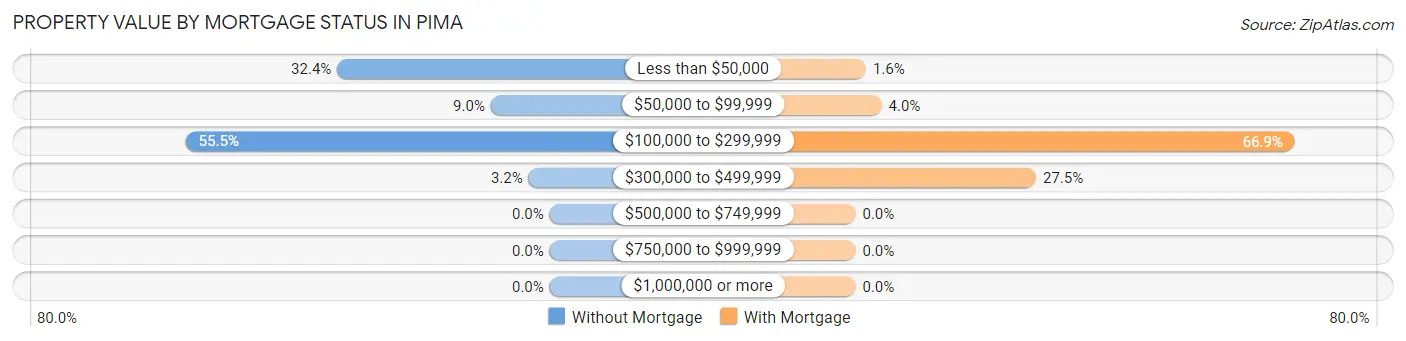
| Property Value | Without Mortgage | With Mortgage |
| Less than $50,000 | 101 (32.4%) | 6 (1.6%) |
| $50,000 to $99,999 | 28 (9.0%) | 15 (4.0%) |
| $100,000 to $299,999 | 173 (55.4%) | 253 (66.9%) |
| $300,000 to $499,999 | 10 (3.2%) | 104 (27.5%) |
| $500,000 to $749,999 | 0 (0.0%) | 0 (0.0%) |
| $750,000 to $999,999 | 0 (0.0%) | 0 (0.0%) |
| $1,000,000 or more | 0 (0.0%) | 0 (0.0%) |
| Total | 312 (100.0%) | 378 (100.0%) |
Household Income by Mortgage Status in Pima
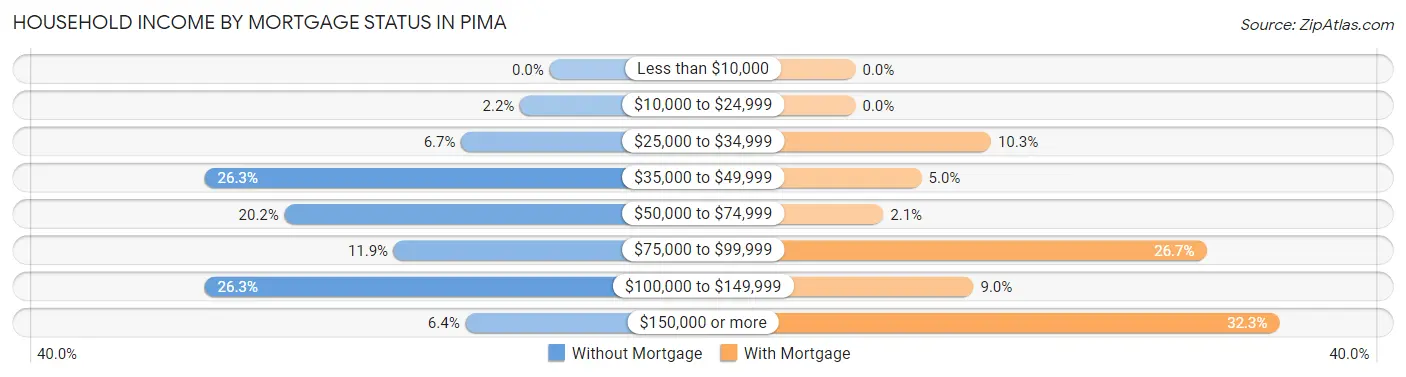
| Household Income | Without Mortgage | With Mortgage |
| Less than $10,000 | 0 (0.0%) | 0 (0.0%) |
| $10,000 to $24,999 | 7 (2.2%) | 0 (0.0%) |
| $25,000 to $34,999 | 21 (6.7%) | 39 (10.3%) |
| $35,000 to $49,999 | 82 (26.3%) | 19 (5.0%) |
| $50,000 to $74,999 | 63 (20.2%) | 8 (2.1%) |
| $75,000 to $99,999 | 37 (11.9%) | 101 (26.7%) |
| $100,000 to $149,999 | 82 (26.3%) | 34 (9.0%) |
| $150,000 or more | 20 (6.4%) | 122 (32.3%) |
| Total | 312 (100.0%) | 378 (100.0%) |
Property Value to Household Income Ratio in Pima
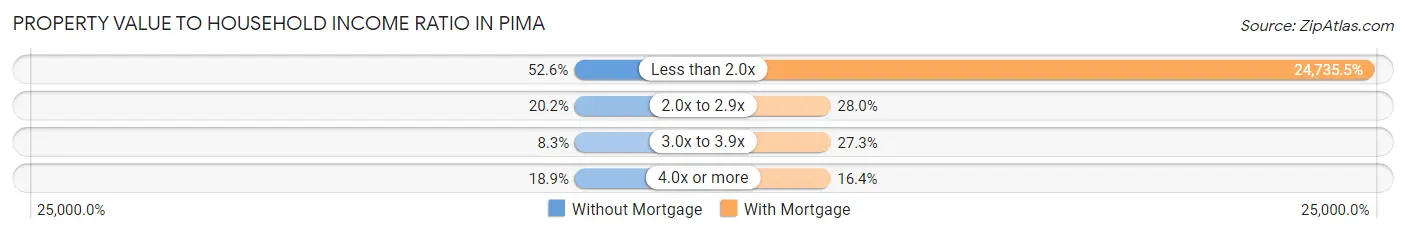
| Value-to-Income Ratio | Without Mortgage | With Mortgage |
| Less than 2.0x | 164 (52.6%) | 93,500 (24,735.5%) |
| 2.0x to 2.9x | 63 (20.2%) | 106 (28.0%) |
| 3.0x to 3.9x | 26 (8.3%) | 103 (27.3%) |
| 4.0x or more | 59 (18.9%) | 62 (16.4%) |
| Total | 312 (100.0%) | 378 (100.0%) |
Real Estate Taxes by Mortgage Status in Pima
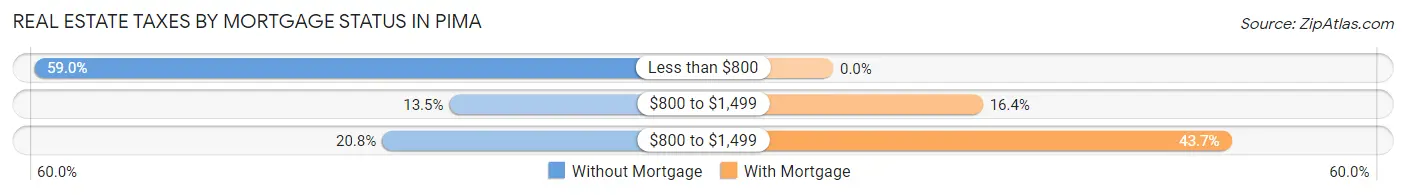
| Property Taxes | Without Mortgage | With Mortgage |
| Less than $800 | 184 (59.0%) | 0 (0.0%) |
| $800 to $1,499 | 42 (13.5%) | 62 (16.4%) |
| $800 to $1,499 | 65 (20.8%) | 165 (43.6%) |
| Total | 312 (100.0%) | 378 (100.0%) |
Health & Disability in Pima
Health Insurance Coverage by Age in Pima
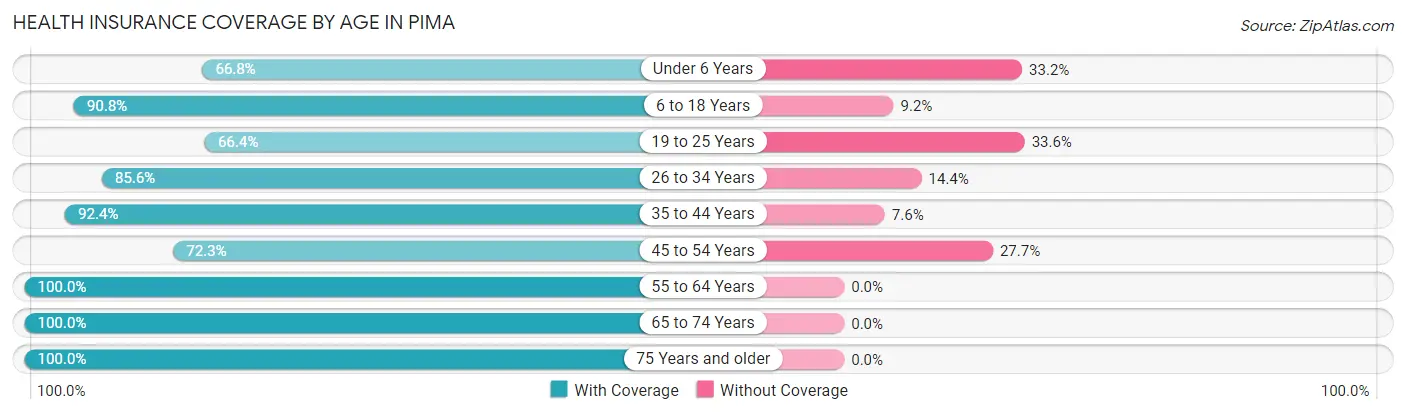
| Age Bracket | With Coverage | Without Coverage |
| Under 6 Years | 137 (66.8%) | 68 (33.2%) |
| 6 to 18 Years | 592 (90.8%) | 60 (9.2%) |
| 19 to 25 Years | 215 (66.4%) | 109 (33.6%) |
| 26 to 34 Years | 267 (85.6%) | 45 (14.4%) |
| 35 to 44 Years | 293 (92.4%) | 24 (7.6%) |
| 45 to 54 Years | 258 (72.3%) | 99 (27.7%) |
| 55 to 64 Years | 229 (100.0%) | 0 (0.0%) |
| 65 to 74 Years | 262 (100.0%) | 0 (0.0%) |
| 75 Years and older | 189 (100.0%) | 0 (0.0%) |
| Total | 2,442 (85.8%) | 405 (14.2%) |
Health Insurance Coverage by Citizenship Status in Pima
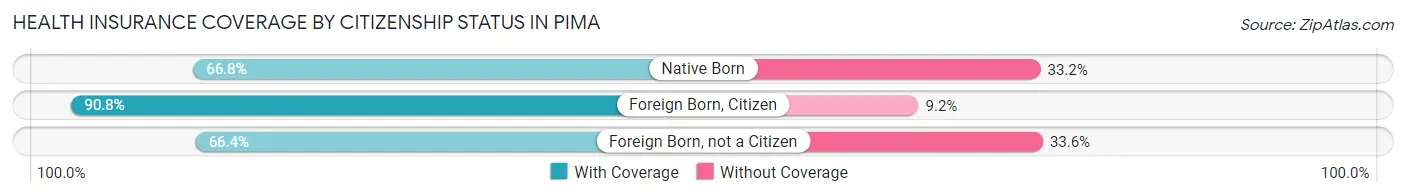
| Citizenship Status | With Coverage | Without Coverage |
| Native Born | 137 (66.8%) | 68 (33.2%) |
| Foreign Born, Citizen | 592 (90.8%) | 60 (9.2%) |
| Foreign Born, not a Citizen | 215 (66.4%) | 109 (33.6%) |
Health Insurance Coverage by Household Income in Pima
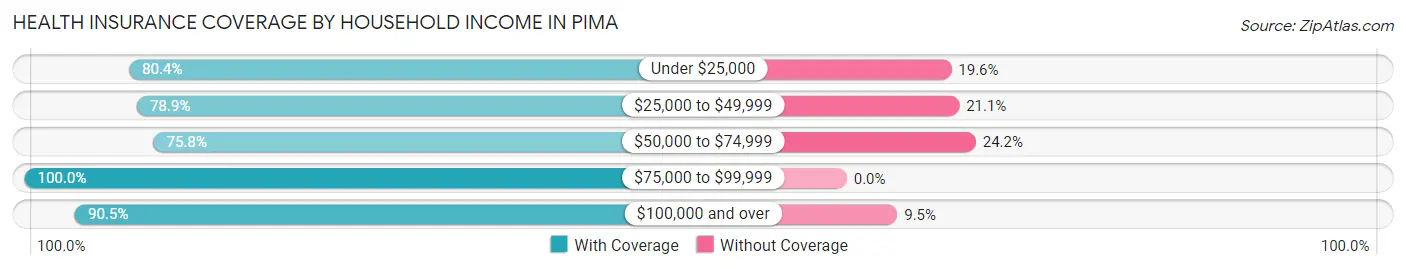
| Household Income | With Coverage | Without Coverage |
| Under $25,000 | 78 (80.4%) | 19 (19.6%) |
| $25,000 to $49,999 | 431 (78.9%) | 115 (21.1%) |
| $50,000 to $74,999 | 546 (75.8%) | 174 (24.2%) |
| $75,000 to $99,999 | 459 (100.0%) | 0 (0.0%) |
| $100,000 and over | 928 (90.5%) | 97 (9.5%) |
Public vs Private Health Insurance Coverage by Age in Pima
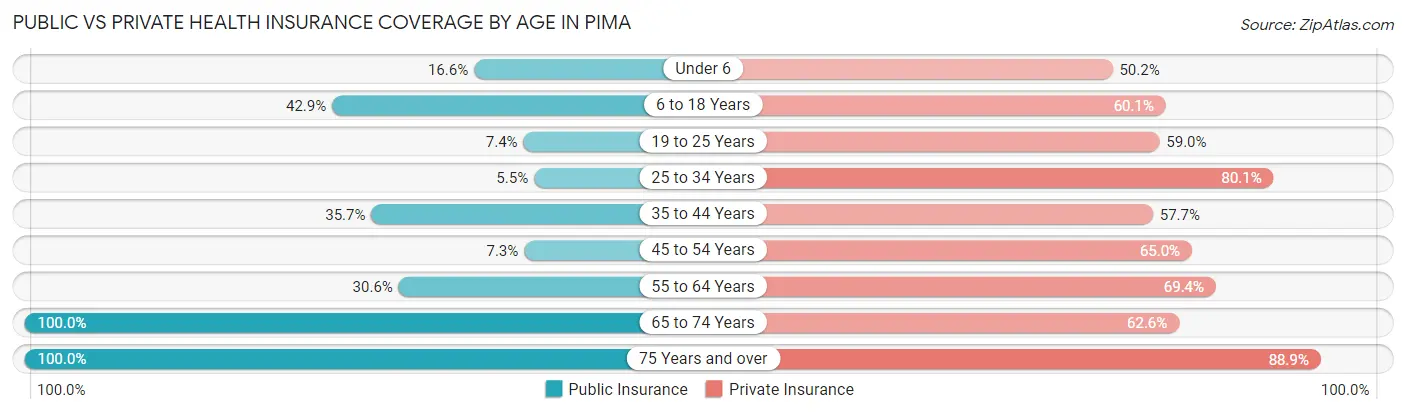
| Age Bracket | Public Insurance | Private Insurance |
| Under 6 | 34 (16.6%) | 103 (50.2%) |
| 6 to 18 Years | 280 (42.9%) | 392 (60.1%) |
| 19 to 25 Years | 24 (7.4%) | 191 (59.0%) |
| 25 to 34 Years | 17 (5.4%) | 250 (80.1%) |
| 35 to 44 Years | 113 (35.6%) | 183 (57.7%) |
| 45 to 54 Years | 26 (7.3%) | 232 (65.0%) |
| 55 to 64 Years | 70 (30.6%) | 159 (69.4%) |
| 65 to 74 Years | 262 (100.0%) | 164 (62.6%) |
| 75 Years and over | 189 (100.0%) | 168 (88.9%) |
| Total | 1,015 (35.6%) | 1,842 (64.7%) |
Disability Status by Sex by Age in Pima
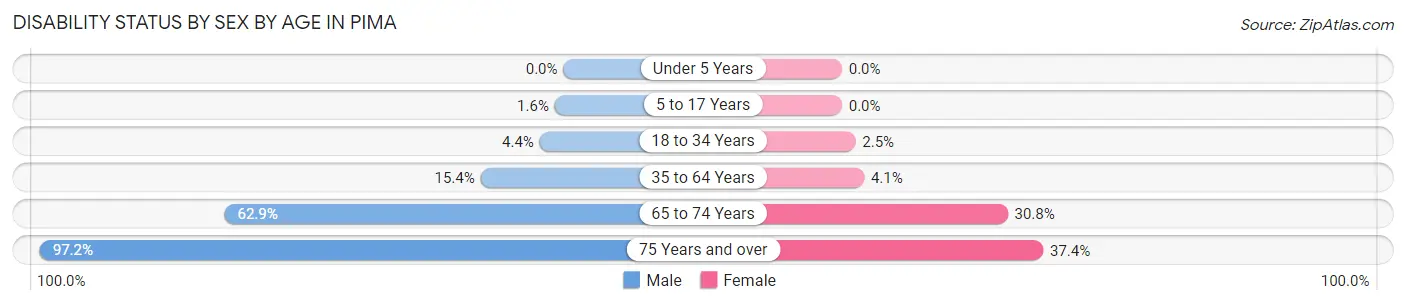
| Age Bracket | Male | Female |
| Under 5 Years | 0 (0.0%) | 0 (0.0%) |
| 5 to 17 Years | 5 (1.6%) | 0 (0.0%) |
| 18 to 34 Years | 12 (4.4%) | 11 (2.5%) |
| 35 to 64 Years | 79 (15.4%) | 16 (4.1%) |
| 65 to 74 Years | 83 (62.9%) | 40 (30.8%) |
| 75 Years and over | 103 (97.2%) | 31 (37.3%) |
Disability Class by Sex by Age in Pima
Disability Class: Hearing Difficulty
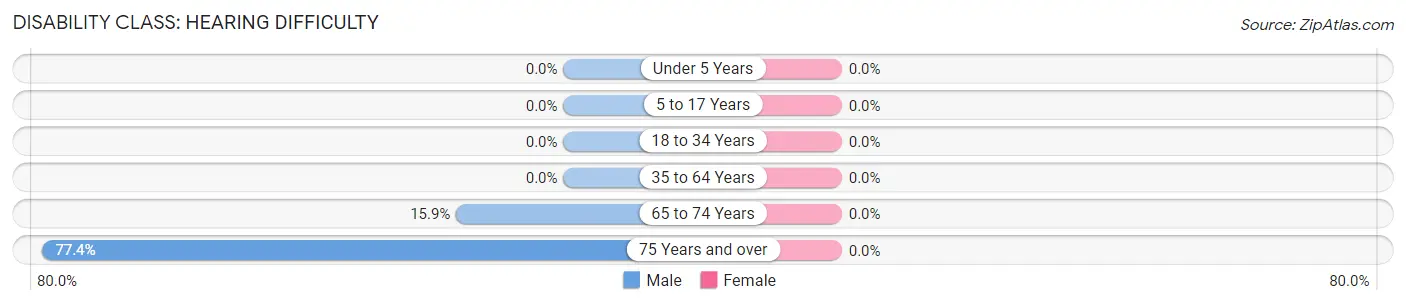
| Age Bracket | Male | Female |
| Under 5 Years | 0 (0.0%) | 0 (0.0%) |
| 5 to 17 Years | 0 (0.0%) | 0 (0.0%) |
| 18 to 34 Years | 0 (0.0%) | 0 (0.0%) |
| 35 to 64 Years | 0 (0.0%) | 0 (0.0%) |
| 65 to 74 Years | 21 (15.9%) | 0 (0.0%) |
| 75 Years and over | 82 (77.4%) | 0 (0.0%) |
Disability Class: Vision Difficulty
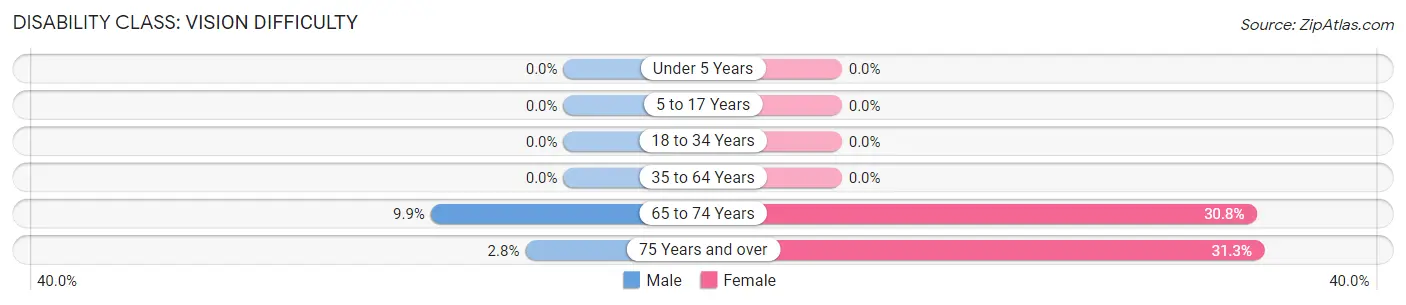
| Age Bracket | Male | Female |
| Under 5 Years | 0 (0.0%) | 0 (0.0%) |
| 5 to 17 Years | 0 (0.0%) | 0 (0.0%) |
| 18 to 34 Years | 0 (0.0%) | 0 (0.0%) |
| 35 to 64 Years | 0 (0.0%) | 0 (0.0%) |
| 65 to 74 Years | 13 (9.9%) | 40 (30.8%) |
| 75 Years and over | 3 (2.8%) | 26 (31.3%) |
Disability Class: Cognitive Difficulty
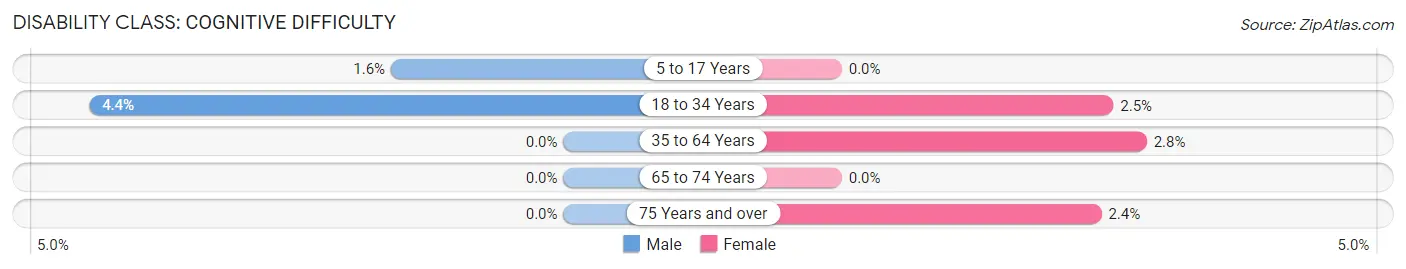
| Age Bracket | Male | Female |
| 5 to 17 Years | 5 (1.6%) | 0 (0.0%) |
| 18 to 34 Years | 12 (4.4%) | 11 (2.5%) |
| 35 to 64 Years | 0 (0.0%) | 11 (2.8%) |
| 65 to 74 Years | 0 (0.0%) | 0 (0.0%) |
| 75 Years and over | 0 (0.0%) | 2 (2.4%) |
Disability Class: Ambulatory Difficulty
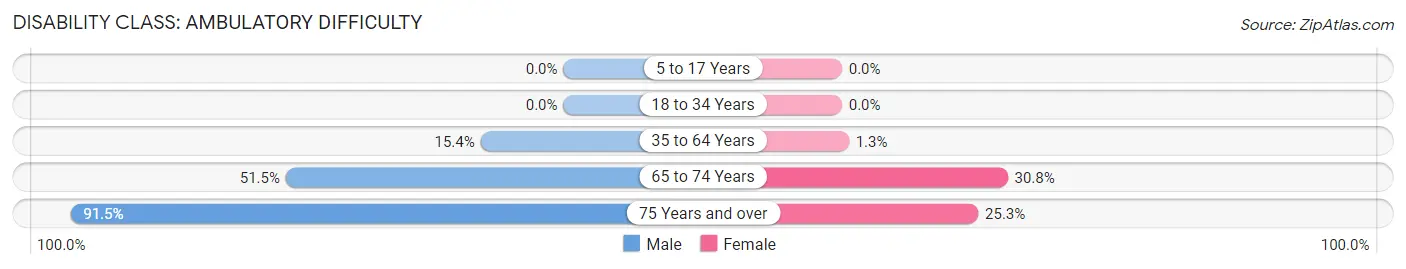
| Age Bracket | Male | Female |
| 5 to 17 Years | 0 (0.0%) | 0 (0.0%) |
| 18 to 34 Years | 0 (0.0%) | 0 (0.0%) |
| 35 to 64 Years | 79 (15.4%) | 5 (1.3%) |
| 65 to 74 Years | 68 (51.5%) | 40 (30.8%) |
| 75 Years and over | 97 (91.5%) | 21 (25.3%) |
Disability Class: Self-Care Difficulty
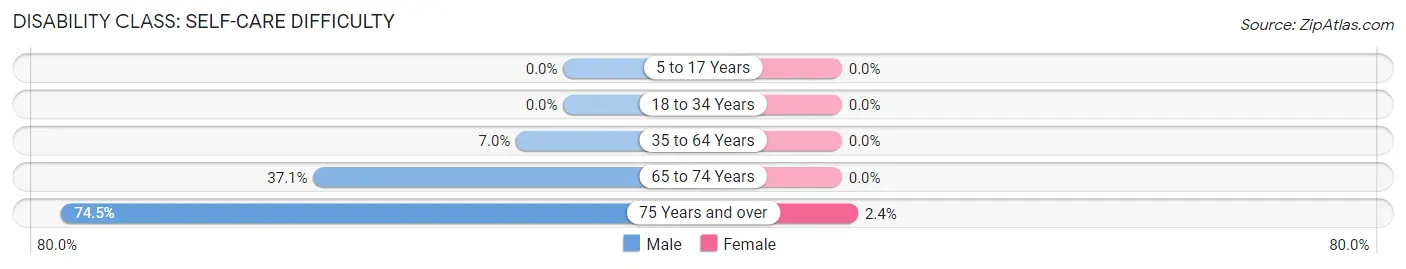
| Age Bracket | Male | Female |
| 5 to 17 Years | 0 (0.0%) | 0 (0.0%) |
| 18 to 34 Years | 0 (0.0%) | 0 (0.0%) |
| 35 to 64 Years | 36 (7.0%) | 0 (0.0%) |
| 65 to 74 Years | 49 (37.1%) | 0 (0.0%) |
| 75 Years and over | 79 (74.5%) | 2 (2.4%) |
Technology Access in Pima
Computing Device Access in Pima
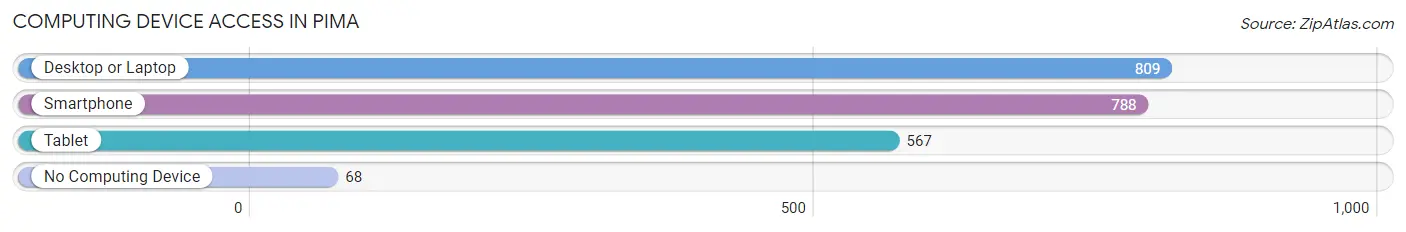
| Device Type | # Households | % Households |
| Desktop or Laptop | 809 | 82.5% |
| Smartphone | 788 | 80.3% |
| Tablet | 567 | 57.8% |
| No Computing Device | 68 | 6.9% |
| Total | 981 | 100.0% |
Internet Access in Pima
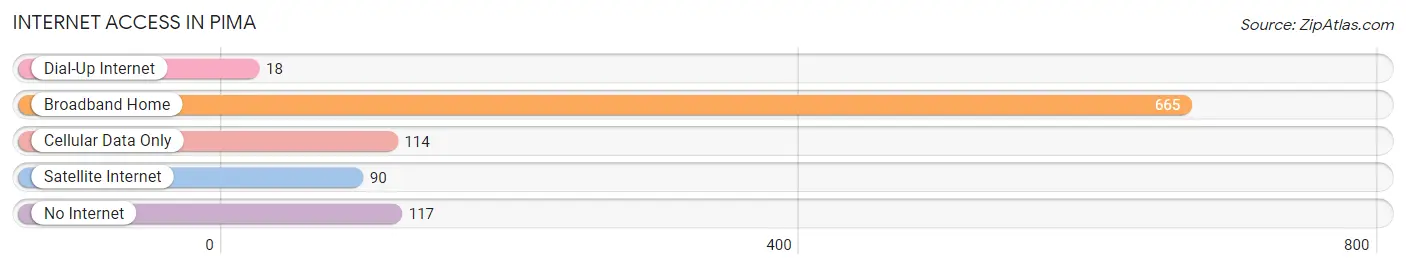
| Internet Type | # Households | % Households |
| Dial-Up Internet | 18 | 1.8% |
| Broadband Home | 665 | 67.8% |
| Cellular Data Only | 114 | 11.6% |
| Satellite Internet | 90 | 9.2% |
| No Internet | 117 | 11.9% |
| Total | 981 | 100.0% |
Pima Summary
Pima, Arizona is a small town located in the southeastern corner of the state, just north of the Mexican border. It is part of the Tucson metropolitan area and is the county seat of Pima County. The town has a population of about 4,000 people and is known for its rich history, diverse geography, and vibrant economy.
History
Pima was founded in 1857 by a group of settlers from the nearby town of Tubac. The settlers were looking for a place to settle and start a new life, and they chose the area around Pima because of its fertile soil and abundant water sources. The town was named after the Pima Indians, who had lived in the area for centuries.
The town quickly grew and by the late 1800s, it had become a bustling center of commerce and industry. The railroad arrived in 1881, connecting Pima to the rest of the state and the country. The town also became a major agricultural center, with cotton, citrus, and other crops being grown in the area.
In the early 1900s, Pima began to experience a period of decline. The railroad was replaced by the automobile, and the town’s economy shifted away from agriculture. The Great Depression hit the town hard, and many of the businesses and farms closed.
In the 1950s, Pima began to experience a resurgence. The town was chosen as the site of a new air force base, which brought jobs and economic growth to the area. The base was later closed, but the town continued to grow and develop.
Geography
Pima is located in the Sonoran Desert, and the town is surrounded by mountains and hills. The Santa Cruz River runs through the town, providing a source of water for the area. The town is located at an elevation of 2,500 feet, and the climate is hot and dry, with temperatures reaching over 100 degrees in the summer months.
The town is located near the Mexican border, and the nearby Tohono O’odham Nation is home to a large population of Native Americans. The town is also close to the Saguaro National Park, which is home to a variety of wildlife and plants.
Economy
Pima’s economy is largely based on agriculture and tourism. The town is home to a number of farms, which produce a variety of crops, including cotton, citrus, and other fruits and vegetables. The town is also home to a number of tourist attractions, including the Saguaro National Park and the nearby Tohono O’odham Nation.
The town is also home to a number of businesses, including restaurants, shops, and other services. The town is also home to a number of manufacturing companies, which produce a variety of products, including furniture, clothing, and electronics.
Demographics
As of the 2010 census, the population of Pima was 4,097. The town is predominantly white, with about 75% of the population identifying as white. The town is also home to a large Hispanic population, with about 20% of the population identifying as Hispanic or Latino. The town is also home to a small Native American population, with about 5% of the population identifying as Native American.
Pima is a small town with a rich history, diverse geography, and vibrant economy. The town is home to a variety of businesses, farms, and tourist attractions, and it is a great place to live and work. The town is also home to a diverse population, with a variety of ethnic and racial backgrounds.
Common Questions
What is Per Capita Income in Pima?
Per Capita income in Pima is $27,424.
What is the Median Family Income in Pima?
Median Family Income in Pima is $93,250.
What is the Median Household income in Pima?
Median Household Income in Pima is $67,880.
What is Income or Wage Gap in Pima?
Income or Wage Gap in Pima is 42.5%.
Women in Pima earn 57.5 cents for every dollar earned by a man.
What is Inequality or Gini Index in Pima?
Inequality or Gini Index in Pima is 0.33.
What is the Total Population of Pima?
Total Population of Pima is 2,847.
What is the Total Male Population of Pima?
Total Male Population of Pima is 1,411.
What is the Total Female Population of Pima?
Total Female Population of Pima is 1,436.
What is the Ratio of Males per 100 Females in Pima?
There are 98.26 Males per 100 Females in Pima.
What is the Ratio of Females per 100 Males in Pima?
There are 101.77 Females per 100 Males in Pima.
What is the Median Population Age in Pima?
Median Population Age in Pima is 33.2 Years.
What is the Average Family Size in Pima
Average Family Size in Pima is 3.3 People.
What is the Average Household Size in Pima
Average Household Size in Pima is 2.9 People.
How Large is the Labor Force in Pima?
There are 1,329 People in the Labor Forcein in Pima.
What is the Percentage of People in the Labor Force in Pima?
61.7% of People are in the Labor Force in Pima.
What is the Unemployment Rate in Pima?
Unemployment Rate in Pima is 1.8%.