Willow Valley, AZ Map & Demographics
Willow Valley Map
Willow Valley Overview
$28,563
PER CAPITA INCOME
$48,894
AVG FAMILY INCOME
$32,981
AVG HOUSEHOLD INCOME
34.6%
WAGE / INCOME GAP [ % ]
65.4¢/ $1
WAGE / INCOME GAP [ $ ]
0.46
INEQUALITY / GINI INDEX
819
TOTAL POPULATION
494
MALE POPULATION
325
FEMALE POPULATION
152.00
MALES / 100 FEMALES
65.79
FEMALES / 100 MALES
59.7
MEDIAN AGE
2.6
AVG FAMILY SIZE
1.9
AVG HOUSEHOLD SIZE
178
LABOR FORCE [ PEOPLE ]
24.8%
PERCENT IN LABOR FORCE
13.5%
UNEMPLOYMENT RATE
Income in Willow Valley
Income Overview in Willow Valley
Per Capita Income in Willow Valley is $28,563, while median incomes of families and households are $48,894 and $32,981 respectively.
| Characteristic | Number | Measure |
| Per Capita Income | 819 | $28,563 |
| Median Family Income | 191 | $48,894 |
| Mean Family Income | 191 | $76,229 |
| Median Household Income | 433 | $32,981 |
| Mean Household Income | 433 | $53,492 |
| Income Deficit | 191 | $0 |
| Wage / Income Gap (%) | 819 | 34.65% |
| Wage / Income Gap ($) | 819 | 65.35¢ per $1 |
| Gini / Inequality Index | 819 | 0.46 |
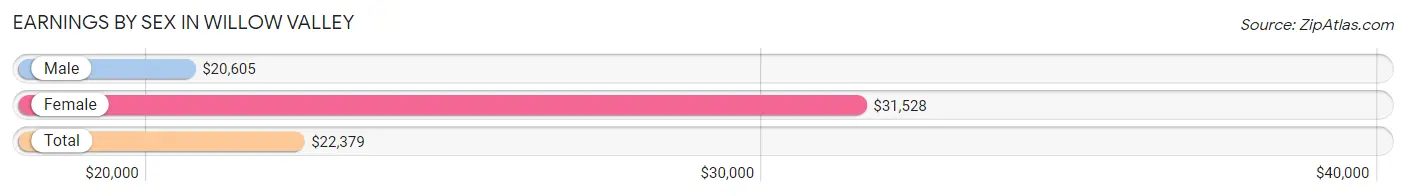
Earnings by Sex in Willow Valley
Average Earnings in Willow Valley are $22,379, $20,605 for men and $31,528 for women, a difference of 34.6%.
| Sex | Number | Average Earnings |
| Male | 135 (55.1%) | $20,605 |
| Female | 110 (44.9%) | $31,528 |
| Total | 245 (100.0%) | $22,379 |
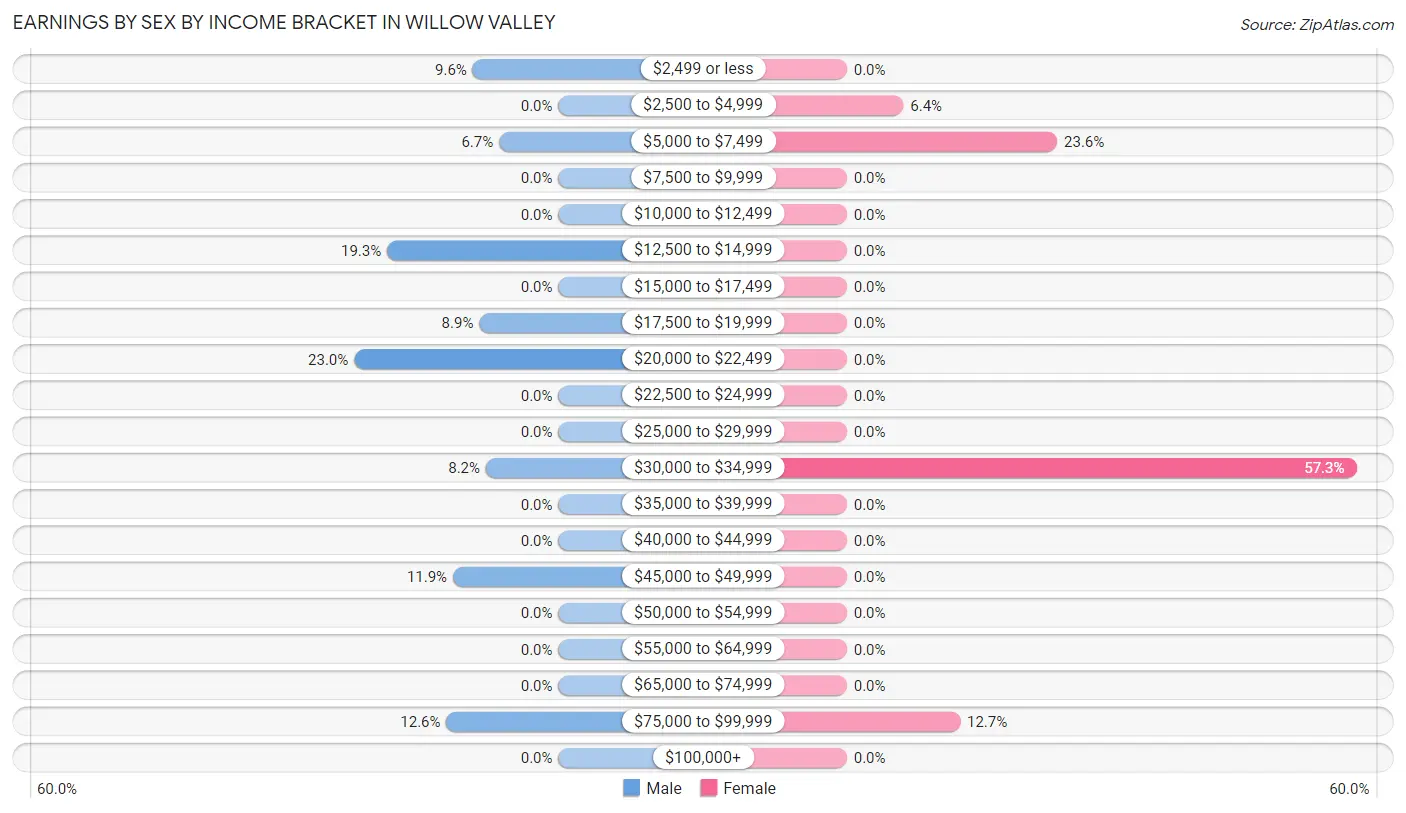
Earnings by Sex by Income Bracket in Willow Valley
The most common earnings brackets in Willow Valley are $20,000 to $22,499 for men (31 | 23.0%) and $30,000 to $34,999 for women (63 | 57.3%).
| Income | Male | Female |
| $2,499 or less | 13 (9.6%) | 0 (0.0%) |
| $2,500 to $4,999 | 0 (0.0%) | 7 (6.4%) |
| $5,000 to $7,499 | 9 (6.7%) | 26 (23.6%) |
| $7,500 to $9,999 | 0 (0.0%) | 0 (0.0%) |
| $10,000 to $12,499 | 0 (0.0%) | 0 (0.0%) |
| $12,500 to $14,999 | 26 (19.3%) | 0 (0.0%) |
| $15,000 to $17,499 | 0 (0.0%) | 0 (0.0%) |
| $17,500 to $19,999 | 12 (8.9%) | 0 (0.0%) |
| $20,000 to $22,499 | 31 (23.0%) | 0 (0.0%) |
| $22,500 to $24,999 | 0 (0.0%) | 0 (0.0%) |
| $25,000 to $29,999 | 0 (0.0%) | 0 (0.0%) |
| $30,000 to $34,999 | 11 (8.2%) | 63 (57.3%) |
| $35,000 to $39,999 | 0 (0.0%) | 0 (0.0%) |
| $40,000 to $44,999 | 0 (0.0%) | 0 (0.0%) |
| $45,000 to $49,999 | 16 (11.8%) | 0 (0.0%) |
| $50,000 to $54,999 | 0 (0.0%) | 0 (0.0%) |
| $55,000 to $64,999 | 0 (0.0%) | 0 (0.0%) |
| $65,000 to $74,999 | 0 (0.0%) | 0 (0.0%) |
| $75,000 to $99,999 | 17 (12.6%) | 14 (12.7%) |
| $100,000+ | 0 (0.0%) | 0 (0.0%) |
| Total | 135 (100.0%) | 110 (100.0%) |
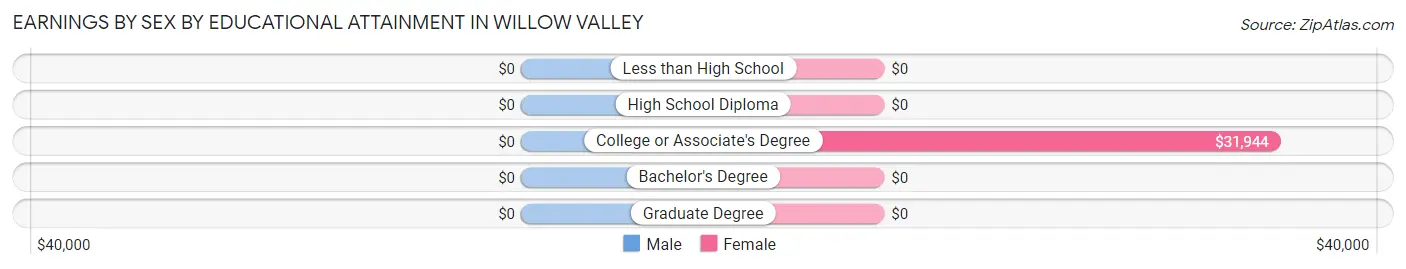
Earnings by Sex by Educational Attainment in Willow Valley
| Educational Attainment | Male Income | Female Income |
| Less than High School | - | - |
| High School Diploma | - | - |
| College or Associate's Degree | - | - |
| Bachelor's Degree | - | - |
| Graduate Degree | - | - |
| Total | $20,605 | $31,528 |
Family Income in Willow Valley
Family Income Brackets in Willow Valley
According to the Willow Valley family income data, there are 44 families falling into the $15,000 to $24,999 income range, which is the most common income bracket and makes up 23.0% of all families.
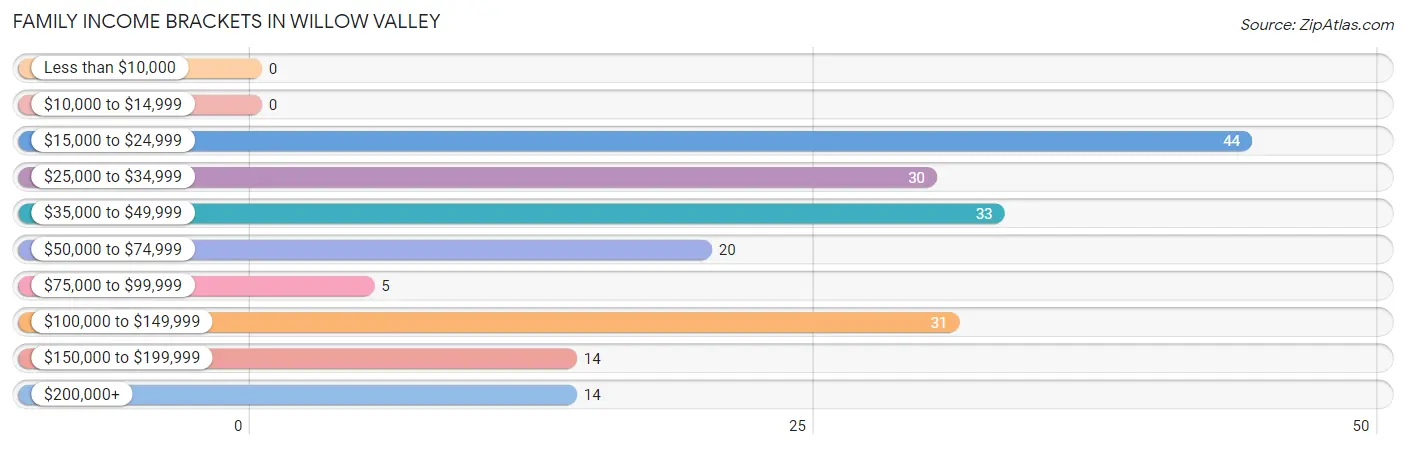
| Income Bracket | # Families | % Families |
| Less than $10,000 | 0 | 0.0% |
| $10,000 to $14,999 | 0 | 0.0% |
| $15,000 to $24,999 | 44 | 23.0% |
| $25,000 to $34,999 | 30 | 15.7% |
| $35,000 to $49,999 | 33 | 17.3% |
| $50,000 to $74,999 | 20 | 10.5% |
| $75,000 to $99,999 | 5 | 2.6% |
| $100,000 to $149,999 | 31 | 16.2% |
| $150,000 to $199,999 | 14 | 7.3% |
| $200,000+ | 14 | 7.3% |
Family Income by Famaliy Size in Willow Valley
| Income Bracket | # Families | Median Income |
| 2-Person Families | 160 (83.8%) | $0 |
| 3-Person Families | 5 (2.6%) | $0 |
| 4-Person Families | 0 (0.0%) | $0 |
| 5-Person Families | 0 (0.0%) | $0 |
| 6-Person Families | 26 (13.6%) | $0 |
| 7+ Person Families | 0 (0.0%) | $0 |
| Total | 191 (100.0%) | $48,894 |
Family Income by Number of Earners in Willow Valley
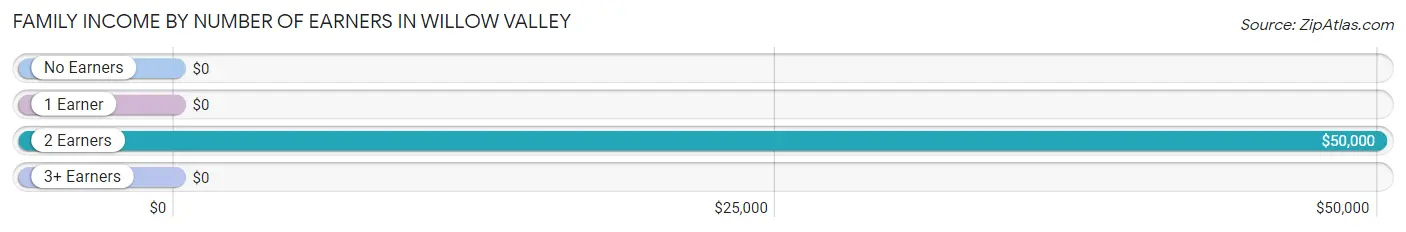
| Number of Earners | # Families | Median Income |
| No Earners | 76 (39.8%) | $0 |
| 1 Earner | 63 (33.0%) | $0 |
| 2 Earners | 52 (27.2%) | $50,000 |
| 3+ Earners | 0 (0.0%) | $0 |
| Total | 191 (100.0%) | $48,894 |
Household Income in Willow Valley
Household Income Brackets in Willow Valley
With 92 households falling in the category, the $15,000 to $24,999 income range is the most frequent in Willow Valley, accounting for 21.2% of all households. In contrast, only 5 households (1.1%) fall into the $75,000 to $99,999 income bracket, making it the least populous group.
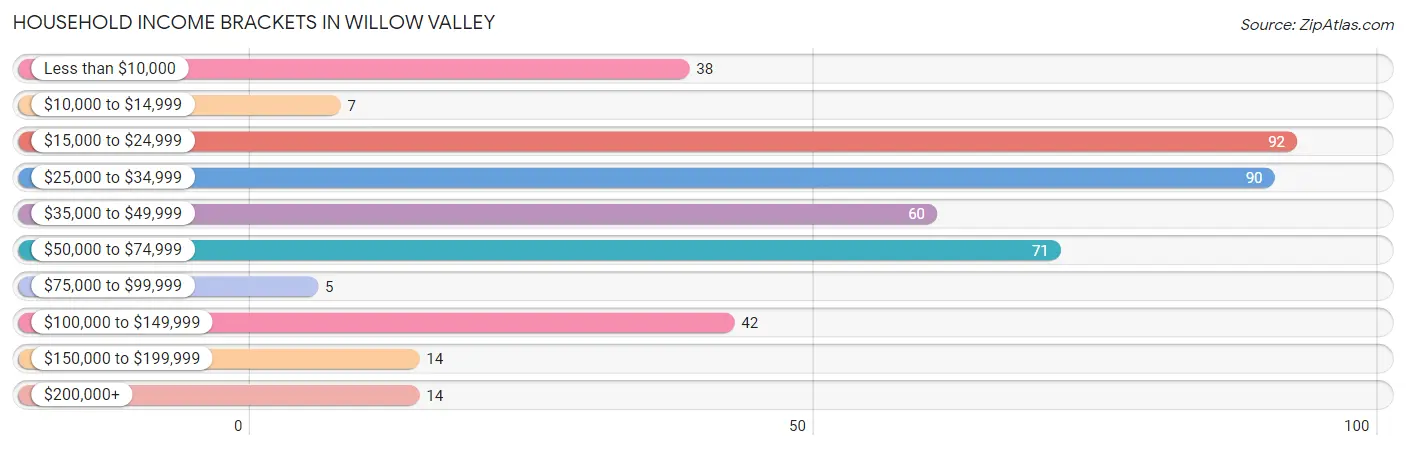
| Income Bracket | # Households | % Households |
| Less than $10,000 | 38 | 8.8% |
| $10,000 to $14,999 | 7 | 1.6% |
| $15,000 to $24,999 | 92 | 21.2% |
| $25,000 to $34,999 | 90 | 20.8% |
| $35,000 to $49,999 | 60 | 13.9% |
| $50,000 to $74,999 | 71 | 16.4% |
| $75,000 to $99,999 | 5 | 1.2% |
| $100,000 to $149,999 | 42 | 9.7% |
| $150,000 to $199,999 | 14 | 3.2% |
| $200,000+ | 14 | 3.2% |
Household Income by Householder Age in Willow Valley
The median household income in Willow Valley is $32,981, with the highest median household income of $43,580 found in the 45 to 64 years age bracket for the primary householder. A total of 131 households (30.2%) fall into this category.
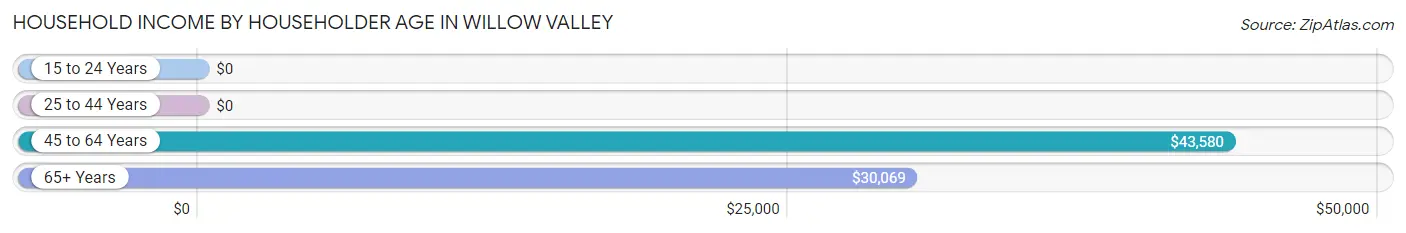
| Income Bracket | # Households | Median Income |
| 15 to 24 Years | 0 (0.0%) | $0 |
| 25 to 44 Years | 68 (15.7%) | $0 |
| 45 to 64 Years | 131 (30.2%) | $43,580 |
| 65+ Years | 234 (54.0%) | $30,069 |
| Total | 433 (100.0%) | $32,981 |
Poverty in Willow Valley
Income Below Poverty by Sex and Age in Willow Valley
With 16.6% poverty level for males and 12.9% for females among the residents of Willow Valley, 55 to 64 year old males and 75 year old and over females are the most vulnerable to poverty, with 71 males (49.6%) and 14 females (48.3%) in their respective age groups living below the poverty level.
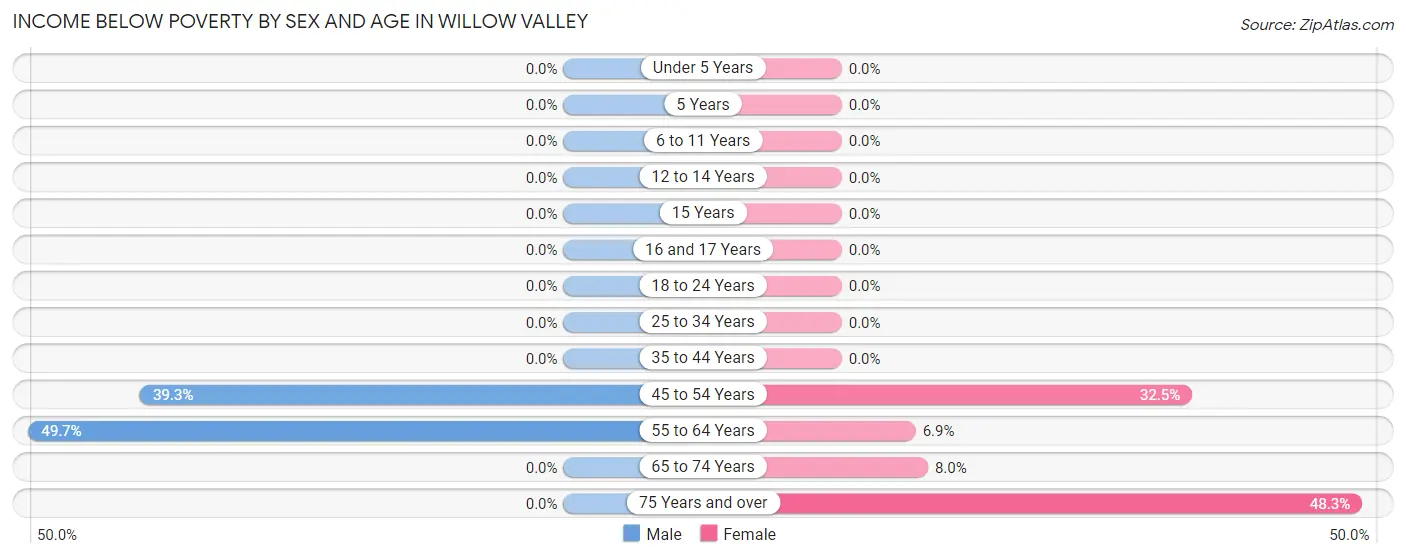
| Age Bracket | Male | Female |
| Under 5 Years | 0 (0.0%) | 0 (0.0%) |
| 5 Years | 0 (0.0%) | 0 (0.0%) |
| 6 to 11 Years | 0 (0.0%) | 0 (0.0%) |
| 12 to 14 Years | 0 (0.0%) | 0 (0.0%) |
| 15 Years | 0 (0.0%) | 0 (0.0%) |
| 16 and 17 Years | 0 (0.0%) | 0 (0.0%) |
| 18 to 24 Years | 0 (0.0%) | 0 (0.0%) |
| 25 to 34 Years | 0 (0.0%) | 0 (0.0%) |
| 35 to 44 Years | 0 (0.0%) | 0 (0.0%) |
| 45 to 54 Years | 11 (39.3%) | 13 (32.5%) |
| 55 to 64 Years | 71 (49.6%) | 7 (6.9%) |
| 65 to 74 Years | 0 (0.0%) | 8 (8.0%) |
| 75 Years and over | 0 (0.0%) | 14 (48.3%) |
| Total | 82 (16.6%) | 42 (12.9%) |
Income Above Poverty by Sex and Age in Willow Valley
According to the poverty statistics in Willow Valley, males aged under 5 years and females aged 6 to 11 years are the age groups that are most secure financially, with 100.0% of males and 100.0% of females in these age groups living above the poverty line.
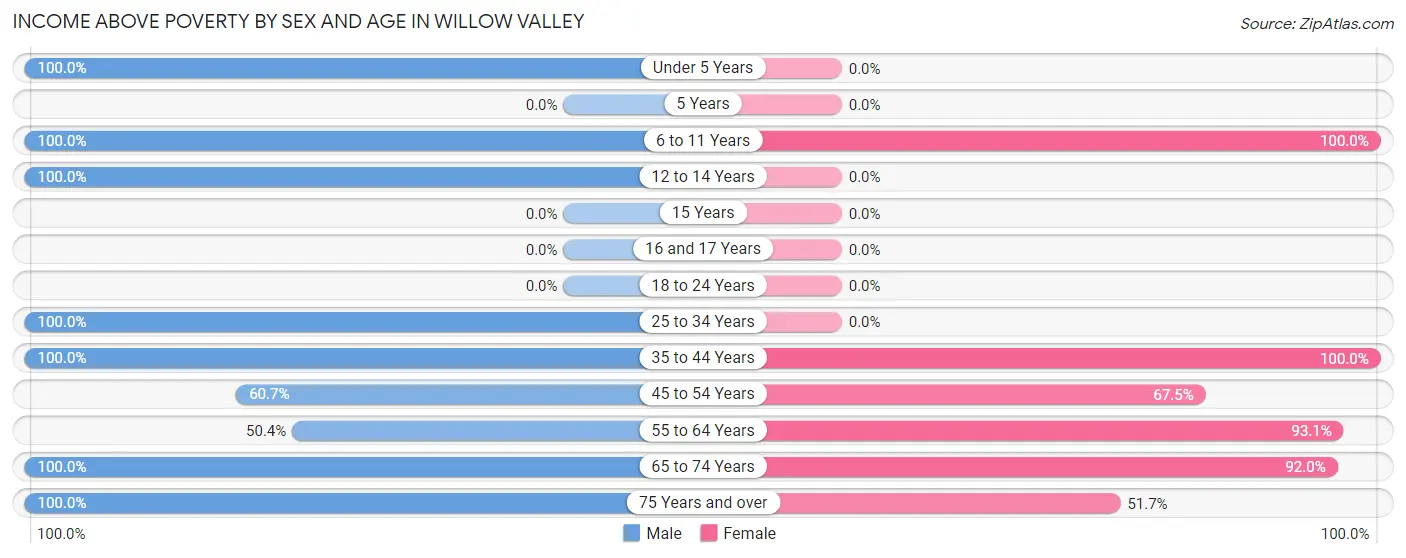
| Age Bracket | Male | Female |
| Under 5 Years | 24 (100.0%) | 0 (0.0%) |
| 5 Years | 0 (0.0%) | 0 (0.0%) |
| 6 to 11 Years | 25 (100.0%) | 27 (100.0%) |
| 12 to 14 Years | 25 (100.0%) | 0 (0.0%) |
| 15 Years | 0 (0.0%) | 0 (0.0%) |
| 16 and 17 Years | 0 (0.0%) | 0 (0.0%) |
| 18 to 24 Years | 0 (0.0%) | 0 (0.0%) |
| 25 to 34 Years | 39 (100.0%) | 0 (0.0%) |
| 35 to 44 Years | 68 (100.0%) | 27 (100.0%) |
| 45 to 54 Years | 17 (60.7%) | 27 (67.5%) |
| 55 to 64 Years | 72 (50.3%) | 95 (93.1%) |
| 65 to 74 Years | 73 (100.0%) | 92 (92.0%) |
| 75 Years and over | 69 (100.0%) | 15 (51.7%) |
| Total | 412 (83.4%) | 283 (87.1%) |
Income Below Poverty Among Married-Couple Families in Willow Valley
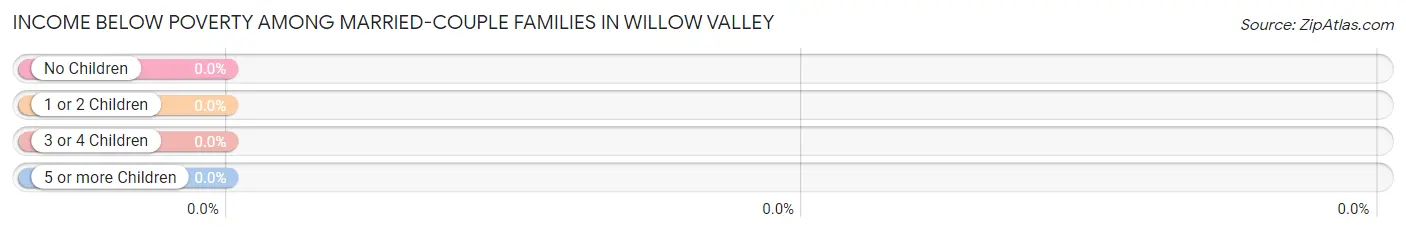
| Children | Above Poverty | Below Poverty |
| No Children | 83 (100.0%) | 0 (0.0%) |
| 1 or 2 Children | 0 (0.0%) | 0 (0.0%) |
| 3 or 4 Children | 26 (100.0%) | 0 (0.0%) |
| 5 or more Children | 0 (0.0%) | 0 (0.0%) |
| Total | 109 (100.0%) | 0 (0.0%) |
Income Below Poverty Among Single-Parent Households in Willow Valley
| Children | Single Father | Single Mother |
| No Children | 0 (0.0%) | 0 (0.0%) |
| 1 or 2 Children | 0 (0.0%) | 0 (0.0%) |
| 3 or 4 Children | 0 (0.0%) | 0 (0.0%) |
| 5 or more Children | 0 (0.0%) | 0 (0.0%) |
| Total | 0 (0.0%) | 0 (0.0%) |
Income Below Poverty Among Married-Couple vs Single-Parent Households in Willow Valley
| Children | Married-Couple Families | Single-Parent Households |
| No Children | 0 (0.0%) | 0 (0.0%) |
| 1 or 2 Children | 0 (0.0%) | 0 (0.0%) |
| 3 or 4 Children | 0 (0.0%) | 0 (0.0%) |
| 5 or more Children | 0 (0.0%) | 0 (0.0%) |
| Total | 0 (0.0%) | 0 (0.0%) |
Race in Willow Valley
The most populous races in Willow Valley are White / Caucasian (774 | 94.5%), Hispanic or Latino (75 | 9.2%), and Native / Alaskan (32 | 3.9%).
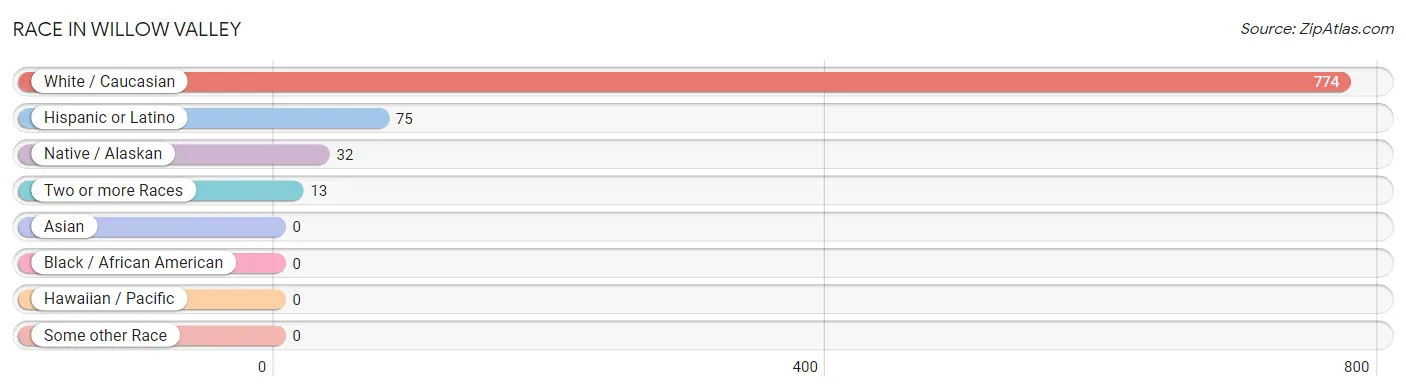
| Race | # Population | % Population |
| Asian | 0 | 0.0% |
| Black / African American | 0 | 0.0% |
| Hawaiian / Pacific | 0 | 0.0% |
| Hispanic or Latino | 75 | 9.2% |
| Native / Alaskan | 32 | 3.9% |
| White / Caucasian | 774 | 94.5% |
| Two or more Races | 13 | 1.6% |
| Some other Race | 0 | 0.0% |
| Total | 819 | 100.0% |
Ancestry in Willow Valley
The most populous ancestries reported in Willow Valley are Irish (159 | 19.4%), English (150 | 18.3%), Swedish (114 | 13.9%), German (100 | 12.2%), and French (59 | 7.2%), together accounting for 71.1% of all Willow Valley residents.
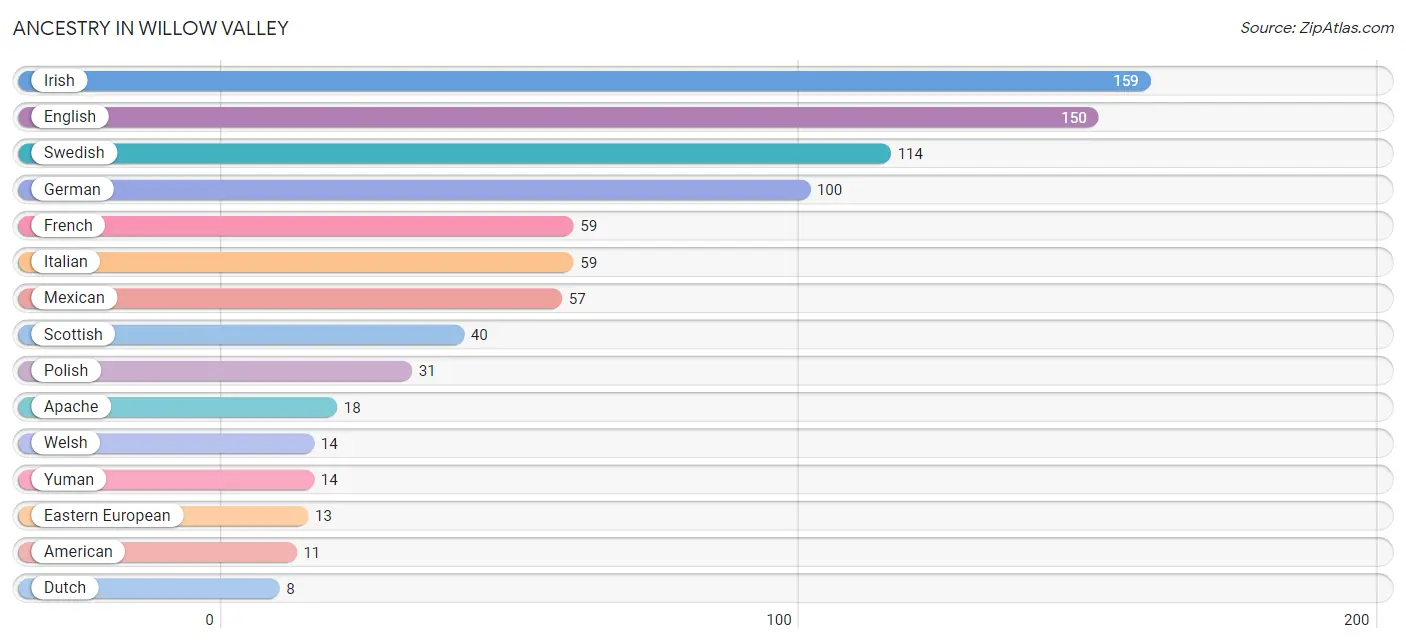
| Ancestry | # Population | % Population |
| American | 11 | 1.3% |
| Apache | 18 | 2.2% |
| Dutch | 8 | 1.0% |
| Eastern European | 13 | 1.6% |
| English | 150 | 18.3% |
| French | 59 | 7.2% |
| French Canadian | 8 | 1.0% |
| German | 100 | 12.2% |
| Irish | 159 | 19.4% |
| Italian | 59 | 7.2% |
| Mexican | 57 | 7.0% |
| Polish | 31 | 3.8% |
| Scottish | 40 | 4.9% |
| Swedish | 114 | 13.9% |
| Welsh | 14 | 1.7% |
| Yuman | 14 | 1.7% | View All 16 Rows |
Immigrants in Willow Valley

| Immigration Origin | # Population | % Population | View All 0 Rows |
Sex and Age in Willow Valley
Sex and Age in Willow Valley
The most populous age groups in Willow Valley are 60 to 64 Years (76 | 15.4%) for men and 65 to 69 Years (86 | 26.5%) for women.
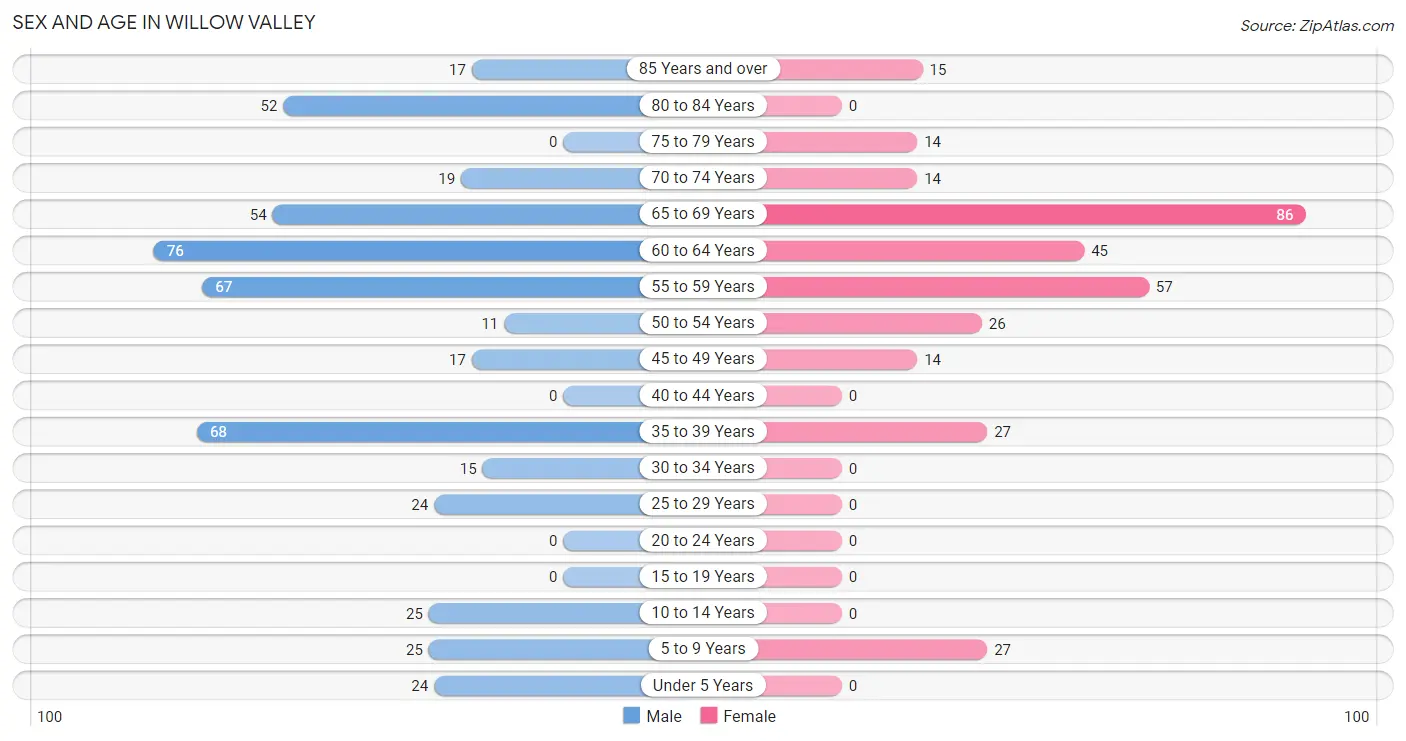
| Age Bracket | Male | Female |
| Under 5 Years | 24 (4.9%) | 0 (0.0%) |
| 5 to 9 Years | 25 (5.1%) | 27 (8.3%) |
| 10 to 14 Years | 25 (5.1%) | 0 (0.0%) |
| 15 to 19 Years | 0 (0.0%) | 0 (0.0%) |
| 20 to 24 Years | 0 (0.0%) | 0 (0.0%) |
| 25 to 29 Years | 24 (4.9%) | 0 (0.0%) |
| 30 to 34 Years | 15 (3.0%) | 0 (0.0%) |
| 35 to 39 Years | 68 (13.8%) | 27 (8.3%) |
| 40 to 44 Years | 0 (0.0%) | 0 (0.0%) |
| 45 to 49 Years | 17 (3.4%) | 14 (4.3%) |
| 50 to 54 Years | 11 (2.2%) | 26 (8.0%) |
| 55 to 59 Years | 67 (13.6%) | 57 (17.5%) |
| 60 to 64 Years | 76 (15.4%) | 45 (13.9%) |
| 65 to 69 Years | 54 (10.9%) | 86 (26.5%) |
| 70 to 74 Years | 19 (3.8%) | 14 (4.3%) |
| 75 to 79 Years | 0 (0.0%) | 14 (4.3%) |
| 80 to 84 Years | 52 (10.5%) | 0 (0.0%) |
| 85 Years and over | 17 (3.4%) | 15 (4.6%) |
| Total | 494 (100.0%) | 325 (100.0%) |
Families and Households in Willow Valley
Median Family Size in Willow Valley
The median family size in Willow Valley is 2.61 persons per family, with married-couple families (109 | 57.1%) accounting for the largest median family size of 3.02 persons per family. On the other hand, single male/father families (38 | 19.9%) represent the smallest median family size with 1.89 persons per family.
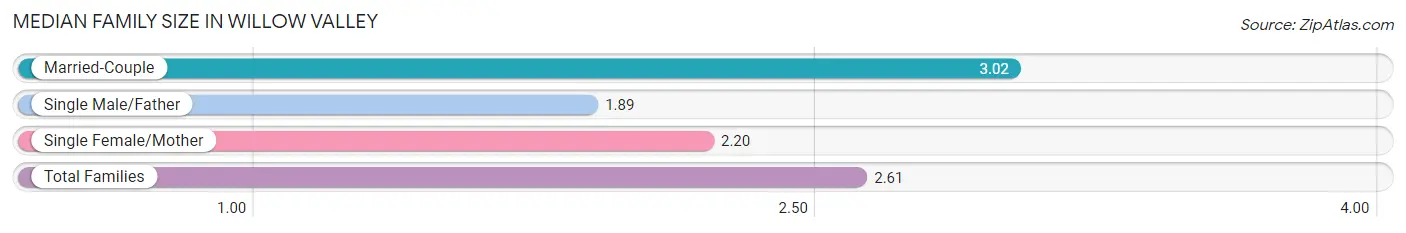
| Family Type | # Families | Family Size |
| Married-Couple | 109 (57.1%) | 3.02 |
| Single Male/Father | 38 (19.9%) | 1.89 |
| Single Female/Mother | 44 (23.0%) | 2.20 |
| Total Families | 191 (100.0%) | 2.61 |
Median Household Size in Willow Valley
The median household size in Willow Valley is 1.89 persons per household, with married-couple households (109 | 25.2%) accounting for the largest median household size of 3.02 persons per household. non-family households (242 | 55.9%) represent the smallest median household size with 1.33 persons per household.
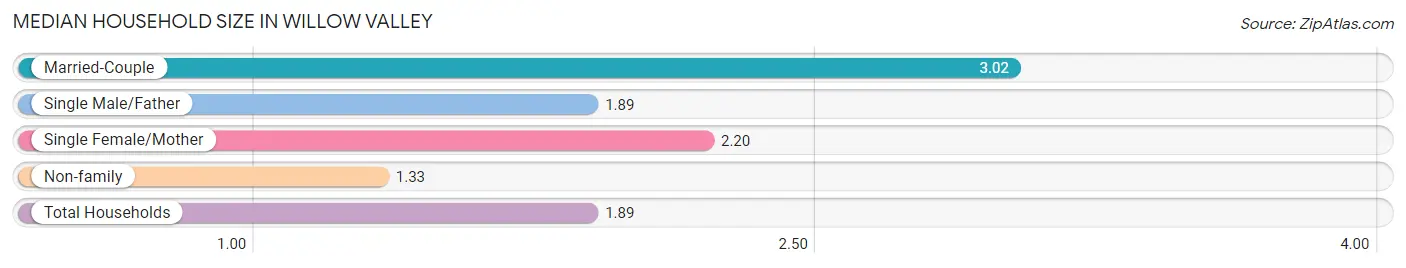
| Household Type | # Households | Household Size |
| Married-Couple | 109 (25.2%) | 3.02 |
| Single Male/Father | 38 (8.8%) | 1.89 |
| Single Female/Mother | 44 (10.2%) | 2.20 |
| Non-family | 242 (55.9%) | 1.33 |
| Total Households | 433 (100.0%) | 1.89 |
Household Size by Marriage Status in Willow Valley
Out of a total of 433 households in Willow Valley, 191 (44.1%) are family households, while 242 (55.9%) are nonfamily households. The most numerous type of family households are 2-person households, comprising 160, and the most common type of nonfamily households are 1-person households, comprising 166.
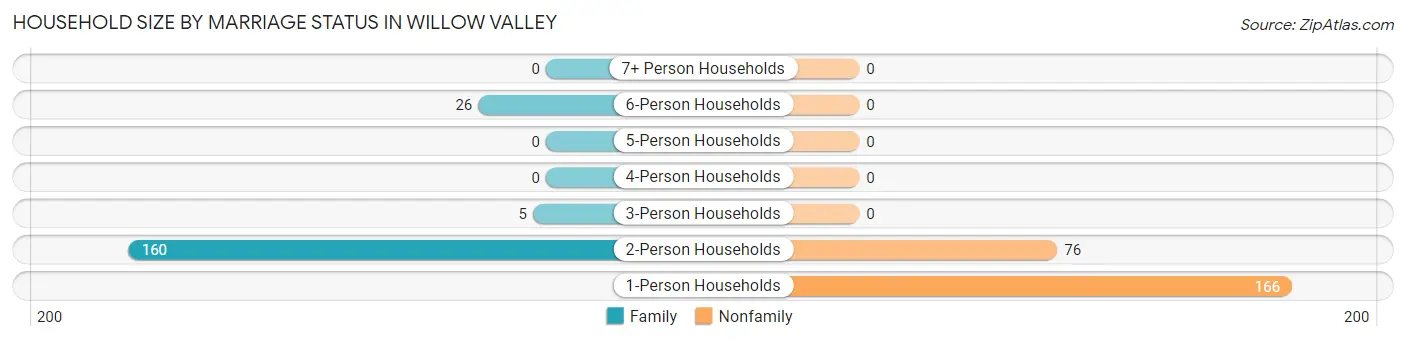
| Household Size | Family Households | Nonfamily Households |
| 1-Person Households | - | 166 (38.3%) |
| 2-Person Households | 160 (36.9%) | 76 (17.5%) |
| 3-Person Households | 5 (1.1%) | 0 (0.0%) |
| 4-Person Households | 0 (0.0%) | 0 (0.0%) |
| 5-Person Households | 0 (0.0%) | 0 (0.0%) |
| 6-Person Households | 26 (6.0%) | 0 (0.0%) |
| 7+ Person Households | 0 (0.0%) | 0 (0.0%) |
| Total | 191 (44.1%) | 242 (55.9%) |
Female Fertility in Willow Valley
Fertility by Age in Willow Valley
Average fertility rate in Willow Valley is 659.0 births per 1,000 women. Women in the age bracket of 35 to 50 years have the highest fertility rate with 659.0 births per 1,000 women. Women in the age bracket of 35 to 50 years acount for 100.0% of all women with births.
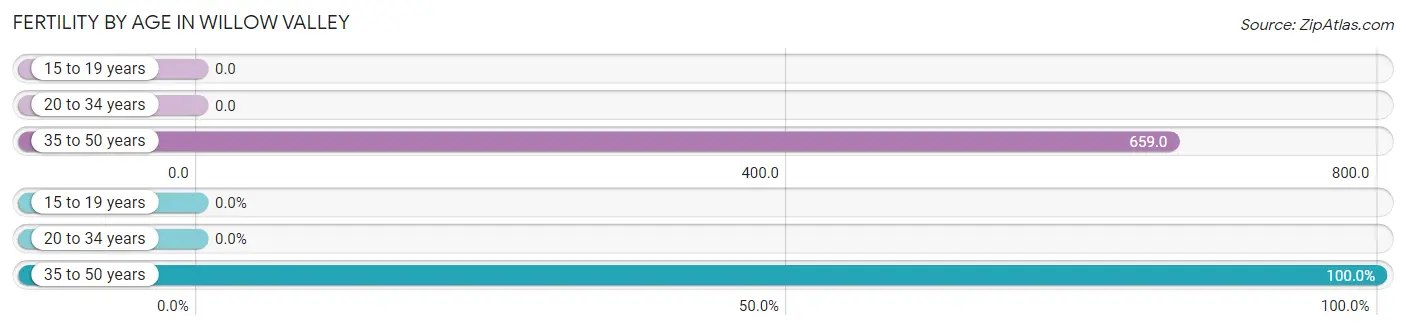
| Age Bracket | Women with Births | Births / 1,000 Women |
| 15 to 19 years | 0 (0.0%) | 0.0 |
| 20 to 34 years | 0 (0.0%) | 0.0 |
| 35 to 50 years | 27 (100.0%) | 659.0 |
| Total | 27 (100.0%) | 659.0 |
Fertility by Age by Marriage Status in Willow Valley
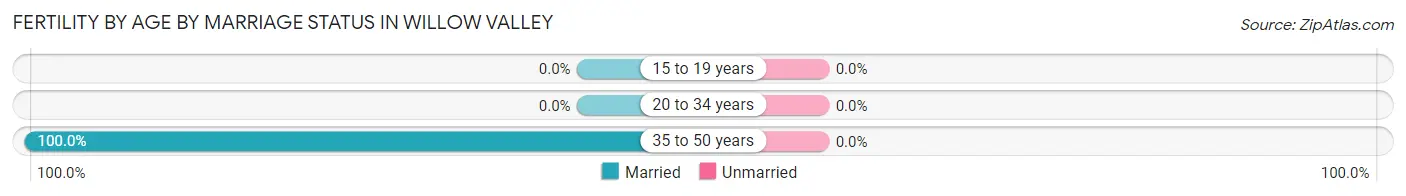
| Age Bracket | Married | Unmarried |
| 15 to 19 years | 0 (0.0%) | 0 (0.0%) |
| 20 to 34 years | 0 (0.0%) | 0 (0.0%) |
| 35 to 50 years | 27 (100.0%) | 0 (0.0%) |
| Total | 27 (100.0%) | 0 (0.0%) |
Fertility by Education in Willow Valley
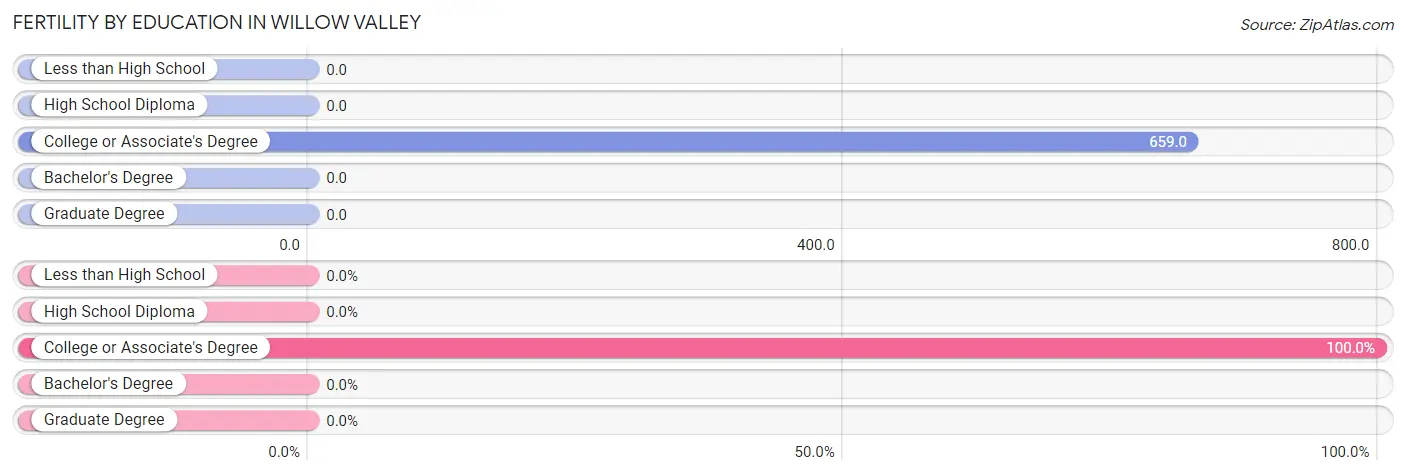
| Educational Attainment | Women with Births | Births / 1,000 Women |
| Less than High School | 0 (0.0%) | 0.0 |
| High School Diploma | 0 (0.0%) | 0.0 |
| College or Associate's Degree | 27 (100.0%) | 659.0 |
| Bachelor's Degree | 0 (0.0%) | 0.0 |
| Graduate Degree | 0 (0.0%) | 0.0 |
| Total | 27 (100.0%) | 659.0 |
Fertility by Education by Marriage Status in Willow Valley
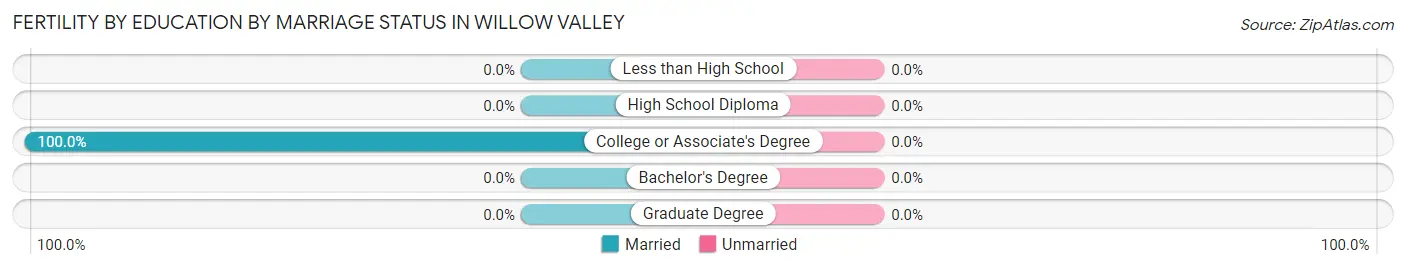
| Educational Attainment | Married | Unmarried |
| Less than High School | 0 (0.0%) | 0 (0.0%) |
| High School Diploma | 0 (0.0%) | 0 (0.0%) |
| College or Associate's Degree | 27 (100.0%) | 0 (0.0%) |
| Bachelor's Degree | 0 (0.0%) | 0 (0.0%) |
| Graduate Degree | 0 (0.0%) | 0 (0.0%) |
| Total | 27 (100.0%) | 0 (0.0%) |
Employment Characteristics in Willow Valley
Employment by Class of Employer in Willow Valley
Among the 110 employed individuals in Willow Valley, private company employees (72 | 65.4%), self-employed (not incorporated) (26 | 23.6%), and local government employees (12 | 10.9%) make up the most common classes of employment.
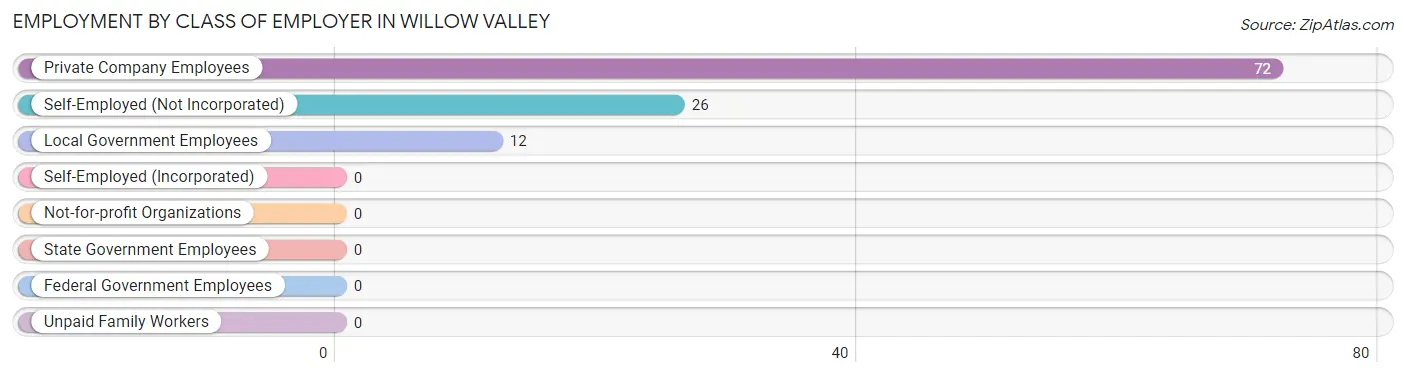
| Employer Class | # Employees | % Employees |
| Private Company Employees | 72 | 65.4% |
| Self-Employed (Incorporated) | 0 | 0.0% |
| Self-Employed (Not Incorporated) | 26 | 23.6% |
| Not-for-profit Organizations | 0 | 0.0% |
| Local Government Employees | 12 | 10.9% |
| State Government Employees | 0 | 0.0% |
| Federal Government Employees | 0 | 0.0% |
| Unpaid Family Workers | 0 | 0.0% |
| Total | 110 | 100.0% |
Employment Status by Age in Willow Valley
According to the labor force statistics for Willow Valley, out of the total population over 16 years of age (718), 24.8% or 178 individuals are in the labor force, with 13.5% or 24 of them unemployed. The age group with the highest labor force participation rate is 35 to 44 years, with 71.6% or 68 individuals in the labor force. Within the labor force, the 45 to 54 years age range has the highest percentage of unemployed individuals, with 44.0% or 11 of them being unemployed.
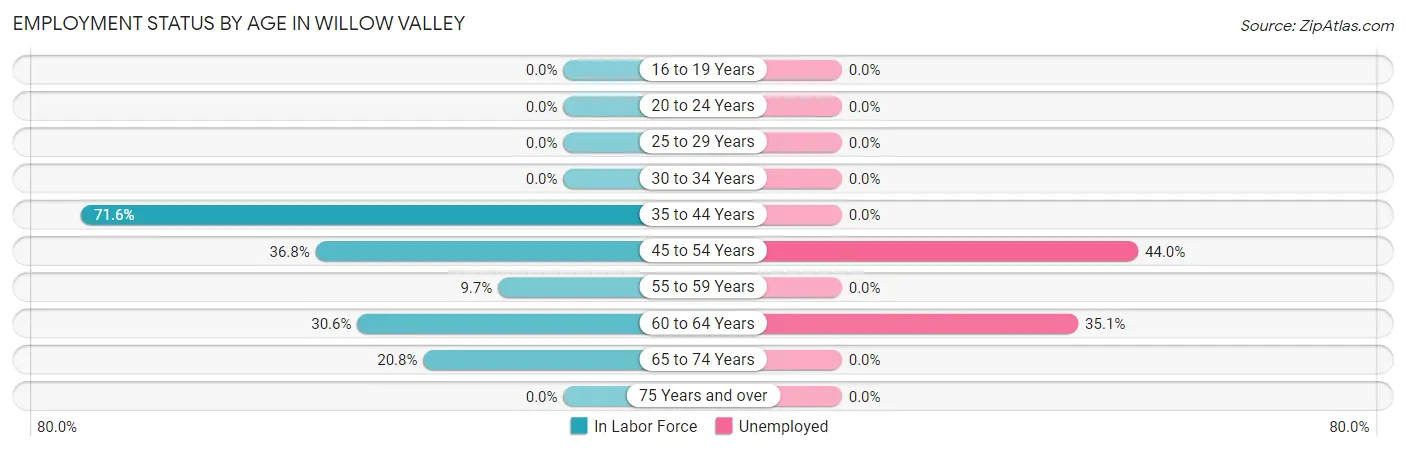
| Age Bracket | In Labor Force | Unemployed |
| 16 to 19 Years | 0 (0.0%) | 0 (0.0%) |
| 20 to 24 Years | 0 (0.0%) | 0 (0.0%) |
| 25 to 29 Years | 0 (0.0%) | 0 (0.0%) |
| 30 to 34 Years | 0 (0.0%) | 0 (0.0%) |
| 35 to 44 Years | 68 (71.6%) | 0 (0.0%) |
| 45 to 54 Years | 25 (36.8%) | 11 (44.0%) |
| 55 to 59 Years | 12 (9.7%) | 0 (0.0%) |
| 60 to 64 Years | 37 (30.6%) | 13 (35.1%) |
| 65 to 74 Years | 36 (20.8%) | 0 (0.0%) |
| 75 Years and over | 0 (0.0%) | 0 (0.0%) |
| Total | 178 (24.8%) | 24 (13.5%) |
Employment Status by Educational Attainment in Willow Valley
According to labor force statistics for Willow Valley, 31.8% of individuals (142) out of the total population between 25 and 64 years of age (447) are in the labor force, with 16.9% or 24 of them being unemployed. The group with the highest labor force participation rate are those with the educational attainment of bachelor's degree or higher, with 44.4% or 12 individuals in the labor force. Within the labor force, individuals with college / associate degree education have the highest percentage of unemployment, with 26.4% or 24 of them being unemployed.
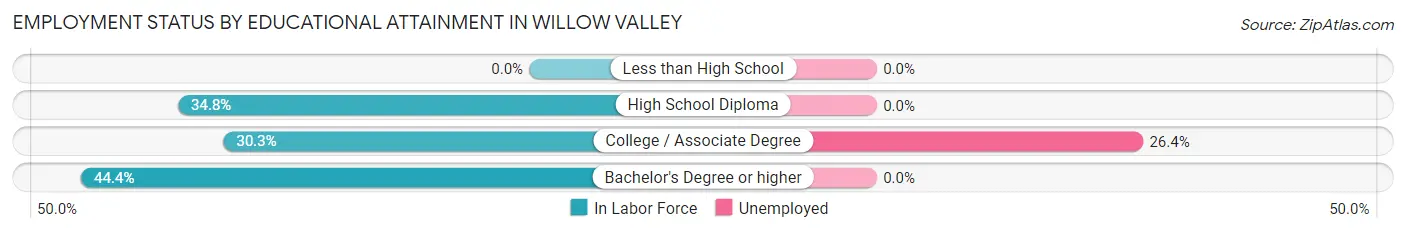
| Educational Attainment | In Labor Force | Unemployed |
| Less than High School | 0 (0.0%) | 0 (0.0%) |
| High School Diploma | 39 (34.8%) | 0 (0.0%) |
| College / Associate Degree | 91 (30.3%) | 79 (26.4%) |
| Bachelor's Degree or higher | 12 (44.4%) | 0 (0.0%) |
| Total | 142 (31.8%) | 76 (16.9%) |
Employment Occupations by Sex in Willow Valley
Management, Business, Science and Arts Occupations
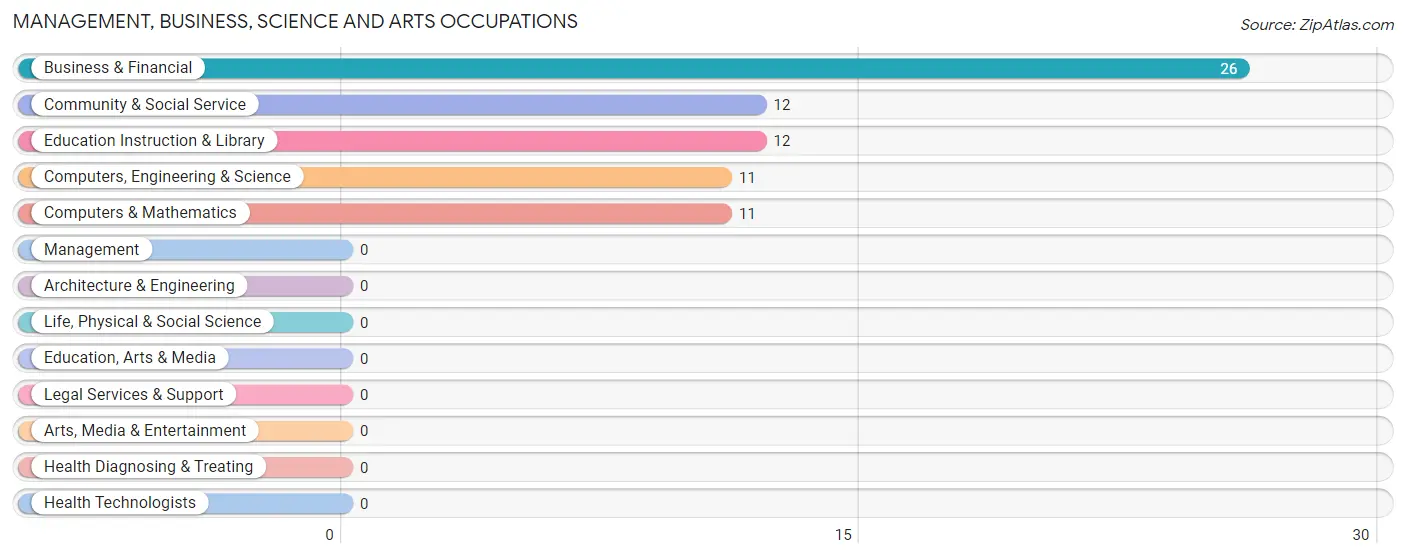
The most common Management, Business, Science and Arts occupations in Willow Valley are Business & Financial (26 | 16.9%), Community & Social Service (12 | 7.8%), Education Instruction & Library (12 | 7.8%), Computers, Engineering & Science (11 | 7.1%), and Computers & Mathematics (11 | 7.1%).
Management, Business, Science and Arts Occupations by Sex
Within the Management, Business, Science and Arts occupations in Willow Valley, the most male-oriented occupations are Business & Financial (100.0%), Computers, Engineering & Science (100.0%), and Computers & Mathematics (100.0%), while the most female-oriented occupations are Community & Social Service (100.0%), and Education Instruction & Library (100.0%).
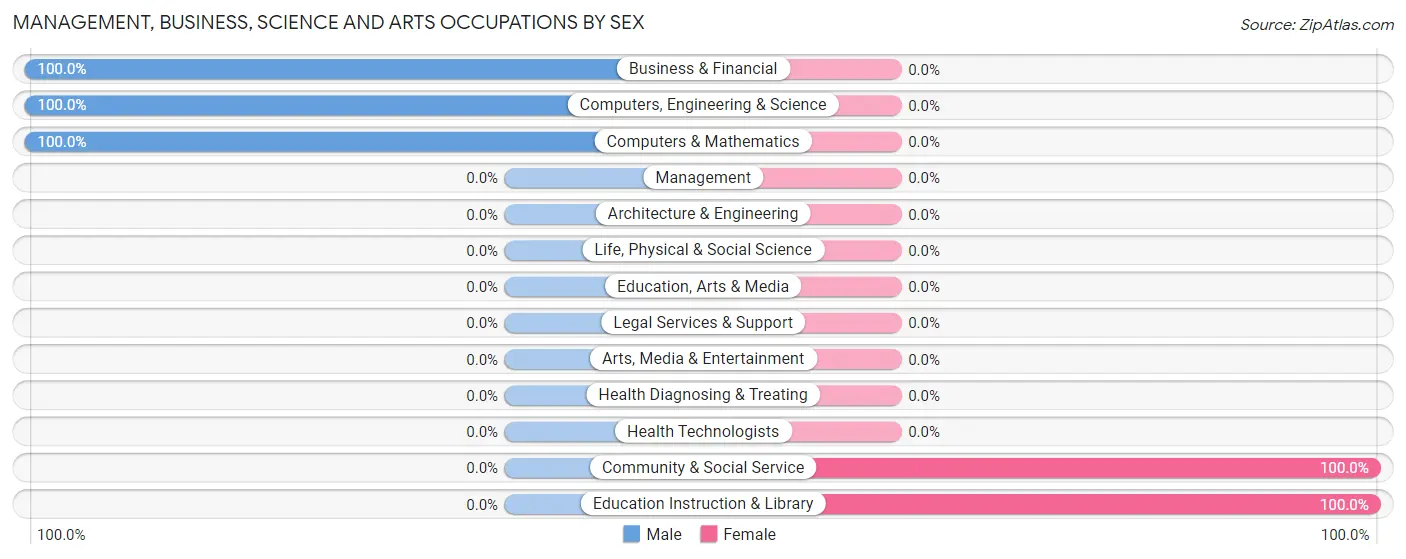
| Occupation | Male | Female |
| Management | 0 (0.0%) | 0 (0.0%) |
| Business & Financial | 26 (100.0%) | 0 (0.0%) |
| Computers, Engineering & Science | 11 (100.0%) | 0 (0.0%) |
| Computers & Mathematics | 11 (100.0%) | 0 (0.0%) |
| Architecture & Engineering | 0 (0.0%) | 0 (0.0%) |
| Life, Physical & Social Science | 0 (0.0%) | 0 (0.0%) |
| Community & Social Service | 0 (0.0%) | 12 (100.0%) |
| Education, Arts & Media | 0 (0.0%) | 0 (0.0%) |
| Legal Services & Support | 0 (0.0%) | 0 (0.0%) |
| Education Instruction & Library | 0 (0.0%) | 12 (100.0%) |
| Arts, Media & Entertainment | 0 (0.0%) | 0 (0.0%) |
| Health Diagnosing & Treating | 0 (0.0%) | 0 (0.0%) |
| Health Technologists | 0 (0.0%) | 0 (0.0%) |
| Total (Category) | 37 (75.5%) | 12 (24.5%) |
| Total (Overall) | 92 (59.7%) | 62 (40.3%) |
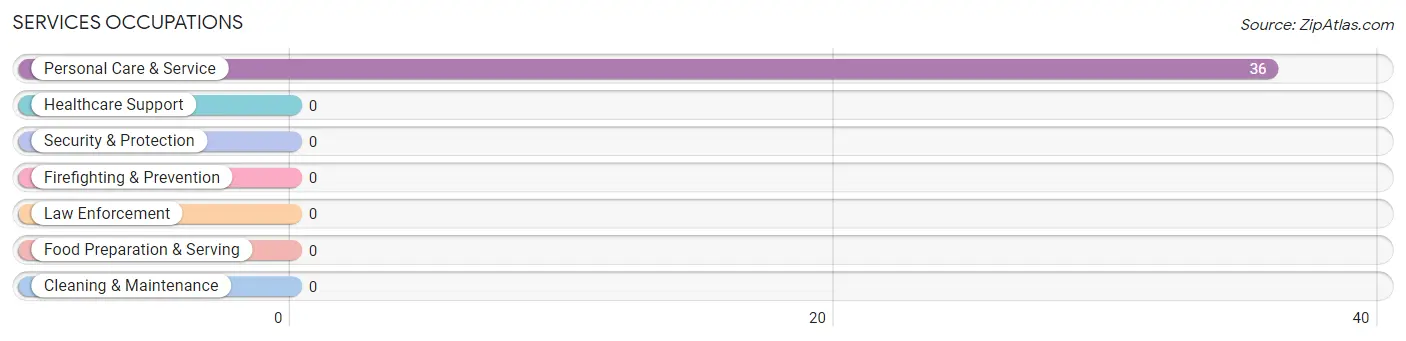
Services Occupations
The most common Services occupations in Willow Valley are , and Personal Care & Service (36 | 23.4%).
Services Occupations by Sex
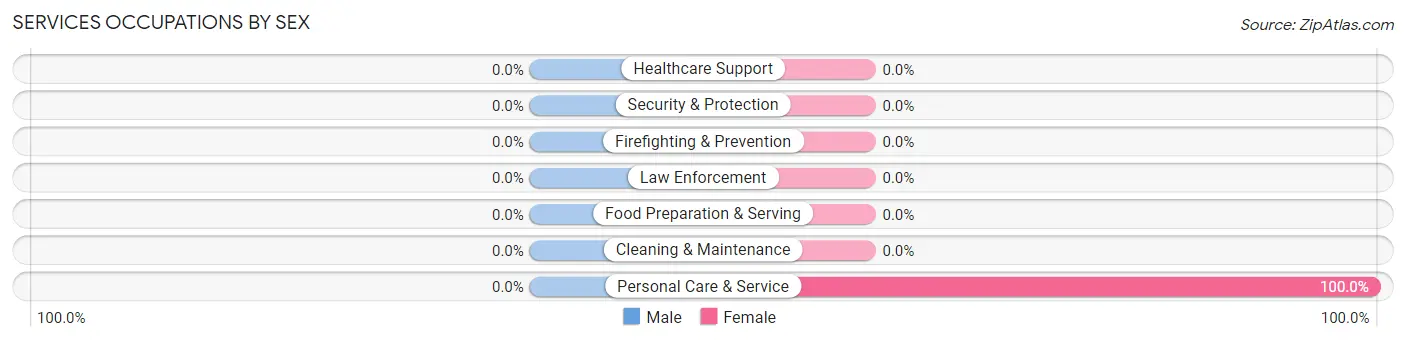
| Occupation | Male | Female |
| Healthcare Support | 0 (0.0%) | 0 (0.0%) |
| Security & Protection | 0 (0.0%) | 0 (0.0%) |
| Firefighting & Prevention | 0 (0.0%) | 0 (0.0%) |
| Law Enforcement | 0 (0.0%) | 0 (0.0%) |
| Food Preparation & Serving | 0 (0.0%) | 0 (0.0%) |
| Cleaning & Maintenance | 0 (0.0%) | 0 (0.0%) |
| Personal Care & Service | 0 (0.0%) | 36 (100.0%) |
| Total (Category) | 0 (0.0%) | 36 (100.0%) |
| Total (Overall) | 92 (59.7%) | 62 (40.3%) |
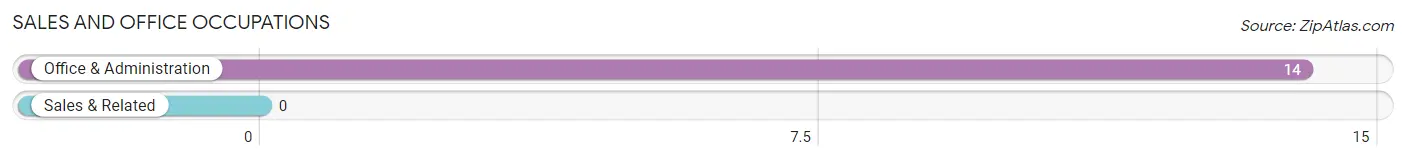
Sales and Office Occupations
The most common Sales and Office occupations in Willow Valley are , and Office & Administration (14 | 9.1%).
Sales and Office Occupations by Sex
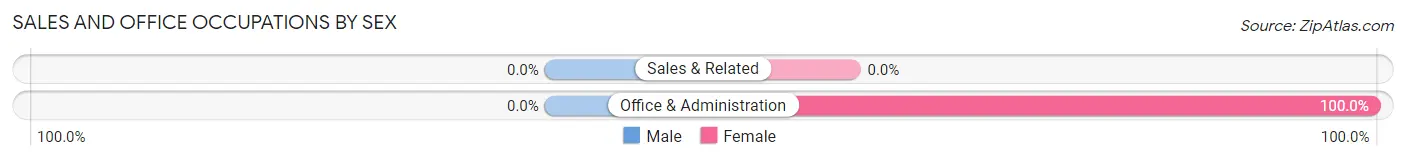
| Occupation | Male | Female |
| Sales & Related | 0 (0.0%) | 0 (0.0%) |
| Office & Administration | 0 (0.0%) | 14 (100.0%) |
| Total (Category) | 0 (0.0%) | 14 (100.0%) |
| Total (Overall) | 92 (59.7%) | 62 (40.3%) |
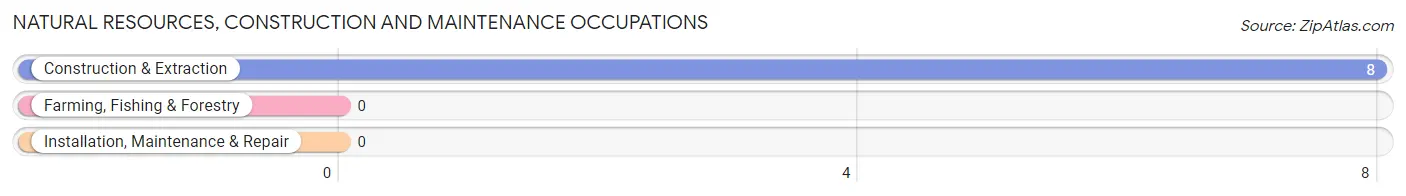
Natural Resources, Construction and Maintenance Occupations
The most common Natural Resources, Construction and Maintenance occupations in Willow Valley are , and Construction & Extraction (8 | 5.2%).
Natural Resources, Construction and Maintenance Occupations by Sex
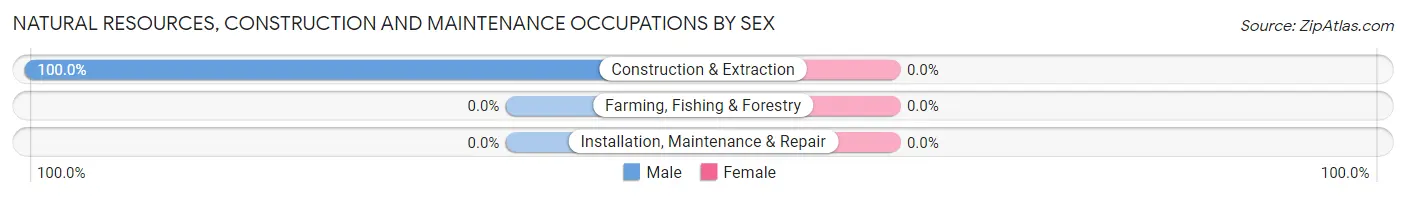
| Occupation | Male | Female |
| Farming, Fishing & Forestry | 0 (0.0%) | 0 (0.0%) |
| Construction & Extraction | 8 (100.0%) | 0 (0.0%) |
| Installation, Maintenance & Repair | 0 (0.0%) | 0 (0.0%) |
| Total (Category) | 8 (100.0%) | 0 (0.0%) |
| Total (Overall) | 92 (59.7%) | 62 (40.3%) |
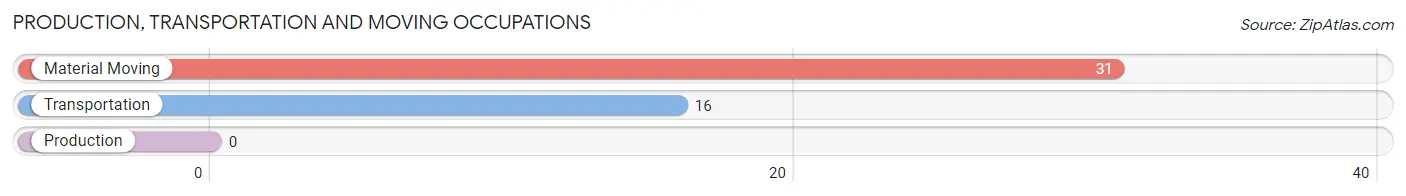
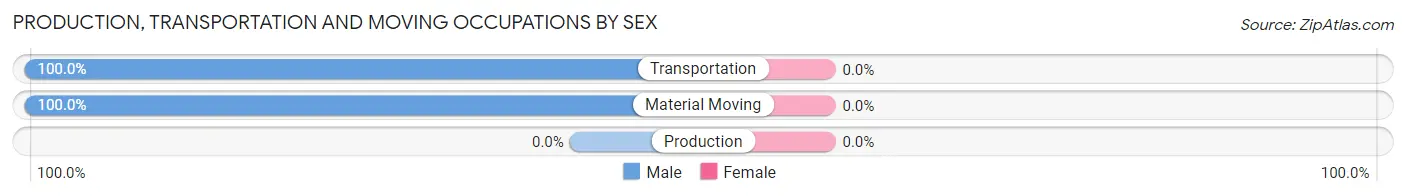
Production, Transportation and Moving Occupations
The most common Production, Transportation and Moving occupations in Willow Valley are Material Moving (31 | 20.1%), and Transportation (16 | 10.4%).
Production, Transportation and Moving Occupations by Sex
| Occupation | Male | Female |
| Production | 0 (0.0%) | 0 (0.0%) |
| Transportation | 16 (100.0%) | 0 (0.0%) |
| Material Moving | 31 (100.0%) | 0 (0.0%) |
| Total (Category) | 47 (100.0%) | 0 (0.0%) |
| Total (Overall) | 92 (59.7%) | 62 (40.3%) |
Employment Industries by Sex in Willow Valley
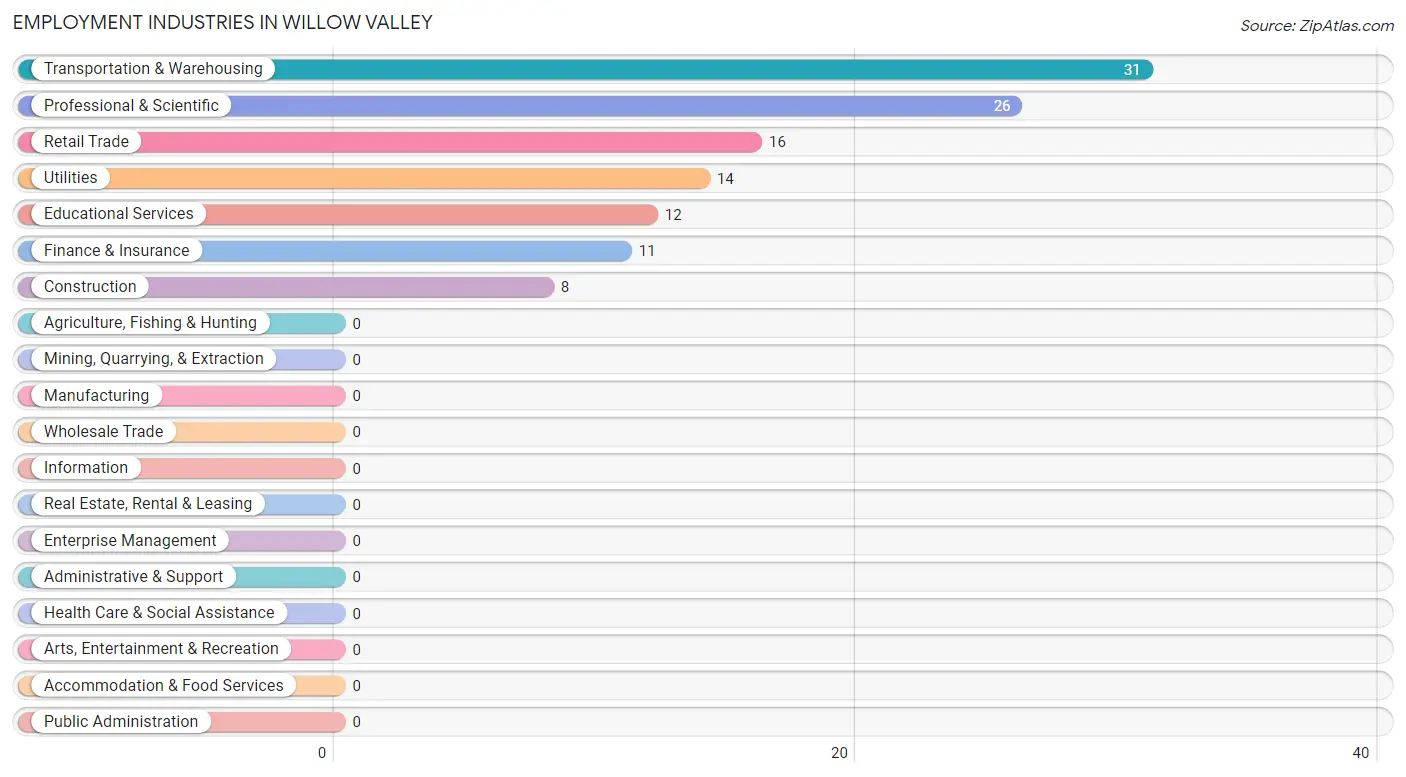
Employment Industries in Willow Valley
The major employment industries in Willow Valley include Transportation & Warehousing (31 | 20.1%), Professional & Scientific (26 | 16.9%), Retail Trade (16 | 10.4%), Utilities (14 | 9.1%), and Educational Services (12 | 7.8%).
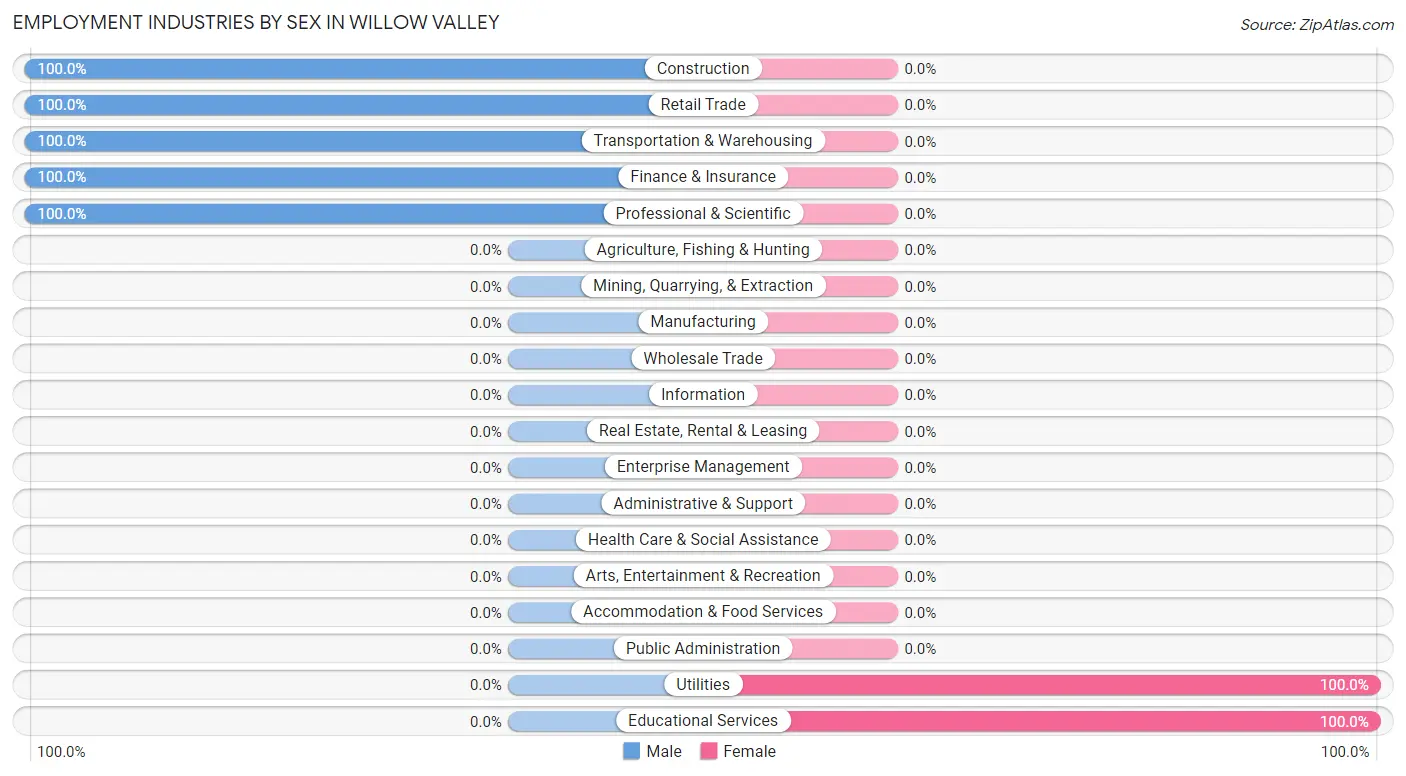
Employment Industries by Sex in Willow Valley
The Willow Valley industries that see more men than women are Construction (100.0%), Retail Trade (100.0%), and Transportation & Warehousing (100.0%), whereas the industries that tend to have a higher number of women are Utilities (100.0%), and Educational Services (100.0%).
| Industry | Male | Female |
| Agriculture, Fishing & Hunting | 0 (0.0%) | 0 (0.0%) |
| Mining, Quarrying, & Extraction | 0 (0.0%) | 0 (0.0%) |
| Construction | 8 (100.0%) | 0 (0.0%) |
| Manufacturing | 0 (0.0%) | 0 (0.0%) |
| Wholesale Trade | 0 (0.0%) | 0 (0.0%) |
| Retail Trade | 16 (100.0%) | 0 (0.0%) |
| Transportation & Warehousing | 31 (100.0%) | 0 (0.0%) |
| Utilities | 0 (0.0%) | 14 (100.0%) |
| Information | 0 (0.0%) | 0 (0.0%) |
| Finance & Insurance | 11 (100.0%) | 0 (0.0%) |
| Real Estate, Rental & Leasing | 0 (0.0%) | 0 (0.0%) |
| Professional & Scientific | 26 (100.0%) | 0 (0.0%) |
| Enterprise Management | 0 (0.0%) | 0 (0.0%) |
| Administrative & Support | 0 (0.0%) | 0 (0.0%) |
| Educational Services | 0 (0.0%) | 12 (100.0%) |
| Health Care & Social Assistance | 0 (0.0%) | 0 (0.0%) |
| Arts, Entertainment & Recreation | 0 (0.0%) | 0 (0.0%) |
| Accommodation & Food Services | 0 (0.0%) | 0 (0.0%) |
| Public Administration | 0 (0.0%) | 0 (0.0%) |
| Total | 92 (59.7%) | 62 (40.3%) |
Education in Willow Valley
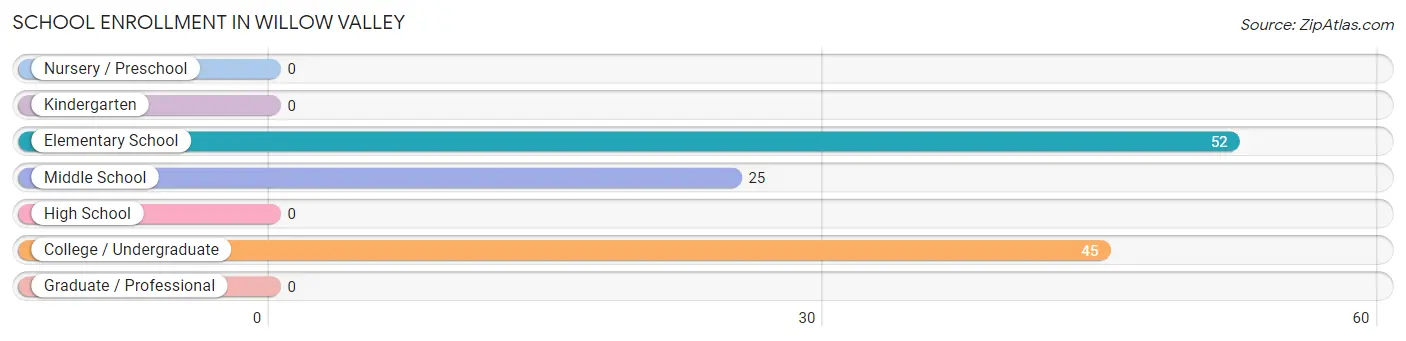
School Enrollment in Willow Valley
The most common levels of schooling among the 122 students in Willow Valley are elementary school (52 | 42.6%), college / undergraduate (45 | 36.9%), and middle school (25 | 20.5%).
| School Level | # Students | % Students |
| Nursery / Preschool | 0 | 0.0% |
| Kindergarten | 0 | 0.0% |
| Elementary School | 52 | 42.6% |
| Middle School | 25 | 20.5% |
| High School | 0 | 0.0% |
| College / Undergraduate | 45 | 36.9% |
| Graduate / Professional | 0 | 0.0% |
| Total | 122 | 100.0% |
School Enrollment by Age by Funding Source in Willow Valley
Out of a total of 122 students who are enrolled in schools in Willow Valley, 45 (36.9%) attend a private institution, while the remaining 77 (63.1%) are enrolled in public schools. The age group of 5 to 9 year old has the highest likelihood of being enrolled in private schools, with 27 (51.9% in the age bracket) enrolled. Conversely, the age group of 10 to 14 year olds has the lowest likelihood of being enrolled in a private school, with 25 (100.0% in the age bracket) attending a public institution.
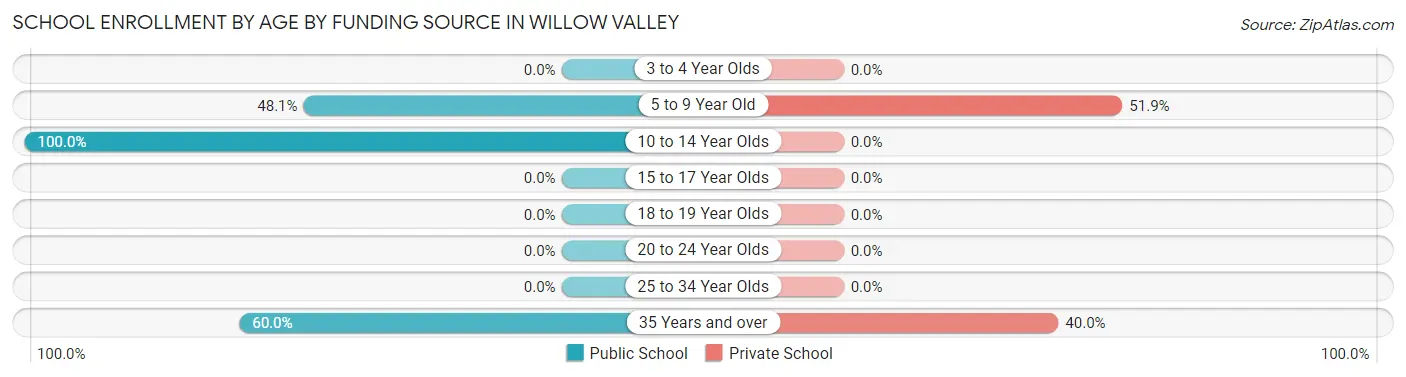
| Age Bracket | Public School | Private School |
| 3 to 4 Year Olds | 0 (0.0%) | 0 (0.0%) |
| 5 to 9 Year Old | 25 (48.1%) | 27 (51.9%) |
| 10 to 14 Year Olds | 25 (100.0%) | 0 (0.0%) |
| 15 to 17 Year Olds | 0 (0.0%) | 0 (0.0%) |
| 18 to 19 Year Olds | 0 (0.0%) | 0 (0.0%) |
| 20 to 24 Year Olds | 0 (0.0%) | 0 (0.0%) |
| 25 to 34 Year Olds | 0 (0.0%) | 0 (0.0%) |
| 35 Years and over | 27 (60.0%) | 18 (40.0%) |
| Total | 77 (63.1%) | 45 (36.9%) |
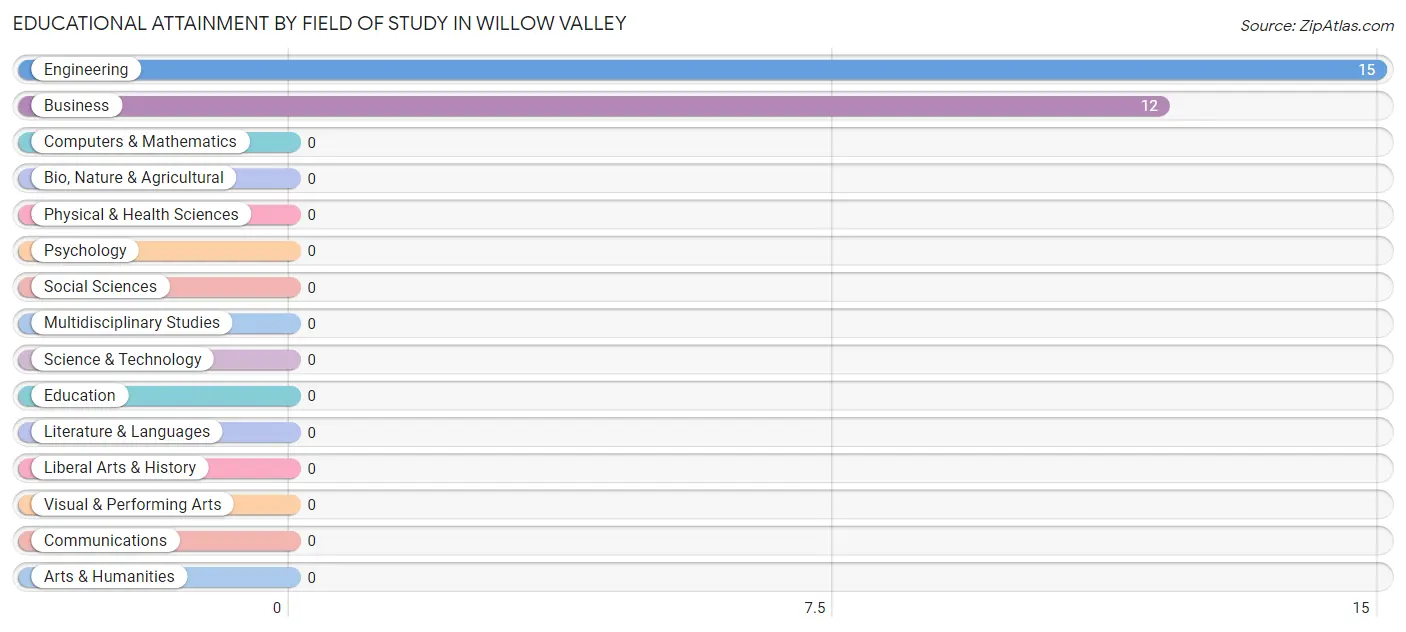
Educational Attainment by Field of Study in Willow Valley
Engineering (15 | 55.6%), and business (12 | 44.4%) are the most common fields of study among 27 individuals in Willow Valley who have obtained a bachelor's degree or higher.
| Field of Study | # Graduates | % Graduates |
| Computers & Mathematics | 0 | 0.0% |
| Bio, Nature & Agricultural | 0 | 0.0% |
| Physical & Health Sciences | 0 | 0.0% |
| Psychology | 0 | 0.0% |
| Social Sciences | 0 | 0.0% |
| Engineering | 15 | 55.6% |
| Multidisciplinary Studies | 0 | 0.0% |
| Science & Technology | 0 | 0.0% |
| Business | 12 | 44.4% |
| Education | 0 | 0.0% |
| Literature & Languages | 0 | 0.0% |
| Liberal Arts & History | 0 | 0.0% |
| Visual & Performing Arts | 0 | 0.0% |
| Communications | 0 | 0.0% |
| Arts & Humanities | 0 | 0.0% |
| Total | 27 | 100.0% |
Transportation & Commute in Willow Valley
Vehicle Availability by Sex in Willow Valley
The most prevalent vehicle ownership categories in Willow Valley are males with 1 vehicle (42, accounting for 50.0%) and females with 1 vehicle (0, making up 161.5%).
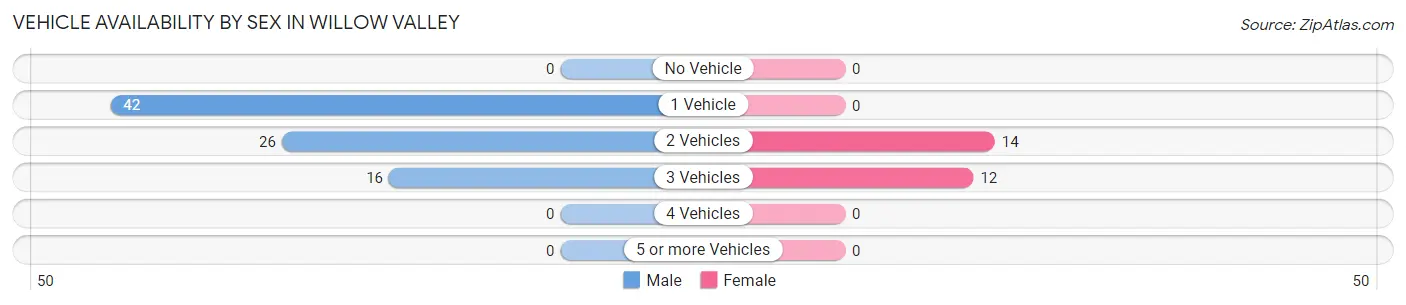
| Vehicles Available | Male | Female |
| No Vehicle | 0 (0.0%) | 0 (0.0%) |
| 1 Vehicle | 42 (50.0%) | 0 (0.0%) |
| 2 Vehicles | 26 (30.9%) | 14 (53.8%) |
| 3 Vehicles | 16 (19.1%) | 12 (46.2%) |
| 4 Vehicles | 0 (0.0%) | 0 (0.0%) |
| 5 or more Vehicles | 0 (0.0%) | 0 (0.0%) |
| Total | 84 (100.0%) | 26 (100.0%) |
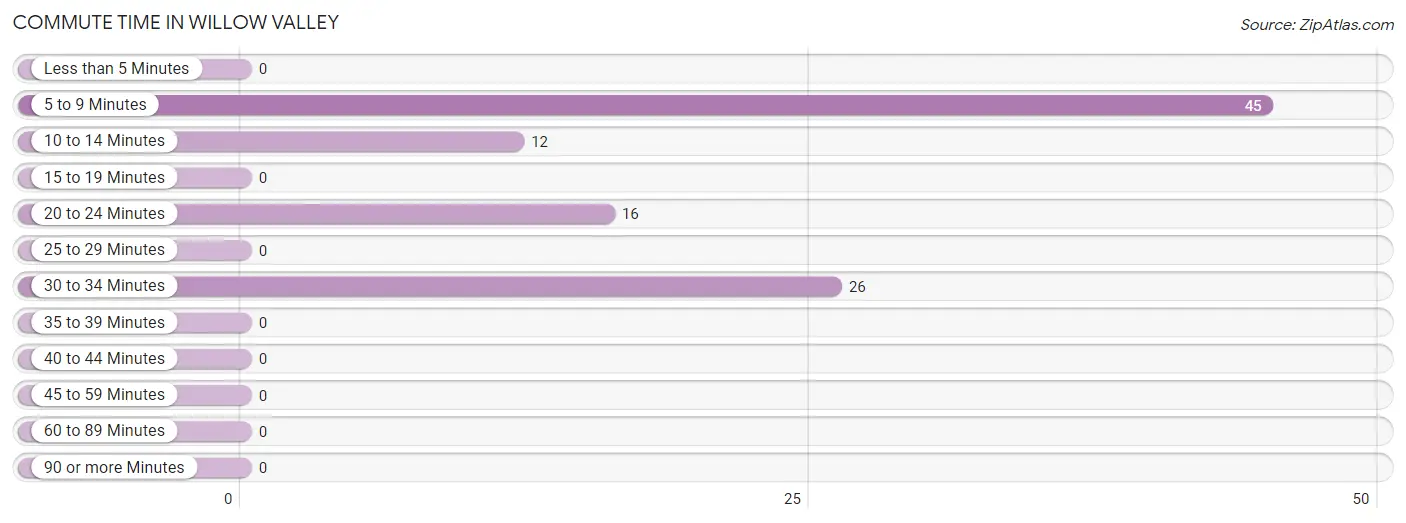
Commute Time in Willow Valley
The most frequently occuring commute durations in Willow Valley are 5 to 9 minutes (45 commuters, 45.5%), 30 to 34 minutes (26 commuters, 26.3%), and 20 to 24 minutes (16 commuters, 16.2%).
| Commute Time | # Commuters | % Commuters |
| Less than 5 Minutes | 0 | 0.0% |
| 5 to 9 Minutes | 45 | 45.5% |
| 10 to 14 Minutes | 12 | 12.1% |
| 15 to 19 Minutes | 0 | 0.0% |
| 20 to 24 Minutes | 16 | 16.2% |
| 25 to 29 Minutes | 0 | 0.0% |
| 30 to 34 Minutes | 26 | 26.3% |
| 35 to 39 Minutes | 0 | 0.0% |
| 40 to 44 Minutes | 0 | 0.0% |
| 45 to 59 Minutes | 0 | 0.0% |
| 60 to 89 Minutes | 0 | 0.0% |
| 90 or more Minutes | 0 | 0.0% |
Commute Time by Sex in Willow Valley
The most common commute times in Willow Valley are 5 to 9 minutes (31 commuters, 42.5%) for males and 5 to 9 minutes (14 commuters, 53.8%) for females.
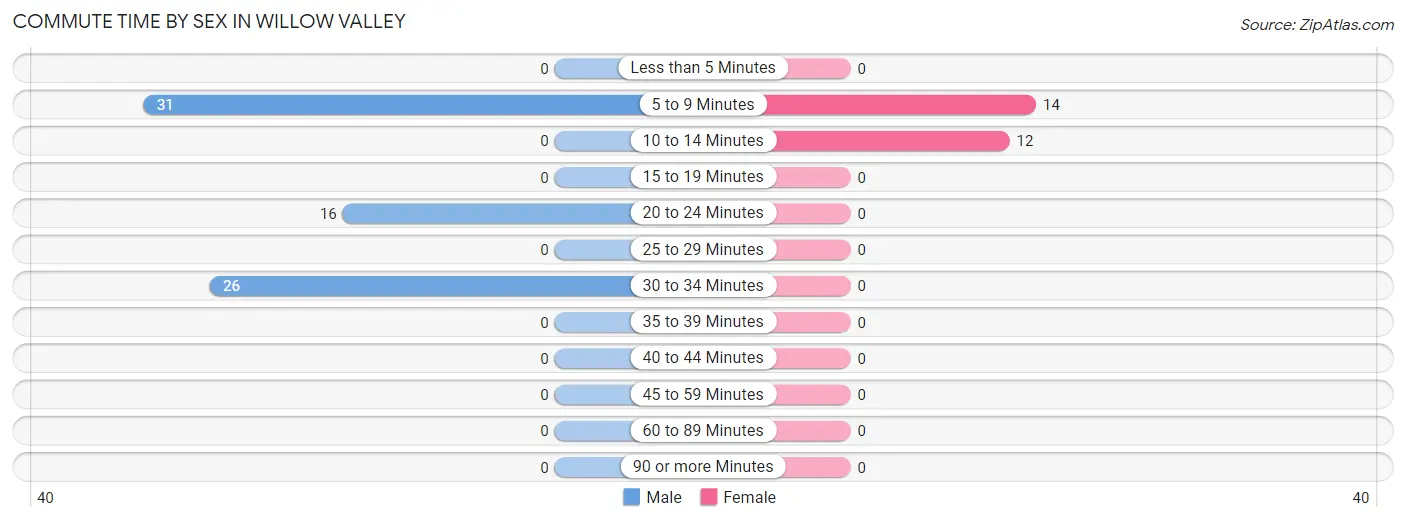
| Commute Time | Male | Female |
| Less than 5 Minutes | 0 (0.0%) | 0 (0.0%) |
| 5 to 9 Minutes | 31 (42.5%) | 14 (53.8%) |
| 10 to 14 Minutes | 0 (0.0%) | 12 (46.2%) |
| 15 to 19 Minutes | 0 (0.0%) | 0 (0.0%) |
| 20 to 24 Minutes | 16 (21.9%) | 0 (0.0%) |
| 25 to 29 Minutes | 0 (0.0%) | 0 (0.0%) |
| 30 to 34 Minutes | 26 (35.6%) | 0 (0.0%) |
| 35 to 39 Minutes | 0 (0.0%) | 0 (0.0%) |
| 40 to 44 Minutes | 0 (0.0%) | 0 (0.0%) |
| 45 to 59 Minutes | 0 (0.0%) | 0 (0.0%) |
| 60 to 89 Minutes | 0 (0.0%) | 0 (0.0%) |
| 90 or more Minutes | 0 (0.0%) | 0 (0.0%) |
Time of Departure to Work by Sex in Willow Valley
The most frequent times of departure to work in Willow Valley are 6:30 AM to 6:59 AM (31, 42.5%) for males and 6:30 AM to 6:59 AM (14, 53.8%) for females.
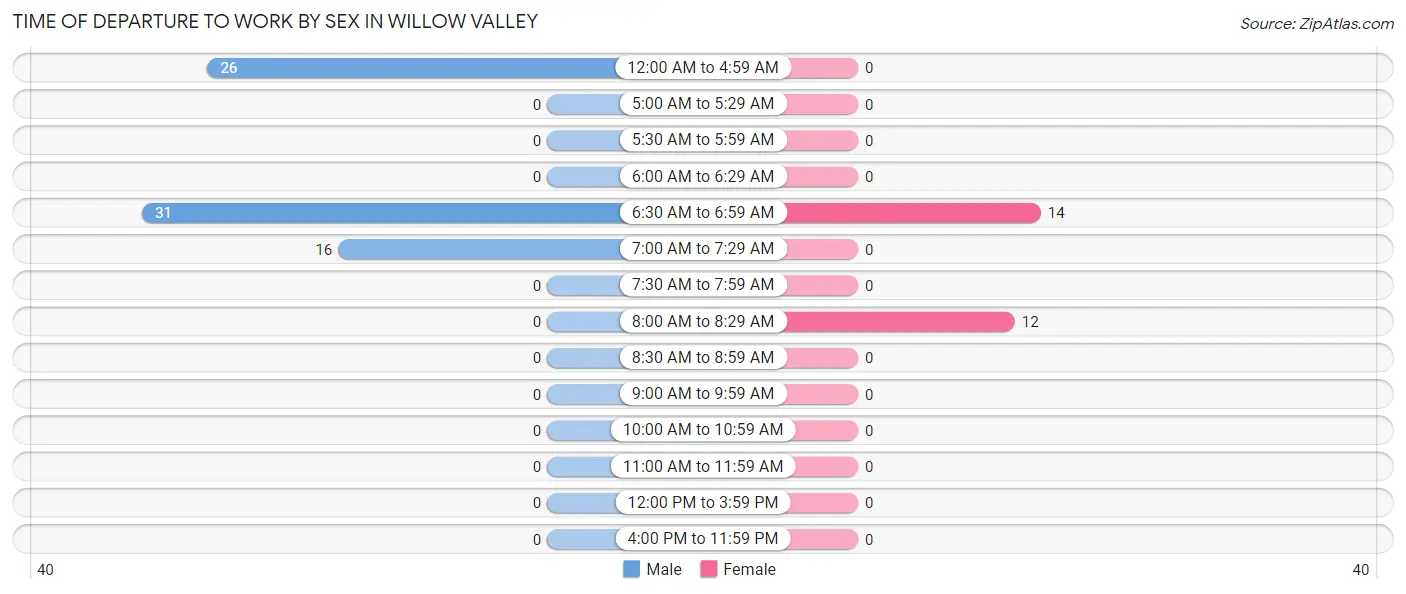
| Time of Departure | Male | Female |
| 12:00 AM to 4:59 AM | 26 (35.6%) | 0 (0.0%) |
| 5:00 AM to 5:29 AM | 0 (0.0%) | 0 (0.0%) |
| 5:30 AM to 5:59 AM | 0 (0.0%) | 0 (0.0%) |
| 6:00 AM to 6:29 AM | 0 (0.0%) | 0 (0.0%) |
| 6:30 AM to 6:59 AM | 31 (42.5%) | 14 (53.8%) |
| 7:00 AM to 7:29 AM | 16 (21.9%) | 0 (0.0%) |
| 7:30 AM to 7:59 AM | 0 (0.0%) | 0 (0.0%) |
| 8:00 AM to 8:29 AM | 0 (0.0%) | 12 (46.2%) |
| 8:30 AM to 8:59 AM | 0 (0.0%) | 0 (0.0%) |
| 9:00 AM to 9:59 AM | 0 (0.0%) | 0 (0.0%) |
| 10:00 AM to 10:59 AM | 0 (0.0%) | 0 (0.0%) |
| 11:00 AM to 11:59 AM | 0 (0.0%) | 0 (0.0%) |
| 12:00 PM to 3:59 PM | 0 (0.0%) | 0 (0.0%) |
| 4:00 PM to 11:59 PM | 0 (0.0%) | 0 (0.0%) |
| Total | 73 (100.0%) | 26 (100.0%) |
Housing Occupancy in Willow Valley
Occupancy by Ownership in Willow Valley
Of the total 433 dwellings in Willow Valley, owner-occupied units account for 327 (75.5%), while renter-occupied units make up 106 (24.5%).
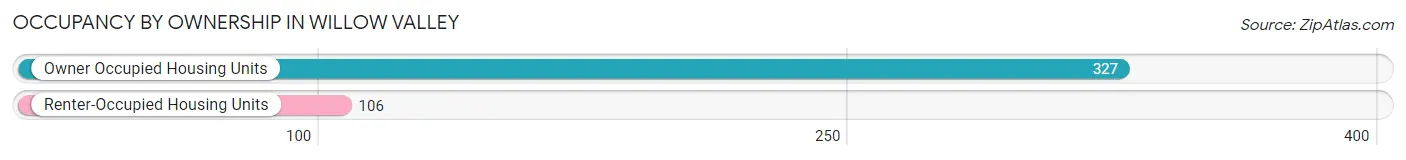
| Occupancy | # Housing Units | % Housing Units |
| Owner Occupied Housing Units | 327 | 75.5% |
| Renter-Occupied Housing Units | 106 | 24.5% |
| Total Occupied Housing Units | 433 | 100.0% |
Occupancy by Household Size in Willow Valley
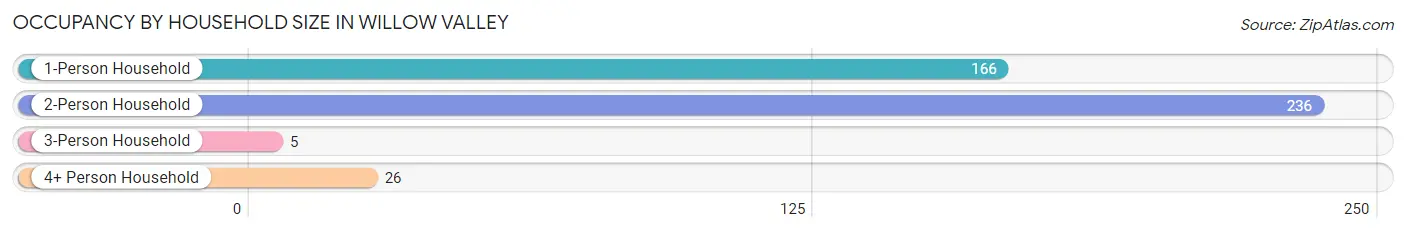
| Household Size | # Housing Units | % Housing Units |
| 1-Person Household | 166 | 38.3% |
| 2-Person Household | 236 | 54.5% |
| 3-Person Household | 5 | 1.1% |
| 4+ Person Household | 26 | 6.0% |
| Total Housing Units | 433 | 100.0% |
Occupancy by Ownership by Household Size in Willow Valley
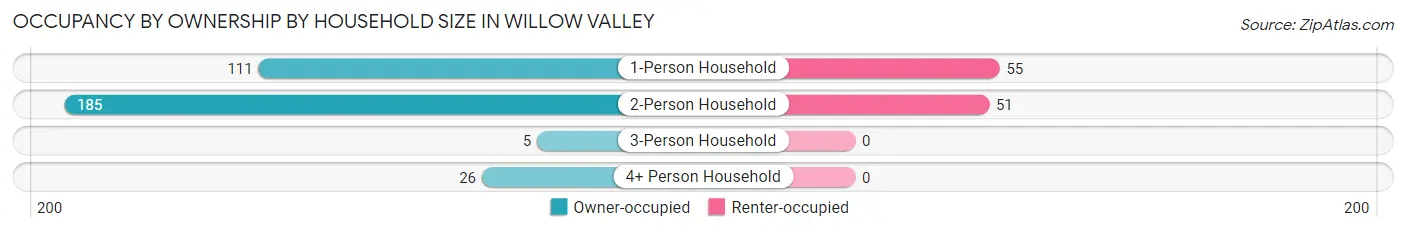
| Household Size | Owner-occupied | Renter-occupied |
| 1-Person Household | 111 (66.9%) | 55 (33.1%) |
| 2-Person Household | 185 (78.4%) | 51 (21.6%) |
| 3-Person Household | 5 (100.0%) | 0 (0.0%) |
| 4+ Person Household | 26 (100.0%) | 0 (0.0%) |
| Total Housing Units | 327 (75.5%) | 106 (24.5%) |
Occupancy by Educational Attainment in Willow Valley
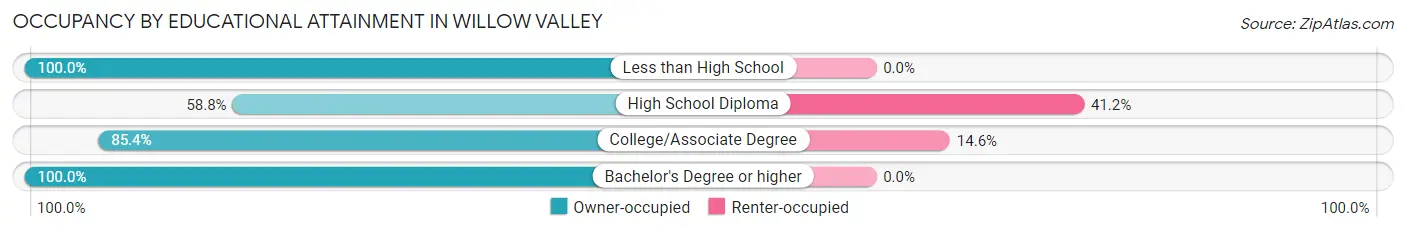
| Household Size | Owner-occupied | Renter-occupied |
| Less than High School | 24 (100.0%) | 0 (0.0%) |
| High School Diploma | 107 (58.8%) | 75 (41.2%) |
| College/Associate Degree | 181 (85.4%) | 31 (14.6%) |
| Bachelor's Degree or higher | 15 (100.0%) | 0 (0.0%) |
Occupancy by Age of Householder in Willow Valley
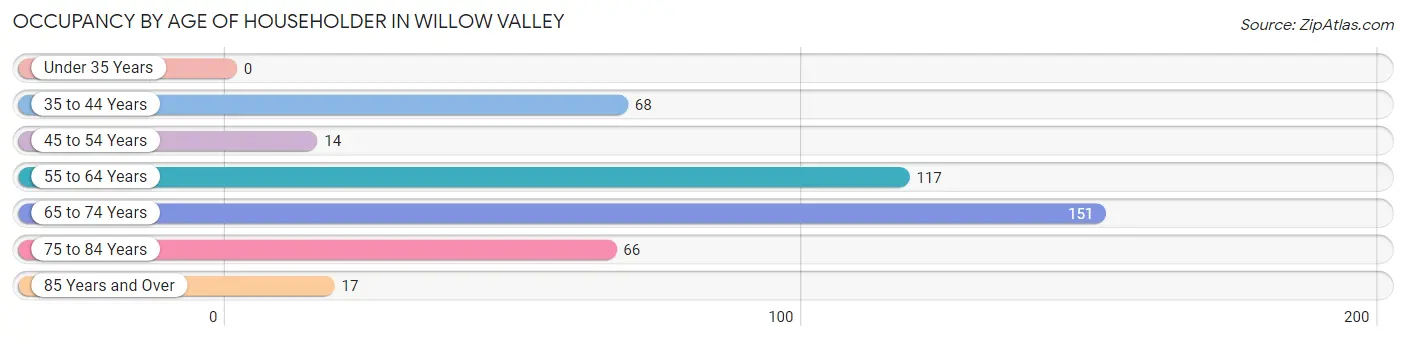
| Age Bracket | # Households | % Households |
| Under 35 Years | 0 | 0.0% |
| 35 to 44 Years | 68 | 15.7% |
| 45 to 54 Years | 14 | 3.2% |
| 55 to 64 Years | 117 | 27.0% |
| 65 to 74 Years | 151 | 34.9% |
| 75 to 84 Years | 66 | 15.2% |
| 85 Years and Over | 17 | 3.9% |
| Total | 433 | 100.0% |
Housing Finances in Willow Valley
Median Income by Occupancy in Willow Valley
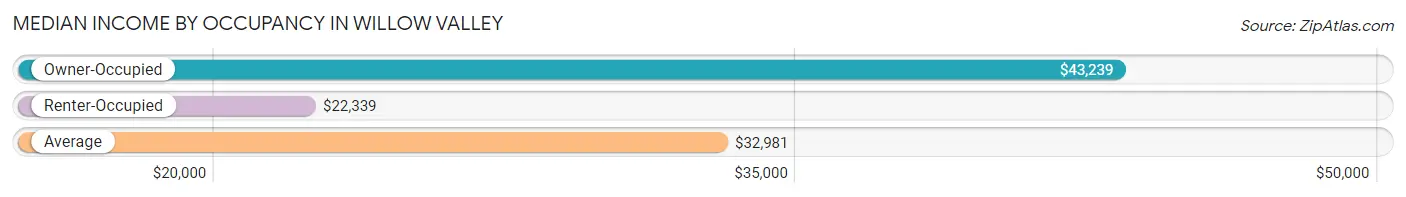
| Occupancy Type | # Households | Median Income |
| Owner-Occupied | 327 (75.5%) | $43,239 |
| Renter-Occupied | 106 (24.5%) | $22,339 |
| Average | 433 (100.0%) | $32,981 |
Occupancy by Householder Income Bracket in Willow Valley
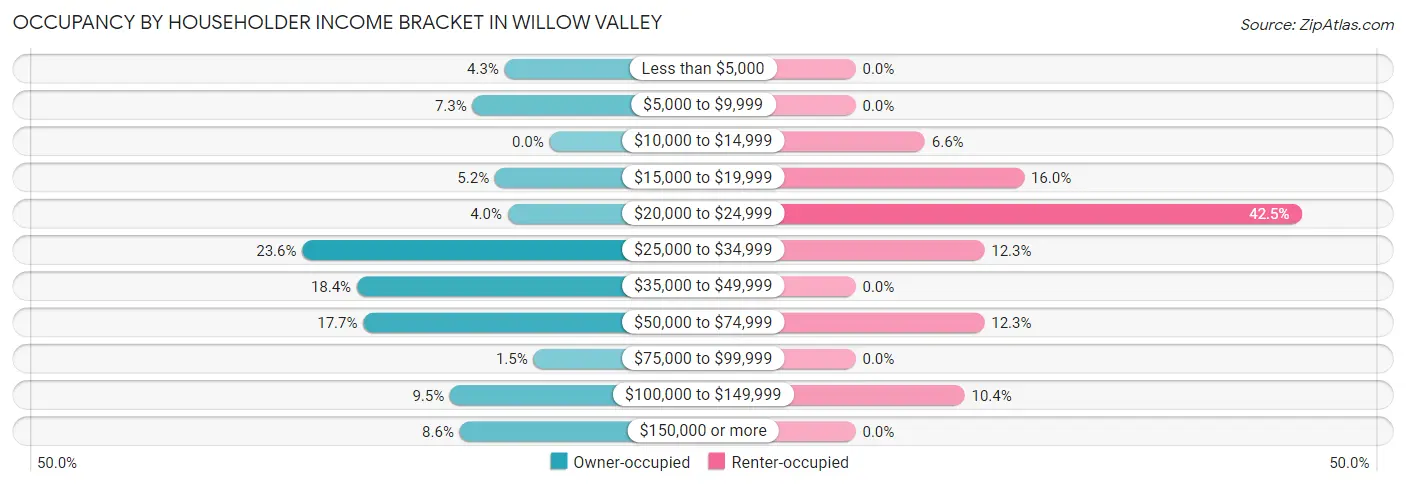
| Income Bracket | Owner-occupied | Renter-occupied |
| Less than $5,000 | 14 (4.3%) | 0 (0.0%) |
| $5,000 to $9,999 | 24 (7.3%) | 0 (0.0%) |
| $10,000 to $14,999 | 0 (0.0%) | 7 (6.6%) |
| $15,000 to $19,999 | 17 (5.2%) | 17 (16.0%) |
| $20,000 to $24,999 | 13 (4.0%) | 45 (42.4%) |
| $25,000 to $34,999 | 77 (23.5%) | 13 (12.3%) |
| $35,000 to $49,999 | 60 (18.3%) | 0 (0.0%) |
| $50,000 to $74,999 | 58 (17.7%) | 13 (12.3%) |
| $75,000 to $99,999 | 5 (1.5%) | 0 (0.0%) |
| $100,000 to $149,999 | 31 (9.5%) | 11 (10.4%) |
| $150,000 or more | 28 (8.6%) | 0 (0.0%) |
| Total | 327 (100.0%) | 106 (100.0%) |
Monthly Housing Cost Tiers in Willow Valley
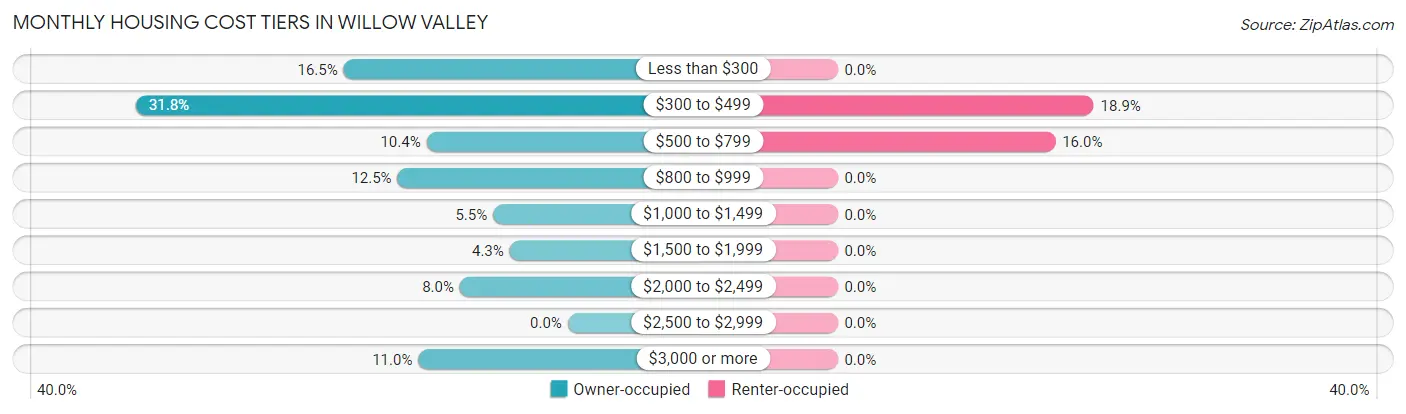
| Monthly Cost | Owner-occupied | Renter-occupied |
| Less than $300 | 54 (16.5%) | 0 (0.0%) |
| $300 to $499 | 104 (31.8%) | 20 (18.9%) |
| $500 to $799 | 34 (10.4%) | 17 (16.0%) |
| $800 to $999 | 41 (12.5%) | 0 (0.0%) |
| $1,000 to $1,499 | 18 (5.5%) | 0 (0.0%) |
| $1,500 to $1,999 | 14 (4.3%) | 0 (0.0%) |
| $2,000 to $2,499 | 26 (8.0%) | 0 (0.0%) |
| $2,500 to $2,999 | 0 (0.0%) | 0 (0.0%) |
| $3,000 or more | 36 (11.0%) | 0 (0.0%) |
| Total | 327 (100.0%) | 106 (100.0%) |
Physical Housing Characteristics in Willow Valley
Housing Structures in Willow Valley
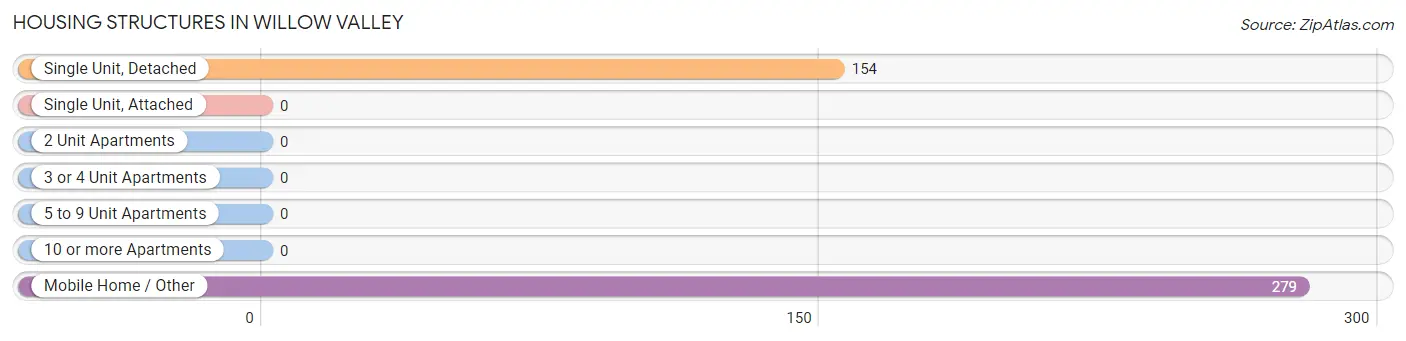
| Structure Type | # Housing Units | % Housing Units |
| Single Unit, Detached | 154 | 35.6% |
| Single Unit, Attached | 0 | 0.0% |
| 2 Unit Apartments | 0 | 0.0% |
| 3 or 4 Unit Apartments | 0 | 0.0% |
| 5 to 9 Unit Apartments | 0 | 0.0% |
| 10 or more Apartments | 0 | 0.0% |
| Mobile Home / Other | 279 | 64.4% |
| Total | 433 | 100.0% |
Housing Structures by Occupancy in Willow Valley
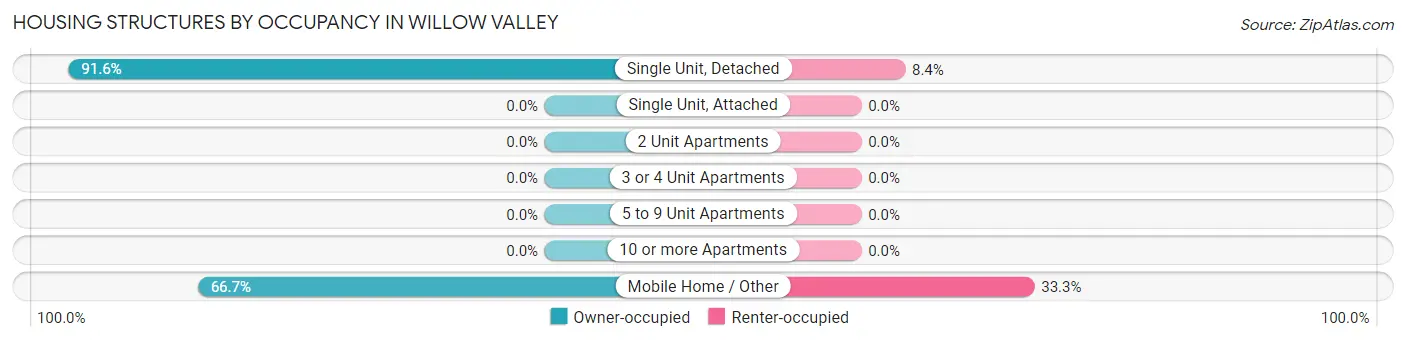
| Structure Type | Owner-occupied | Renter-occupied |
| Single Unit, Detached | 141 (91.6%) | 13 (8.4%) |
| Single Unit, Attached | 0 (0.0%) | 0 (0.0%) |
| 2 Unit Apartments | 0 (0.0%) | 0 (0.0%) |
| 3 or 4 Unit Apartments | 0 (0.0%) | 0 (0.0%) |
| 5 to 9 Unit Apartments | 0 (0.0%) | 0 (0.0%) |
| 10 or more Apartments | 0 (0.0%) | 0 (0.0%) |
| Mobile Home / Other | 186 (66.7%) | 93 (33.3%) |
| Total | 327 (75.5%) | 106 (24.5%) |
Housing Structures by Number of Rooms in Willow Valley
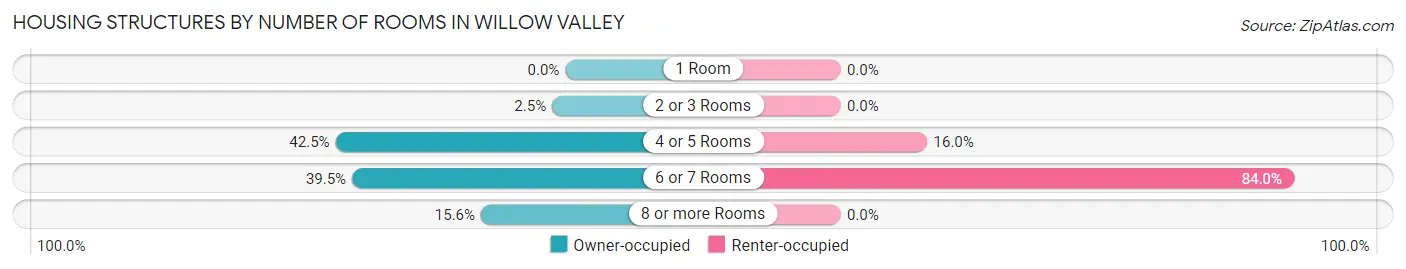
| Number of Rooms | Owner-occupied | Renter-occupied |
| 1 Room | 0 (0.0%) | 0 (0.0%) |
| 2 or 3 Rooms | 8 (2.5%) | 0 (0.0%) |
| 4 or 5 Rooms | 139 (42.5%) | 17 (16.0%) |
| 6 or 7 Rooms | 129 (39.5%) | 89 (84.0%) |
| 8 or more Rooms | 51 (15.6%) | 0 (0.0%) |
| Total | 327 (100.0%) | 106 (100.0%) |
Housing Structure by Heating Type in Willow Valley
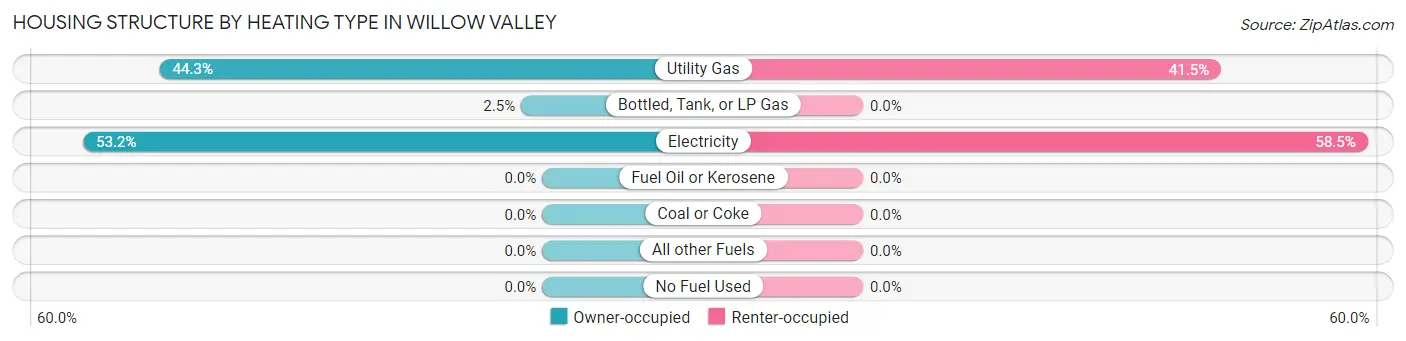
| Heating Type | Owner-occupied | Renter-occupied |
| Utility Gas | 145 (44.3%) | 44 (41.5%) |
| Bottled, Tank, or LP Gas | 8 (2.5%) | 0 (0.0%) |
| Electricity | 174 (53.2%) | 62 (58.5%) |
| Fuel Oil or Kerosene | 0 (0.0%) | 0 (0.0%) |
| Coal or Coke | 0 (0.0%) | 0 (0.0%) |
| All other Fuels | 0 (0.0%) | 0 (0.0%) |
| No Fuel Used | 0 (0.0%) | 0 (0.0%) |
| Total | 327 (100.0%) | 106 (100.0%) |
Household Vehicle Usage in Willow Valley
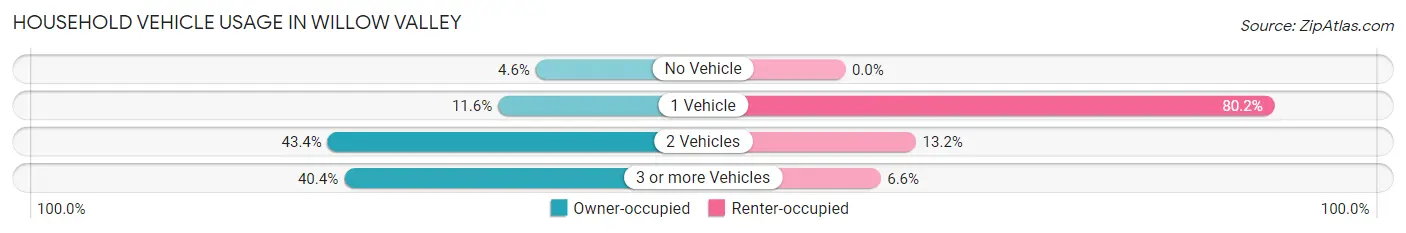
| Vehicles per Household | Owner-occupied | Renter-occupied |
| No Vehicle | 15 (4.6%) | 0 (0.0%) |
| 1 Vehicle | 38 (11.6%) | 85 (80.2%) |
| 2 Vehicles | 142 (43.4%) | 14 (13.2%) |
| 3 or more Vehicles | 132 (40.4%) | 7 (6.6%) |
| Total | 327 (100.0%) | 106 (100.0%) |
Real Estate & Mortgages in Willow Valley
Real Estate and Mortgage Overview in Willow Valley
| Characteristic | Without Mortgage | With Mortgage |
| Housing Units | 193 | 134 |
| Median Property Value | $144,800 | $274,100 |
| Median Household Income | $42,898 | $0 |
| Monthly Housing Costs | $335 | $36 |
| Real Estate Taxes | - | - |
Property Value by Mortgage Status in Willow Valley
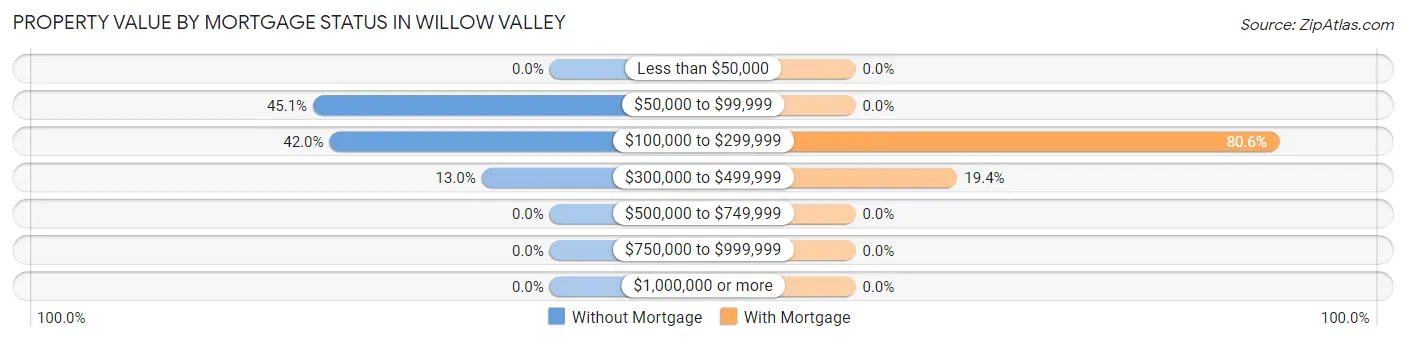
| Property Value | Without Mortgage | With Mortgage |
| Less than $50,000 | 0 (0.0%) | 0 (0.0%) |
| $50,000 to $99,999 | 87 (45.1%) | 0 (0.0%) |
| $100,000 to $299,999 | 81 (42.0%) | 108 (80.6%) |
| $300,000 to $499,999 | 25 (13.0%) | 26 (19.4%) |
| $500,000 to $749,999 | 0 (0.0%) | 0 (0.0%) |
| $750,000 to $999,999 | 0 (0.0%) | 0 (0.0%) |
| $1,000,000 or more | 0 (0.0%) | 0 (0.0%) |
| Total | 193 (100.0%) | 134 (100.0%) |
Household Income by Mortgage Status in Willow Valley
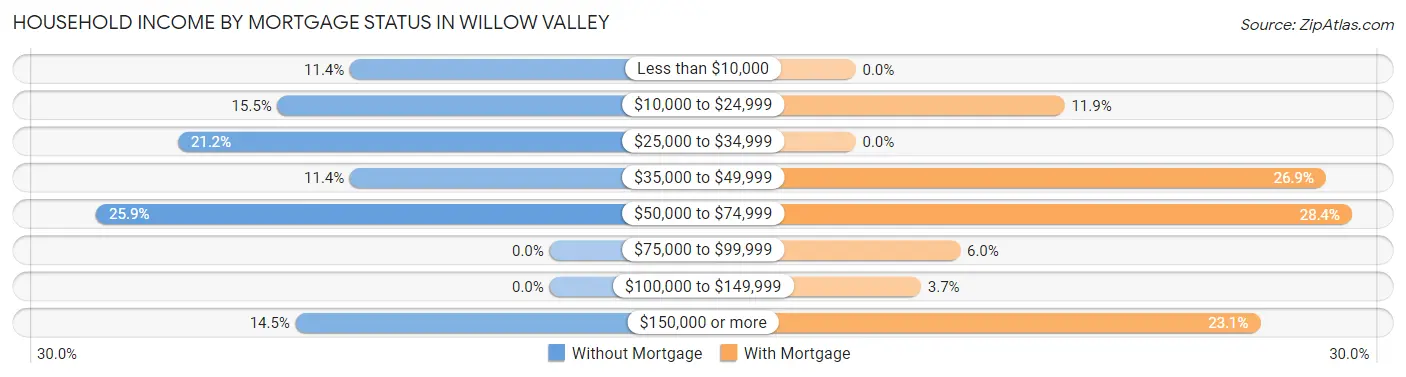
| Household Income | Without Mortgage | With Mortgage |
| Less than $10,000 | 22 (11.4%) | 0 (0.0%) |
| $10,000 to $24,999 | 30 (15.5%) | 16 (11.9%) |
| $25,000 to $34,999 | 41 (21.2%) | 0 (0.0%) |
| $35,000 to $49,999 | 22 (11.4%) | 36 (26.9%) |
| $50,000 to $74,999 | 50 (25.9%) | 38 (28.4%) |
| $75,000 to $99,999 | 0 (0.0%) | 8 (6.0%) |
| $100,000 to $149,999 | 0 (0.0%) | 5 (3.7%) |
| $150,000 or more | 28 (14.5%) | 31 (23.1%) |
| Total | 193 (100.0%) | 134 (100.0%) |
Property Value to Household Income Ratio in Willow Valley
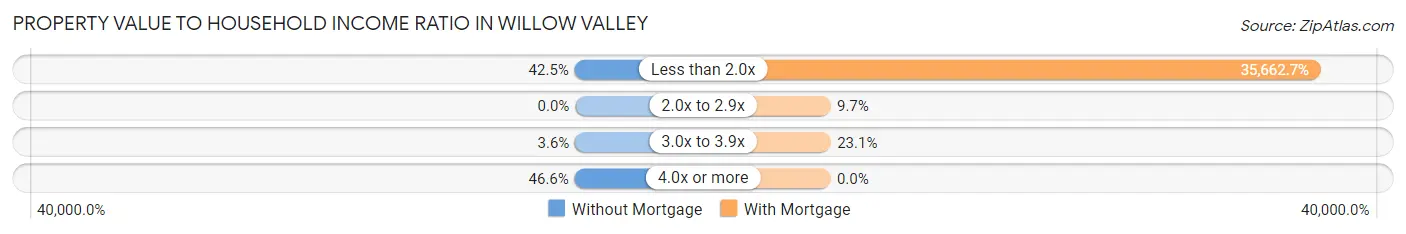
| Value-to-Income Ratio | Without Mortgage | With Mortgage |
| Less than 2.0x | 82 (42.5%) | 47,788 (35,662.7%) |
| 2.0x to 2.9x | 0 (0.0%) | 13 (9.7%) |
| 3.0x to 3.9x | 7 (3.6%) | 31 (23.1%) |
| 4.0x or more | 90 (46.6%) | 0 (0.0%) |
| Total | 193 (100.0%) | 134 (100.0%) |
Real Estate Taxes by Mortgage Status in Willow Valley
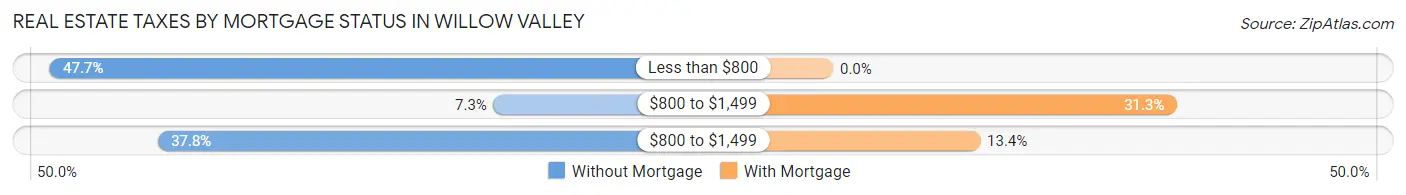
| Property Taxes | Without Mortgage | With Mortgage |
| Less than $800 | 92 (47.7%) | 0 (0.0%) |
| $800 to $1,499 | 14 (7.2%) | 42 (31.3%) |
| $800 to $1,499 | 73 (37.8%) | 18 (13.4%) |
| Total | 193 (100.0%) | 134 (100.0%) |
Health & Disability in Willow Valley
Health Insurance Coverage by Age in Willow Valley
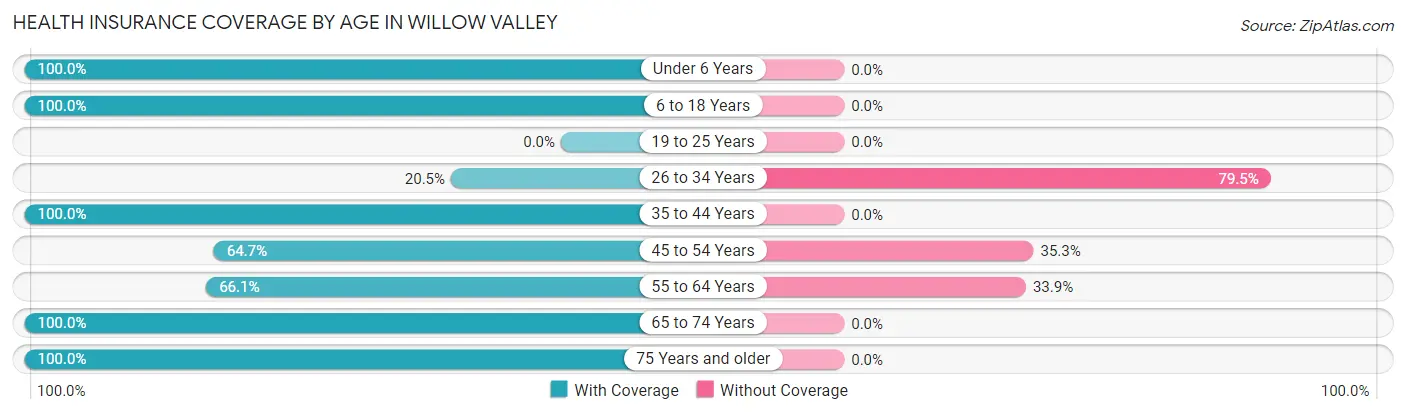
| Age Bracket | With Coverage | Without Coverage |
| Under 6 Years | 24 (100.0%) | 0 (0.0%) |
| 6 to 18 Years | 77 (100.0%) | 0 (0.0%) |
| 19 to 25 Years | 0 (0.0%) | 0 (0.0%) |
| 26 to 34 Years | 8 (20.5%) | 31 (79.5%) |
| 35 to 44 Years | 95 (100.0%) | 0 (0.0%) |
| 45 to 54 Years | 44 (64.7%) | 24 (35.3%) |
| 55 to 64 Years | 162 (66.1%) | 83 (33.9%) |
| 65 to 74 Years | 173 (100.0%) | 0 (0.0%) |
| 75 Years and older | 98 (100.0%) | 0 (0.0%) |
| Total | 681 (83.2%) | 138 (16.9%) |
Health Insurance Coverage by Citizenship Status in Willow Valley
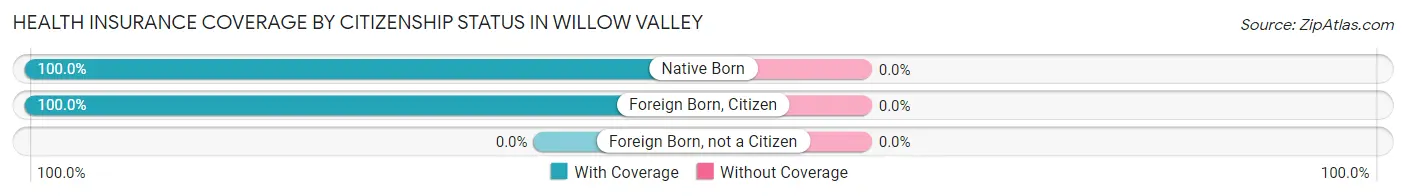
| Citizenship Status | With Coverage | Without Coverage |
| Native Born | 24 (100.0%) | 0 (0.0%) |
| Foreign Born, Citizen | 77 (100.0%) | 0 (0.0%) |
| Foreign Born, not a Citizen | 0 (0.0%) | 0 (0.0%) |
Health Insurance Coverage by Household Income in Willow Valley
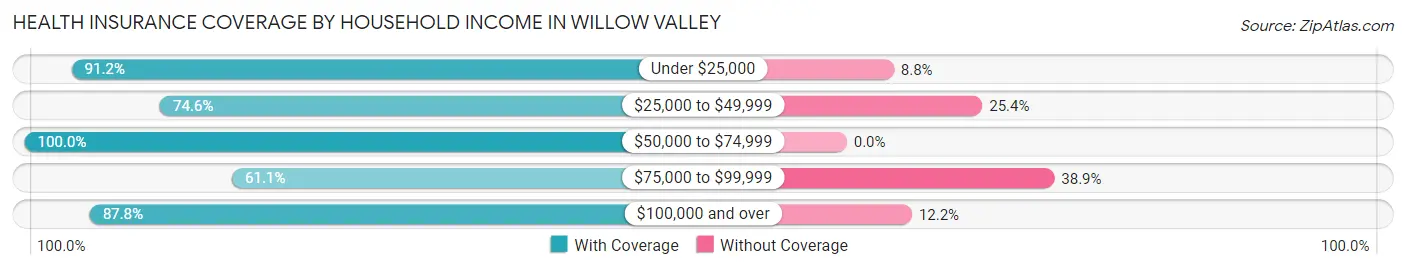
| Household Income | With Coverage | Without Coverage |
| Under $25,000 | 176 (91.2%) | 17 (8.8%) |
| $25,000 to $49,999 | 288 (74.6%) | 98 (25.4%) |
| $50,000 to $74,999 | 91 (100.0%) | 0 (0.0%) |
| $75,000 to $99,999 | 11 (61.1%) | 7 (38.9%) |
| $100,000 and over | 115 (87.8%) | 16 (12.2%) |
Public vs Private Health Insurance Coverage by Age in Willow Valley
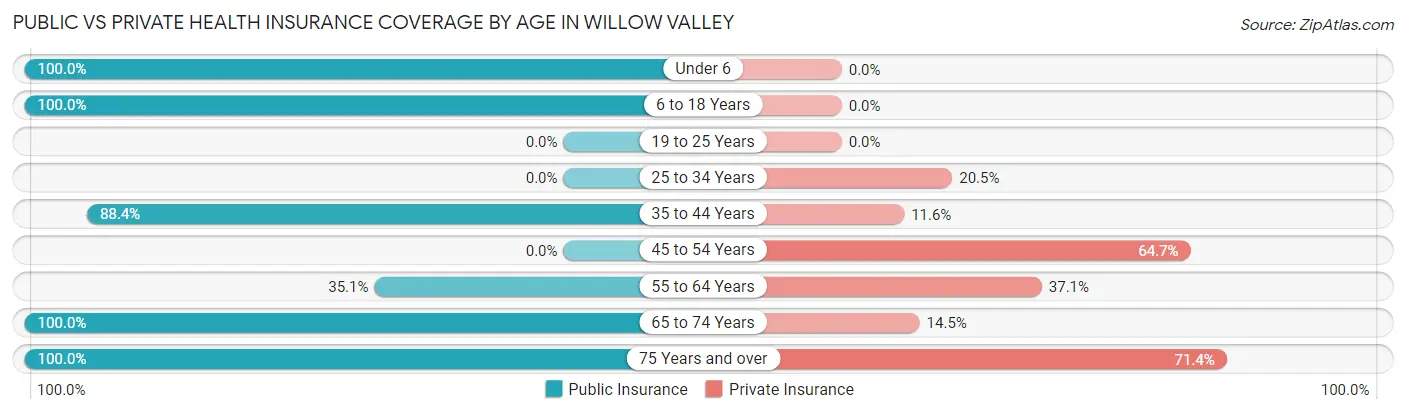
| Age Bracket | Public Insurance | Private Insurance |
| Under 6 | 24 (100.0%) | 0 (0.0%) |
| 6 to 18 Years | 77 (100.0%) | 0 (0.0%) |
| 19 to 25 Years | 0 (0.0%) | 0 (0.0%) |
| 25 to 34 Years | 0 (0.0%) | 8 (20.5%) |
| 35 to 44 Years | 84 (88.4%) | 11 (11.6%) |
| 45 to 54 Years | 0 (0.0%) | 44 (64.7%) |
| 55 to 64 Years | 86 (35.1%) | 91 (37.1%) |
| 65 to 74 Years | 173 (100.0%) | 25 (14.4%) |
| 75 Years and over | 98 (100.0%) | 70 (71.4%) |
| Total | 542 (66.2%) | 249 (30.4%) |
Disability Status by Sex by Age in Willow Valley
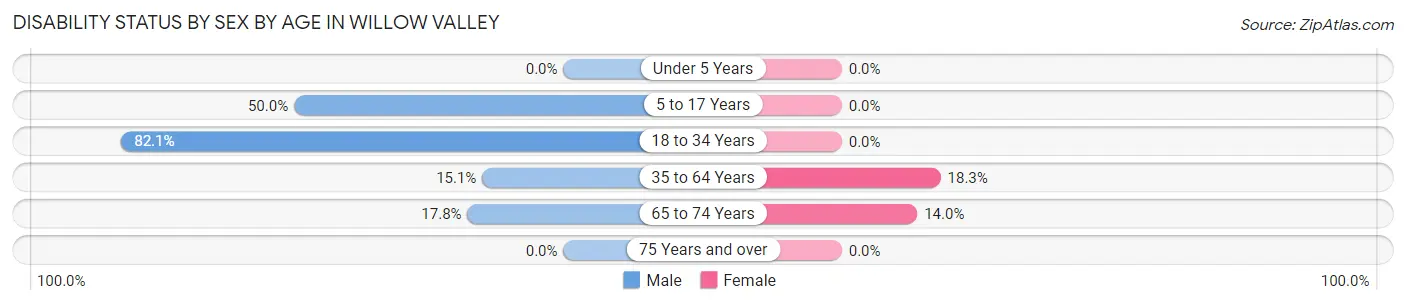
| Age Bracket | Male | Female |
| Under 5 Years | 0 (0.0%) | 0 (0.0%) |
| 5 to 17 Years | 25 (50.0%) | 0 (0.0%) |
| 18 to 34 Years | 32 (82.1%) | 0 (0.0%) |
| 35 to 64 Years | 36 (15.1%) | 31 (18.3%) |
| 65 to 74 Years | 13 (17.8%) | 14 (14.0%) |
| 75 Years and over | 0 (0.0%) | 0 (0.0%) |
Disability Class by Sex by Age in Willow Valley
Disability Class: Hearing Difficulty
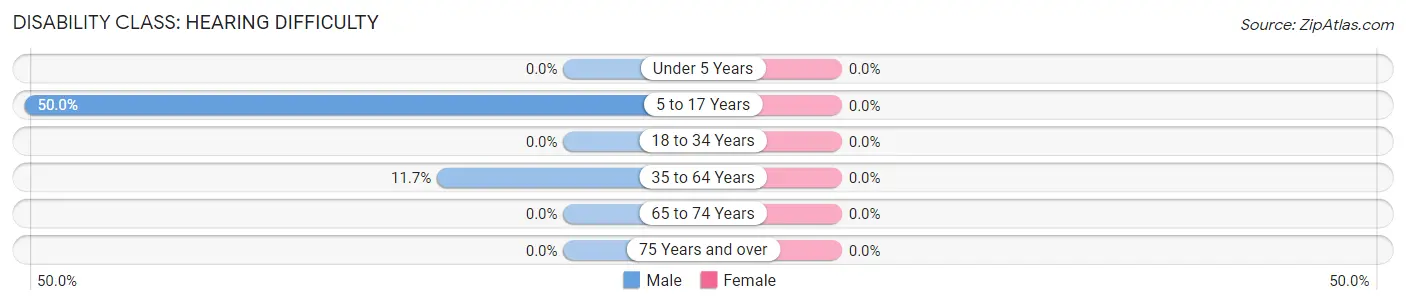
| Age Bracket | Male | Female |
| Under 5 Years | 0 (0.0%) | 0 (0.0%) |
| 5 to 17 Years | 25 (50.0%) | 0 (0.0%) |
| 18 to 34 Years | 0 (0.0%) | 0 (0.0%) |
| 35 to 64 Years | 28 (11.7%) | 0 (0.0%) |
| 65 to 74 Years | 0 (0.0%) | 0 (0.0%) |
| 75 Years and over | 0 (0.0%) | 0 (0.0%) |
Disability Class: Vision Difficulty
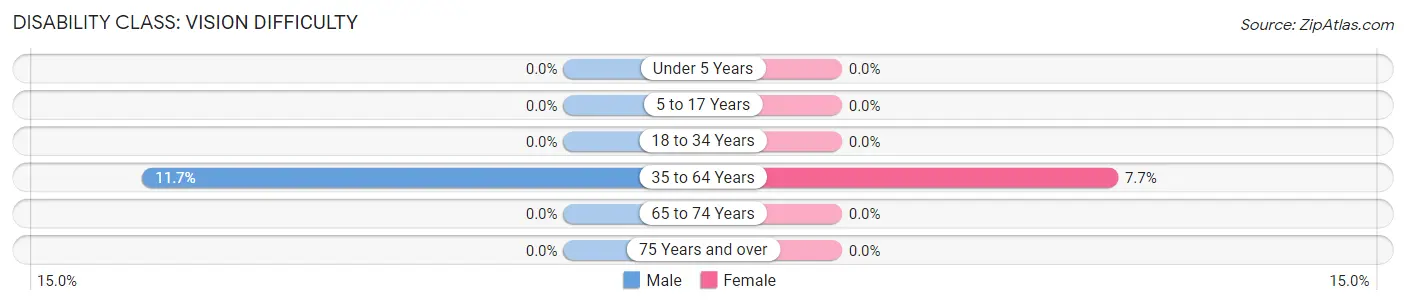
| Age Bracket | Male | Female |
| Under 5 Years | 0 (0.0%) | 0 (0.0%) |
| 5 to 17 Years | 0 (0.0%) | 0 (0.0%) |
| 18 to 34 Years | 0 (0.0%) | 0 (0.0%) |
| 35 to 64 Years | 28 (11.7%) | 13 (7.7%) |
| 65 to 74 Years | 0 (0.0%) | 0 (0.0%) |
| 75 Years and over | 0 (0.0%) | 0 (0.0%) |
Disability Class: Cognitive Difficulty
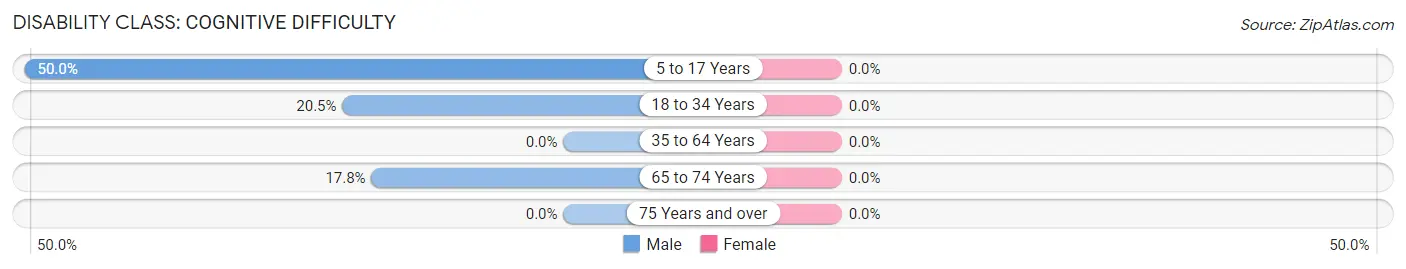
| Age Bracket | Male | Female |
| 5 to 17 Years | 25 (50.0%) | 0 (0.0%) |
| 18 to 34 Years | 8 (20.5%) | 0 (0.0%) |
| 35 to 64 Years | 0 (0.0%) | 0 (0.0%) |
| 65 to 74 Years | 13 (17.8%) | 0 (0.0%) |
| 75 Years and over | 0 (0.0%) | 0 (0.0%) |
Disability Class: Ambulatory Difficulty
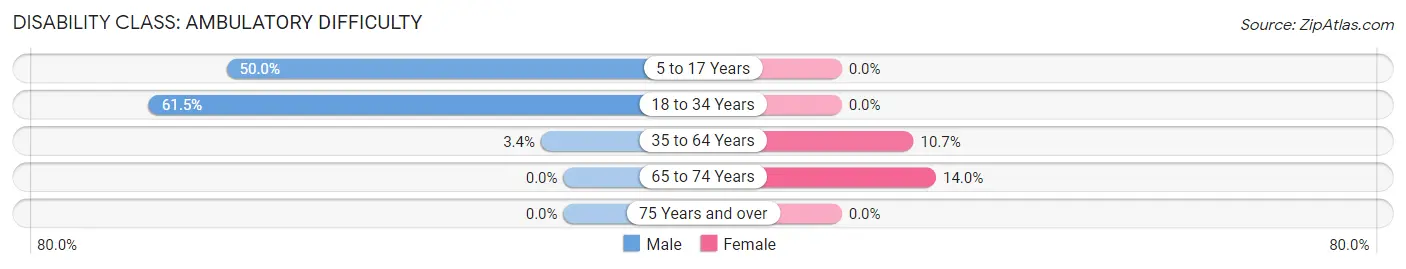
| Age Bracket | Male | Female |
| 5 to 17 Years | 25 (50.0%) | 0 (0.0%) |
| 18 to 34 Years | 24 (61.5%) | 0 (0.0%) |
| 35 to 64 Years | 8 (3.4%) | 18 (10.6%) |
| 65 to 74 Years | 0 (0.0%) | 14 (14.0%) |
| 75 Years and over | 0 (0.0%) | 0 (0.0%) |
Disability Class: Self-Care Difficulty
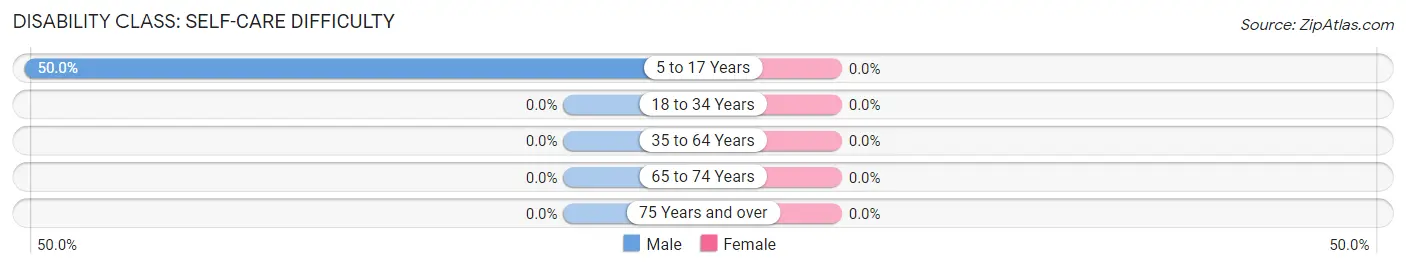
| Age Bracket | Male | Female |
| 5 to 17 Years | 25 (50.0%) | 0 (0.0%) |
| 18 to 34 Years | 0 (0.0%) | 0 (0.0%) |
| 35 to 64 Years | 0 (0.0%) | 0 (0.0%) |
| 65 to 74 Years | 0 (0.0%) | 0 (0.0%) |
| 75 Years and over | 0 (0.0%) | 0 (0.0%) |
Technology Access in Willow Valley
Computing Device Access in Willow Valley
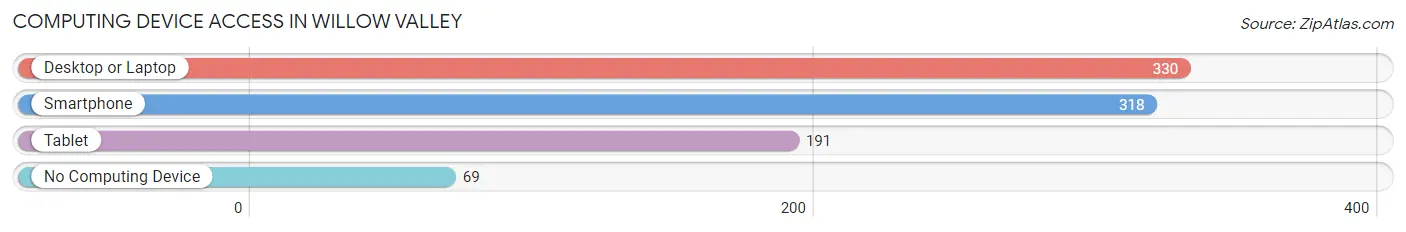
| Device Type | # Households | % Households |
| Desktop or Laptop | 330 | 76.2% |
| Smartphone | 318 | 73.4% |
| Tablet | 191 | 44.1% |
| No Computing Device | 69 | 15.9% |
| Total | 433 | 100.0% |
Internet Access in Willow Valley
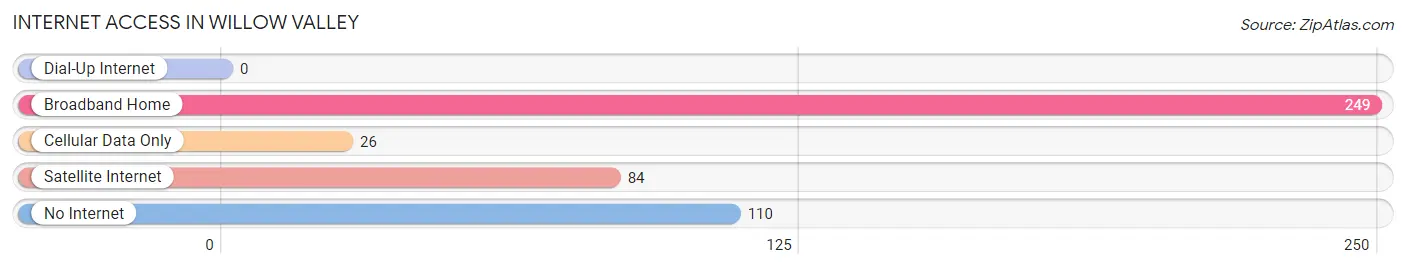
| Internet Type | # Households | % Households |
| Dial-Up Internet | 0 | 0.0% |
| Broadband Home | 249 | 57.5% |
| Cellular Data Only | 26 | 6.0% |
| Satellite Internet | 84 | 19.4% |
| No Internet | 110 | 25.4% |
| Total | 433 | 100.0% |
Willow Valley Summary
Willow Valley is a small town located in the state of Arizona, in the United States. It is situated in the northern part of the state, in Yavapai County, and is part of the Prescott Metropolitan Statistical Area. The town has a population of approximately 1,000 people, and is known for its rural atmosphere and small-town charm.
Geography
Willow Valley is located in the northern part of Arizona, in Yavapai County. It is situated in the Prescott Metropolitan Statistical Area, and is approximately 30 miles north of Prescott, the county seat. The town is located in the Bradshaw Mountains, and is surrounded by rolling hills and lush vegetation. The town is situated at an elevation of 5,000 feet, and is located in a semi-arid climate. The average annual temperature is approximately 70 degrees Fahrenheit, and the average annual precipitation is approximately 12 inches.
Economy
Willow Valley is a small, rural town, and the economy is largely based on agriculture and tourism. The town is home to several small farms, which produce a variety of crops, including hay, alfalfa, and vegetables. The town is also home to several small businesses, including restaurants, shops, and other services. Tourism is also an important part of the local economy, as the town is located near several popular outdoor recreation areas, including the Prescott National Forest and the Granite Mountain Wilderness Area.
Demographics
As of the 2010 census, the population of Willow Valley was 1,000 people. The racial makeup of the town was 95.2% White, 0.7% Native American, 0.3% Asian, 0.2% African American, and 3.6% from other races. The median household income was $37,500, and the median age was 44.5 years.
History
Willow Valley was first settled in the late 1800s, and was originally known as “Willow Springs.” The town was officially incorporated in 1912, and was named after the nearby Willow Creek. The town was originally a farming community, and the local economy was largely based on agriculture. In the 1950s, the town began to experience a population boom, as many people moved to the area to take advantage of the mild climate and scenic beauty. In recent years, the town has become increasingly popular with tourists, and the local economy has shifted to focus more on tourism and small businesses.
Willow Valley is a small, rural town with a rich history and a unique atmosphere. The town is known for its rural charm and scenic beauty, and is a popular destination for tourists and outdoor enthusiasts. The town is also home to a variety of small businesses, and the local economy is largely based on agriculture and tourism. With its friendly atmosphere and beautiful surroundings, Willow Valley is a great place to live and visit.
Common Questions
What is Per Capita Income in Willow Valley?
Per Capita income in Willow Valley is $28,563.
What is the Median Family Income in Willow Valley?
Median Family Income in Willow Valley is $48,894.
What is the Median Household income in Willow Valley?
Median Household Income in Willow Valley is $32,981.
What is Income or Wage Gap in Willow Valley?
Income or Wage Gap in Willow Valley is 34.6%.
Women in Willow Valley earn 65.4 cents for every dollar earned by a man.
What is Inequality or Gini Index in Willow Valley?
Inequality or Gini Index in Willow Valley is 0.46.
What is the Total Population of Willow Valley?
Total Population of Willow Valley is 819.
What is the Total Male Population of Willow Valley?
Total Male Population of Willow Valley is 494.
What is the Total Female Population of Willow Valley?
Total Female Population of Willow Valley is 325.
What is the Ratio of Males per 100 Females in Willow Valley?
There are 152.00 Males per 100 Females in Willow Valley.
What is the Ratio of Females per 100 Males in Willow Valley?
There are 65.79 Females per 100 Males in Willow Valley.
What is the Median Population Age in Willow Valley?
Median Population Age in Willow Valley is 59.7 Years.
What is the Average Family Size in Willow Valley
Average Family Size in Willow Valley is 2.6 People.
What is the Average Household Size in Willow Valley
Average Household Size in Willow Valley is 1.9 People.
How Large is the Labor Force in Willow Valley?
There are 178 People in the Labor Forcein in Willow Valley.
What is the Percentage of People in the Labor Force in Willow Valley?
24.8% of People are in the Labor Force in Willow Valley.
What is the Unemployment Rate in Willow Valley?
Unemployment Rate in Willow Valley is 13.5%.