Dripping Springs, AZ Map & Demographics
Dripping Springs Map
Dripping Springs Overview
$24,885
PER CAPITA INCOME
$51,458
AVG FAMILY INCOME
$48,125
AVG HOUSEHOLD INCOME
0.44
INEQUALITY / GINI INDEX
230
TOTAL POPULATION
147
MALE POPULATION
83
FEMALE POPULATION
177.11
MALES / 100 FEMALES
56.46
FEMALES / 100 MALES
53.4
MEDIAN AGE
3.9
AVG FAMILY SIZE
2.8
AVG HOUSEHOLD SIZE
92
LABOR FORCE [ PEOPLE ]
55.1%
PERCENT IN LABOR FORCE
Income in Dripping Springs
Income Overview in Dripping Springs
Per Capita Income in Dripping Springs is $24,885, while median incomes of families and households are $51,458 and $48,125 respectively.
| Characteristic | Number | Measure |
| Per Capita Income | 230 | $24,885 |
| Median Family Income | 52 | $51,458 |
| Mean Family Income | 52 | $86,033 |
| Median Household Income | 81 | $48,125 |
| Mean Household Income | 81 | $64,498 |
| Income Deficit | 52 | $0 |
| Wage / Income Gap (%) | 230 | 0.00% |
| Wage / Income Gap ($) | 230 | 100.00¢ per $1 |
| Gini / Inequality Index | 230 | 0.44 |
Earnings by Sex in Dripping Springs
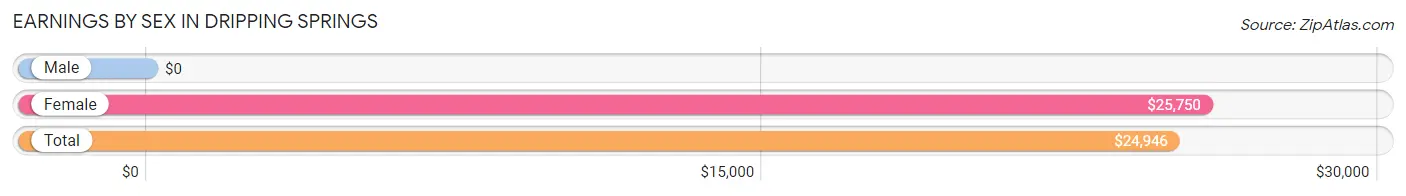
| Sex | Number | Average Earnings |
| Male | 39 (41.0%) | $0 |
| Female | 56 (59.0%) | $25,750 |
| Total | 95 (100.0%) | $24,946 |
Earnings by Sex by Income Bracket in Dripping Springs
The most common earnings brackets in Dripping Springs are $12,500 to $14,999 for men (19 | 48.7%) and $22,500 to $24,999 for women (19 | 33.9%).
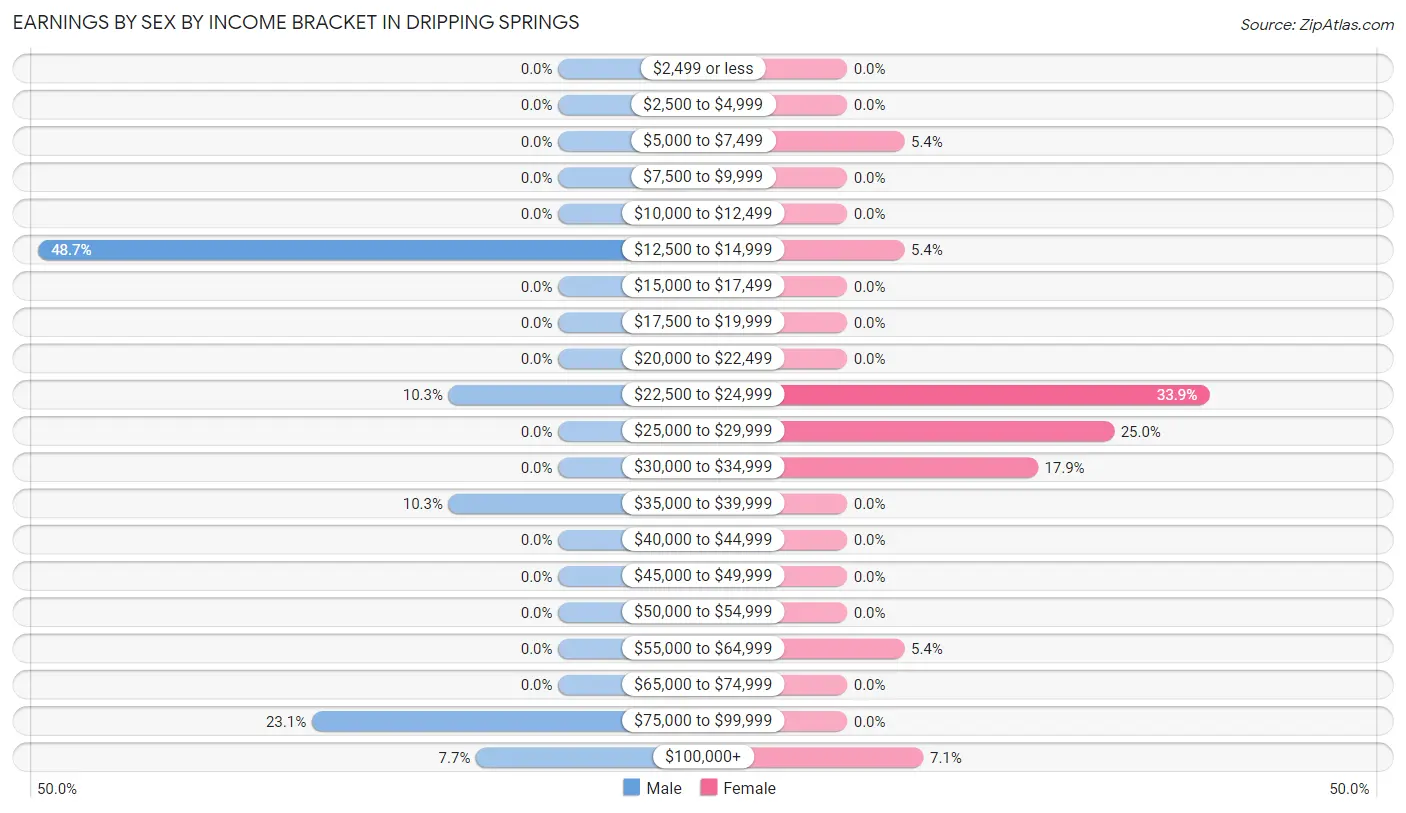
| Income | Male | Female |
| $2,499 or less | 0 (0.0%) | 0 (0.0%) |
| $2,500 to $4,999 | 0 (0.0%) | 0 (0.0%) |
| $5,000 to $7,499 | 0 (0.0%) | 3 (5.4%) |
| $7,500 to $9,999 | 0 (0.0%) | 0 (0.0%) |
| $10,000 to $12,499 | 0 (0.0%) | 0 (0.0%) |
| $12,500 to $14,999 | 19 (48.7%) | 3 (5.4%) |
| $15,000 to $17,499 | 0 (0.0%) | 0 (0.0%) |
| $17,500 to $19,999 | 0 (0.0%) | 0 (0.0%) |
| $20,000 to $22,499 | 0 (0.0%) | 0 (0.0%) |
| $22,500 to $24,999 | 4 (10.3%) | 19 (33.9%) |
| $25,000 to $29,999 | 0 (0.0%) | 14 (25.0%) |
| $30,000 to $34,999 | 0 (0.0%) | 10 (17.9%) |
| $35,000 to $39,999 | 4 (10.3%) | 0 (0.0%) |
| $40,000 to $44,999 | 0 (0.0%) | 0 (0.0%) |
| $45,000 to $49,999 | 0 (0.0%) | 0 (0.0%) |
| $50,000 to $54,999 | 0 (0.0%) | 0 (0.0%) |
| $55,000 to $64,999 | 0 (0.0%) | 3 (5.4%) |
| $65,000 to $74,999 | 0 (0.0%) | 0 (0.0%) |
| $75,000 to $99,999 | 9 (23.1%) | 0 (0.0%) |
| $100,000+ | 3 (7.7%) | 4 (7.1%) |
| Total | 39 (100.0%) | 56 (100.0%) |
Earnings by Sex by Educational Attainment in Dripping Springs
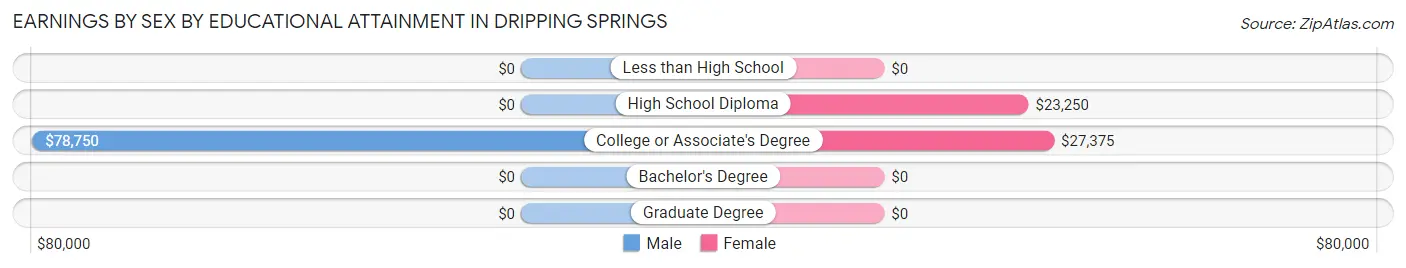
| Educational Attainment | Male Income | Female Income |
| Less than High School | - | - |
| High School Diploma | - | - |
| College or Associate's Degree | $78,750 | $27,375 |
| Bachelor's Degree | - | - |
| Graduate Degree | - | - |
| Total | - | - |
Family Income in Dripping Springs
Family Income Brackets in Dripping Springs
According to the Dripping Springs family income data, there are 16 families falling into the $35,000 to $49,999 income range, which is the most common income bracket and makes up 30.8% of all families.
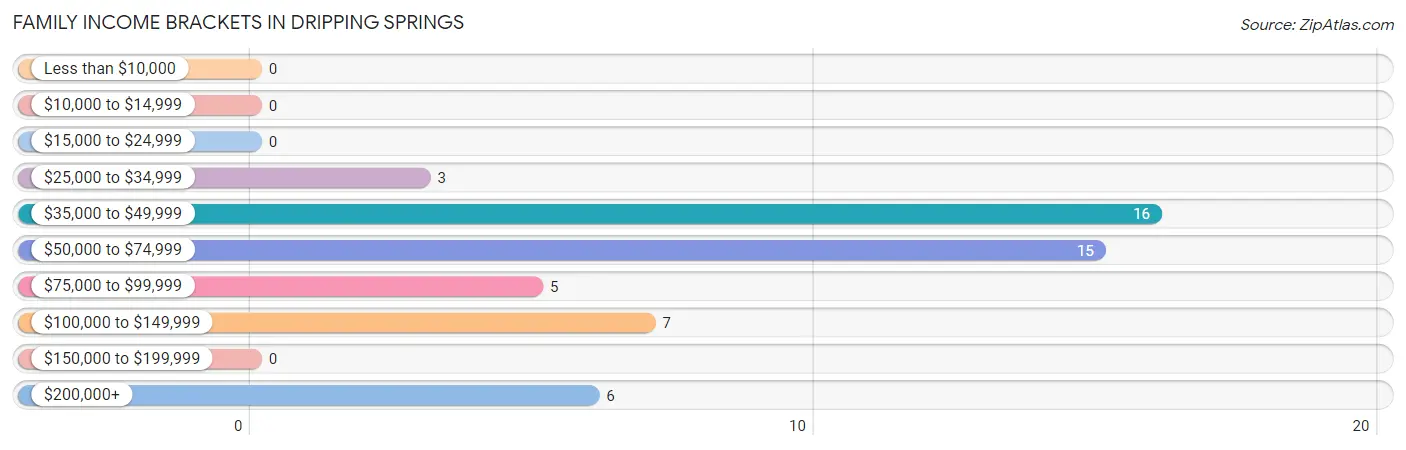
| Income Bracket | # Families | % Families |
| Less than $10,000 | 0 | 0.0% |
| $10,000 to $14,999 | 0 | 0.0% |
| $15,000 to $24,999 | 0 | 0.0% |
| $25,000 to $34,999 | 3 | 5.8% |
| $35,000 to $49,999 | 16 | 30.8% |
| $50,000 to $74,999 | 15 | 28.8% |
| $75,000 to $99,999 | 5 | 9.6% |
| $100,000 to $149,999 | 7 | 13.5% |
| $150,000 to $199,999 | 0 | 0.0% |
| $200,000+ | 6 | 11.5% |
Family Income by Famaliy Size in Dripping Springs
| Income Bracket | # Families | Median Income |
| 2-Person Families | 19 (36.5%) | $0 |
| 3-Person Families | 17 (32.7%) | $0 |
| 4-Person Families | 3 (5.8%) | $0 |
| 5-Person Families | 13 (25.0%) | $0 |
| 6-Person Families | 0 (0.0%) | $0 |
| 7+ Person Families | 0 (0.0%) | $0 |
| Total | 52 (100.0%) | $51,458 |
Family Income by Number of Earners in Dripping Springs
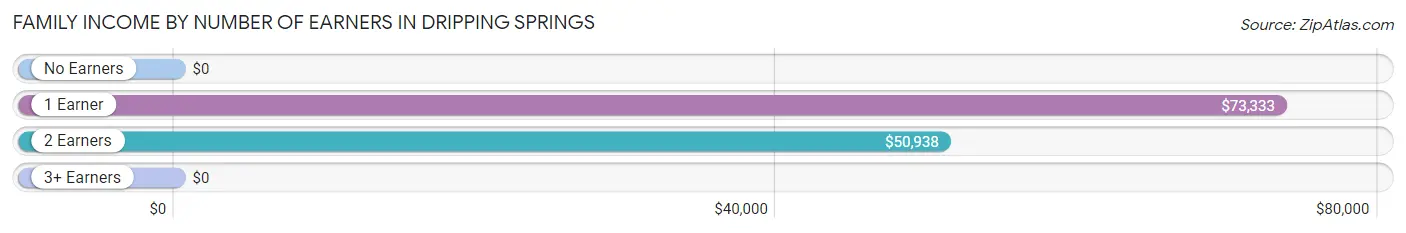
| Number of Earners | # Families | Median Income |
| No Earners | 6 (11.5%) | $0 |
| 1 Earner | 14 (26.9%) | $73,333 |
| 2 Earners | 29 (55.8%) | $50,938 |
| 3+ Earners | 3 (5.8%) | $0 |
| Total | 52 (100.0%) | $51,458 |
Household Income in Dripping Springs
Household Income Brackets in Dripping Springs
With 22 households falling in the category, the $25,000 to $34,999 income range is the most frequent in Dripping Springs, accounting for 27.2% of all households.
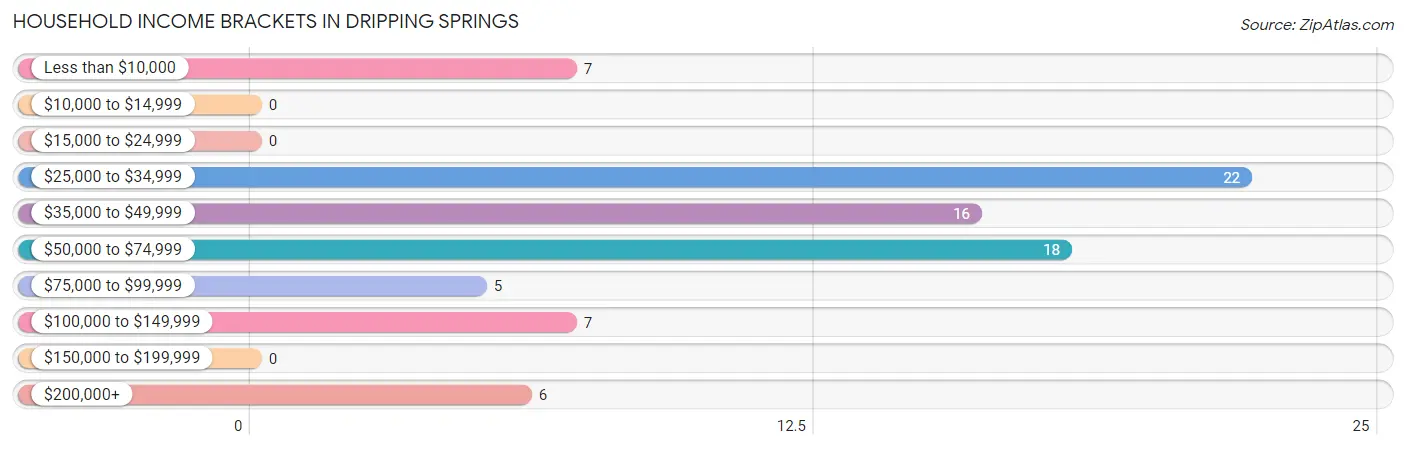
| Income Bracket | # Households | % Households |
| Less than $10,000 | 7 | 8.6% |
| $10,000 to $14,999 | 0 | 0.0% |
| $15,000 to $24,999 | 0 | 0.0% |
| $25,000 to $34,999 | 22 | 27.2% |
| $35,000 to $49,999 | 16 | 19.8% |
| $50,000 to $74,999 | 18 | 22.2% |
| $75,000 to $99,999 | 5 | 6.2% |
| $100,000 to $149,999 | 7 | 8.6% |
| $150,000 to $199,999 | 0 | 0.0% |
| $200,000+ | 6 | 7.4% |
Household Income by Householder Age in Dripping Springs
The median household income in Dripping Springs is $48,125, with the highest median household income of $29,079 found in the 65+ years age bracket for the primary householder. A total of 44 households (54.3%) fall into this category.
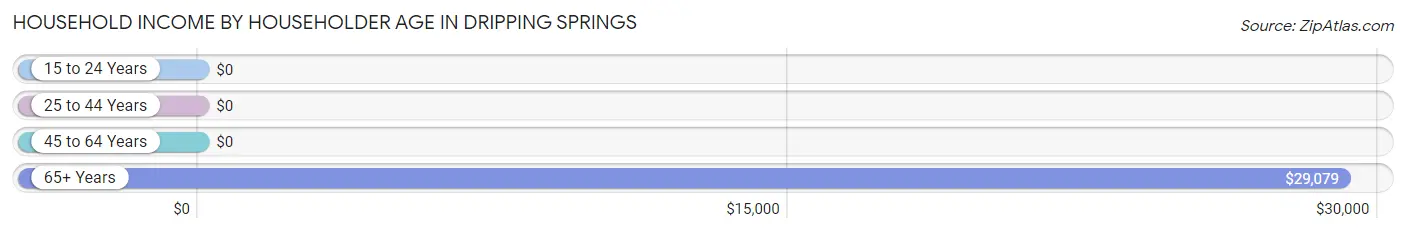
| Income Bracket | # Households | Median Income |
| 15 to 24 Years | 0 (0.0%) | $0 |
| 25 to 44 Years | 10 (12.3%) | $0 |
| 45 to 64 Years | 27 (33.3%) | $0 |
| 65+ Years | 44 (54.3%) | $29,079 |
| Total | 81 (100.0%) | $48,125 |
Poverty in Dripping Springs
Income Below Poverty by Sex and Age in Dripping Springs
With 2.7% poverty level for males and 3.6% for females among the residents of Dripping Springs, 75 year old and over males and 65 to 74 year old females are the most vulnerable to poverty, with 4 males (30.8%) and 3 females (21.4%) in their respective age groups living below the poverty level.
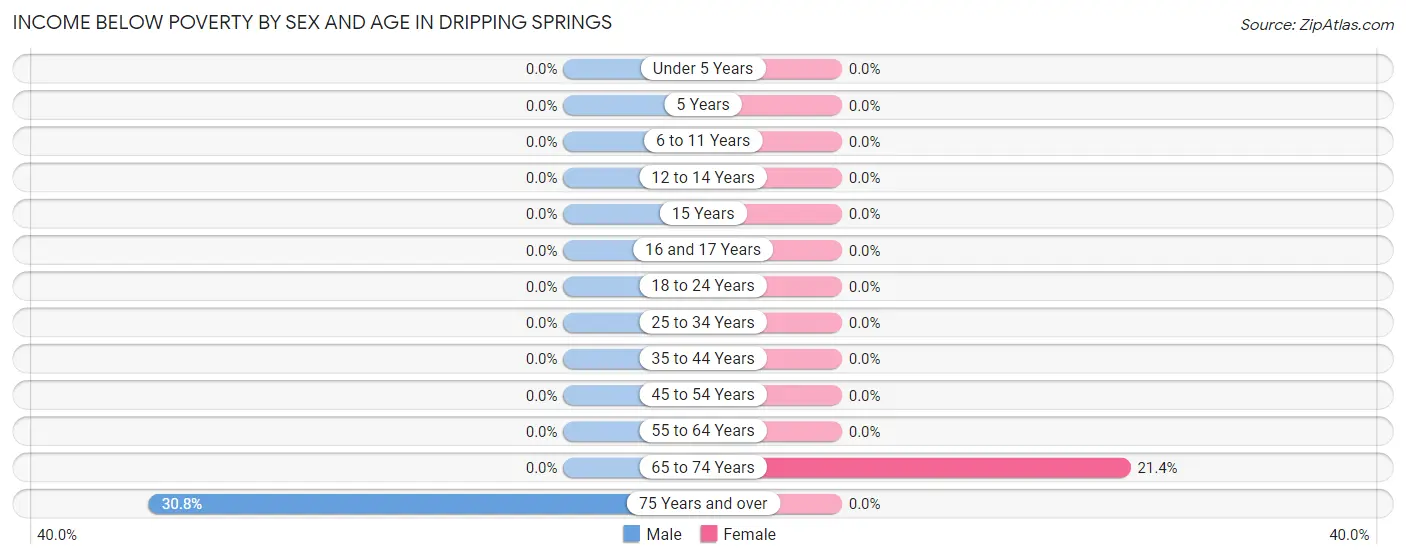
| Age Bracket | Male | Female |
| Under 5 Years | 0 (0.0%) | 0 (0.0%) |
| 5 Years | 0 (0.0%) | 0 (0.0%) |
| 6 to 11 Years | 0 (0.0%) | 0 (0.0%) |
| 12 to 14 Years | 0 (0.0%) | 0 (0.0%) |
| 15 Years | 0 (0.0%) | 0 (0.0%) |
| 16 and 17 Years | 0 (0.0%) | 0 (0.0%) |
| 18 to 24 Years | 0 (0.0%) | 0 (0.0%) |
| 25 to 34 Years | 0 (0.0%) | 0 (0.0%) |
| 35 to 44 Years | 0 (0.0%) | 0 (0.0%) |
| 45 to 54 Years | 0 (0.0%) | 0 (0.0%) |
| 55 to 64 Years | 0 (0.0%) | 0 (0.0%) |
| 65 to 74 Years | 0 (0.0%) | 3 (21.4%) |
| 75 Years and over | 4 (30.8%) | 0 (0.0%) |
| Total | 4 (2.7%) | 3 (3.6%) |
Income Above Poverty by Sex and Age in Dripping Springs
According to the poverty statistics in Dripping Springs, males aged 5 years and females aged 5 years are the age groups that are most secure financially, with 100.0% of males and 100.0% of females in these age groups living above the poverty line.
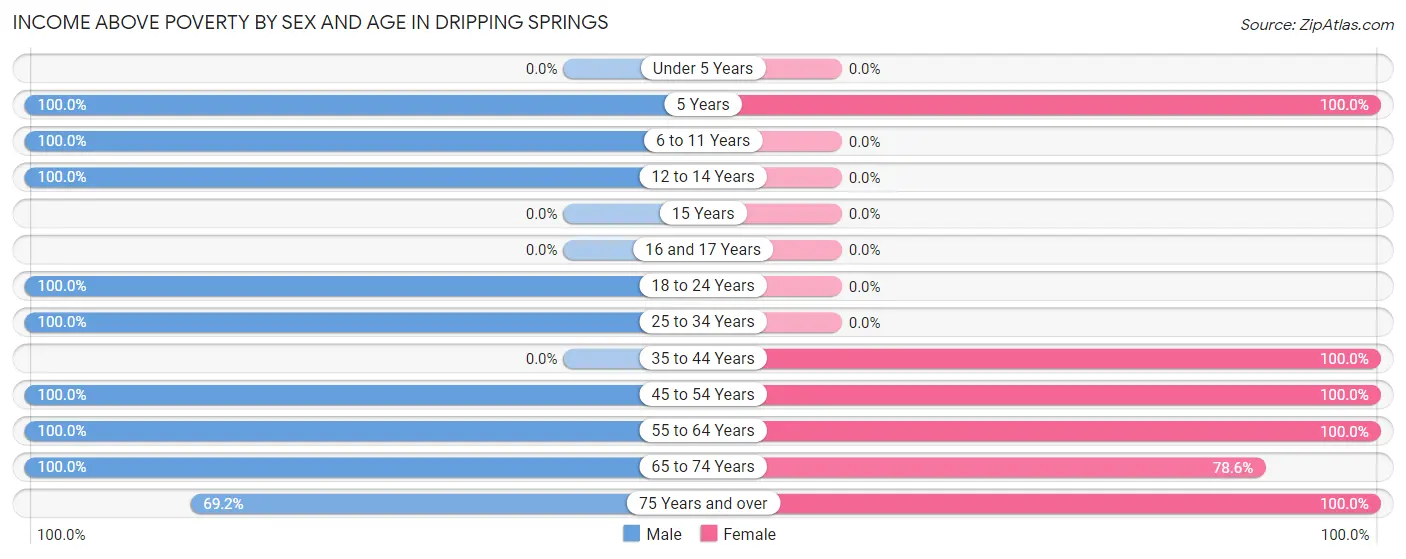
| Age Bracket | Male | Female |
| Under 5 Years | 0 (0.0%) | 0 (0.0%) |
| 5 Years | 20 (100.0%) | 10 (100.0%) |
| 6 to 11 Years | 7 (100.0%) | 0 (0.0%) |
| 12 to 14 Years | 26 (100.0%) | 0 (0.0%) |
| 15 Years | 0 (0.0%) | 0 (0.0%) |
| 16 and 17 Years | 0 (0.0%) | 0 (0.0%) |
| 18 to 24 Years | 4 (100.0%) | 0 (0.0%) |
| 25 to 34 Years | 19 (100.0%) | 0 (0.0%) |
| 35 to 44 Years | 0 (0.0%) | 20 (100.0%) |
| 45 to 54 Years | 9 (100.0%) | 3 (100.0%) |
| 55 to 64 Years | 19 (100.0%) | 25 (100.0%) |
| 65 to 74 Years | 30 (100.0%) | 11 (78.6%) |
| 75 Years and over | 9 (69.2%) | 11 (100.0%) |
| Total | 143 (97.3%) | 80 (96.4%) |
Income Below Poverty Among Married-Couple Families in Dripping Springs
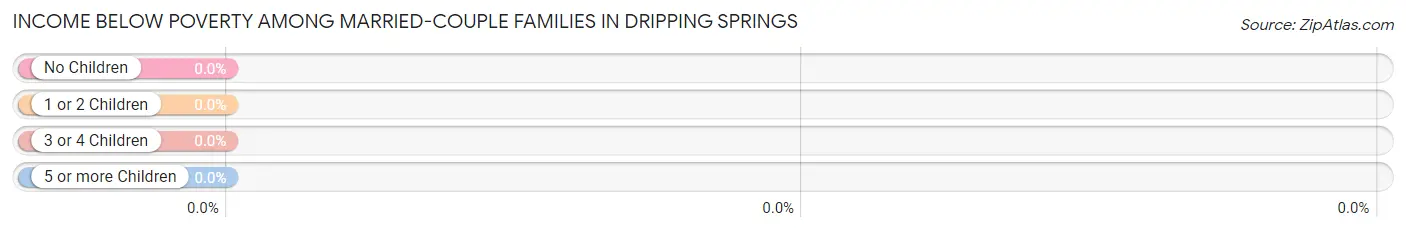
| Children | Above Poverty | Below Poverty |
| No Children | 36 (100.0%) | 0 (0.0%) |
| 1 or 2 Children | 6 (100.0%) | 0 (0.0%) |
| 3 or 4 Children | 10 (100.0%) | 0 (0.0%) |
| 5 or more Children | 0 (0.0%) | 0 (0.0%) |
| Total | 52 (100.0%) | 0 (0.0%) |
Income Below Poverty Among Single-Parent Households in Dripping Springs
| Children | Single Father | Single Mother |
| No Children | 0 (0.0%) | 0 (0.0%) |
| 1 or 2 Children | 0 (0.0%) | 0 (0.0%) |
| 3 or 4 Children | 0 (0.0%) | 0 (0.0%) |
| 5 or more Children | 0 (0.0%) | 0 (0.0%) |
| Total | 0 (0.0%) | 0 (0.0%) |
Income Below Poverty Among Married-Couple vs Single-Parent Households in Dripping Springs
| Children | Married-Couple Families | Single-Parent Households |
| No Children | 0 (0.0%) | 0 (0.0%) |
| 1 or 2 Children | 0 (0.0%) | 0 (0.0%) |
| 3 or 4 Children | 0 (0.0%) | 0 (0.0%) |
| 5 or more Children | 0 (0.0%) | 0 (0.0%) |
| Total | 0 (0.0%) | 0 (0.0%) |
Race in Dripping Springs
The most populous races in Dripping Springs are White / Caucasian (209 | 90.9%), Hispanic or Latino (26 | 11.3%), and Two or more Races (21 | 9.1%).
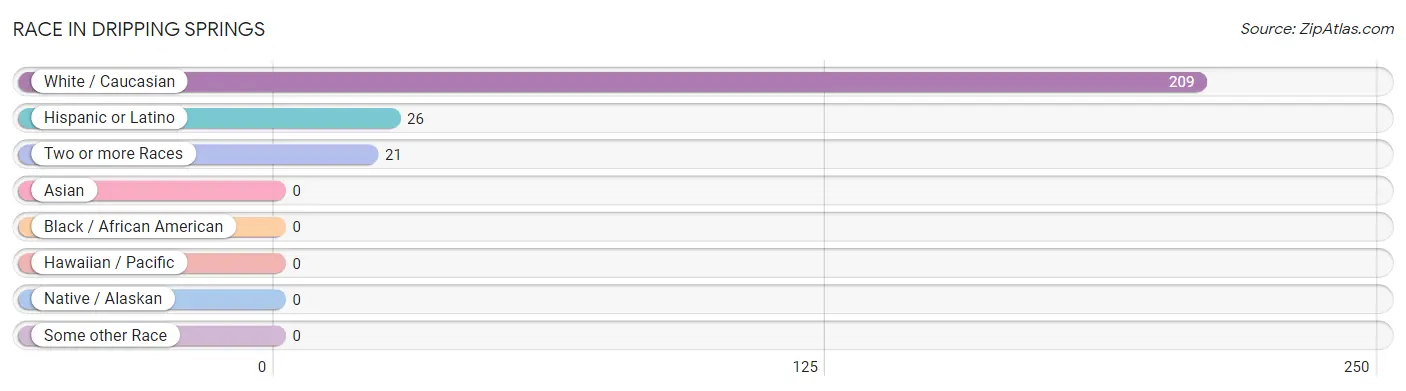
| Race | # Population | % Population |
| Asian | 0 | 0.0% |
| Black / African American | 0 | 0.0% |
| Hawaiian / Pacific | 0 | 0.0% |
| Hispanic or Latino | 26 | 11.3% |
| Native / Alaskan | 0 | 0.0% |
| White / Caucasian | 209 | 90.9% |
| Two or more Races | 21 | 9.1% |
| Some other Race | 0 | 0.0% |
| Total | 230 | 100.0% |
Ancestry in Dripping Springs
The most populous ancestries reported in Dripping Springs are Irish (66 | 28.7%), German (65 | 28.3%), Dutch (40 | 17.4%), Mexican (26 | 11.3%), and American (24 | 10.4%), together accounting for 96.1% of all Dripping Springs residents.
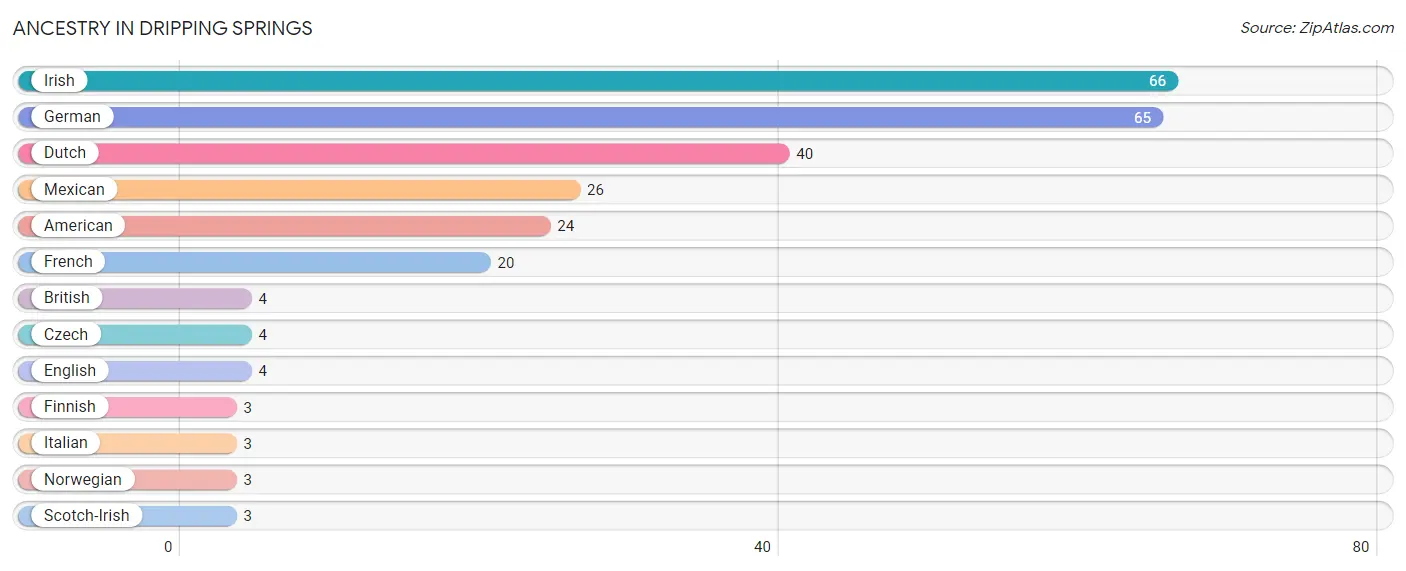
| Ancestry | # Population | % Population |
| American | 24 | 10.4% |
| British | 4 | 1.7% |
| Czech | 4 | 1.7% |
| Dutch | 40 | 17.4% |
| English | 4 | 1.7% |
| Finnish | 3 | 1.3% |
| French | 20 | 8.7% |
| German | 65 | 28.3% |
| Irish | 66 | 28.7% |
| Italian | 3 | 1.3% |
| Mexican | 26 | 11.3% |
| Norwegian | 3 | 1.3% |
| Scotch-Irish | 3 | 1.3% | View All 13 Rows |
Immigrants in Dripping Springs

| Immigration Origin | # Population | % Population | View All 0 Rows |
Sex and Age in Dripping Springs
Sex and Age in Dripping Springs
The most populous age groups in Dripping Springs are 10 to 14 Years (33 | 22.5%) for men and 35 to 39 Years (20 | 24.1%) for women.
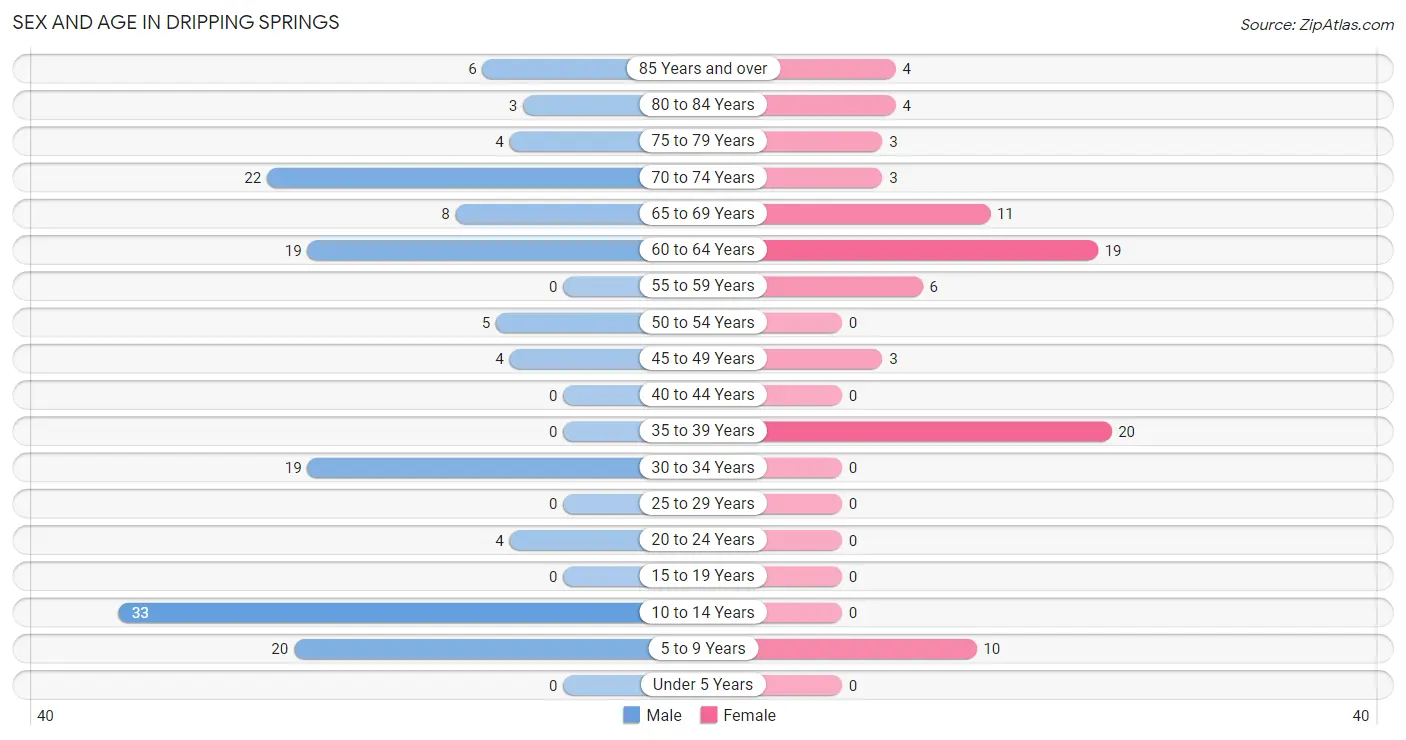
| Age Bracket | Male | Female |
| Under 5 Years | 0 (0.0%) | 0 (0.0%) |
| 5 to 9 Years | 20 (13.6%) | 10 (12.0%) |
| 10 to 14 Years | 33 (22.5%) | 0 (0.0%) |
| 15 to 19 Years | 0 (0.0%) | 0 (0.0%) |
| 20 to 24 Years | 4 (2.7%) | 0 (0.0%) |
| 25 to 29 Years | 0 (0.0%) | 0 (0.0%) |
| 30 to 34 Years | 19 (12.9%) | 0 (0.0%) |
| 35 to 39 Years | 0 (0.0%) | 20 (24.1%) |
| 40 to 44 Years | 0 (0.0%) | 0 (0.0%) |
| 45 to 49 Years | 4 (2.7%) | 3 (3.6%) |
| 50 to 54 Years | 5 (3.4%) | 0 (0.0%) |
| 55 to 59 Years | 0 (0.0%) | 6 (7.2%) |
| 60 to 64 Years | 19 (12.9%) | 19 (22.9%) |
| 65 to 69 Years | 8 (5.4%) | 11 (13.3%) |
| 70 to 74 Years | 22 (15.0%) | 3 (3.6%) |
| 75 to 79 Years | 4 (2.7%) | 3 (3.6%) |
| 80 to 84 Years | 3 (2.0%) | 4 (4.8%) |
| 85 Years and over | 6 (4.1%) | 4 (4.8%) |
| Total | 147 (100.0%) | 83 (100.0%) |
Families and Households in Dripping Springs
Median Family Size in Dripping Springs
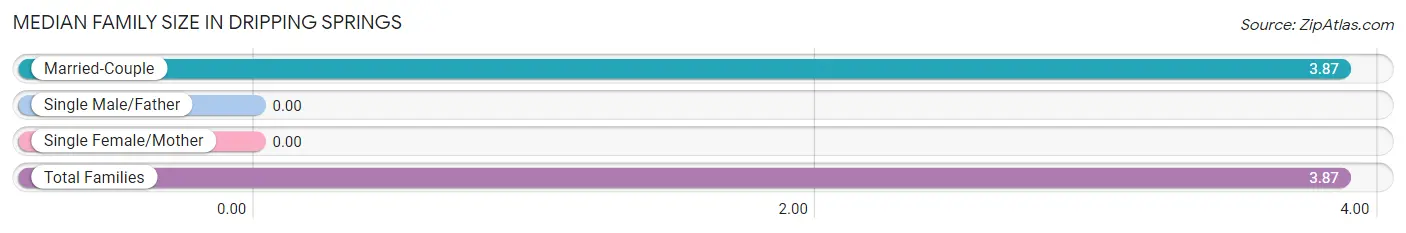
| Family Type | # Families | Family Size |
| Married-Couple | 52 (100.0%) | 3.87 |
| Single Male/Father | 0 (0.0%) | - |
| Single Female/Mother | 0 (0.0%) | - |
| Total Families | 52 (100.0%) | 3.87 |
Median Household Size in Dripping Springs
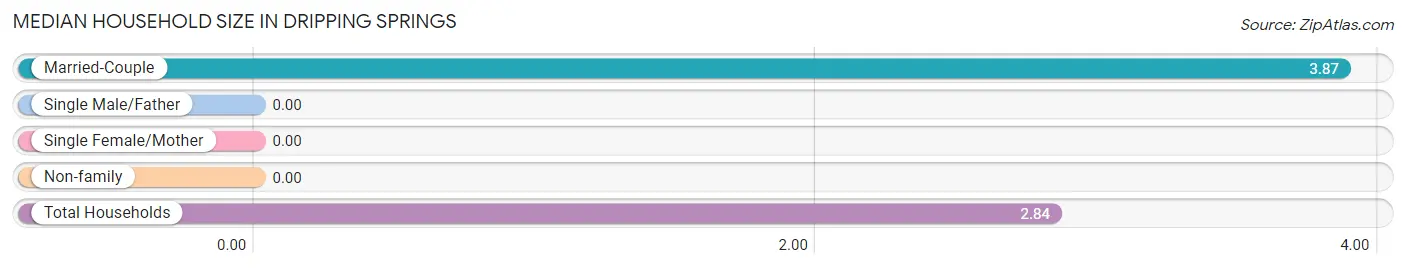
| Household Type | # Households | Household Size |
| Married-Couple | 52 (64.2%) | 3.87 |
| Single Male/Father | 0 (0.0%) | - |
| Single Female/Mother | 0 (0.0%) | - |
| Non-family | 29 (35.8%) | - |
| Total Households | 81 (100.0%) | 2.84 |
Household Size by Marriage Status in Dripping Springs
Out of a total of 81 households in Dripping Springs, 52 (64.2%) are family households, while 29 (35.8%) are nonfamily households. The most numerous type of family households are 2-person households, comprising 19, and the most common type of nonfamily households are 1-person households, comprising 29.
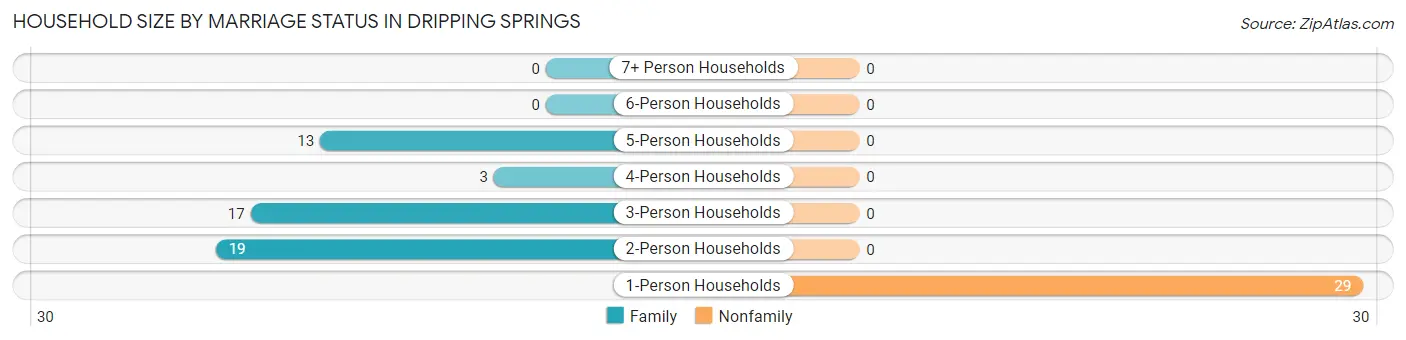
| Household Size | Family Households | Nonfamily Households |
| 1-Person Households | - | 29 (35.8%) |
| 2-Person Households | 19 (23.5%) | 0 (0.0%) |
| 3-Person Households | 17 (21.0%) | 0 (0.0%) |
| 4-Person Households | 3 (3.7%) | 0 (0.0%) |
| 5-Person Households | 13 (16.1%) | 0 (0.0%) |
| 6-Person Households | 0 (0.0%) | 0 (0.0%) |
| 7+ Person Households | 0 (0.0%) | 0 (0.0%) |
| Total | 52 (64.2%) | 29 (35.8%) |
Female Fertility in Dripping Springs
Fertility by Age in Dripping Springs
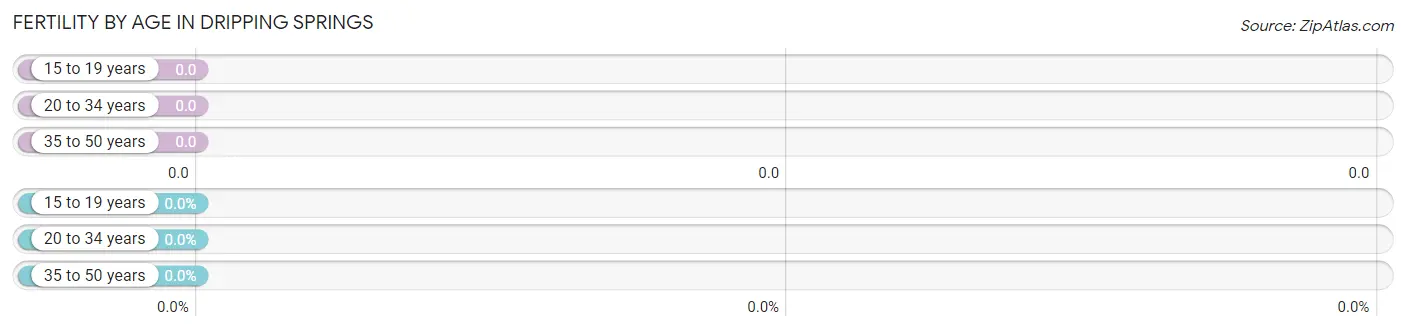
| Age Bracket | Women with Births | Births / 1,000 Women |
| 15 to 19 years | 0 (0.0%) | 0.0 |
| 20 to 34 years | 0 (0.0%) | 0.0 |
| 35 to 50 years | 0 (0.0%) | 0.0 |
| Total | 0 (0.0%) | 0.0 |
Fertility by Age by Marriage Status in Dripping Springs
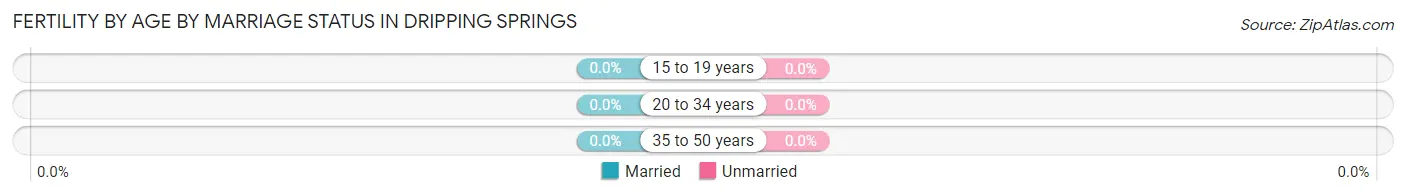
| Age Bracket | Married | Unmarried |
| 15 to 19 years | 0 (0.0%) | 0 (0.0%) |
| 20 to 34 years | 0 (0.0%) | 0 (0.0%) |
| 35 to 50 years | 0 (0.0%) | 0 (0.0%) |
| Total | 0 (0.0%) | 0 (0.0%) |
Fertility by Education in Dripping Springs
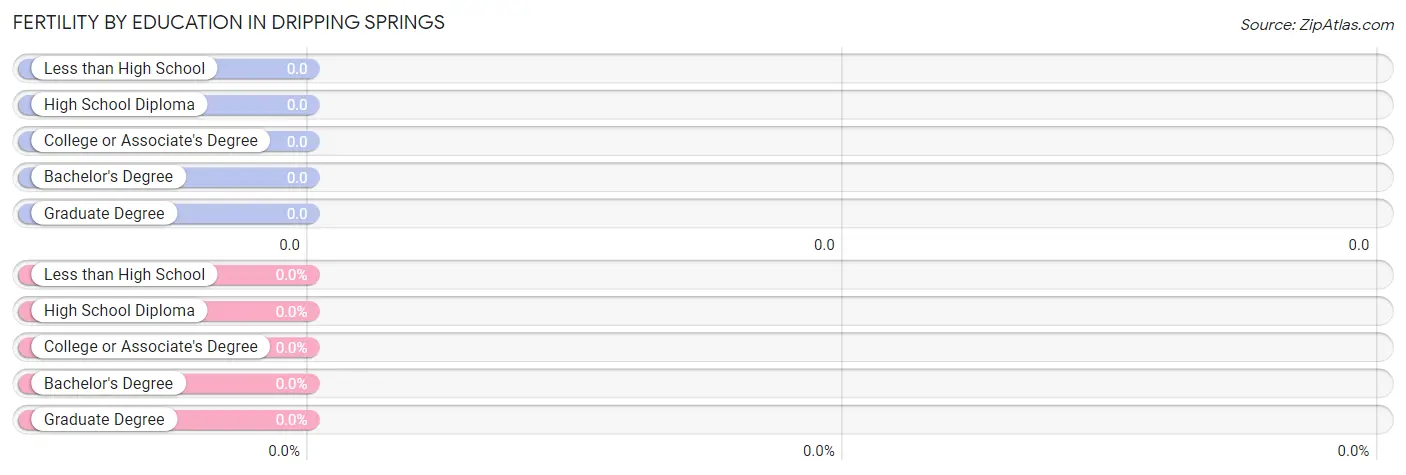
| Educational Attainment | Women with Births | Births / 1,000 Women |
| Less than High School | 0 (0.0%) | 0.0 |
| High School Diploma | 0 (0.0%) | 0.0 |
| College or Associate's Degree | 0 (0.0%) | 0.0 |
| Bachelor's Degree | 0 (0.0%) | 0.0 |
| Graduate Degree | 0 (0.0%) | 0.0 |
| Total | 0 (0.0%) | 0.0 |
Fertility by Education by Marriage Status in Dripping Springs
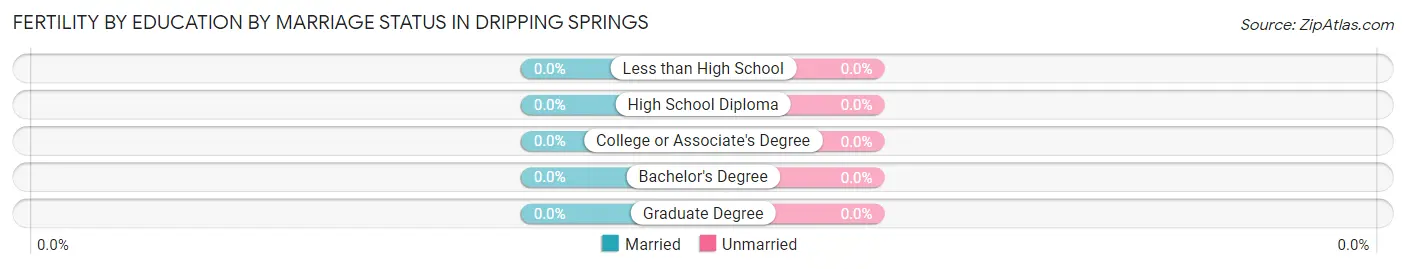
| Educational Attainment | Married | Unmarried |
| Less than High School | 0 (0.0%) | 0 (0.0%) |
| High School Diploma | 0 (0.0%) | 0 (0.0%) |
| College or Associate's Degree | 0 (0.0%) | 0 (0.0%) |
| Bachelor's Degree | 0 (0.0%) | 0 (0.0%) |
| Graduate Degree | 0 (0.0%) | 0 (0.0%) |
| Total | 0 (0.0%) | 0 (0.0%) |
Employment Characteristics in Dripping Springs
Employment by Class of Employer in Dripping Springs
Among the 92 employed individuals in Dripping Springs, private company employees (61 | 66.3%), self-employed (not incorporated) (24 | 26.1%), and local government employees (4 | 4.3%) make up the most common classes of employment.
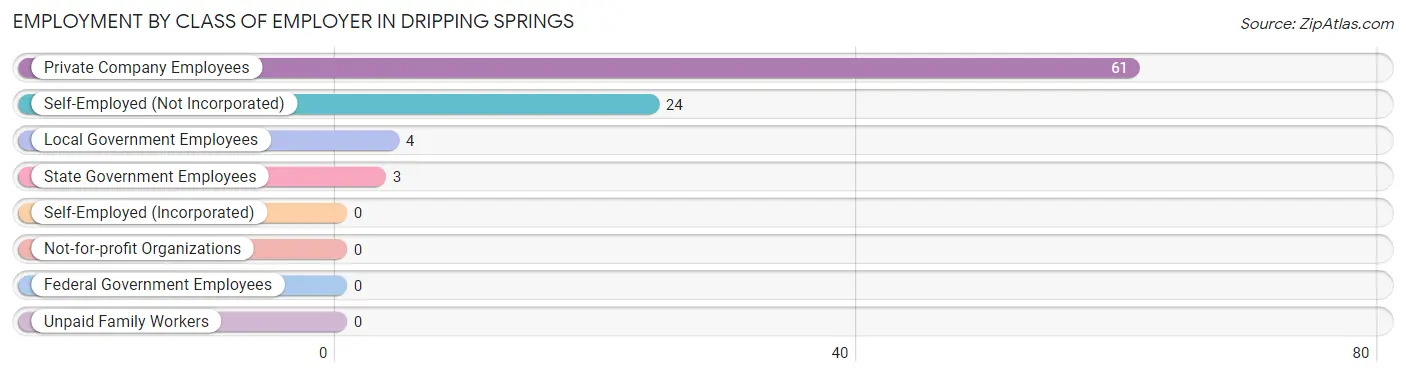
| Employer Class | # Employees | % Employees |
| Private Company Employees | 61 | 66.3% |
| Self-Employed (Incorporated) | 0 | 0.0% |
| Self-Employed (Not Incorporated) | 24 | 26.1% |
| Not-for-profit Organizations | 0 | 0.0% |
| Local Government Employees | 4 | 4.3% |
| State Government Employees | 3 | 3.3% |
| Federal Government Employees | 0 | 0.0% |
| Unpaid Family Workers | 0 | 0.0% |
| Total | 92 | 100.0% |
Employment Status by Age in Dripping Springs
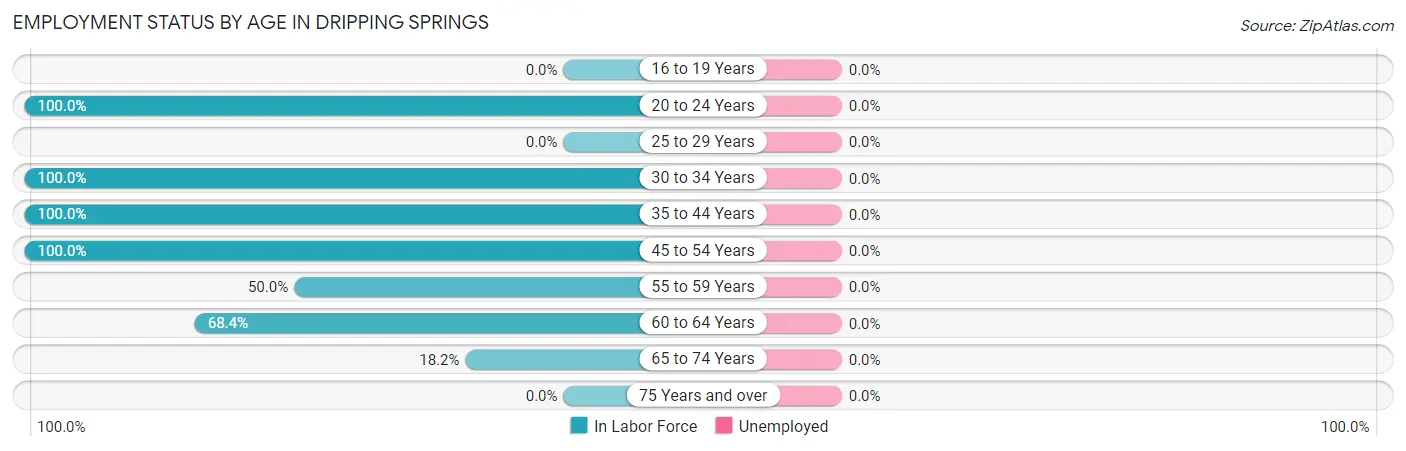
| Age Bracket | In Labor Force | Unemployed |
| 16 to 19 Years | 0 (0.0%) | 0 (0.0%) |
| 20 to 24 Years | 4 (100.0%) | 0 (0.0%) |
| 25 to 29 Years | 0 (0.0%) | 0 (0.0%) |
| 30 to 34 Years | 19 (100.0%) | 0 (0.0%) |
| 35 to 44 Years | 20 (100.0%) | 0 (0.0%) |
| 45 to 54 Years | 12 (100.0%) | 0 (0.0%) |
| 55 to 59 Years | 3 (50.0%) | 0 (0.0%) |
| 60 to 64 Years | 26 (68.4%) | 0 (0.0%) |
| 65 to 74 Years | 8 (18.2%) | 0 (0.0%) |
| 75 Years and over | 0 (0.0%) | 0 (0.0%) |
| Total | 92 (55.1%) | 0 (0.0%) |
Employment Status by Educational Attainment in Dripping Springs
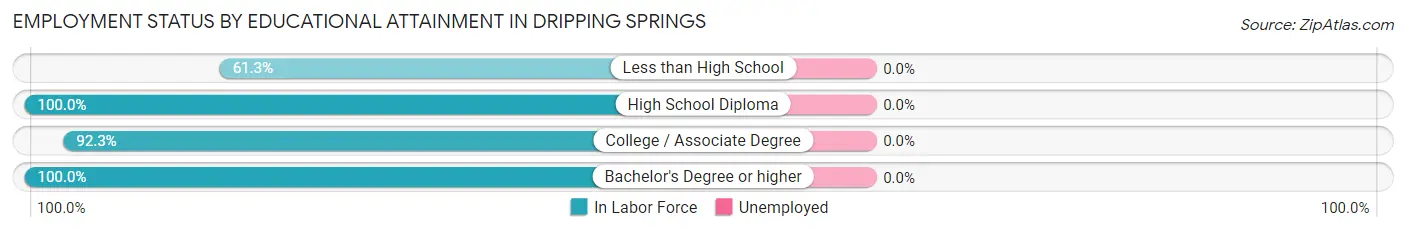
| Educational Attainment | In Labor Force | Unemployed |
| Less than High School | 19 (61.3%) | 0 (0.0%) |
| High School Diploma | 18 (100.0%) | 0 (0.0%) |
| College / Associate Degree | 36 (92.3%) | 0 (0.0%) |
| Bachelor's Degree or higher | 7 (100.0%) | 0 (0.0%) |
| Total | 80 (84.2%) | 0 (0.0%) |
Employment Occupations by Sex in Dripping Springs
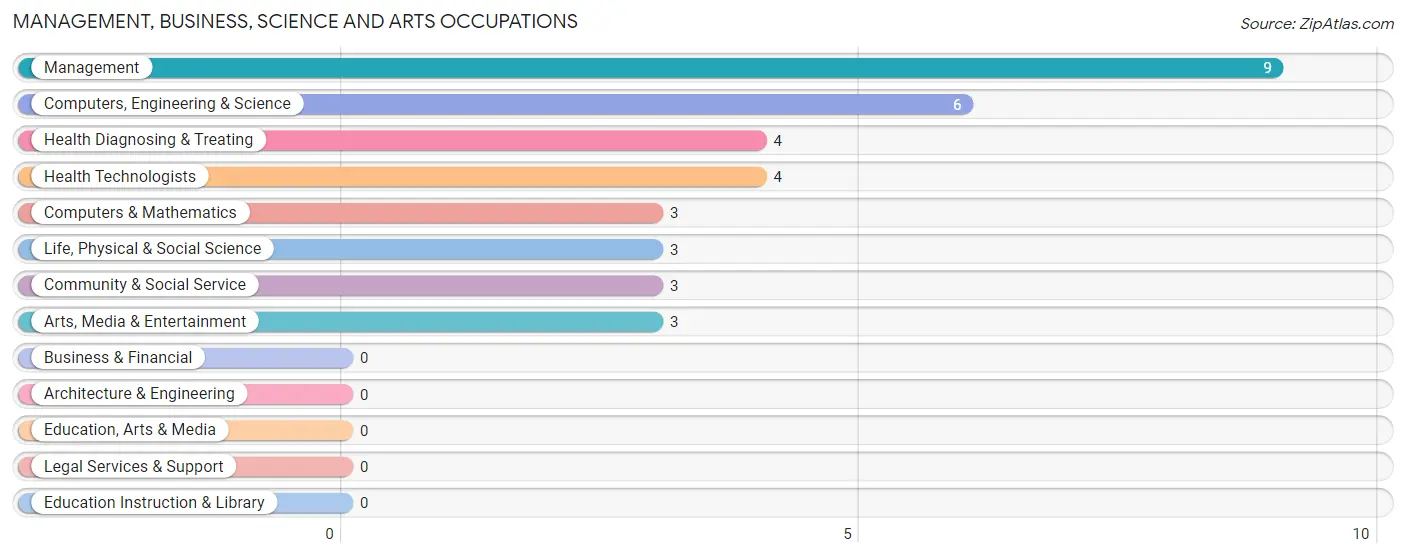
Management, Business, Science and Arts Occupations
The most common Management, Business, Science and Arts occupations in Dripping Springs are Management (9 | 9.8%), Computers, Engineering & Science (6 | 6.5%), Health Diagnosing & Treating (4 | 4.3%), Health Technologists (4 | 4.3%), and Computers & Mathematics (3 | 3.3%).
Management, Business, Science and Arts Occupations by Sex
Within the Management, Business, Science and Arts occupations in Dripping Springs, the most male-oriented occupations are Life, Physical & Social Science (100.0%), Management (55.6%), and Computers, Engineering & Science (50.0%), while the most female-oriented occupations are Computers & Mathematics (100.0%), Community & Social Service (100.0%), and Arts, Media & Entertainment (100.0%).
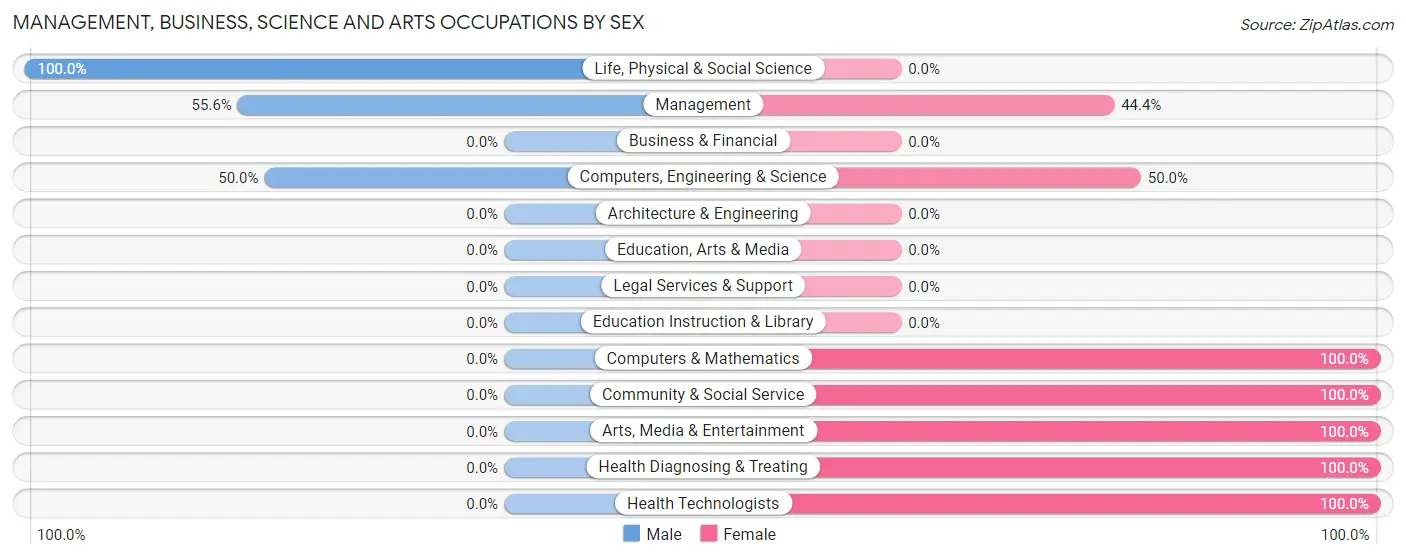
| Occupation | Male | Female |
| Management | 5 (55.6%) | 4 (44.4%) |
| Business & Financial | 0 (0.0%) | 0 (0.0%) |
| Computers, Engineering & Science | 3 (50.0%) | 3 (50.0%) |
| Computers & Mathematics | 0 (0.0%) | 3 (100.0%) |
| Architecture & Engineering | 0 (0.0%) | 0 (0.0%) |
| Life, Physical & Social Science | 3 (100.0%) | 0 (0.0%) |
| Community & Social Service | 0 (0.0%) | 3 (100.0%) |
| Education, Arts & Media | 0 (0.0%) | 0 (0.0%) |
| Legal Services & Support | 0 (0.0%) | 0 (0.0%) |
| Education Instruction & Library | 0 (0.0%) | 0 (0.0%) |
| Arts, Media & Entertainment | 0 (0.0%) | 3 (100.0%) |
| Health Diagnosing & Treating | 0 (0.0%) | 4 (100.0%) |
| Health Technologists | 0 (0.0%) | 4 (100.0%) |
| Total (Category) | 8 (36.4%) | 14 (63.6%) |
| Total (Overall) | 39 (42.4%) | 53 (57.6%) |
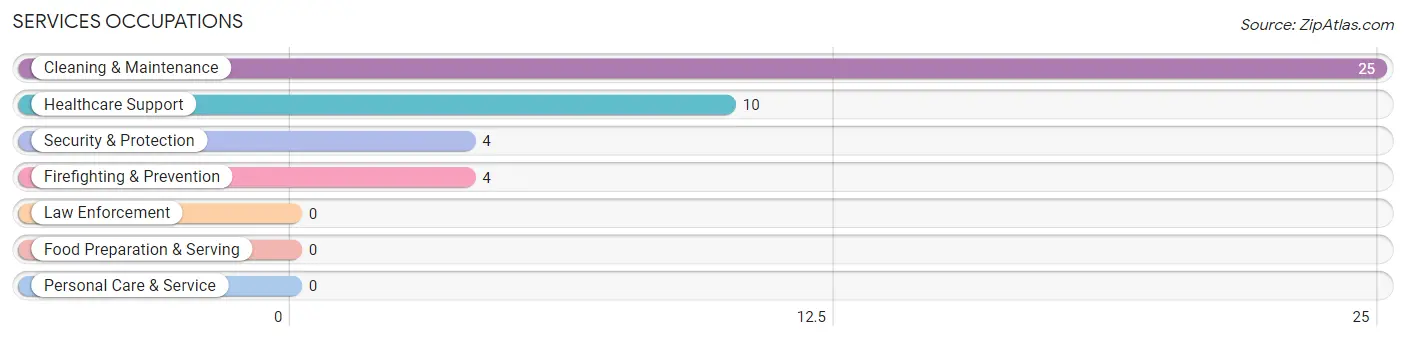
Services Occupations
The most common Services occupations in Dripping Springs are Cleaning & Maintenance (25 | 27.2%), Healthcare Support (10 | 10.9%), Security & Protection (4 | 4.3%), and Firefighting & Prevention (4 | 4.3%).
Services Occupations by Sex
Within the Services occupations in Dripping Springs, the most male-oriented occupations are Security & Protection (100.0%), and Firefighting & Prevention (100.0%), while the most female-oriented occupations are Healthcare Support (100.0%), and Cleaning & Maintenance (100.0%).
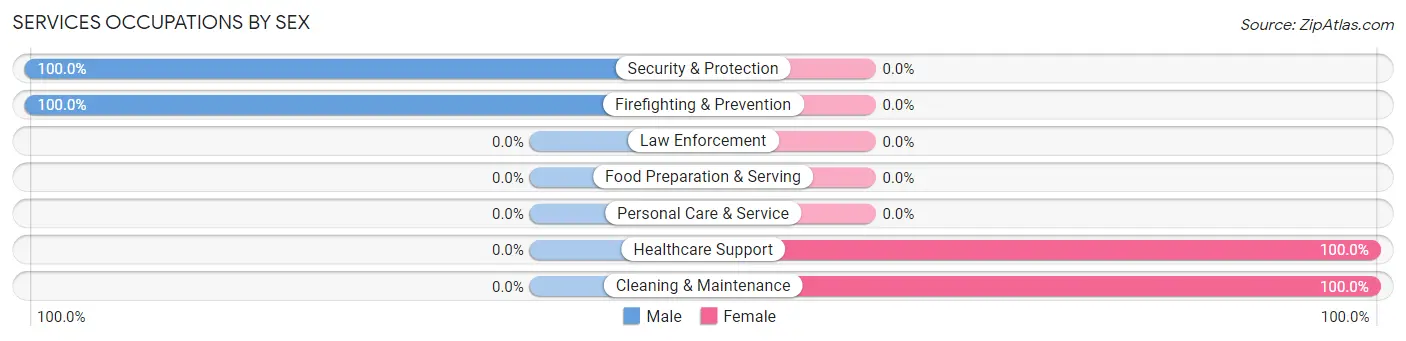
| Occupation | Male | Female |
| Healthcare Support | 0 (0.0%) | 10 (100.0%) |
| Security & Protection | 4 (100.0%) | 0 (0.0%) |
| Firefighting & Prevention | 4 (100.0%) | 0 (0.0%) |
| Law Enforcement | 0 (0.0%) | 0 (0.0%) |
| Food Preparation & Serving | 0 (0.0%) | 0 (0.0%) |
| Cleaning & Maintenance | 0 (0.0%) | 25 (100.0%) |
| Personal Care & Service | 0 (0.0%) | 0 (0.0%) |
| Total (Category) | 4 (10.3%) | 35 (89.7%) |
| Total (Overall) | 39 (42.4%) | 53 (57.6%) |
Sales and Office Occupations
The most common Sales and Office occupations in Dripping Springs are Sales & Related (4 | 4.3%), and Office & Administration (4 | 4.3%).
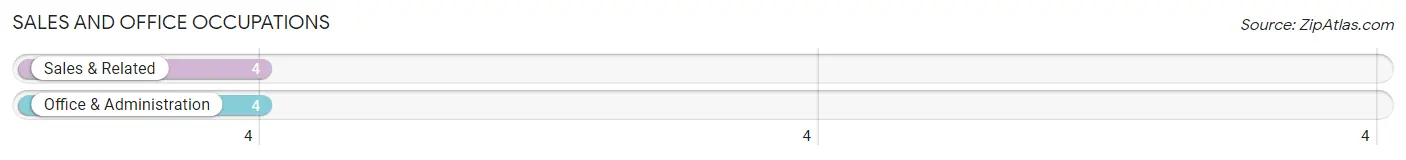
Sales and Office Occupations by Sex
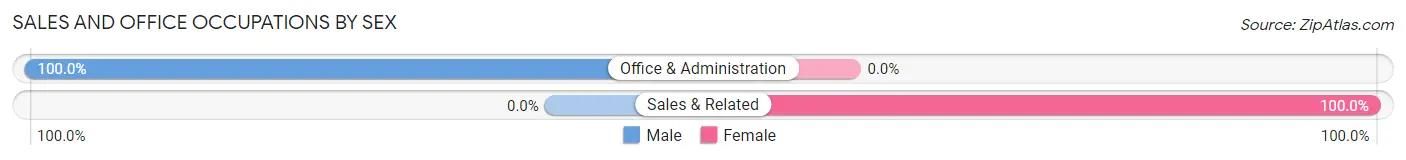
| Occupation | Male | Female |
| Sales & Related | 0 (0.0%) | 4 (100.0%) |
| Office & Administration | 4 (100.0%) | 0 (0.0%) |
| Total (Category) | 4 (50.0%) | 4 (50.0%) |
| Total (Overall) | 39 (42.4%) | 53 (57.6%) |
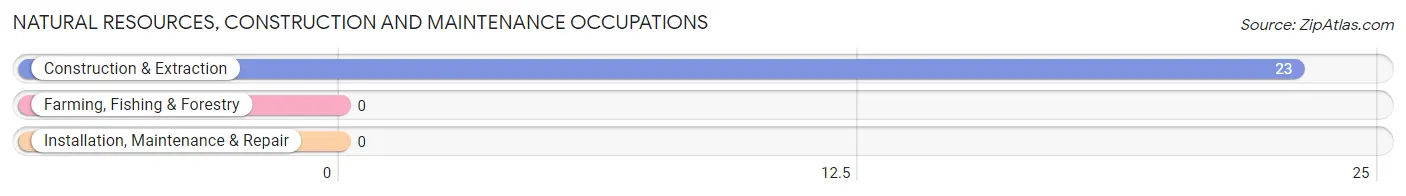
Natural Resources, Construction and Maintenance Occupations
The most common Natural Resources, Construction and Maintenance occupations in Dripping Springs are , and Construction & Extraction (23 | 25.0%).
Natural Resources, Construction and Maintenance Occupations by Sex
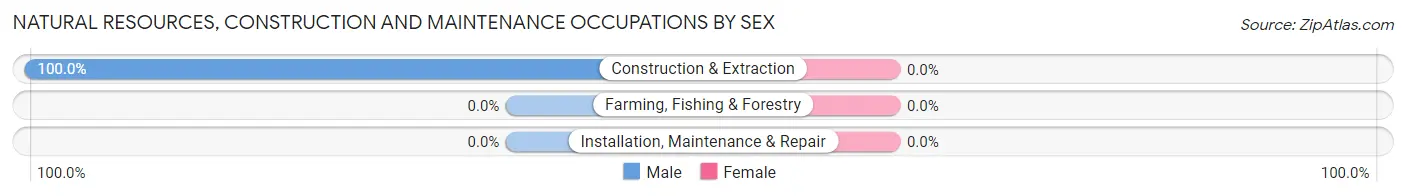
| Occupation | Male | Female |
| Farming, Fishing & Forestry | 0 (0.0%) | 0 (0.0%) |
| Construction & Extraction | 23 (100.0%) | 0 (0.0%) |
| Installation, Maintenance & Repair | 0 (0.0%) | 0 (0.0%) |
| Total (Category) | 23 (100.0%) | 0 (0.0%) |
| Total (Overall) | 39 (42.4%) | 53 (57.6%) |
Production, Transportation and Moving Occupations
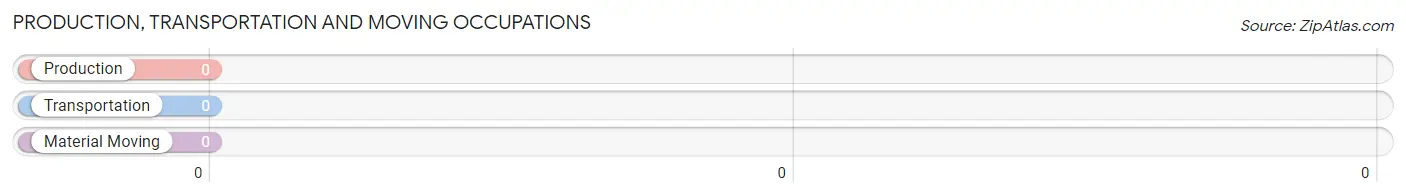
Production, Transportation and Moving Occupations by Sex
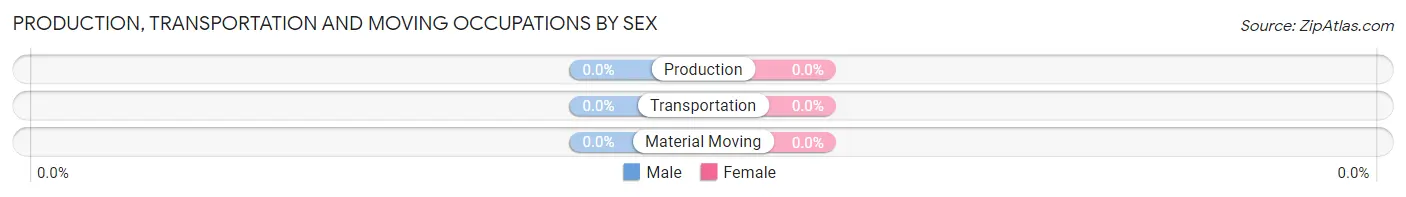
| Occupation | Male | Female |
| Production | 0 (0.0%) | 0 (0.0%) |
| Transportation | 0 (0.0%) | 0 (0.0%) |
| Material Moving | 0 (0.0%) | 0 (0.0%) |
| Total (Category) | 0 (0.0%) | 0 (0.0%) |
| Total (Overall) | 39 (42.4%) | 53 (57.6%) |
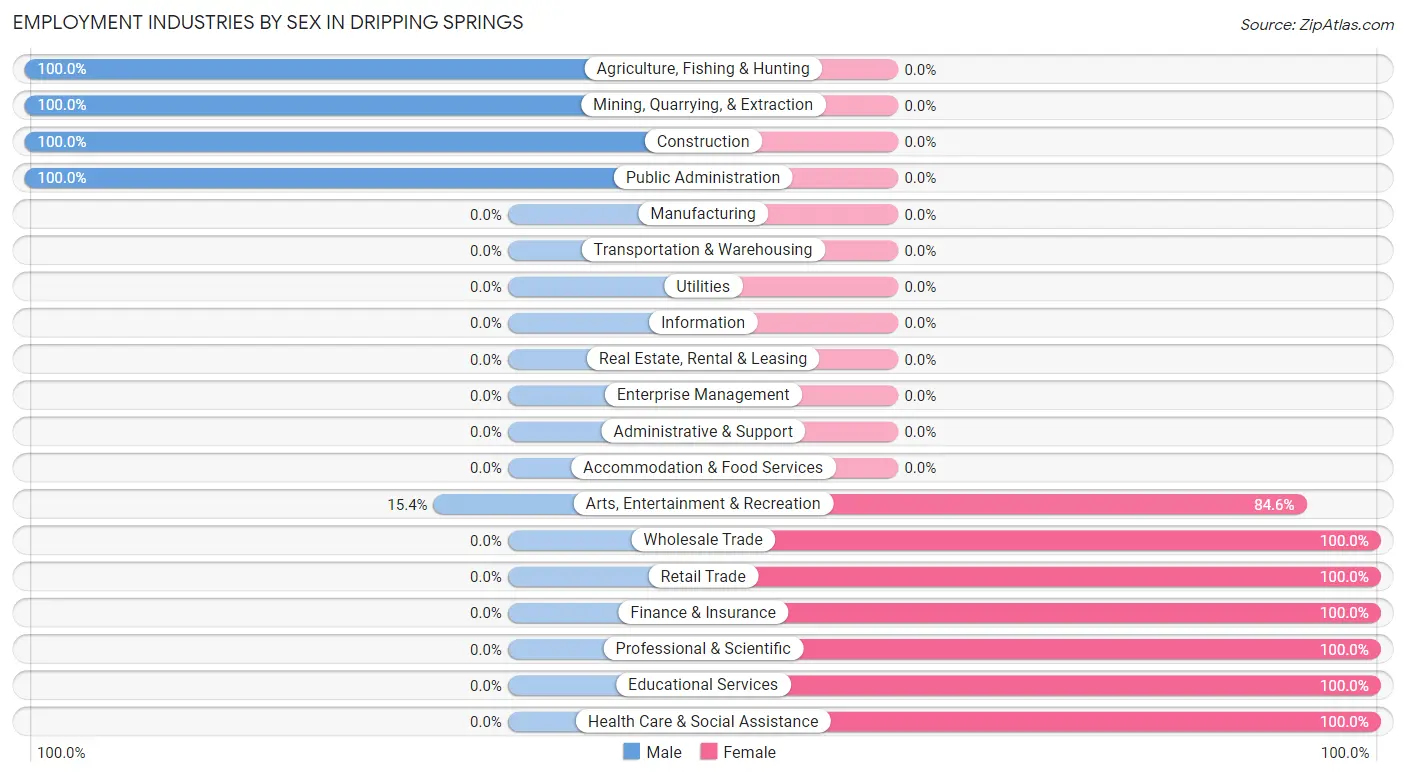
Employment Industries by Sex in Dripping Springs
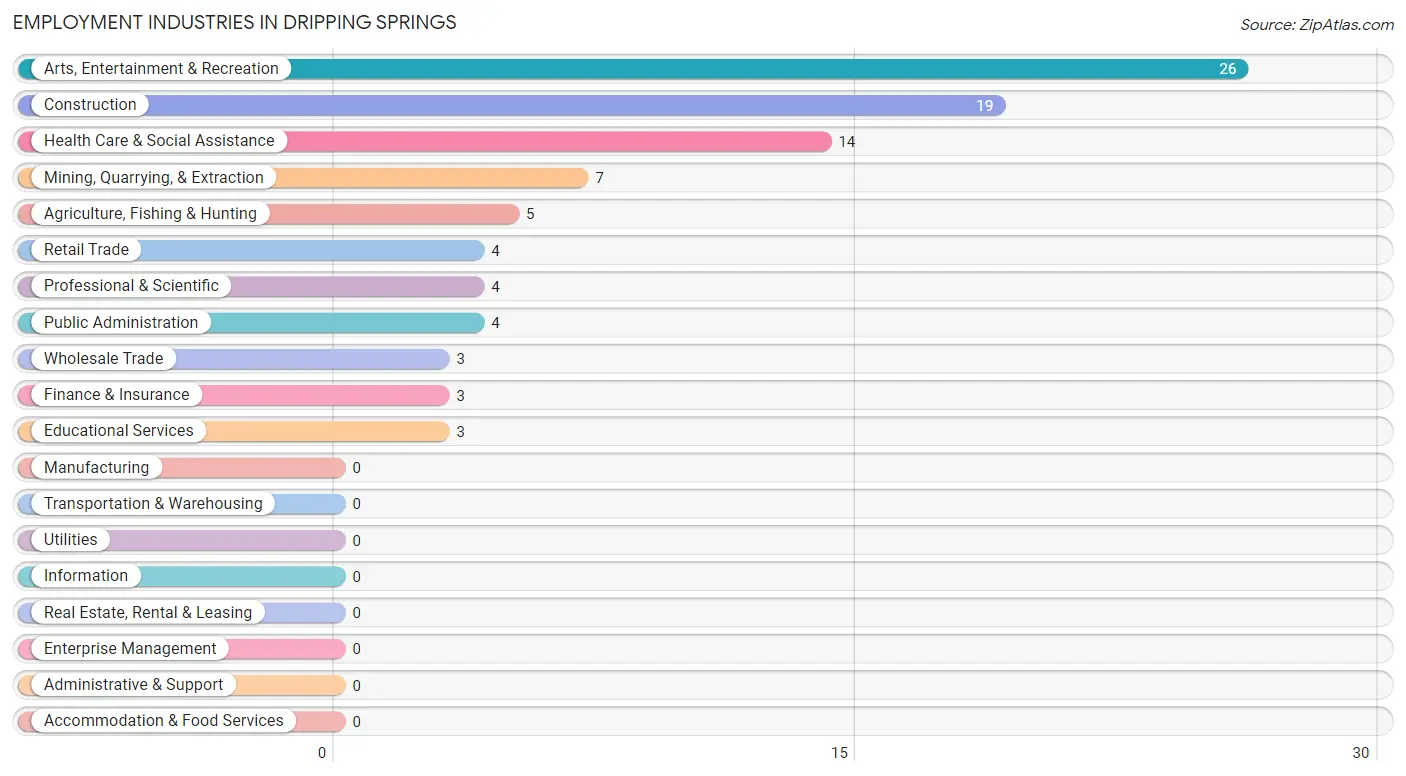
Employment Industries in Dripping Springs
The major employment industries in Dripping Springs include Arts, Entertainment & Recreation (26 | 28.3%), Construction (19 | 20.6%), Health Care & Social Assistance (14 | 15.2%), Mining, Quarrying, & Extraction (7 | 7.6%), and Agriculture, Fishing & Hunting (5 | 5.4%).
Employment Industries by Sex in Dripping Springs
The Dripping Springs industries that see more men than women are Agriculture, Fishing & Hunting (100.0%), Mining, Quarrying, & Extraction (100.0%), and Construction (100.0%), whereas the industries that tend to have a higher number of women are Wholesale Trade (100.0%), Retail Trade (100.0%), and Finance & Insurance (100.0%).
| Industry | Male | Female |
| Agriculture, Fishing & Hunting | 5 (100.0%) | 0 (0.0%) |
| Mining, Quarrying, & Extraction | 7 (100.0%) | 0 (0.0%) |
| Construction | 19 (100.0%) | 0 (0.0%) |
| Manufacturing | 0 (0.0%) | 0 (0.0%) |
| Wholesale Trade | 0 (0.0%) | 3 (100.0%) |
| Retail Trade | 0 (0.0%) | 4 (100.0%) |
| Transportation & Warehousing | 0 (0.0%) | 0 (0.0%) |
| Utilities | 0 (0.0%) | 0 (0.0%) |
| Information | 0 (0.0%) | 0 (0.0%) |
| Finance & Insurance | 0 (0.0%) | 3 (100.0%) |
| Real Estate, Rental & Leasing | 0 (0.0%) | 0 (0.0%) |
| Professional & Scientific | 0 (0.0%) | 4 (100.0%) |
| Enterprise Management | 0 (0.0%) | 0 (0.0%) |
| Administrative & Support | 0 (0.0%) | 0 (0.0%) |
| Educational Services | 0 (0.0%) | 3 (100.0%) |
| Health Care & Social Assistance | 0 (0.0%) | 14 (100.0%) |
| Arts, Entertainment & Recreation | 4 (15.4%) | 22 (84.6%) |
| Accommodation & Food Services | 0 (0.0%) | 0 (0.0%) |
| Public Administration | 4 (100.0%) | 0 (0.0%) |
| Total | 39 (42.4%) | 53 (57.6%) |
Education in Dripping Springs
School Enrollment in Dripping Springs
The most common levels of schooling among the 63 students in Dripping Springs are middle school (33 | 52.4%), and kindergarten (30 | 47.6%).
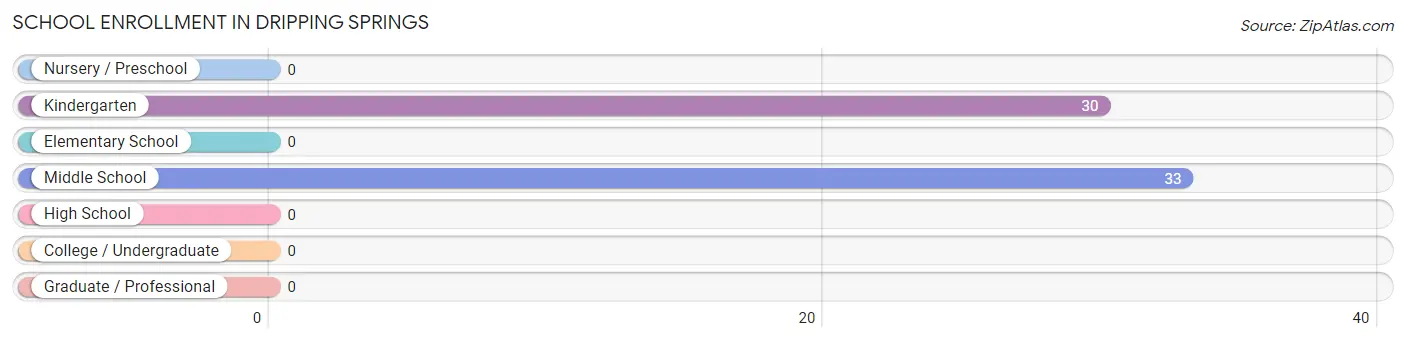
| School Level | # Students | % Students |
| Nursery / Preschool | 0 | 0.0% |
| Kindergarten | 30 | 47.6% |
| Elementary School | 0 | 0.0% |
| Middle School | 33 | 52.4% |
| High School | 0 | 0.0% |
| College / Undergraduate | 0 | 0.0% |
| Graduate / Professional | 0 | 0.0% |
| Total | 63 | 100.0% |
School Enrollment by Age by Funding Source in Dripping Springs
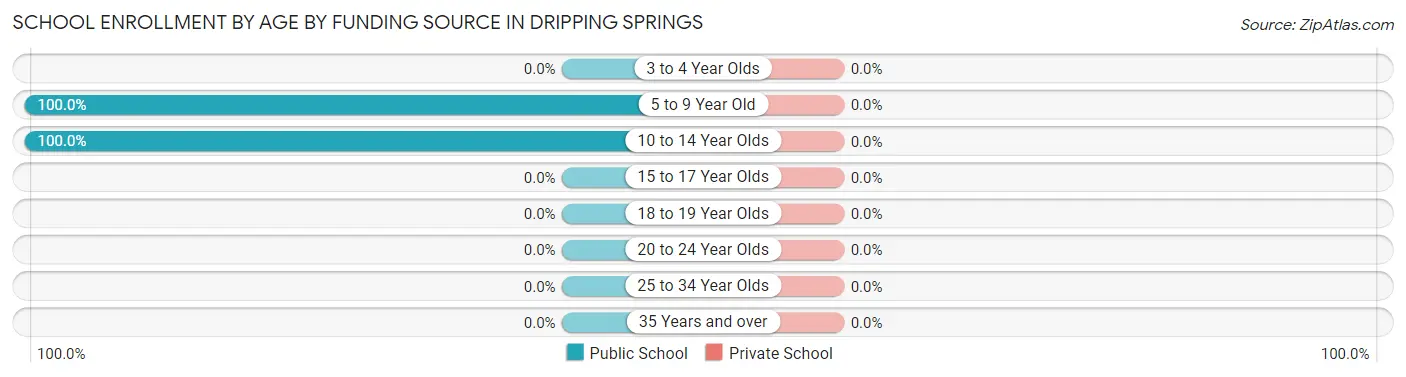
| Age Bracket | Public School | Private School |
| 3 to 4 Year Olds | 0 (0.0%) | 0 (0.0%) |
| 5 to 9 Year Old | 30 (100.0%) | 0 (0.0%) |
| 10 to 14 Year Olds | 33 (100.0%) | 0 (0.0%) |
| 15 to 17 Year Olds | 0 (0.0%) | 0 (0.0%) |
| 18 to 19 Year Olds | 0 (0.0%) | 0 (0.0%) |
| 20 to 24 Year Olds | 0 (0.0%) | 0 (0.0%) |
| 25 to 34 Year Olds | 0 (0.0%) | 0 (0.0%) |
| 35 Years and over | 0 (0.0%) | 0 (0.0%) |
| Total | 63 (100.0%) | 0 (0.0%) |
Educational Attainment by Field of Study in Dripping Springs
Education (10 | 71.4%), and business (4 | 28.6%) are the most common fields of study among 14 individuals in Dripping Springs who have obtained a bachelor's degree or higher.
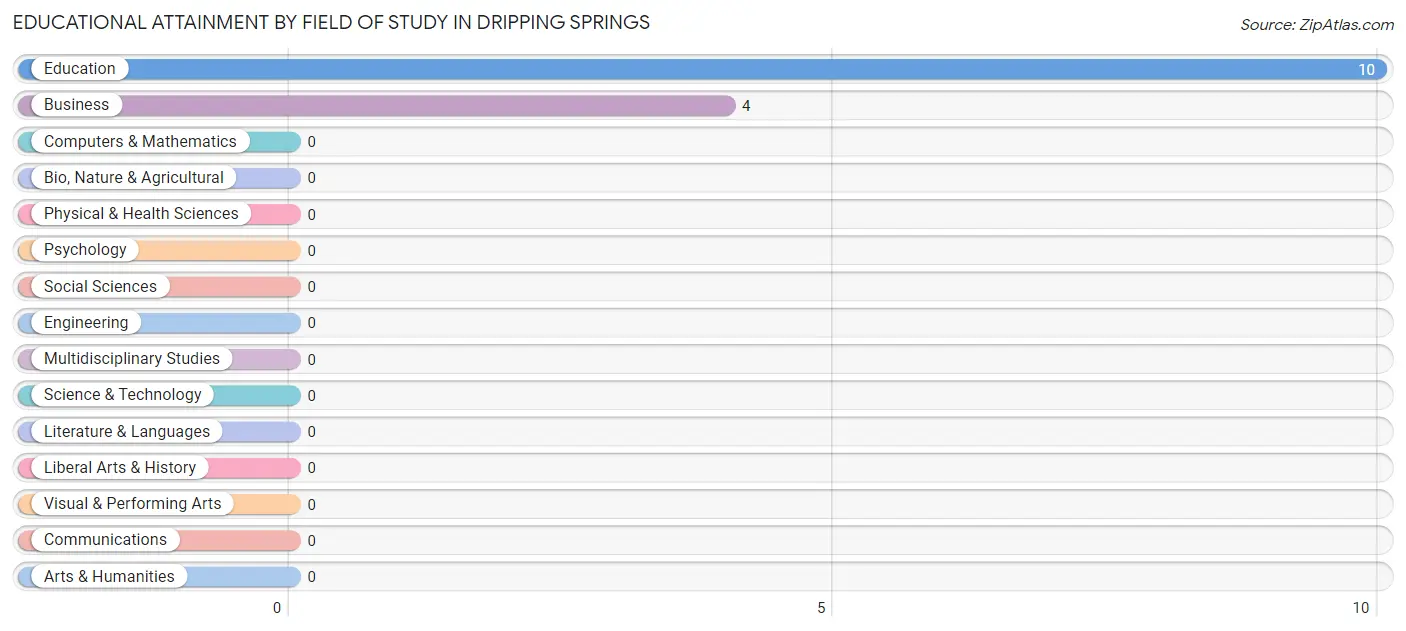
| Field of Study | # Graduates | % Graduates |
| Computers & Mathematics | 0 | 0.0% |
| Bio, Nature & Agricultural | 0 | 0.0% |
| Physical & Health Sciences | 0 | 0.0% |
| Psychology | 0 | 0.0% |
| Social Sciences | 0 | 0.0% |
| Engineering | 0 | 0.0% |
| Multidisciplinary Studies | 0 | 0.0% |
| Science & Technology | 0 | 0.0% |
| Business | 4 | 28.6% |
| Education | 10 | 71.4% |
| Literature & Languages | 0 | 0.0% |
| Liberal Arts & History | 0 | 0.0% |
| Visual & Performing Arts | 0 | 0.0% |
| Communications | 0 | 0.0% |
| Arts & Humanities | 0 | 0.0% |
| Total | 14 | 100.0% |
Transportation & Commute in Dripping Springs
Vehicle Availability by Sex in Dripping Springs
The most prevalent vehicle ownership categories in Dripping Springs are males with 2 vehicles (19, accounting for 48.7%) and females with 2 vehicles (32, making up 35.8%).
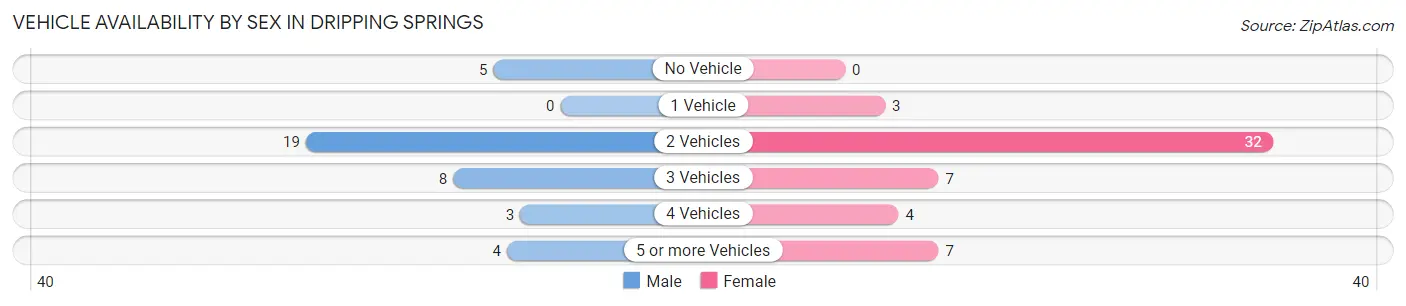
| Vehicles Available | Male | Female |
| No Vehicle | 5 (12.8%) | 0 (0.0%) |
| 1 Vehicle | 0 (0.0%) | 3 (5.7%) |
| 2 Vehicles | 19 (48.7%) | 32 (60.4%) |
| 3 Vehicles | 8 (20.5%) | 7 (13.2%) |
| 4 Vehicles | 3 (7.7%) | 4 (7.5%) |
| 5 or more Vehicles | 4 (10.3%) | 7 (13.2%) |
| Total | 39 (100.0%) | 53 (100.0%) |
Commute Time in Dripping Springs
The most frequently occuring commute durations in Dripping Springs are 90 or more minutes (33 commuters, 35.9%), 10 to 14 minutes (28 commuters, 30.4%), and 60 to 89 minutes (13 commuters, 14.1%).
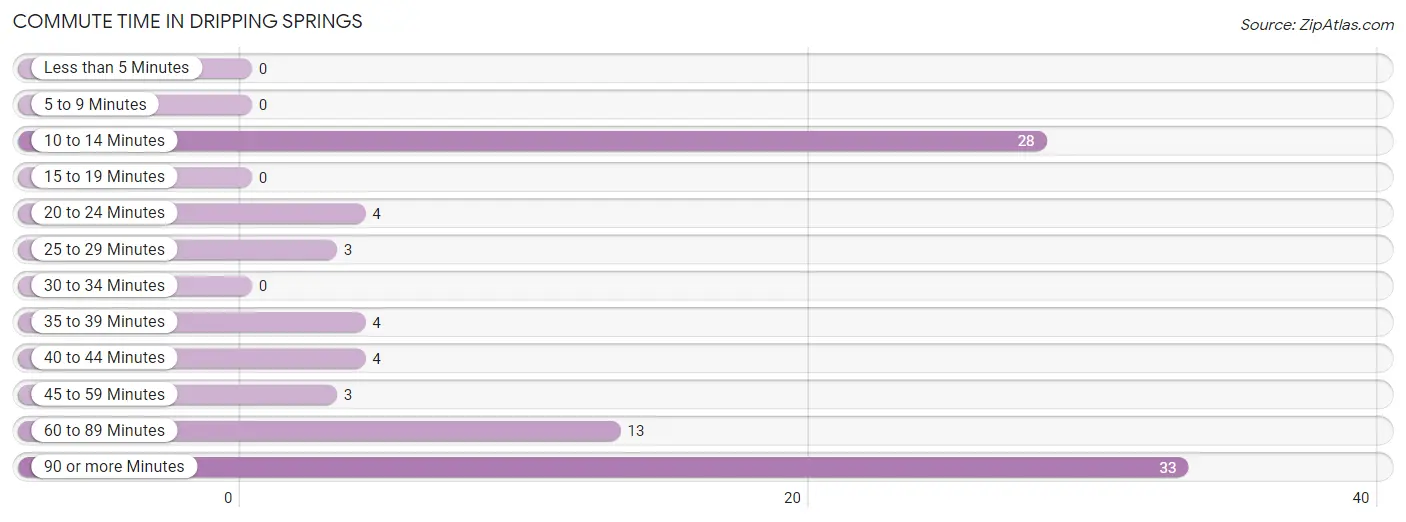
| Commute Time | # Commuters | % Commuters |
| Less than 5 Minutes | 0 | 0.0% |
| 5 to 9 Minutes | 0 | 0.0% |
| 10 to 14 Minutes | 28 | 30.4% |
| 15 to 19 Minutes | 0 | 0.0% |
| 20 to 24 Minutes | 4 | 4.3% |
| 25 to 29 Minutes | 3 | 3.3% |
| 30 to 34 Minutes | 0 | 0.0% |
| 35 to 39 Minutes | 4 | 4.3% |
| 40 to 44 Minutes | 4 | 4.3% |
| 45 to 59 Minutes | 3 | 3.3% |
| 60 to 89 Minutes | 13 | 14.1% |
| 90 or more Minutes | 33 | 35.9% |
Commute Time by Sex in Dripping Springs
The most common commute times in Dripping Springs are 10 to 14 minutes (28 commuters, 71.8%) for males and 90 or more minutes (33 commuters, 62.3%) for females.
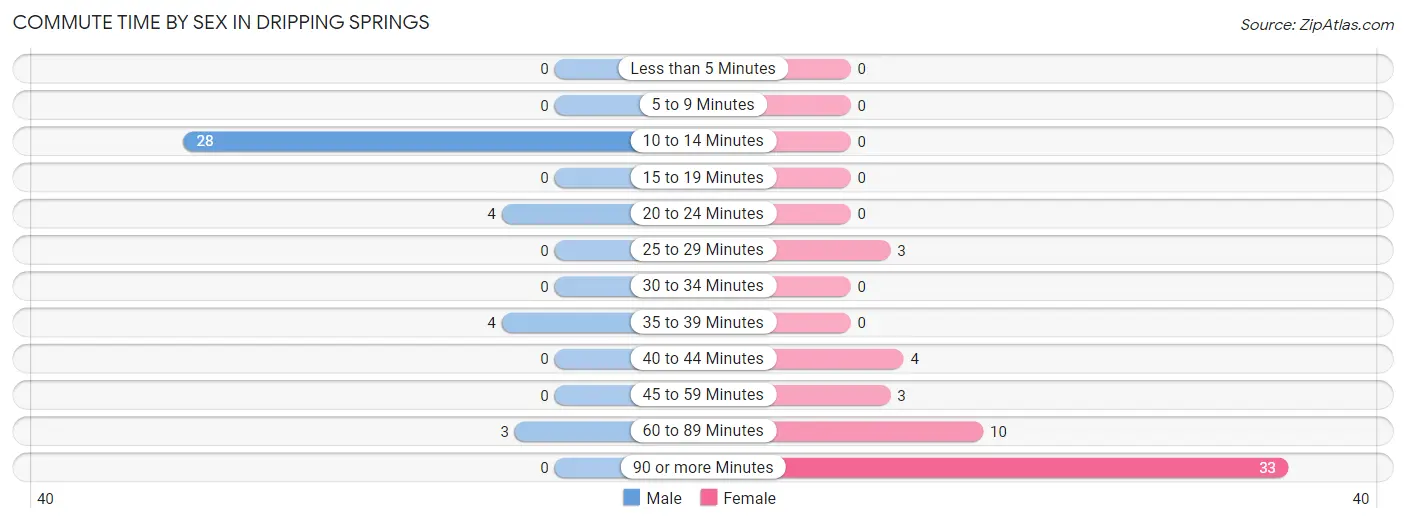
| Commute Time | Male | Female |
| Less than 5 Minutes | 0 (0.0%) | 0 (0.0%) |
| 5 to 9 Minutes | 0 (0.0%) | 0 (0.0%) |
| 10 to 14 Minutes | 28 (71.8%) | 0 (0.0%) |
| 15 to 19 Minutes | 0 (0.0%) | 0 (0.0%) |
| 20 to 24 Minutes | 4 (10.3%) | 0 (0.0%) |
| 25 to 29 Minutes | 0 (0.0%) | 3 (5.7%) |
| 30 to 34 Minutes | 0 (0.0%) | 0 (0.0%) |
| 35 to 39 Minutes | 4 (10.3%) | 0 (0.0%) |
| 40 to 44 Minutes | 0 (0.0%) | 4 (7.5%) |
| 45 to 59 Minutes | 0 (0.0%) | 3 (5.7%) |
| 60 to 89 Minutes | 3 (7.7%) | 10 (18.9%) |
| 90 or more Minutes | 0 (0.0%) | 33 (62.3%) |
Time of Departure to Work by Sex in Dripping Springs
The most frequent times of departure to work in Dripping Springs are 5:00 AM to 5:29 AM (19, 48.7%) for males and 12:00 AM to 4:59 AM (22, 41.5%) for females.
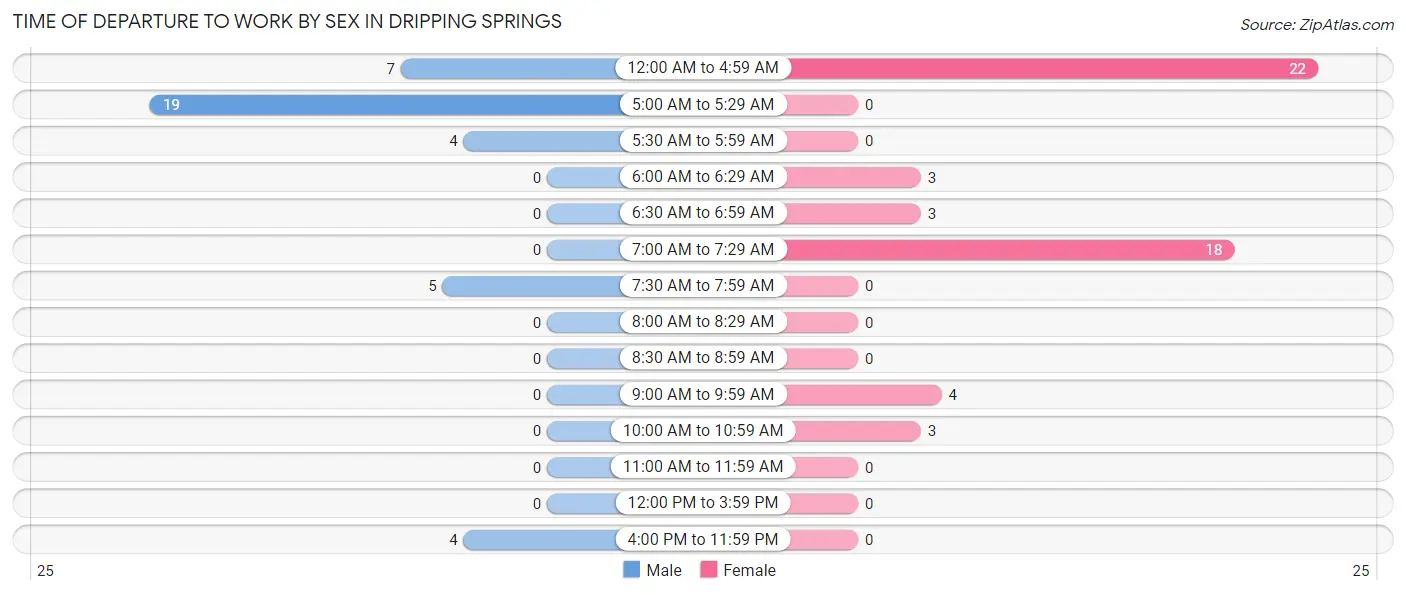
| Time of Departure | Male | Female |
| 12:00 AM to 4:59 AM | 7 (17.9%) | 22 (41.5%) |
| 5:00 AM to 5:29 AM | 19 (48.7%) | 0 (0.0%) |
| 5:30 AM to 5:59 AM | 4 (10.3%) | 0 (0.0%) |
| 6:00 AM to 6:29 AM | 0 (0.0%) | 3 (5.7%) |
| 6:30 AM to 6:59 AM | 0 (0.0%) | 3 (5.7%) |
| 7:00 AM to 7:29 AM | 0 (0.0%) | 18 (34.0%) |
| 7:30 AM to 7:59 AM | 5 (12.8%) | 0 (0.0%) |
| 8:00 AM to 8:29 AM | 0 (0.0%) | 0 (0.0%) |
| 8:30 AM to 8:59 AM | 0 (0.0%) | 0 (0.0%) |
| 9:00 AM to 9:59 AM | 0 (0.0%) | 4 (7.5%) |
| 10:00 AM to 10:59 AM | 0 (0.0%) | 3 (5.7%) |
| 11:00 AM to 11:59 AM | 0 (0.0%) | 0 (0.0%) |
| 12:00 PM to 3:59 PM | 0 (0.0%) | 0 (0.0%) |
| 4:00 PM to 11:59 PM | 4 (10.3%) | 0 (0.0%) |
| Total | 39 (100.0%) | 53 (100.0%) |
Housing Occupancy in Dripping Springs
Occupancy by Ownership in Dripping Springs
Of the total 81 dwellings in Dripping Springs, owner-occupied units account for 56 (69.1%), while renter-occupied units make up 25 (30.9%).
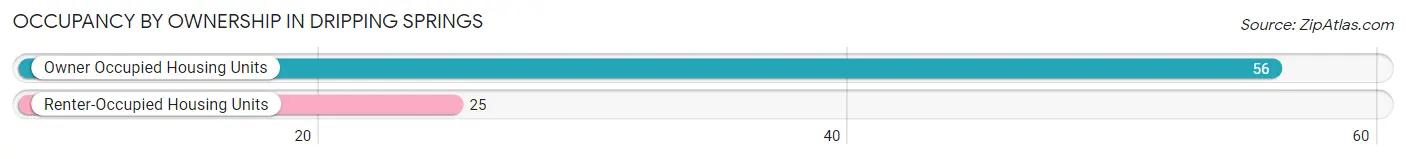
| Occupancy | # Housing Units | % Housing Units |
| Owner Occupied Housing Units | 56 | 69.1% |
| Renter-Occupied Housing Units | 25 | 30.9% |
| Total Occupied Housing Units | 81 | 100.0% |
Occupancy by Household Size in Dripping Springs
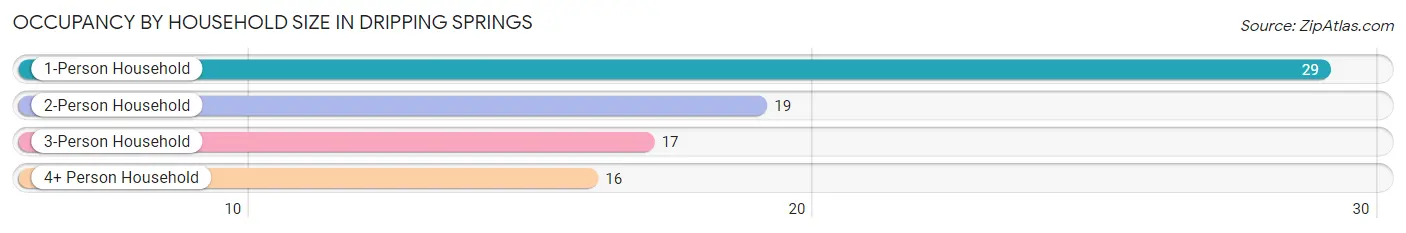
| Household Size | # Housing Units | % Housing Units |
| 1-Person Household | 29 | 35.8% |
| 2-Person Household | 19 | 23.5% |
| 3-Person Household | 17 | 21.0% |
| 4+ Person Household | 16 | 19.8% |
| Total Housing Units | 81 | 100.0% |
Occupancy by Ownership by Household Size in Dripping Springs
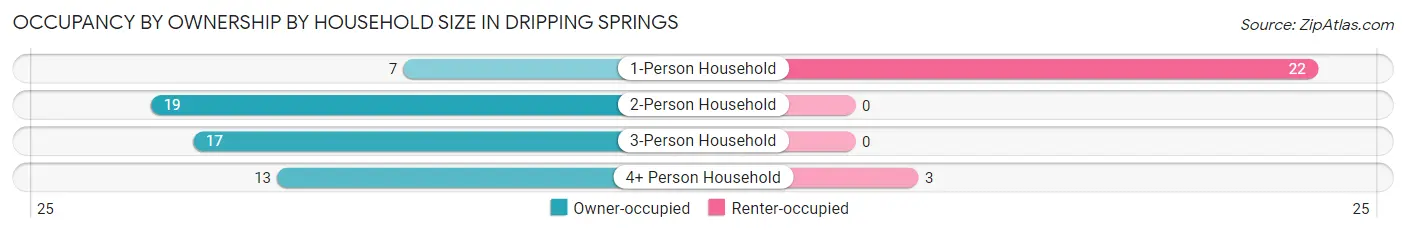
| Household Size | Owner-occupied | Renter-occupied |
| 1-Person Household | 7 (24.1%) | 22 (75.9%) |
| 2-Person Household | 19 (100.0%) | 0 (0.0%) |
| 3-Person Household | 17 (100.0%) | 0 (0.0%) |
| 4+ Person Household | 13 (81.2%) | 3 (18.8%) |
| Total Housing Units | 56 (69.1%) | 25 (30.9%) |
Occupancy by Educational Attainment in Dripping Springs
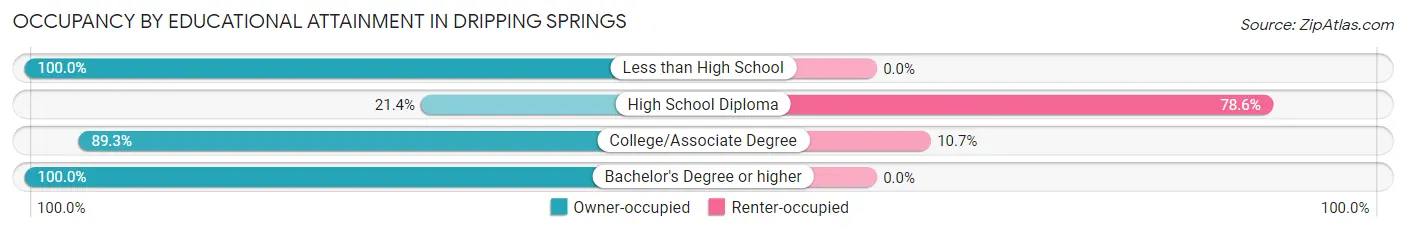
| Household Size | Owner-occupied | Renter-occupied |
| Less than High School | 15 (100.0%) | 0 (0.0%) |
| High School Diploma | 6 (21.4%) | 22 (78.6%) |
| College/Associate Degree | 25 (89.3%) | 3 (10.7%) |
| Bachelor's Degree or higher | 10 (100.0%) | 0 (0.0%) |
Occupancy by Age of Householder in Dripping Springs
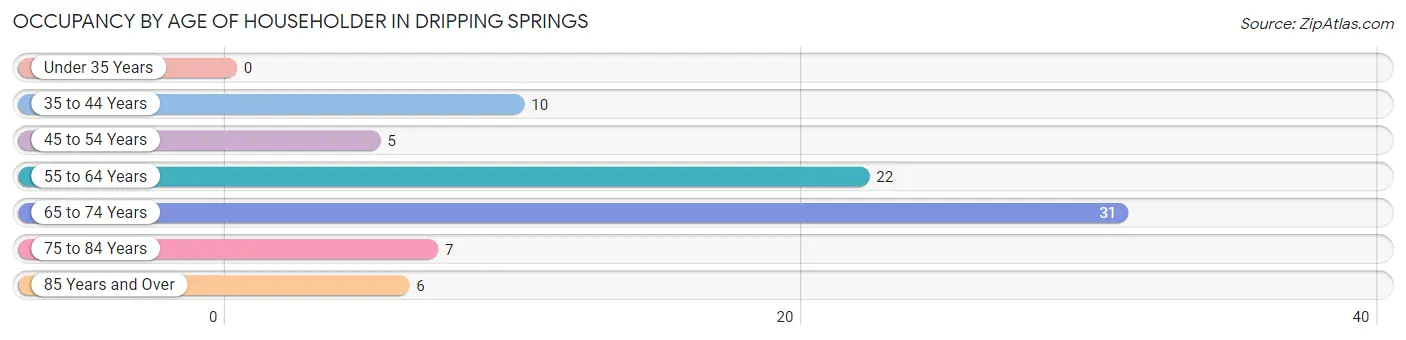
| Age Bracket | # Households | % Households |
| Under 35 Years | 0 | 0.0% |
| 35 to 44 Years | 10 | 12.3% |
| 45 to 54 Years | 5 | 6.2% |
| 55 to 64 Years | 22 | 27.2% |
| 65 to 74 Years | 31 | 38.3% |
| 75 to 84 Years | 7 | 8.6% |
| 85 Years and Over | 6 | 7.4% |
| Total | 81 | 100.0% |
Housing Finances in Dripping Springs
Median Income by Occupancy in Dripping Springs
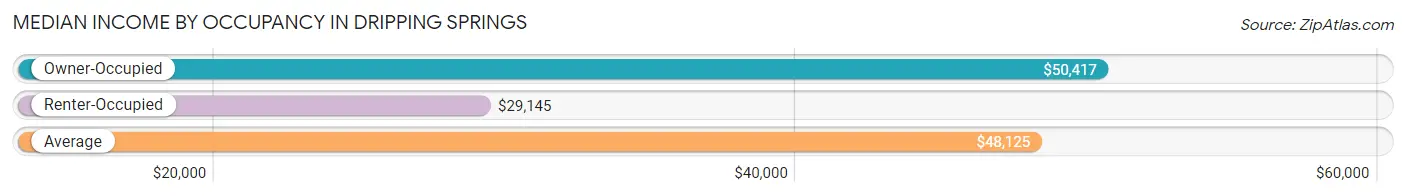
| Occupancy Type | # Households | Median Income |
| Owner-Occupied | 56 (69.1%) | $50,417 |
| Renter-Occupied | 25 (30.9%) | $29,145 |
| Average | 81 (100.0%) | $48,125 |
Occupancy by Householder Income Bracket in Dripping Springs
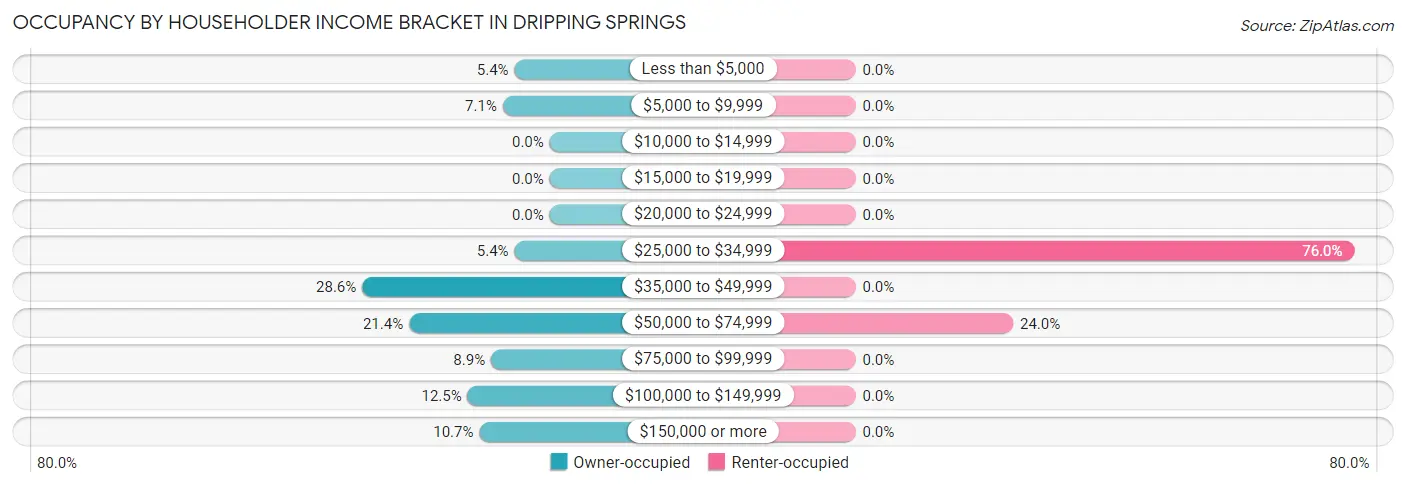
| Income Bracket | Owner-occupied | Renter-occupied |
| Less than $5,000 | 3 (5.4%) | 0 (0.0%) |
| $5,000 to $9,999 | 4 (7.1%) | 0 (0.0%) |
| $10,000 to $14,999 | 0 (0.0%) | 0 (0.0%) |
| $15,000 to $19,999 | 0 (0.0%) | 0 (0.0%) |
| $20,000 to $24,999 | 0 (0.0%) | 0 (0.0%) |
| $25,000 to $34,999 | 3 (5.4%) | 19 (76.0%) |
| $35,000 to $49,999 | 16 (28.6%) | 0 (0.0%) |
| $50,000 to $74,999 | 12 (21.4%) | 6 (24.0%) |
| $75,000 to $99,999 | 5 (8.9%) | 0 (0.0%) |
| $100,000 to $149,999 | 7 (12.5%) | 0 (0.0%) |
| $150,000 or more | 6 (10.7%) | 0 (0.0%) |
| Total | 56 (100.0%) | 25 (100.0%) |
Monthly Housing Cost Tiers in Dripping Springs
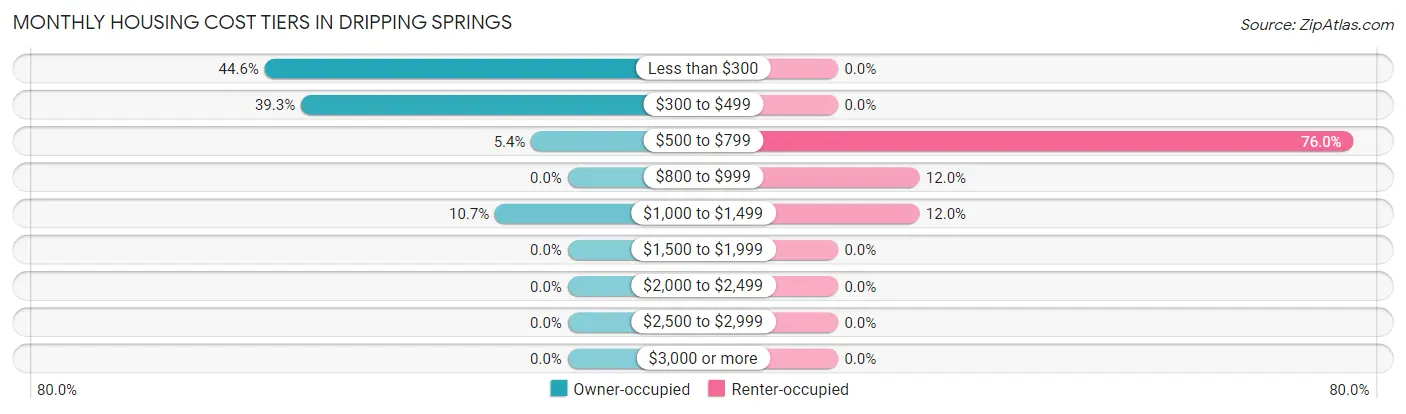
| Monthly Cost | Owner-occupied | Renter-occupied |
| Less than $300 | 25 (44.6%) | 0 (0.0%) |
| $300 to $499 | 22 (39.3%) | 0 (0.0%) |
| $500 to $799 | 3 (5.4%) | 19 (76.0%) |
| $800 to $999 | 0 (0.0%) | 3 (12.0%) |
| $1,000 to $1,499 | 6 (10.7%) | 3 (12.0%) |
| $1,500 to $1,999 | 0 (0.0%) | 0 (0.0%) |
| $2,000 to $2,499 | 0 (0.0%) | 0 (0.0%) |
| $2,500 to $2,999 | 0 (0.0%) | 0 (0.0%) |
| $3,000 or more | 0 (0.0%) | 0 (0.0%) |
| Total | 56 (100.0%) | 25 (100.0%) |
Physical Housing Characteristics in Dripping Springs
Housing Structures in Dripping Springs
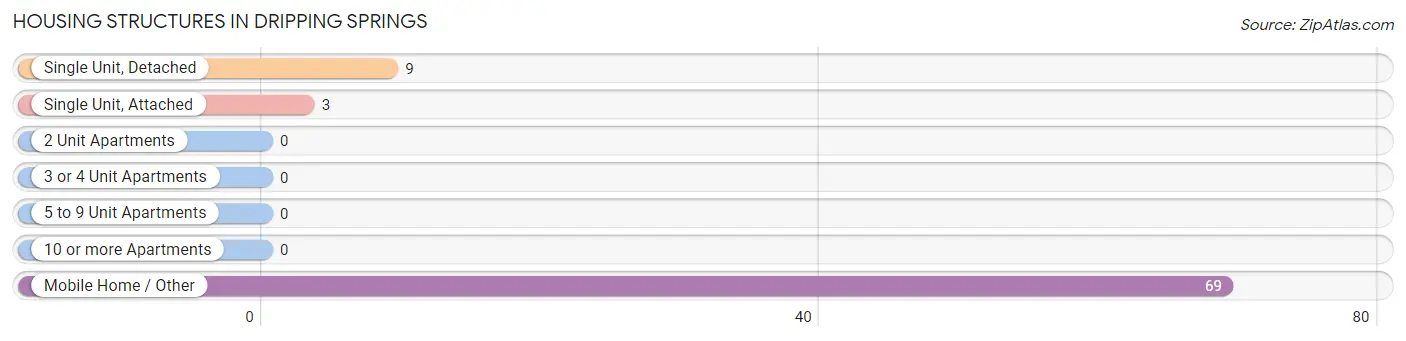
| Structure Type | # Housing Units | % Housing Units |
| Single Unit, Detached | 9 | 11.1% |
| Single Unit, Attached | 3 | 3.7% |
| 2 Unit Apartments | 0 | 0.0% |
| 3 or 4 Unit Apartments | 0 | 0.0% |
| 5 to 9 Unit Apartments | 0 | 0.0% |
| 10 or more Apartments | 0 | 0.0% |
| Mobile Home / Other | 69 | 85.2% |
| Total | 81 | 100.0% |
Housing Structures by Occupancy in Dripping Springs
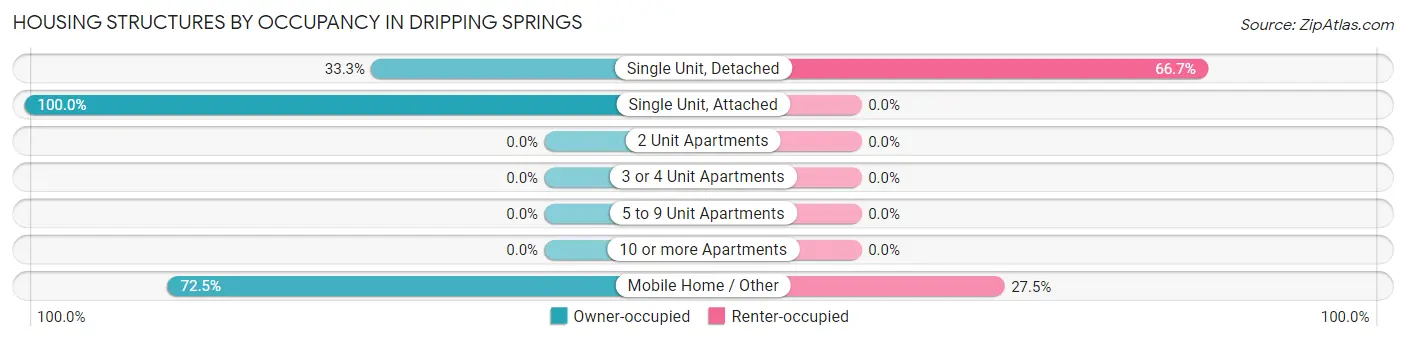
| Structure Type | Owner-occupied | Renter-occupied |
| Single Unit, Detached | 3 (33.3%) | 6 (66.7%) |
| Single Unit, Attached | 3 (100.0%) | 0 (0.0%) |
| 2 Unit Apartments | 0 (0.0%) | 0 (0.0%) |
| 3 or 4 Unit Apartments | 0 (0.0%) | 0 (0.0%) |
| 5 to 9 Unit Apartments | 0 (0.0%) | 0 (0.0%) |
| 10 or more Apartments | 0 (0.0%) | 0 (0.0%) |
| Mobile Home / Other | 50 (72.5%) | 19 (27.5%) |
| Total | 56 (69.1%) | 25 (30.9%) |
Housing Structures by Number of Rooms in Dripping Springs
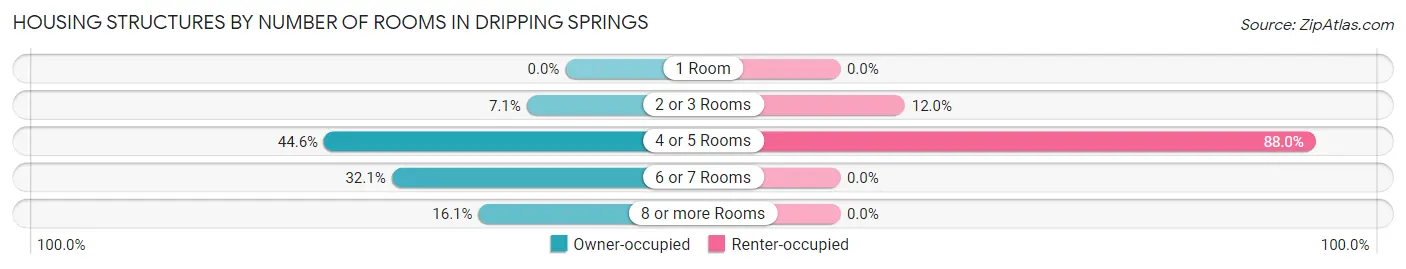
| Number of Rooms | Owner-occupied | Renter-occupied |
| 1 Room | 0 (0.0%) | 0 (0.0%) |
| 2 or 3 Rooms | 4 (7.1%) | 3 (12.0%) |
| 4 or 5 Rooms | 25 (44.6%) | 22 (88.0%) |
| 6 or 7 Rooms | 18 (32.1%) | 0 (0.0%) |
| 8 or more Rooms | 9 (16.1%) | 0 (0.0%) |
| Total | 56 (100.0%) | 25 (100.0%) |
Housing Structure by Heating Type in Dripping Springs
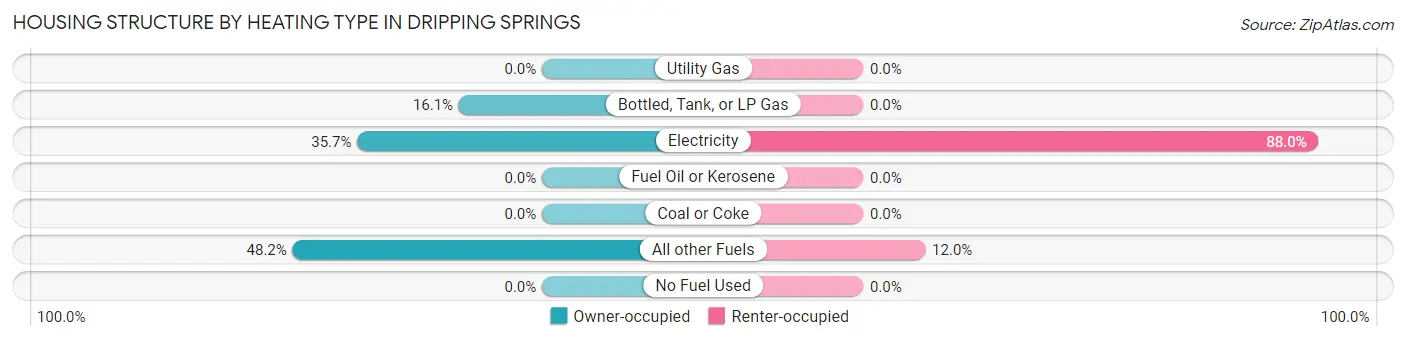
| Heating Type | Owner-occupied | Renter-occupied |
| Utility Gas | 0 (0.0%) | 0 (0.0%) |
| Bottled, Tank, or LP Gas | 9 (16.1%) | 0 (0.0%) |
| Electricity | 20 (35.7%) | 22 (88.0%) |
| Fuel Oil or Kerosene | 0 (0.0%) | 0 (0.0%) |
| Coal or Coke | 0 (0.0%) | 0 (0.0%) |
| All other Fuels | 27 (48.2%) | 3 (12.0%) |
| No Fuel Used | 0 (0.0%) | 0 (0.0%) |
| Total | 56 (100.0%) | 25 (100.0%) |
Household Vehicle Usage in Dripping Springs
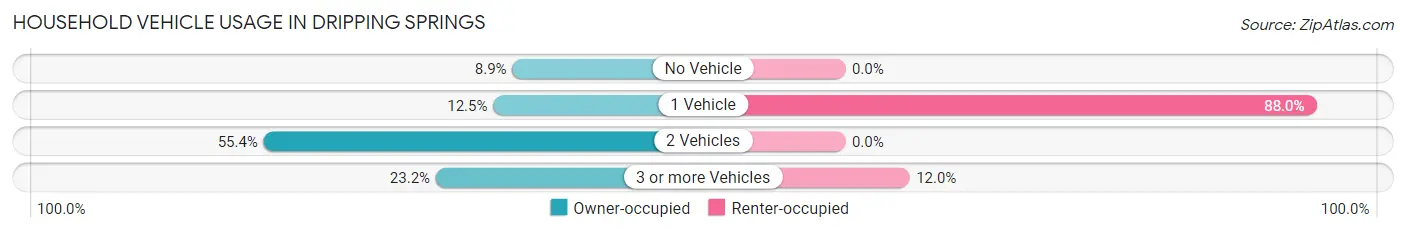
| Vehicles per Household | Owner-occupied | Renter-occupied |
| No Vehicle | 5 (8.9%) | 0 (0.0%) |
| 1 Vehicle | 7 (12.5%) | 22 (88.0%) |
| 2 Vehicles | 31 (55.4%) | 0 (0.0%) |
| 3 or more Vehicles | 13 (23.2%) | 3 (12.0%) |
| Total | 56 (100.0%) | 25 (100.0%) |
Real Estate & Mortgages in Dripping Springs
Real Estate and Mortgage Overview in Dripping Springs
| Characteristic | Without Mortgage | With Mortgage |
| Housing Units | 50 | 6 |
| Median Property Value | - | - |
| Median Household Income | $50,417 | $3 |
| Monthly Housing Costs | $275 | $0 |
| Real Estate Taxes | $315 | $0 |
Property Value by Mortgage Status in Dripping Springs
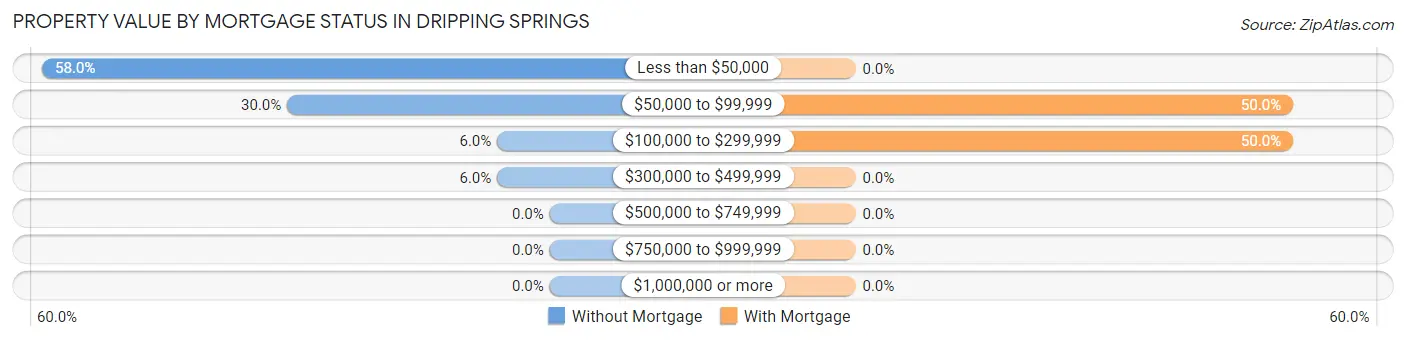
| Property Value | Without Mortgage | With Mortgage |
| Less than $50,000 | 29 (58.0%) | 0 (0.0%) |
| $50,000 to $99,999 | 15 (30.0%) | 3 (50.0%) |
| $100,000 to $299,999 | 3 (6.0%) | 3 (50.0%) |
| $300,000 to $499,999 | 3 (6.0%) | 0 (0.0%) |
| $500,000 to $749,999 | 0 (0.0%) | 0 (0.0%) |
| $750,000 to $999,999 | 0 (0.0%) | 0 (0.0%) |
| $1,000,000 or more | 0 (0.0%) | 0 (0.0%) |
| Total | 50 (100.0%) | 6 (100.0%) |
Household Income by Mortgage Status in Dripping Springs
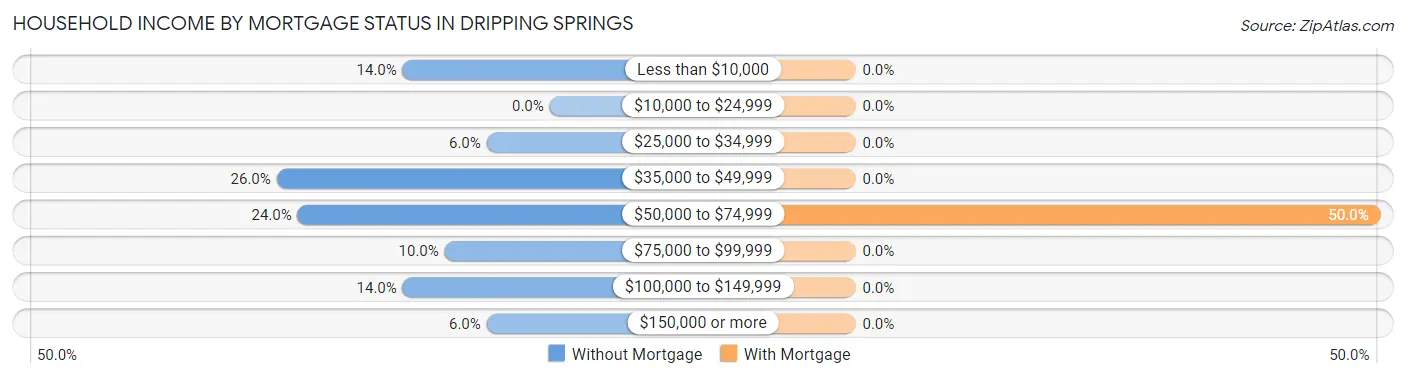
| Household Income | Without Mortgage | With Mortgage |
| Less than $10,000 | 7 (14.0%) | 0 (0.0%) |
| $10,000 to $24,999 | 0 (0.0%) | 0 (0.0%) |
| $25,000 to $34,999 | 3 (6.0%) | 0 (0.0%) |
| $35,000 to $49,999 | 13 (26.0%) | 0 (0.0%) |
| $50,000 to $74,999 | 12 (24.0%) | 3 (50.0%) |
| $75,000 to $99,999 | 5 (10.0%) | 0 (0.0%) |
| $100,000 to $149,999 | 7 (14.0%) | 0 (0.0%) |
| $150,000 or more | 3 (6.0%) | 0 (0.0%) |
| Total | 50 (100.0%) | 6 (100.0%) |
Property Value to Household Income Ratio in Dripping Springs
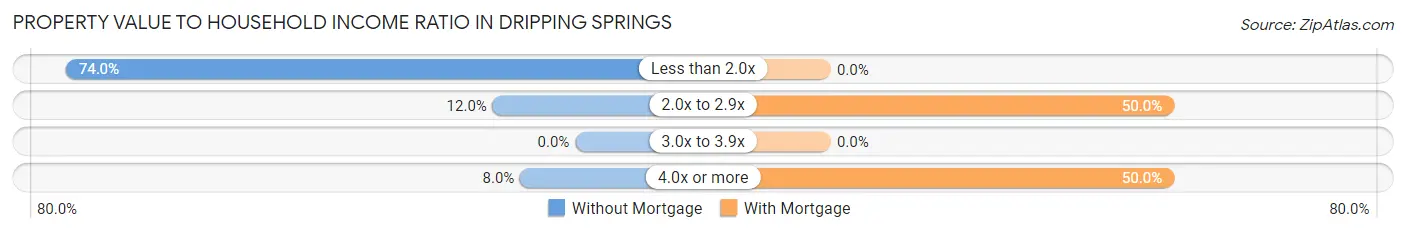
| Value-to-Income Ratio | Without Mortgage | With Mortgage |
| Less than 2.0x | 37 (74.0%) | 0 (0.0%) |
| 2.0x to 2.9x | 6 (12.0%) | 3 (50.0%) |
| 3.0x to 3.9x | 0 (0.0%) | 0 (0.0%) |
| 4.0x or more | 4 (8.0%) | 3 (50.0%) |
| Total | 50 (100.0%) | 6 (100.0%) |
Real Estate Taxes by Mortgage Status in Dripping Springs
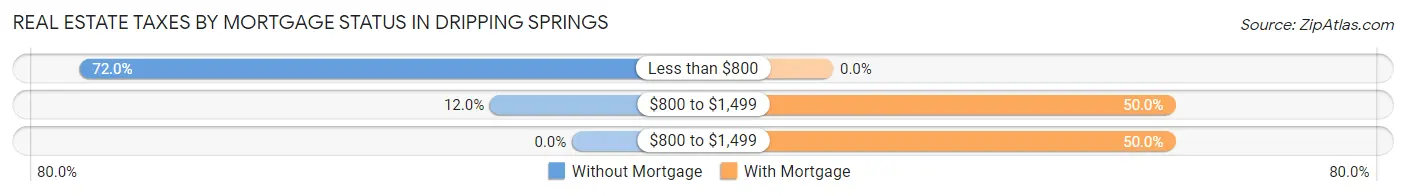
| Property Taxes | Without Mortgage | With Mortgage |
| Less than $800 | 36 (72.0%) | 0 (0.0%) |
| $800 to $1,499 | 6 (12.0%) | 3 (50.0%) |
| $800 to $1,499 | 0 (0.0%) | 3 (50.0%) |
| Total | 50 (100.0%) | 6 (100.0%) |
Health & Disability in Dripping Springs
Health Insurance Coverage by Age in Dripping Springs
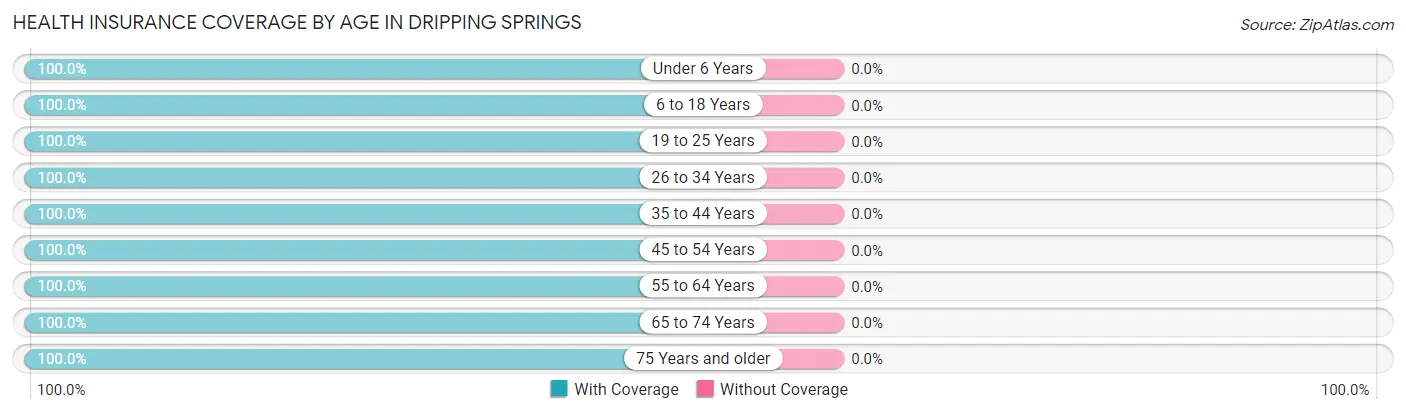
| Age Bracket | With Coverage | Without Coverage |
| Under 6 Years | 30 (100.0%) | 0 (0.0%) |
| 6 to 18 Years | 33 (100.0%) | 0 (0.0%) |
| 19 to 25 Years | 4 (100.0%) | 0 (0.0%) |
| 26 to 34 Years | 19 (100.0%) | 0 (0.0%) |
| 35 to 44 Years | 20 (100.0%) | 0 (0.0%) |
| 45 to 54 Years | 12 (100.0%) | 0 (0.0%) |
| 55 to 64 Years | 44 (100.0%) | 0 (0.0%) |
| 65 to 74 Years | 44 (100.0%) | 0 (0.0%) |
| 75 Years and older | 24 (100.0%) | 0 (0.0%) |
| Total | 230 (100.0%) | 0 (0.0%) |
Health Insurance Coverage by Citizenship Status in Dripping Springs
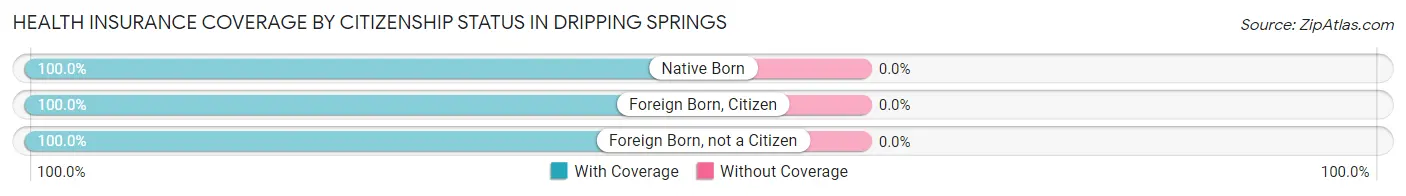
| Citizenship Status | With Coverage | Without Coverage |
| Native Born | 30 (100.0%) | 0 (0.0%) |
| Foreign Born, Citizen | 33 (100.0%) | 0 (0.0%) |
| Foreign Born, not a Citizen | 4 (100.0%) | 0 (0.0%) |
Health Insurance Coverage by Household Income in Dripping Springs
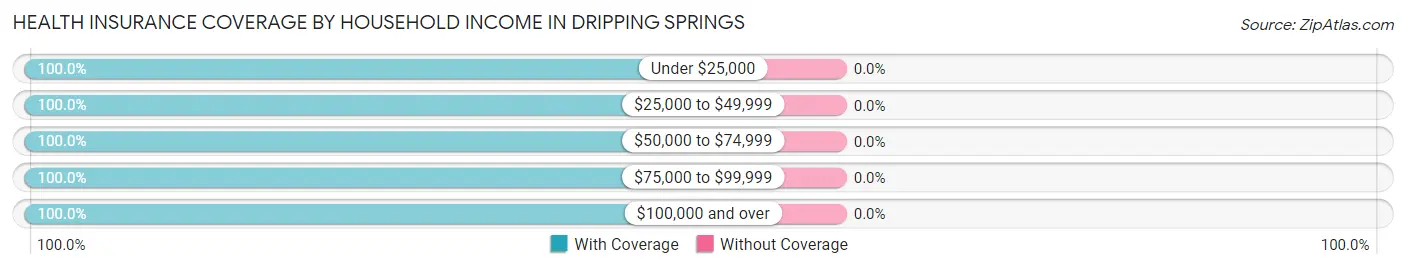
| Household Income | With Coverage | Without Coverage |
| Under $25,000 | 7 (100.0%) | 0 (0.0%) |
| $25,000 to $49,999 | 117 (100.0%) | 0 (0.0%) |
| $50,000 to $74,999 | 53 (100.0%) | 0 (0.0%) |
| $75,000 to $99,999 | 11 (100.0%) | 0 (0.0%) |
| $100,000 and over | 42 (100.0%) | 0 (0.0%) |
Public vs Private Health Insurance Coverage by Age in Dripping Springs
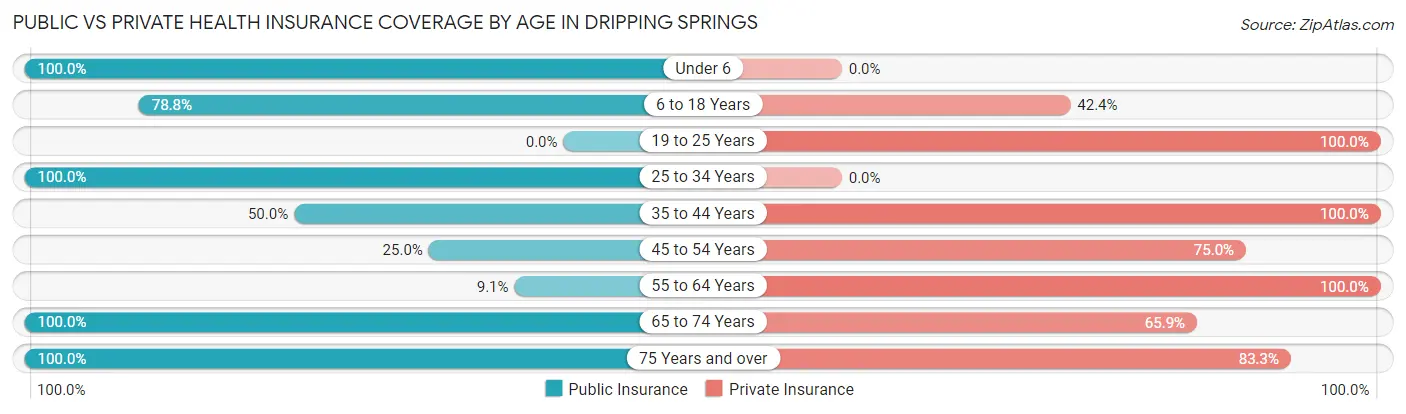
| Age Bracket | Public Insurance | Private Insurance |
| Under 6 | 30 (100.0%) | 0 (0.0%) |
| 6 to 18 Years | 26 (78.8%) | 14 (42.4%) |
| 19 to 25 Years | 0 (0.0%) | 4 (100.0%) |
| 25 to 34 Years | 19 (100.0%) | 0 (0.0%) |
| 35 to 44 Years | 10 (50.0%) | 20 (100.0%) |
| 45 to 54 Years | 3 (25.0%) | 9 (75.0%) |
| 55 to 64 Years | 4 (9.1%) | 44 (100.0%) |
| 65 to 74 Years | 44 (100.0%) | 29 (65.9%) |
| 75 Years and over | 24 (100.0%) | 20 (83.3%) |
| Total | 160 (69.6%) | 140 (60.9%) |
Disability Status by Sex by Age in Dripping Springs
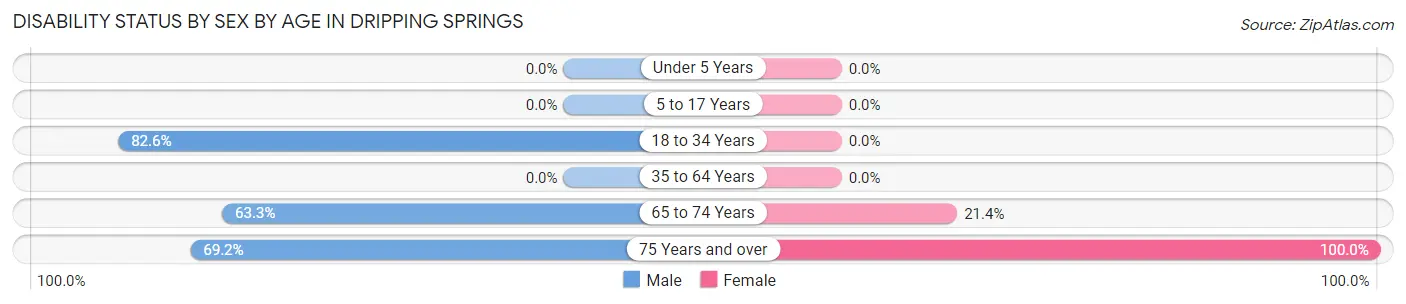
| Age Bracket | Male | Female |
| Under 5 Years | 0 (0.0%) | 0 (0.0%) |
| 5 to 17 Years | 0 (0.0%) | 0 (0.0%) |
| 18 to 34 Years | 19 (82.6%) | 0 (0.0%) |
| 35 to 64 Years | 0 (0.0%) | 0 (0.0%) |
| 65 to 74 Years | 19 (63.3%) | 3 (21.4%) |
| 75 Years and over | 9 (69.2%) | 11 (100.0%) |
Disability Class by Sex by Age in Dripping Springs
Disability Class: Hearing Difficulty
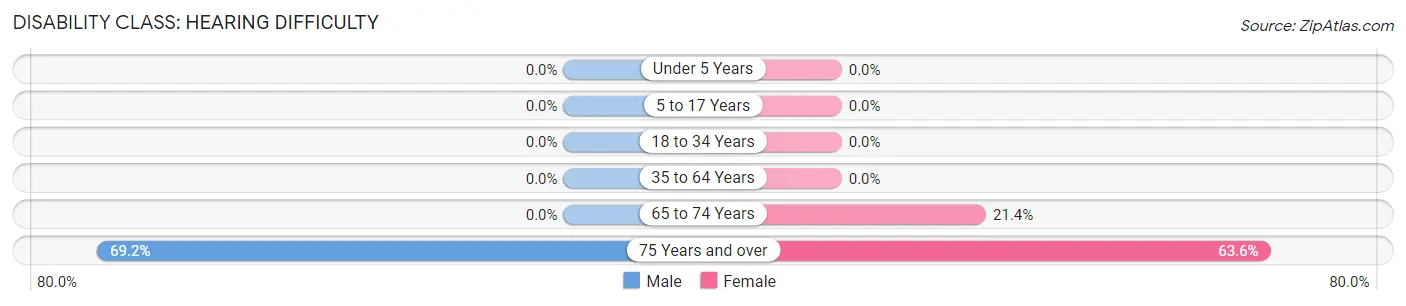
| Age Bracket | Male | Female |
| Under 5 Years | 0 (0.0%) | 0 (0.0%) |
| 5 to 17 Years | 0 (0.0%) | 0 (0.0%) |
| 18 to 34 Years | 0 (0.0%) | 0 (0.0%) |
| 35 to 64 Years | 0 (0.0%) | 0 (0.0%) |
| 65 to 74 Years | 0 (0.0%) | 3 (21.4%) |
| 75 Years and over | 9 (69.2%) | 7 (63.6%) |
Disability Class: Vision Difficulty
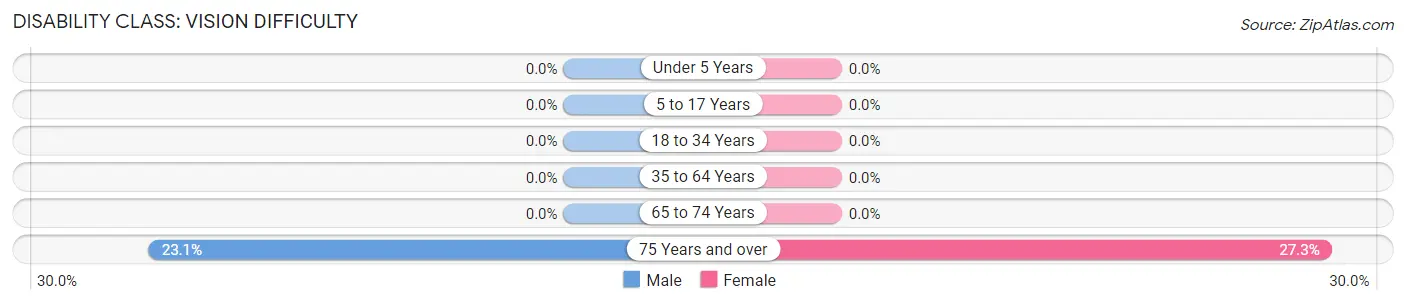
| Age Bracket | Male | Female |
| Under 5 Years | 0 (0.0%) | 0 (0.0%) |
| 5 to 17 Years | 0 (0.0%) | 0 (0.0%) |
| 18 to 34 Years | 0 (0.0%) | 0 (0.0%) |
| 35 to 64 Years | 0 (0.0%) | 0 (0.0%) |
| 65 to 74 Years | 0 (0.0%) | 0 (0.0%) |
| 75 Years and over | 3 (23.1%) | 3 (27.3%) |
Disability Class: Cognitive Difficulty
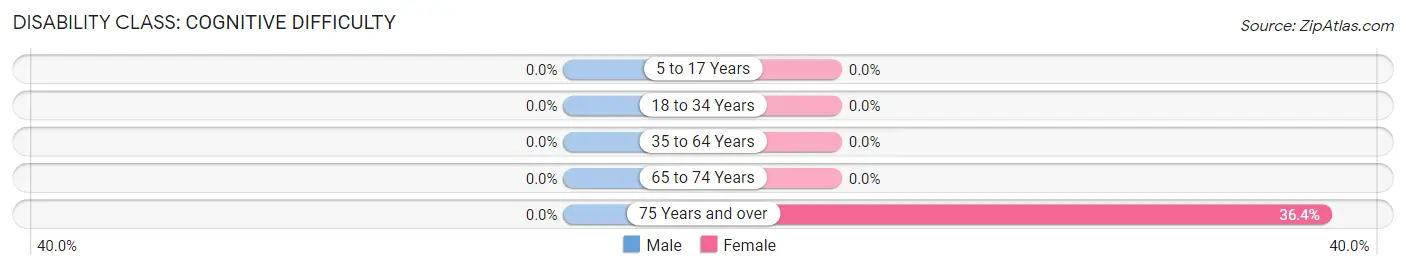
| Age Bracket | Male | Female |
| 5 to 17 Years | 0 (0.0%) | 0 (0.0%) |
| 18 to 34 Years | 0 (0.0%) | 0 (0.0%) |
| 35 to 64 Years | 0 (0.0%) | 0 (0.0%) |
| 65 to 74 Years | 0 (0.0%) | 0 (0.0%) |
| 75 Years and over | 0 (0.0%) | 4 (36.4%) |
Disability Class: Ambulatory Difficulty
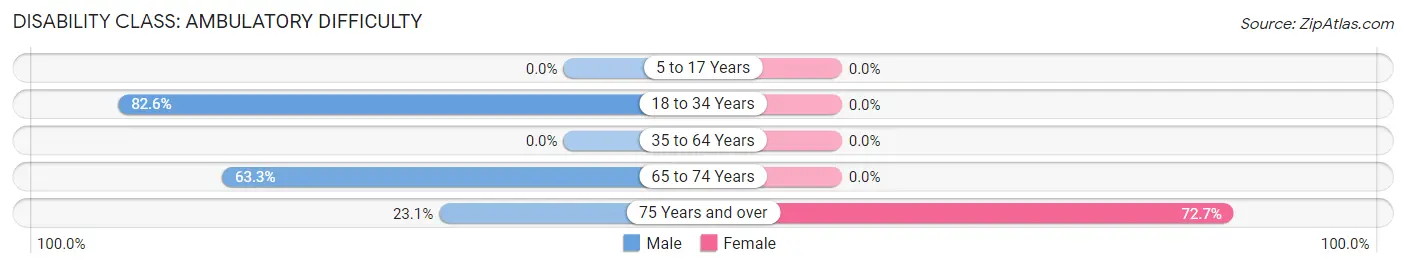
| Age Bracket | Male | Female |
| 5 to 17 Years | 0 (0.0%) | 0 (0.0%) |
| 18 to 34 Years | 19 (82.6%) | 0 (0.0%) |
| 35 to 64 Years | 0 (0.0%) | 0 (0.0%) |
| 65 to 74 Years | 19 (63.3%) | 0 (0.0%) |
| 75 Years and over | 3 (23.1%) | 8 (72.7%) |
Disability Class: Self-Care Difficulty
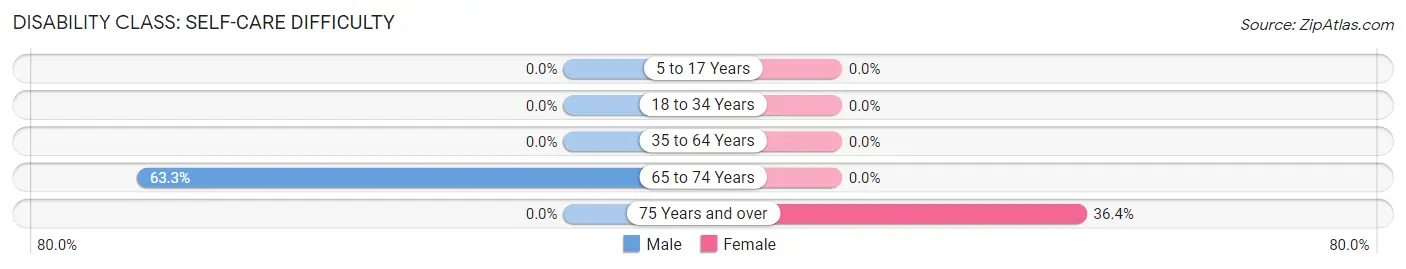
| Age Bracket | Male | Female |
| 5 to 17 Years | 0 (0.0%) | 0 (0.0%) |
| 18 to 34 Years | 0 (0.0%) | 0 (0.0%) |
| 35 to 64 Years | 0 (0.0%) | 0 (0.0%) |
| 65 to 74 Years | 19 (63.3%) | 0 (0.0%) |
| 75 Years and over | 0 (0.0%) | 4 (36.4%) |
Technology Access in Dripping Springs
Computing Device Access in Dripping Springs
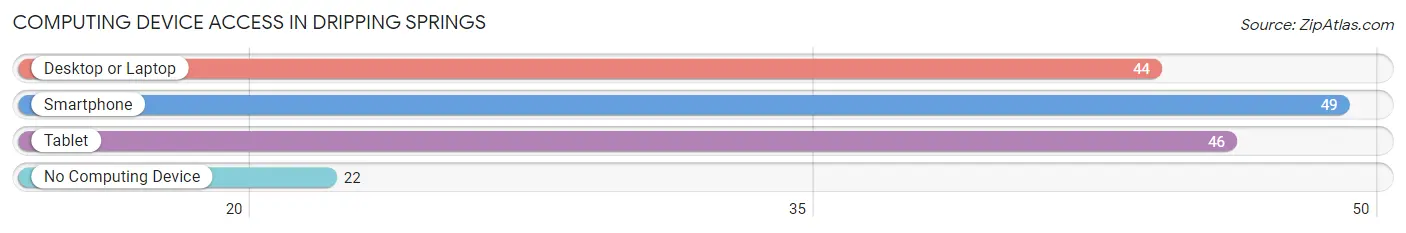
| Device Type | # Households | % Households |
| Desktop or Laptop | 44 | 54.3% |
| Smartphone | 49 | 60.5% |
| Tablet | 46 | 56.8% |
| No Computing Device | 22 | 27.2% |
| Total | 81 | 100.0% |
Internet Access in Dripping Springs
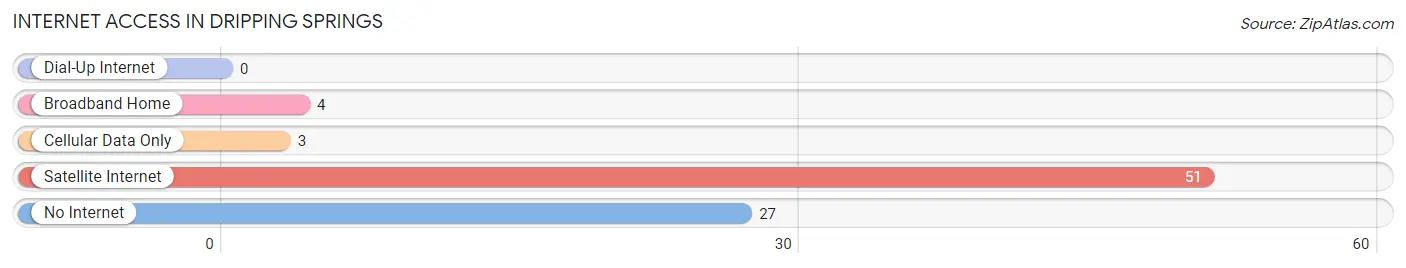
| Internet Type | # Households | % Households |
| Dial-Up Internet | 0 | 0.0% |
| Broadband Home | 4 | 4.9% |
| Cellular Data Only | 3 | 3.7% |
| Satellite Internet | 51 | 63.0% |
| No Internet | 27 | 33.3% |
| Total | 81 | 100.0% |
Dripping Springs Summary
Dripping Springs is a small unincorporated community located in the Sonoran Desert of Arizona. It is situated in the foothills of the Santa Catalina Mountains, approximately 25 miles north of Tucson. The area is known for its scenic beauty, with rolling hills, cacti, and a variety of wildlife. The community is also home to a number of historic sites, including the ruins of an old Spanish mission.
History
The area now known as Dripping Springs has been inhabited for thousands of years. The Hohokam people were the first to settle in the area, and they left behind a number of archaeological sites, including petroglyphs and pottery. The area was later settled by Spanish missionaries in the late 1700s, who established a mission in the area. The mission was abandoned in the early 1800s, and the area was largely uninhabited until the late 1800s, when settlers began to move in.
The town of Dripping Springs was established in 1891, and the first post office was opened in 1892. The town was named for the nearby springs, which were said to have a “dripping” sound. The town grew slowly, and by the early 1900s, it had a population of around 200 people.
Geography
Dripping Springs is located in the Sonoran Desert of Arizona, in the foothills of the Santa Catalina Mountains. The area is characterized by rolling hills, cacti, and a variety of wildlife. The climate is arid, with hot summers and mild winters. The average annual temperature is around 70°F, and the average annual precipitation is around 12 inches.
Economy
The economy of Dripping Springs is largely based on tourism and agriculture. The area is popular with tourists, who come to enjoy the scenic beauty and explore the area’s historic sites. Agriculture is also important to the local economy, with the area’s main crops being cotton, alfalfa, and hay.
Demographics
As of the 2010 census, the population of Dripping Springs was 1,845. The population is largely white (90.2%), with a small Hispanic population (7.2%). The median household income is $45,000, and the median home value is $150,000. The area is served by the Marana Unified School District.
Dripping Springs is a small, unincorporated community in the Sonoran Desert of Arizona. It is situated in the foothills of the Santa Catalina Mountains, approximately 25 miles north of Tucson. The area is known for its scenic beauty, with rolling hills, cacti, and a variety of wildlife. The community is also home to a number of historic sites, including the ruins of an old Spanish mission. The economy of Dripping Springs is largely based on tourism and agriculture, and the population is largely white. The area is served by the Marana Unified School District.
Common Questions
What is Per Capita Income in Dripping Springs?
Per Capita income in Dripping Springs is $24,885.
What is the Median Family Income in Dripping Springs?
Median Family Income in Dripping Springs is $51,458.
What is the Median Household income in Dripping Springs?
Median Household Income in Dripping Springs is $48,125.
What is Inequality or Gini Index in Dripping Springs?
Inequality or Gini Index in Dripping Springs is 0.44.
What is the Total Population of Dripping Springs?
Total Population of Dripping Springs is 230.
What is the Total Male Population of Dripping Springs?
Total Male Population of Dripping Springs is 147.
What is the Total Female Population of Dripping Springs?
Total Female Population of Dripping Springs is 83.
What is the Ratio of Males per 100 Females in Dripping Springs?
There are 177.11 Males per 100 Females in Dripping Springs.
What is the Ratio of Females per 100 Males in Dripping Springs?
There are 56.46 Females per 100 Males in Dripping Springs.
What is the Median Population Age in Dripping Springs?
Median Population Age in Dripping Springs is 53.4 Years.
What is the Average Family Size in Dripping Springs
Average Family Size in Dripping Springs is 3.9 People.
What is the Average Household Size in Dripping Springs
Average Household Size in Dripping Springs is 2.8 People.
How Large is the Labor Force in Dripping Springs?
There are 92 People in the Labor Forcein in Dripping Springs.
What is the Percentage of People in the Labor Force in Dripping Springs?
55.1% of People are in the Labor Force in Dripping Springs.