Patagonia, AZ Map & Demographics
Patagonia Map
Patagonia Overview
$27,845
PER CAPITA INCOME
$47,969
AVG FAMILY INCOME
$34,609
AVG HOUSEHOLD INCOME
14.0%
WAGE / INCOME GAP [ % ]
86.0¢/ $1
WAGE / INCOME GAP [ $ ]
0.43
INEQUALITY / GINI INDEX
896
TOTAL POPULATION
412
MALE POPULATION
484
FEMALE POPULATION
85.12
MALES / 100 FEMALES
117.48
FEMALES / 100 MALES
57.2
MEDIAN AGE
2.5
AVG FAMILY SIZE
1.8
AVG HOUSEHOLD SIZE
340
LABOR FORCE [ PEOPLE ]
44.3%
PERCENT IN LABOR FORCE
7.1%
UNEMPLOYMENT RATE
Patagonia Zip Codes
Patagonia Area Codes
Income in Patagonia
Income Overview in Patagonia
Per Capita Income in Patagonia is $27,845, while median incomes of families and households are $47,969 and $34,609 respectively.
| Characteristic | Number | Measure |
| Per Capita Income | 896 | $27,845 |
| Median Family Income | 242 | $47,969 |
| Mean Family Income | 242 | $61,628 |
| Median Household Income | 501 | $34,609 |
| Mean Household Income | 501 | $49,561 |
| Income Deficit | 242 | $0 |
| Wage / Income Gap (%) | 896 | 14.04% |
| Wage / Income Gap ($) | 896 | 85.96¢ per $1 |
| Gini / Inequality Index | 896 | 0.43 |
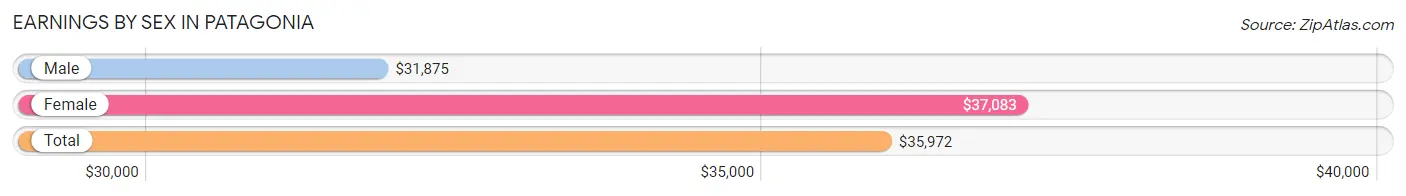
Earnings by Sex in Patagonia
Average Earnings in Patagonia are $35,972, $31,875 for men and $37,083 for women, a difference of 14.0%.
| Sex | Number | Average Earnings |
| Male | 166 (50.1%) | $31,875 |
| Female | 165 (49.8%) | $37,083 |
| Total | 331 (100.0%) | $35,972 |
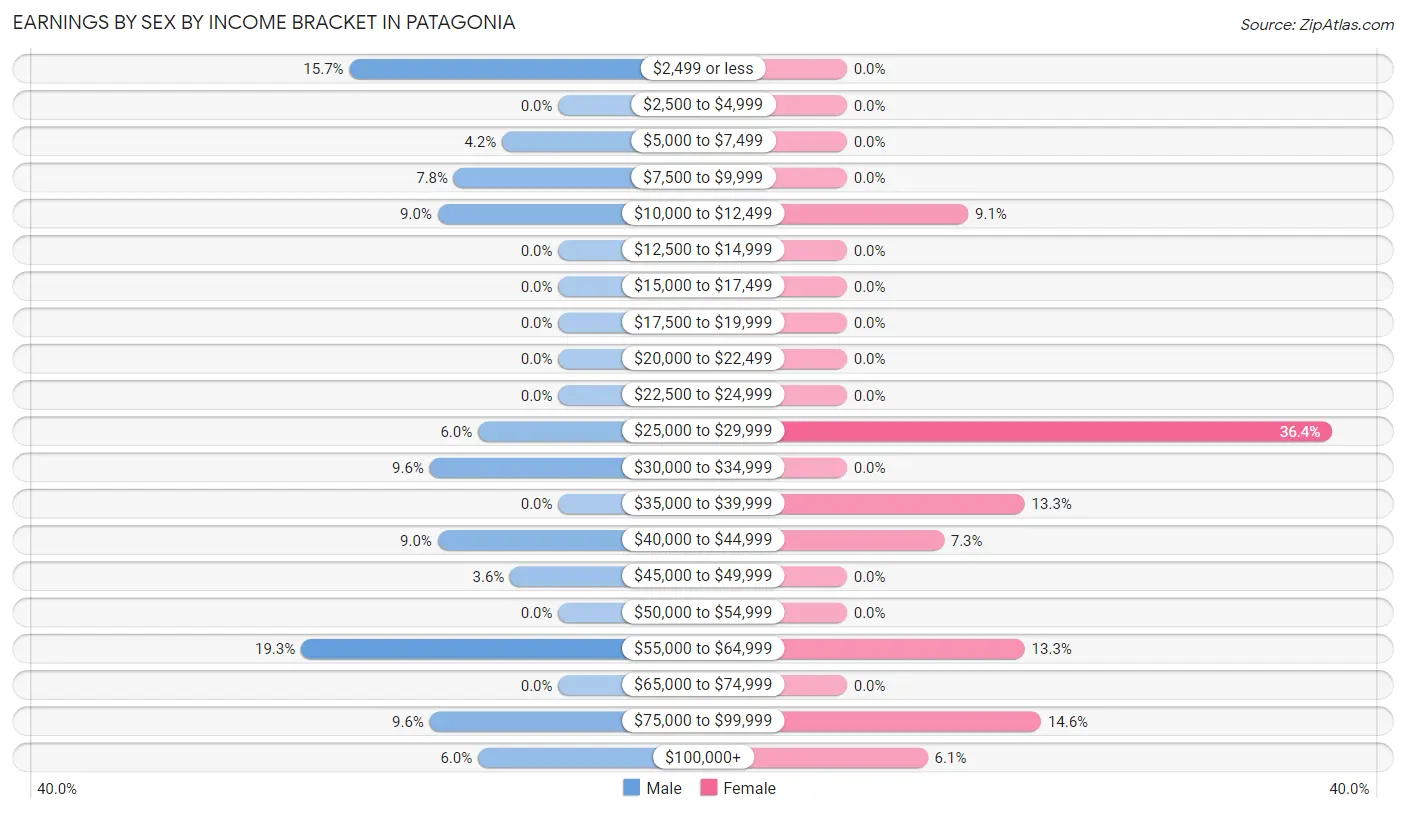
Earnings by Sex by Income Bracket in Patagonia
The most common earnings brackets in Patagonia are $55,000 to $64,999 for men (32 | 19.3%) and $25,000 to $29,999 for women (60 | 36.4%).
| Income | Male | Female |
| $2,499 or less | 26 (15.7%) | 0 (0.0%) |
| $2,500 to $4,999 | 0 (0.0%) | 0 (0.0%) |
| $5,000 to $7,499 | 7 (4.2%) | 0 (0.0%) |
| $7,500 to $9,999 | 13 (7.8%) | 0 (0.0%) |
| $10,000 to $12,499 | 15 (9.0%) | 15 (9.1%) |
| $12,500 to $14,999 | 0 (0.0%) | 0 (0.0%) |
| $15,000 to $17,499 | 0 (0.0%) | 0 (0.0%) |
| $17,500 to $19,999 | 0 (0.0%) | 0 (0.0%) |
| $20,000 to $22,499 | 0 (0.0%) | 0 (0.0%) |
| $22,500 to $24,999 | 0 (0.0%) | 0 (0.0%) |
| $25,000 to $29,999 | 10 (6.0%) | 60 (36.4%) |
| $30,000 to $34,999 | 16 (9.6%) | 0 (0.0%) |
| $35,000 to $39,999 | 0 (0.0%) | 22 (13.3%) |
| $40,000 to $44,999 | 15 (9.0%) | 12 (7.3%) |
| $45,000 to $49,999 | 6 (3.6%) | 0 (0.0%) |
| $50,000 to $54,999 | 0 (0.0%) | 0 (0.0%) |
| $55,000 to $64,999 | 32 (19.3%) | 22 (13.3%) |
| $65,000 to $74,999 | 0 (0.0%) | 0 (0.0%) |
| $75,000 to $99,999 | 16 (9.6%) | 24 (14.5%) |
| $100,000+ | 10 (6.0%) | 10 (6.1%) |
| Total | 166 (100.0%) | 165 (100.0%) |
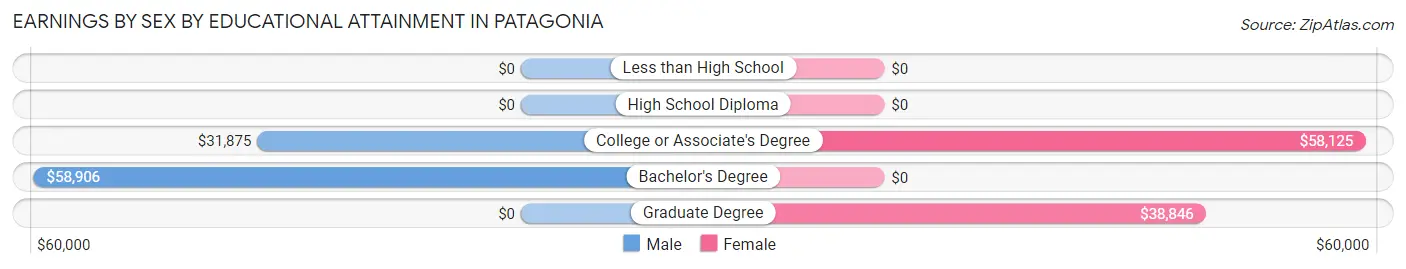
Earnings by Sex by Educational Attainment in Patagonia
Average earnings in Patagonia are $31,875 for men and $37,083 for women, a difference of 14.0%. Men with an educational attainment of bachelor's degree enjoy the highest average annual earnings of $58,906, while those with college or associate's degree education earn the least with $31,875. Women with an educational attainment of college or associate's degree earn the most with the average annual earnings of $58,125, while those with graduate degree education have the smallest earnings of $38,846.
| Educational Attainment | Male Income | Female Income |
| Less than High School | - | - |
| High School Diploma | - | - |
| College or Associate's Degree | $31,875 | $58,125 |
| Bachelor's Degree | $58,906 | $0 |
| Graduate Degree | - | - |
| Total | $31,875 | $37,083 |
Family Income in Patagonia
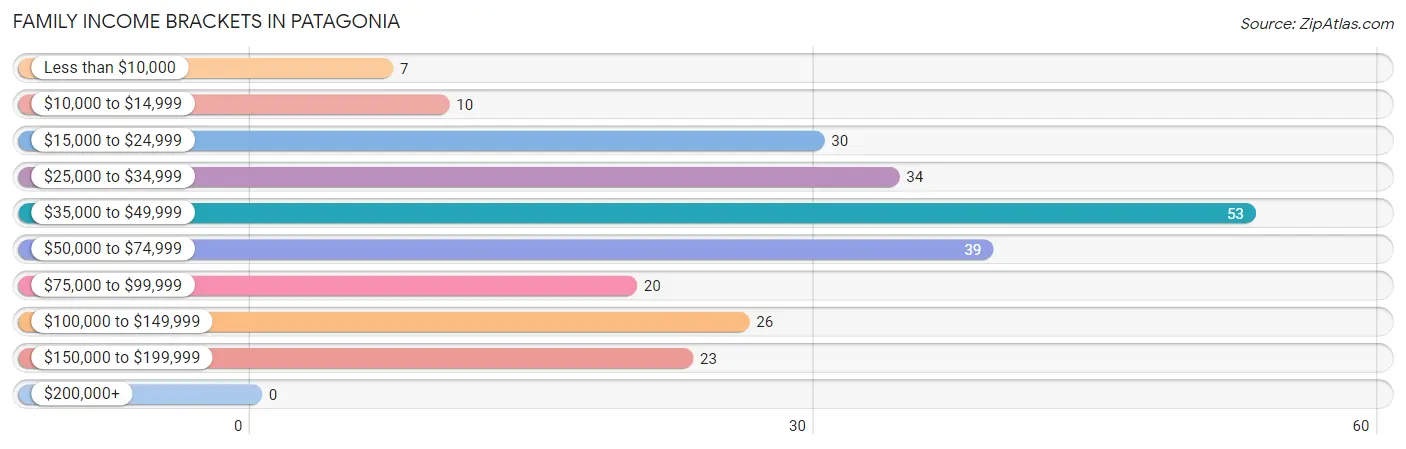
Family Income Brackets in Patagonia
According to the Patagonia family income data, there are 53 families falling into the $35,000 to $49,999 income range, which is the most common income bracket and makes up 21.9% of all families.
| Income Bracket | # Families | % Families |
| Less than $10,000 | 7 | 2.9% |
| $10,000 to $14,999 | 10 | 4.1% |
| $15,000 to $24,999 | 30 | 12.4% |
| $25,000 to $34,999 | 34 | 14.0% |
| $35,000 to $49,999 | 53 | 21.9% |
| $50,000 to $74,999 | 39 | 16.1% |
| $75,000 to $99,999 | 20 | 8.3% |
| $100,000 to $149,999 | 26 | 10.7% |
| $150,000 to $199,999 | 23 | 9.5% |
| $200,000+ | 0 | 0.0% |
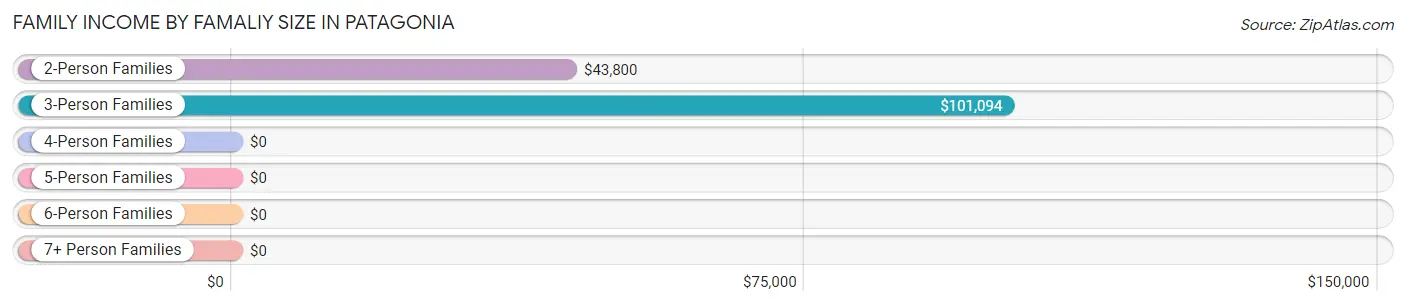
Family Income by Famaliy Size in Patagonia
3-person families (73 | 30.2%) account for the highest median family income in Patagonia with $101,094 per family, while 3-person families (73 | 30.2%) have the highest median income of $33,698 per family member.
| Income Bracket | # Families | Median Income |
| 2-Person Families | 144 (59.5%) | $43,800 |
| 3-Person Families | 73 (30.2%) | $101,094 |
| 4-Person Families | 23 (9.5%) | $0 |
| 5-Person Families | 2 (0.8%) | $0 |
| 6-Person Families | 0 (0.0%) | $0 |
| 7+ Person Families | 0 (0.0%) | $0 |
| Total | 242 (100.0%) | $47,969 |
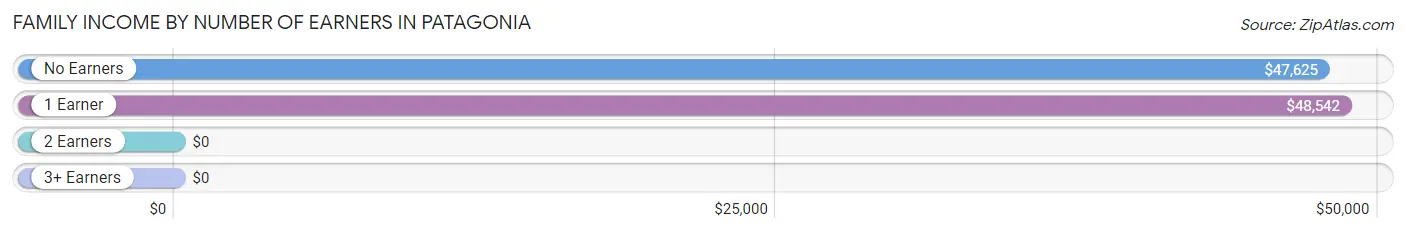
Family Income by Number of Earners in Patagonia
| Number of Earners | # Families | Median Income |
| No Earners | 101 (41.7%) | $47,625 |
| 1 Earner | 81 (33.5%) | $48,542 |
| 2 Earners | 47 (19.4%) | $0 |
| 3+ Earners | 13 (5.4%) | $0 |
| Total | 242 (100.0%) | $47,969 |
Household Income in Patagonia
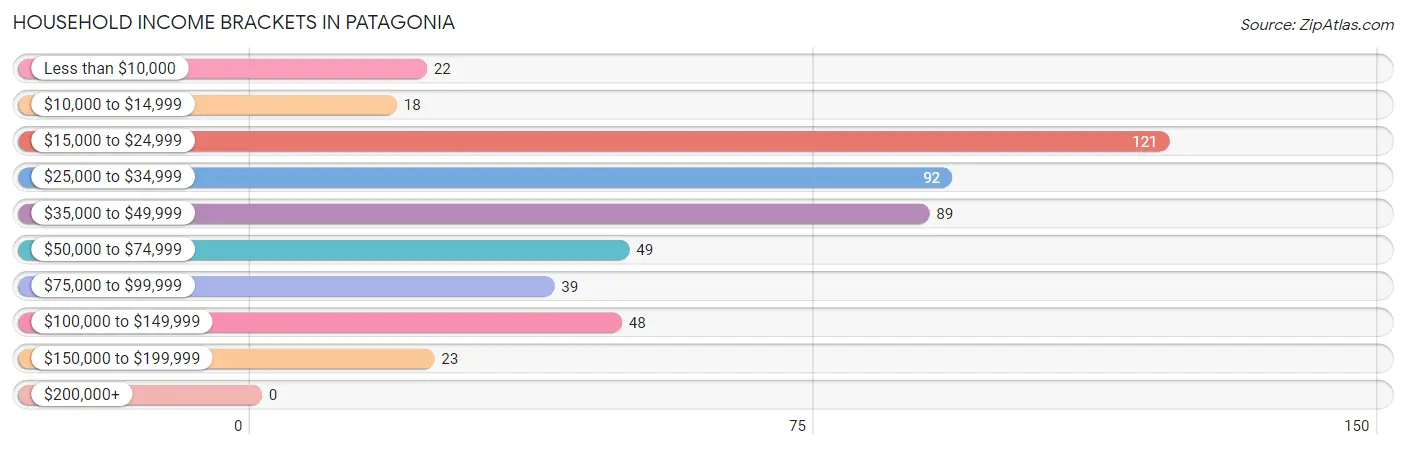
Household Income Brackets in Patagonia
With 121 households falling in the category, the $15,000 to $24,999 income range is the most frequent in Patagonia, accounting for 24.1% of all households.
| Income Bracket | # Households | % Households |
| Less than $10,000 | 22 | 4.4% |
| $10,000 to $14,999 | 18 | 3.6% |
| $15,000 to $24,999 | 121 | 24.2% |
| $25,000 to $34,999 | 92 | 18.4% |
| $35,000 to $49,999 | 89 | 17.8% |
| $50,000 to $74,999 | 49 | 9.8% |
| $75,000 to $99,999 | 39 | 7.8% |
| $100,000 to $149,999 | 48 | 9.6% |
| $150,000 to $199,999 | 23 | 4.6% |
| $200,000+ | 0 | 0.0% |
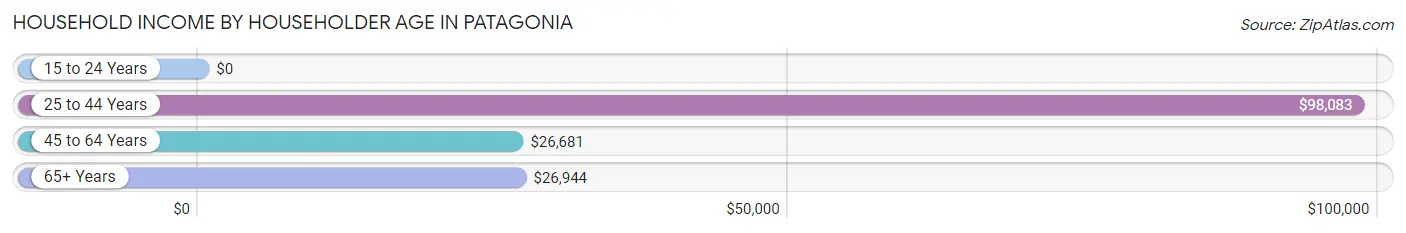
Household Income by Householder Age in Patagonia
The median household income in Patagonia is $34,609, with the highest median household income of $98,083 found in the 25 to 44 years age bracket for the primary householder. A total of 97 households (19.4%) fall into this category.
| Income Bracket | # Households | Median Income |
| 15 to 24 Years | 0 (0.0%) | $0 |
| 25 to 44 Years | 97 (19.4%) | $98,083 |
| 45 to 64 Years | 132 (26.4%) | $26,681 |
| 65+ Years | 272 (54.3%) | $26,944 |
| Total | 501 (100.0%) | $34,609 |
Poverty in Patagonia
Income Below Poverty by Sex and Age in Patagonia
With 10.2% poverty level for males and 10.3% for females among the residents of Patagonia, 55 to 64 year old males and under 5 year old females are the most vulnerable to poverty, with 25 males (55.6%) and 11 females (44.0%) in their respective age groups living below the poverty level.
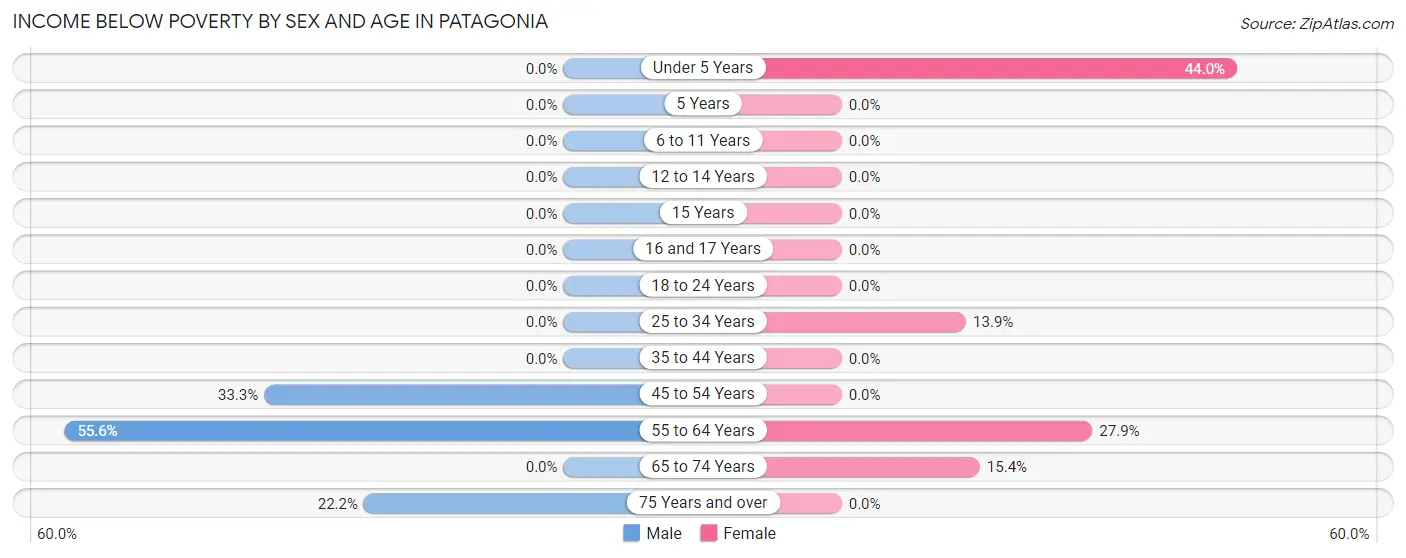
| Age Bracket | Male | Female |
| Under 5 Years | 0 (0.0%) | 11 (44.0%) |
| 5 Years | 0 (0.0%) | 0 (0.0%) |
| 6 to 11 Years | 0 (0.0%) | 0 (0.0%) |
| 12 to 14 Years | 0 (0.0%) | 0 (0.0%) |
| 15 Years | 0 (0.0%) | 0 (0.0%) |
| 16 and 17 Years | 0 (0.0%) | 0 (0.0%) |
| 18 to 24 Years | 0 (0.0%) | 0 (0.0%) |
| 25 to 34 Years | 0 (0.0%) | 9 (13.9%) |
| 35 to 44 Years | 0 (0.0%) | 0 (0.0%) |
| 45 to 54 Years | 7 (33.3%) | 0 (0.0%) |
| 55 to 64 Years | 25 (55.6%) | 12 (27.9%) |
| 65 to 74 Years | 0 (0.0%) | 18 (15.4%) |
| 75 Years and over | 10 (22.2%) | 0 (0.0%) |
| Total | 42 (10.2%) | 50 (10.3%) |
Income Above Poverty by Sex and Age in Patagonia
According to the poverty statistics in Patagonia, males aged under 5 years and females aged 6 to 11 years are the age groups that are most secure financially, with 100.0% of males and 100.0% of females in these age groups living above the poverty line.
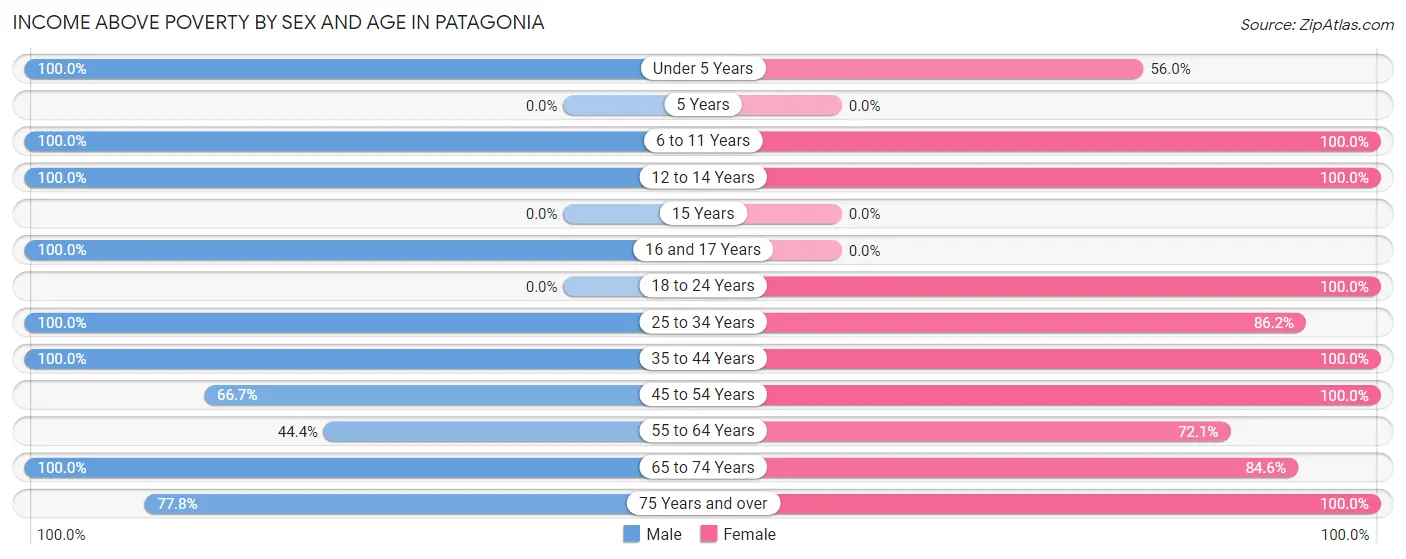
| Age Bracket | Male | Female |
| Under 5 Years | 11 (100.0%) | 14 (56.0%) |
| 5 Years | 0 (0.0%) | 0 (0.0%) |
| 6 to 11 Years | 27 (100.0%) | 11 (100.0%) |
| 12 to 14 Years | 11 (100.0%) | 43 (100.0%) |
| 15 Years | 0 (0.0%) | 0 (0.0%) |
| 16 and 17 Years | 8 (100.0%) | 0 (0.0%) |
| 18 to 24 Years | 0 (0.0%) | 8 (100.0%) |
| 25 to 34 Years | 90 (100.0%) | 56 (86.2%) |
| 35 to 44 Years | 21 (100.0%) | 18 (100.0%) |
| 45 to 54 Years | 14 (66.7%) | 72 (100.0%) |
| 55 to 64 Years | 20 (44.4%) | 31 (72.1%) |
| 65 to 74 Years | 133 (100.0%) | 99 (84.6%) |
| 75 Years and over | 35 (77.8%) | 82 (100.0%) |
| Total | 370 (89.8%) | 434 (89.7%) |
Income Below Poverty Among Married-Couple Families in Patagonia
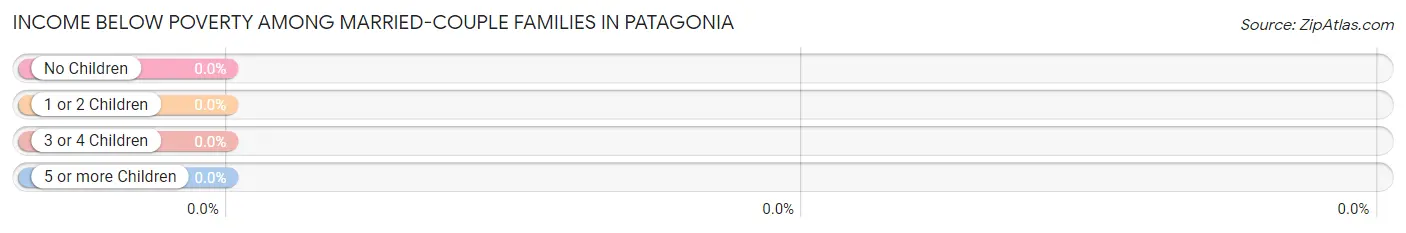
| Children | Above Poverty | Below Poverty |
| No Children | 117 (100.0%) | 0 (0.0%) |
| 1 or 2 Children | 48 (100.0%) | 0 (0.0%) |
| 3 or 4 Children | 2 (100.0%) | 0 (0.0%) |
| 5 or more Children | 0 (0.0%) | 0 (0.0%) |
| Total | 167 (100.0%) | 0 (0.0%) |
Income Below Poverty Among Single-Parent Households in Patagonia
According to the poverty data in Patagonia, 14.6% or 7 single-father households and 37.0% or 10 single-mother households are living below the poverty line. Among single-father households, those with 1 or 2 children have the highest poverty rate, with 7 households (19.4%) experiencing poverty. Likewise, among single-mother households, those with no children have the highest poverty rate, with 10 households (100.0%) falling below the poverty line.
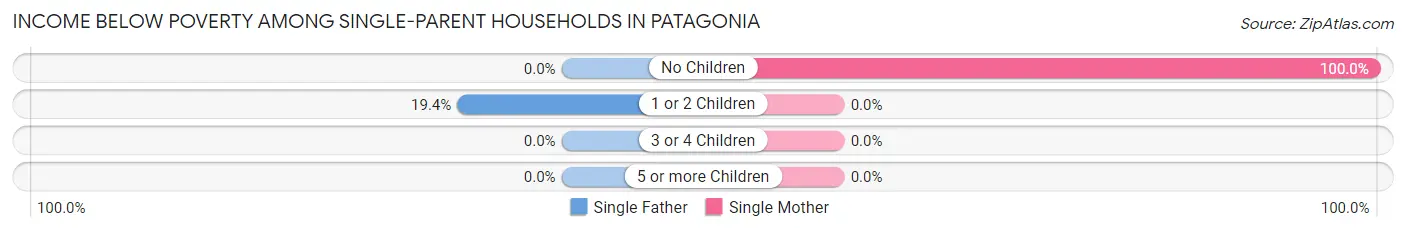
| Children | Single Father | Single Mother |
| No Children | 0 (0.0%) | 10 (100.0%) |
| 1 or 2 Children | 7 (19.4%) | 0 (0.0%) |
| 3 or 4 Children | 0 (0.0%) | 0 (0.0%) |
| 5 or more Children | 0 (0.0%) | 0 (0.0%) |
| Total | 7 (14.6%) | 10 (37.0%) |
Income Below Poverty Among Married-Couple vs Single-Parent Households in Patagonia
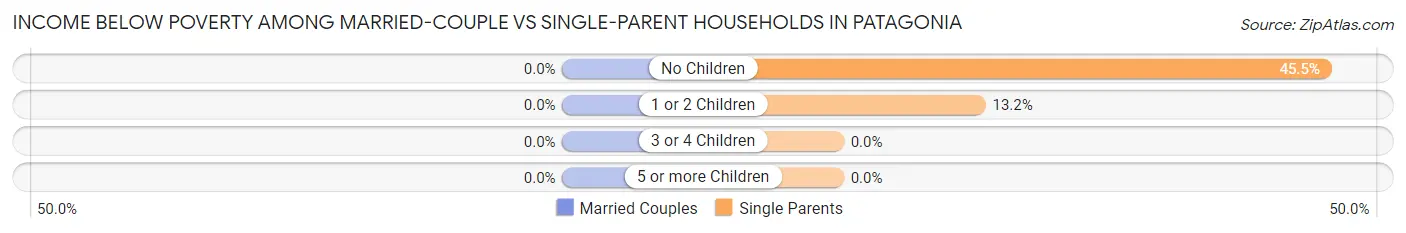
| Children | Married-Couple Families | Single-Parent Households |
| No Children | 0 (0.0%) | 10 (45.5%) |
| 1 or 2 Children | 0 (0.0%) | 7 (13.2%) |
| 3 or 4 Children | 0 (0.0%) | 0 (0.0%) |
| 5 or more Children | 0 (0.0%) | 0 (0.0%) |
| Total | 0 (0.0%) | 17 (22.7%) |
Race in Patagonia
The most populous races in Patagonia are White / Caucasian (703 | 78.5%), Hispanic or Latino (389 | 43.4%), and Two or more Races (146 | 16.3%).
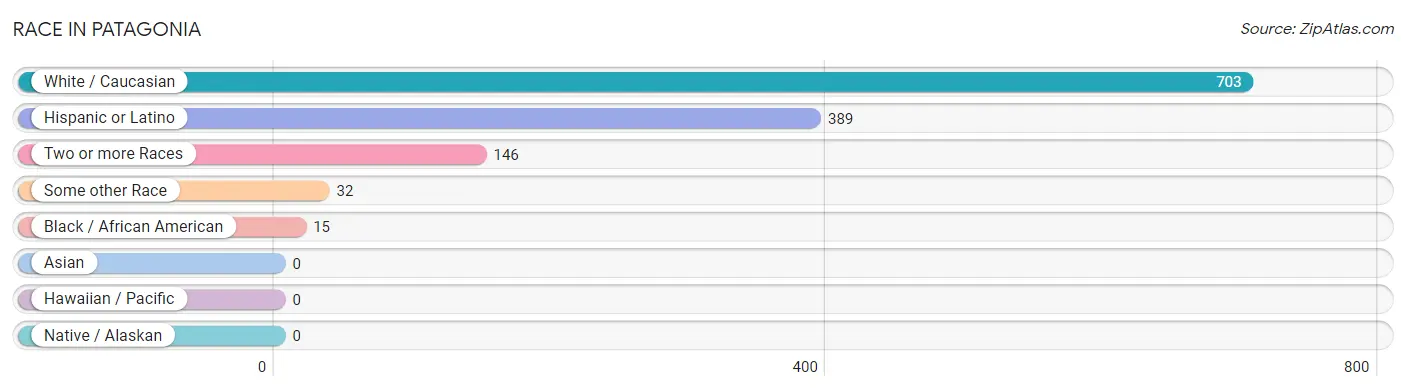
| Race | # Population | % Population |
| Asian | 0 | 0.0% |
| Black / African American | 15 | 1.7% |
| Hawaiian / Pacific | 0 | 0.0% |
| Hispanic or Latino | 389 | 43.4% |
| Native / Alaskan | 0 | 0.0% |
| White / Caucasian | 703 | 78.5% |
| Two or more Races | 146 | 16.3% |
| Some other Race | 32 | 3.6% |
| Total | 896 | 100.0% |
Ancestry in Patagonia
The most populous ancestries reported in Patagonia are Mexican (378 | 42.2%), English (165 | 18.4%), Eastern European (48 | 5.4%), Lithuanian (39 | 4.3%), and French (35 | 3.9%), together accounting for 74.2% of all Patagonia residents.
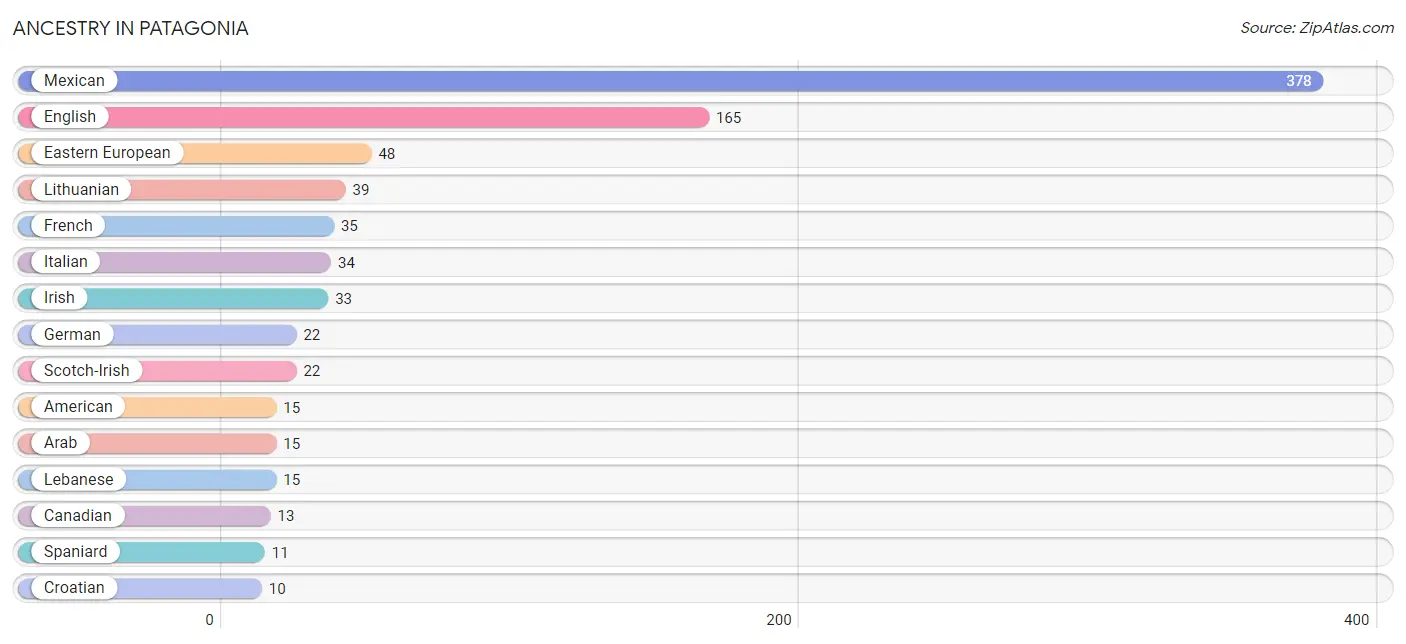
| Ancestry | # Population | % Population |
| American | 15 | 1.7% |
| Arab | 15 | 1.7% |
| British | 4 | 0.4% |
| Canadian | 13 | 1.5% |
| Croatian | 10 | 1.1% |
| Dutch | 10 | 1.1% |
| Eastern European | 48 | 5.4% |
| English | 165 | 18.4% |
| European | 10 | 1.1% |
| French | 35 | 3.9% |
| German | 22 | 2.5% |
| Irish | 33 | 3.7% |
| Italian | 34 | 3.8% |
| Lebanese | 15 | 1.7% |
| Lithuanian | 39 | 4.3% |
| Mexican | 378 | 42.2% |
| Norwegian | 5 | 0.6% |
| Polish | 4 | 0.4% |
| Scotch-Irish | 22 | 2.5% |
| Spaniard | 11 | 1.2% |
| Swedish | 5 | 0.6% |
| Welsh | 3 | 0.3% | View All 22 Rows |
Immigrants in Patagonia
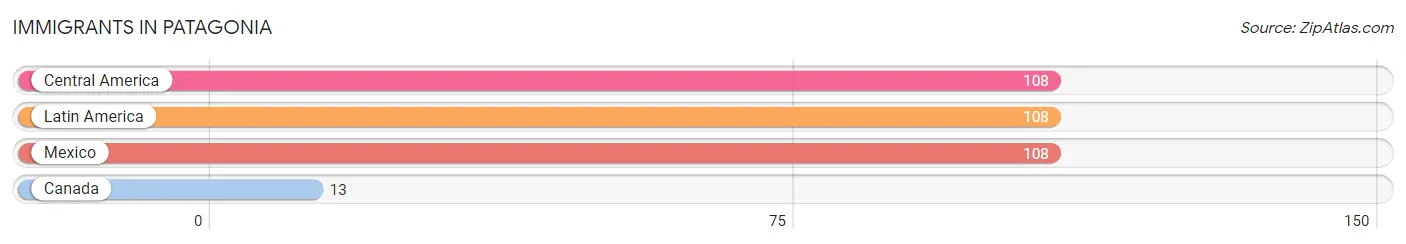
The most numerous immigrant groups reported in Patagonia came from Central America (108 | 12.0%), Latin America (108 | 12.0%), Mexico (108 | 12.0%), and Canada (13 | 1.5%), together accounting for 37.6% of all Patagonia residents.
| Immigration Origin | # Population | % Population |
| Canada | 13 | 1.5% |
| Central America | 108 | 12.0% |
| Latin America | 108 | 12.0% |
| Mexico | 108 | 12.0% | View All 4 Rows |
Sex and Age in Patagonia
Sex and Age in Patagonia
The most populous age groups in Patagonia are 65 to 69 Years (98 | 23.8%) for men and 50 to 54 Years (70 | 14.5%) for women.
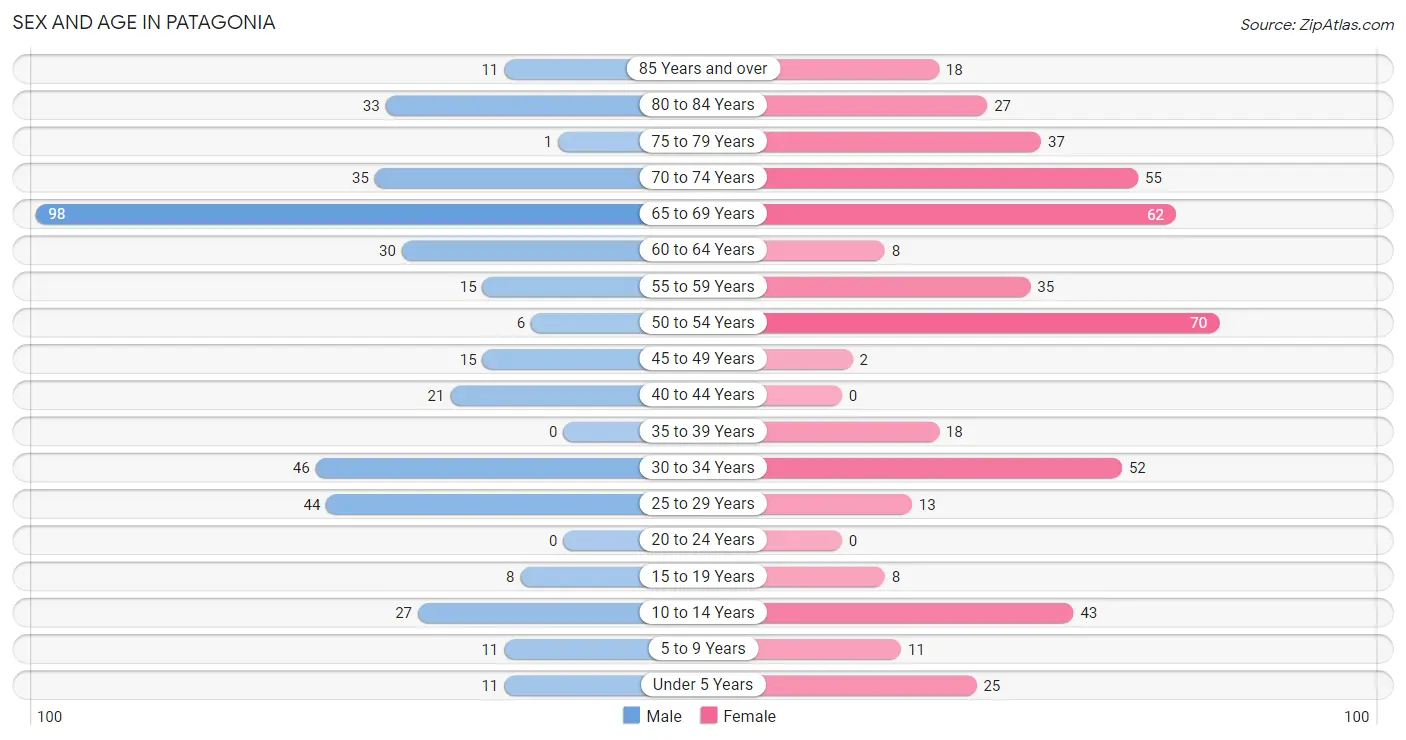
| Age Bracket | Male | Female |
| Under 5 Years | 11 (2.7%) | 25 (5.2%) |
| 5 to 9 Years | 11 (2.7%) | 11 (2.3%) |
| 10 to 14 Years | 27 (6.6%) | 43 (8.9%) |
| 15 to 19 Years | 8 (1.9%) | 8 (1.7%) |
| 20 to 24 Years | 0 (0.0%) | 0 (0.0%) |
| 25 to 29 Years | 44 (10.7%) | 13 (2.7%) |
| 30 to 34 Years | 46 (11.2%) | 52 (10.7%) |
| 35 to 39 Years | 0 (0.0%) | 18 (3.7%) |
| 40 to 44 Years | 21 (5.1%) | 0 (0.0%) |
| 45 to 49 Years | 15 (3.6%) | 2 (0.4%) |
| 50 to 54 Years | 6 (1.5%) | 70 (14.5%) |
| 55 to 59 Years | 15 (3.6%) | 35 (7.2%) |
| 60 to 64 Years | 30 (7.3%) | 8 (1.7%) |
| 65 to 69 Years | 98 (23.8%) | 62 (12.8%) |
| 70 to 74 Years | 35 (8.5%) | 55 (11.4%) |
| 75 to 79 Years | 1 (0.2%) | 37 (7.6%) |
| 80 to 84 Years | 33 (8.0%) | 27 (5.6%) |
| 85 Years and over | 11 (2.7%) | 18 (3.7%) |
| Total | 412 (100.0%) | 484 (100.0%) |
Families and Households in Patagonia
Median Family Size in Patagonia
The median family size in Patagonia is 2.48 persons per family, with single female/mother families (27 | 11.2%) accounting for the largest median family size of 2.81 persons per family. On the other hand, single male/father families (48 | 19.8%) represent the smallest median family size with 2.15 persons per family.
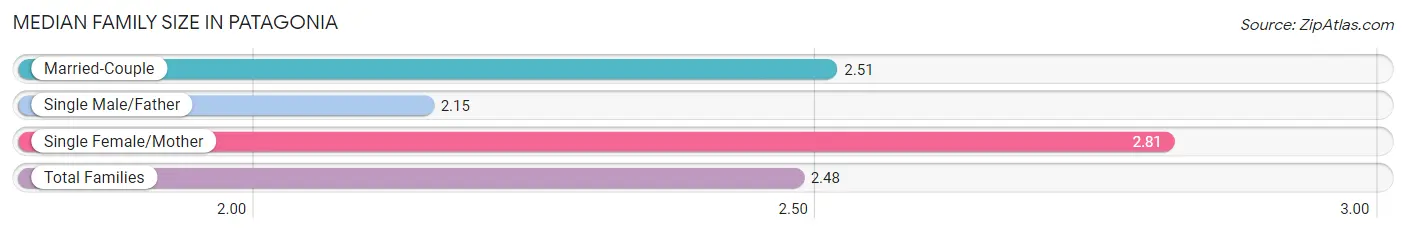
| Family Type | # Families | Family Size |
| Married-Couple | 167 (69.0%) | 2.51 |
| Single Male/Father | 48 (19.8%) | 2.15 |
| Single Female/Mother | 27 (11.2%) | 2.81 |
| Total Families | 242 (100.0%) | 2.48 |
Median Household Size in Patagonia
The median household size in Patagonia is 1.79 persons per household, with single female/mother households (27 | 5.4%) accounting for the largest median household size of 2.81 persons per household. non-family households (259 | 51.7%) represent the smallest median household size with 1.04 persons per household.
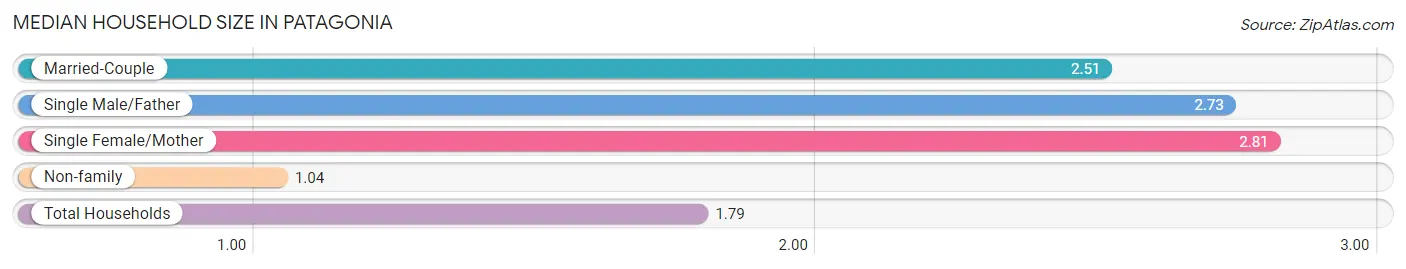
| Household Type | # Households | Household Size |
| Married-Couple | 167 (33.3%) | 2.51 |
| Single Male/Father | 48 (9.6%) | 2.73 |
| Single Female/Mother | 27 (5.4%) | 2.81 |
| Non-family | 259 (51.7%) | 1.04 |
| Total Households | 501 (100.0%) | 1.79 |
Household Size by Marriage Status in Patagonia
Out of a total of 501 households in Patagonia, 242 (48.3%) are family households, while 259 (51.7%) are nonfamily households. The most numerous type of family households are 2-person households, comprising 116, and the most common type of nonfamily households are 1-person households, comprising 249.
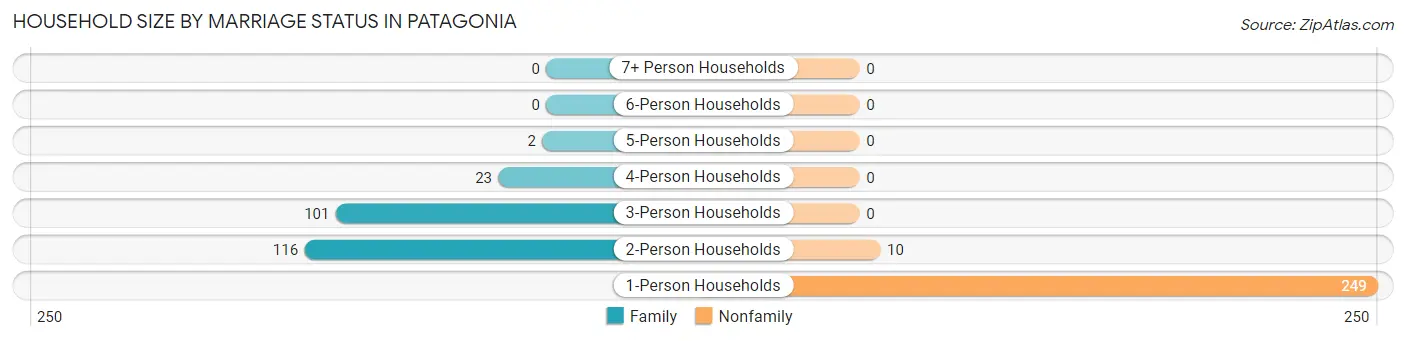
| Household Size | Family Households | Nonfamily Households |
| 1-Person Households | - | 249 (49.7%) |
| 2-Person Households | 116 (23.2%) | 10 (2.0%) |
| 3-Person Households | 101 (20.2%) | 0 (0.0%) |
| 4-Person Households | 23 (4.6%) | 0 (0.0%) |
| 5-Person Households | 2 (0.4%) | 0 (0.0%) |
| 6-Person Households | 0 (0.0%) | 0 (0.0%) |
| 7+ Person Households | 0 (0.0%) | 0 (0.0%) |
| Total | 242 (48.3%) | 259 (51.7%) |
Female Fertility in Patagonia
Fertility by Age in Patagonia
| Age Bracket | Women with Births | Births / 1,000 Women |
| 15 to 19 years | 0 (0.0%) | 0.0 |
| 20 to 34 years | 0 (0.0%) | 0.0 |
| 35 to 50 years | 0 (0.0%) | 0.0 |
| Total | 0 (0.0%) | 0.0 |
Fertility by Age by Marriage Status in Patagonia
| Age Bracket | Married | Unmarried |
| 15 to 19 years | 0 (0.0%) | 0 (0.0%) |
| 20 to 34 years | 0 (0.0%) | 0 (0.0%) |
| 35 to 50 years | 0 (0.0%) | 0 (0.0%) |
| Total | 0 (0.0%) | 0 (0.0%) |
Fertility by Education in Patagonia
| Educational Attainment | Women with Births | Births / 1,000 Women |
| Less than High School | 0 (0.0%) | 0.0 |
| High School Diploma | 0 (0.0%) | 0.0 |
| College or Associate's Degree | 0 (0.0%) | 0.0 |
| Bachelor's Degree | 0 (0.0%) | 0.0 |
| Graduate Degree | 0 (0.0%) | 0.0 |
| Total | 0 (0.0%) | 0.0 |
Fertility by Education by Marriage Status in Patagonia
| Educational Attainment | Married | Unmarried |
| Less than High School | 0 (0.0%) | 0 (0.0%) |
| High School Diploma | 0 (0.0%) | 0 (0.0%) |
| College or Associate's Degree | 0 (0.0%) | 0 (0.0%) |
| Bachelor's Degree | 0 (0.0%) | 0 (0.0%) |
| Graduate Degree | 0 (0.0%) | 0 (0.0%) |
| Total | 0 (0.0%) | 0 (0.0%) |
Employment Characteristics in Patagonia
Employment by Class of Employer in Patagonia
Among the 316 employed individuals in Patagonia, private company employees (106 | 33.5%), self-employed (not incorporated) (80 | 25.3%), and local government employees (42 | 13.3%) make up the most common classes of employment.
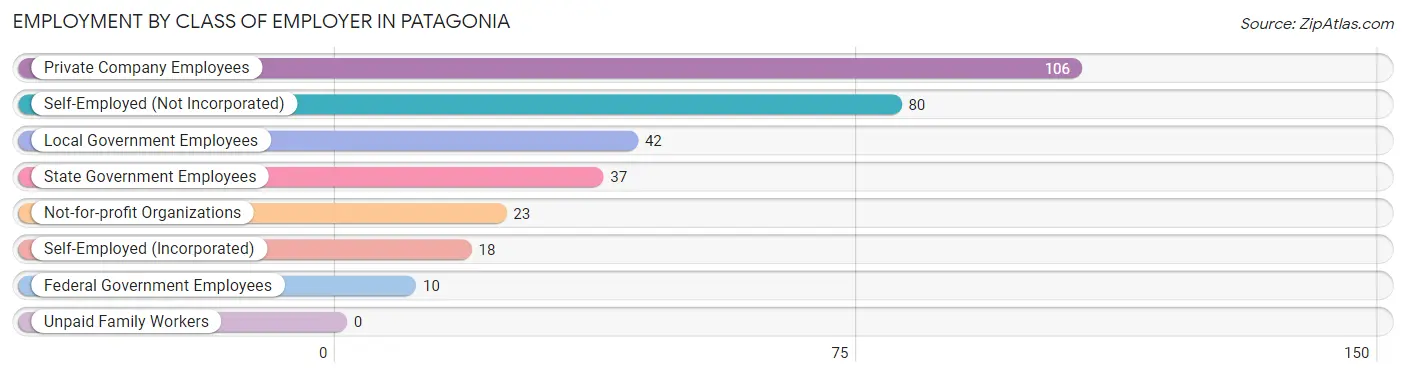
| Employer Class | # Employees | % Employees |
| Private Company Employees | 106 | 33.5% |
| Self-Employed (Incorporated) | 18 | 5.7% |
| Self-Employed (Not Incorporated) | 80 | 25.3% |
| Not-for-profit Organizations | 23 | 7.3% |
| Local Government Employees | 42 | 13.3% |
| State Government Employees | 37 | 11.7% |
| Federal Government Employees | 10 | 3.2% |
| Unpaid Family Workers | 0 | 0.0% |
| Total | 316 | 100.0% |
Employment Status by Age in Patagonia
According to the labor force statistics for Patagonia, out of the total population over 16 years of age (768), 44.3% or 340 individuals are in the labor force, with 7.1% or 24 of them unemployed. The age group with the highest labor force participation rate is 25 to 29 years, with 100.0% or 57 individuals in the labor force. Within the labor force, the 30 to 34 years age range has the highest percentage of unemployed individuals, with 27.6% or 24 of them being unemployed.
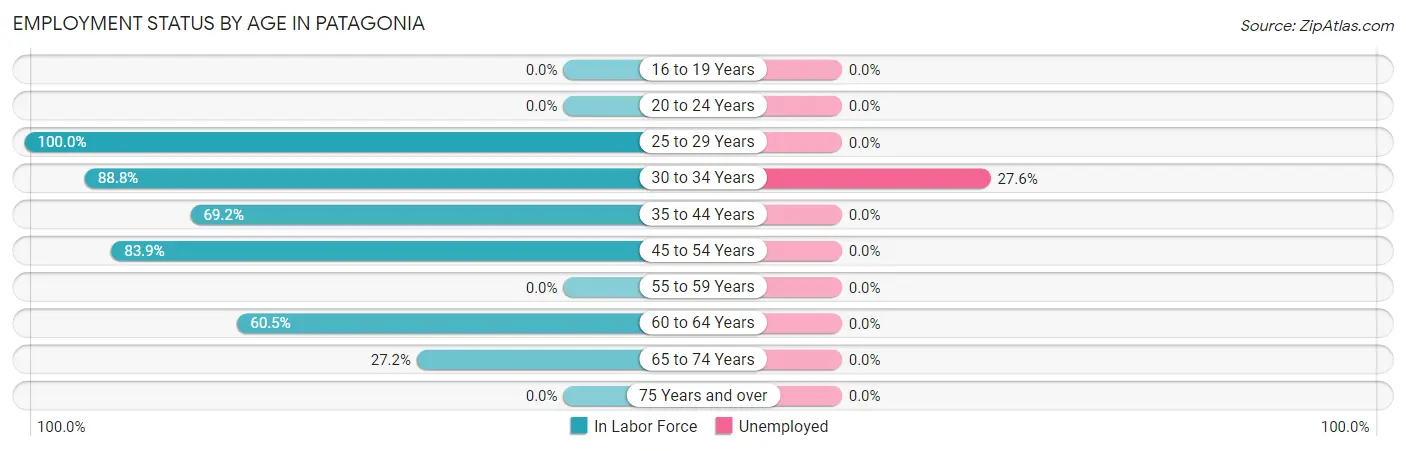
| Age Bracket | In Labor Force | Unemployed |
| 16 to 19 Years | 0 (0.0%) | 0 (0.0%) |
| 20 to 24 Years | 0 (0.0%) | 0 (0.0%) |
| 25 to 29 Years | 57 (100.0%) | 0 (0.0%) |
| 30 to 34 Years | 87 (88.8%) | 24 (27.6%) |
| 35 to 44 Years | 27 (69.2%) | 0 (0.0%) |
| 45 to 54 Years | 78 (83.9%) | 0 (0.0%) |
| 55 to 59 Years | 0 (0.0%) | 0 (0.0%) |
| 60 to 64 Years | 23 (60.5%) | 0 (0.0%) |
| 65 to 74 Years | 68 (27.2%) | 0 (0.0%) |
| 75 Years and over | 0 (0.0%) | 0 (0.0%) |
| Total | 340 (44.3%) | 24 (7.1%) |
Employment Status by Educational Attainment in Patagonia
According to labor force statistics for Patagonia, 72.5% of individuals (272) out of the total population between 25 and 64 years of age (375) are in the labor force, with 8.8% or 24 of them being unemployed. The group with the highest labor force participation rate are those with the educational attainment of bachelor's degree or higher, with 82.2% or 125 individuals in the labor force. Within the labor force, individuals with less than high school education have the highest percentage of unemployment, with 60.0% or 15 of them being unemployed.
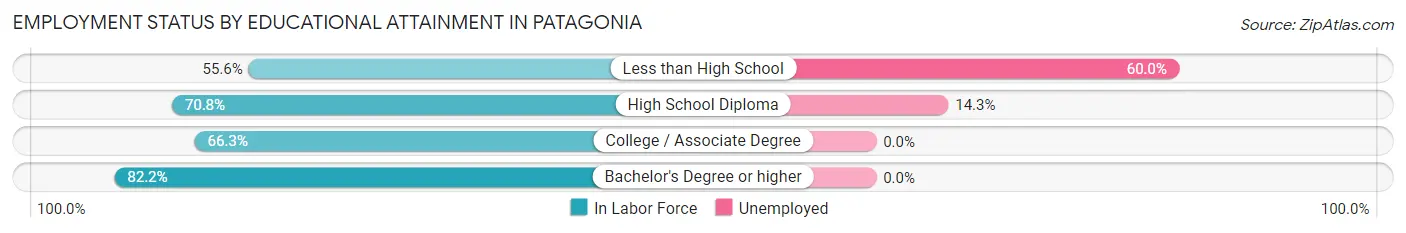
| Educational Attainment | In Labor Force | Unemployed |
| Less than High School | 25 (55.6%) | 27 (60.0%) |
| High School Diploma | 63 (70.8%) | 13 (14.3%) |
| College / Associate Degree | 59 (66.3%) | 0 (0.0%) |
| Bachelor's Degree or higher | 125 (82.2%) | 0 (0.0%) |
| Total | 272 (72.5%) | 33 (8.8%) |
Employment Occupations by Sex in Patagonia
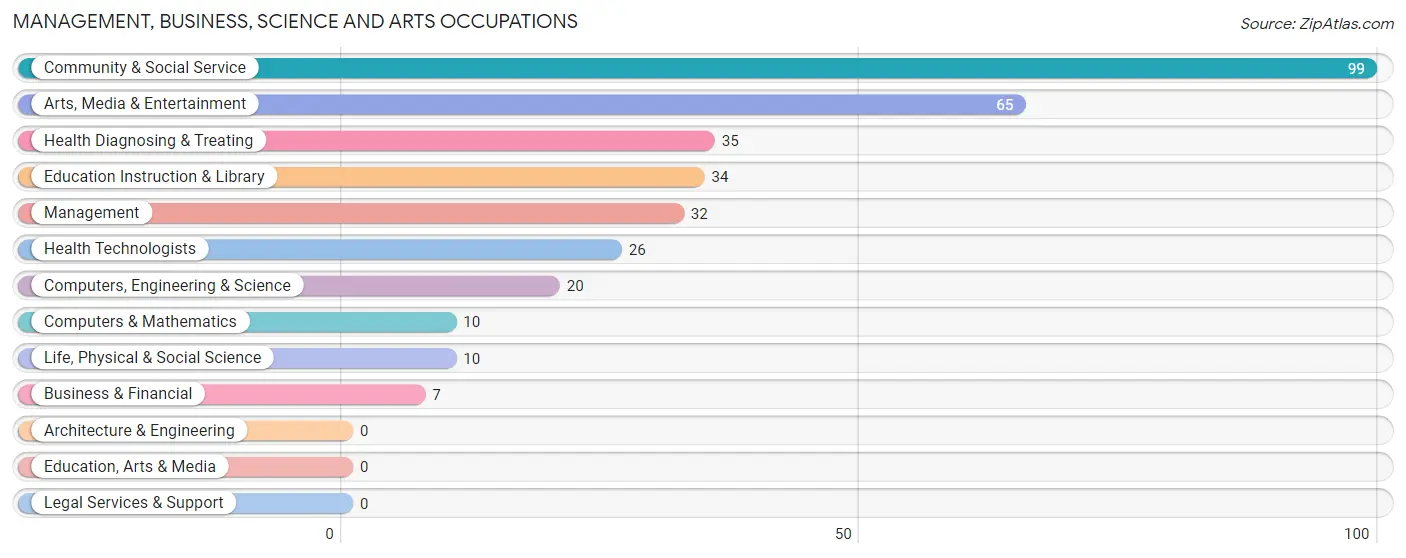
Management, Business, Science and Arts Occupations
The most common Management, Business, Science and Arts occupations in Patagonia are Community & Social Service (99 | 31.3%), Arts, Media & Entertainment (65 | 20.6%), Health Diagnosing & Treating (35 | 11.1%), Education Instruction & Library (34 | 10.8%), and Management (32 | 10.1%).
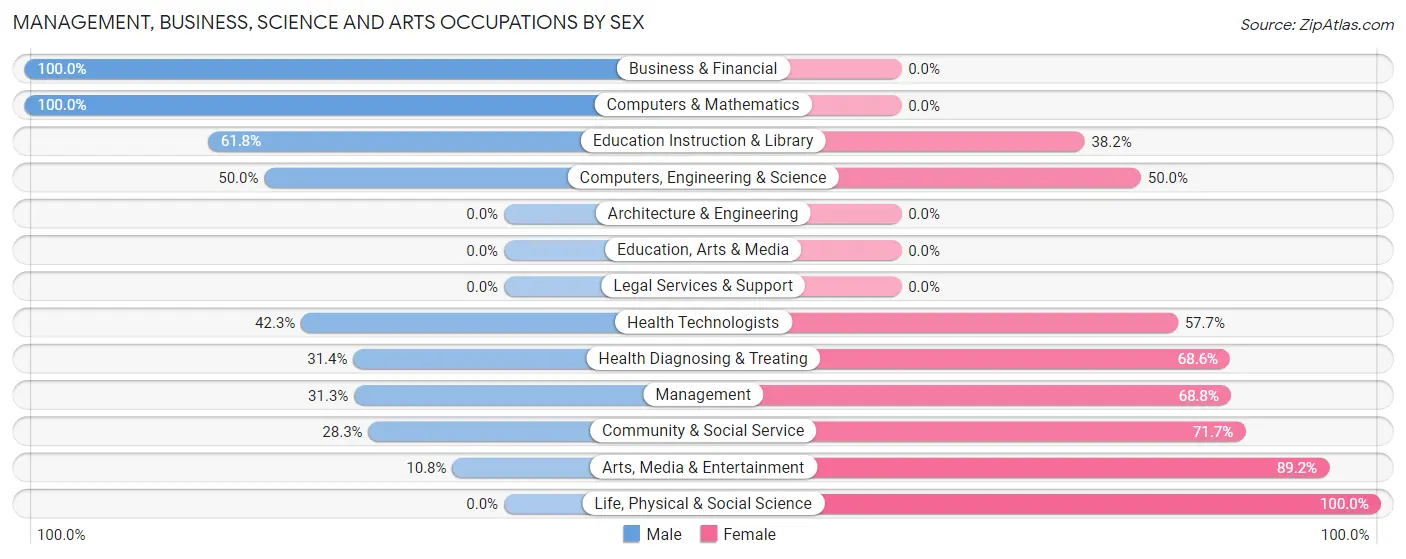
Management, Business, Science and Arts Occupations by Sex
Within the Management, Business, Science and Arts occupations in Patagonia, the most male-oriented occupations are Business & Financial (100.0%), Computers & Mathematics (100.0%), and Education Instruction & Library (61.8%), while the most female-oriented occupations are Life, Physical & Social Science (100.0%), Arts, Media & Entertainment (89.2%), and Community & Social Service (71.7%).
| Occupation | Male | Female |
| Management | 10 (31.2%) | 22 (68.8%) |
| Business & Financial | 7 (100.0%) | 0 (0.0%) |
| Computers, Engineering & Science | 10 (50.0%) | 10 (50.0%) |
| Computers & Mathematics | 10 (100.0%) | 0 (0.0%) |
| Architecture & Engineering | 0 (0.0%) | 0 (0.0%) |
| Life, Physical & Social Science | 0 (0.0%) | 10 (100.0%) |
| Community & Social Service | 28 (28.3%) | 71 (71.7%) |
| Education, Arts & Media | 0 (0.0%) | 0 (0.0%) |
| Legal Services & Support | 0 (0.0%) | 0 (0.0%) |
| Education Instruction & Library | 21 (61.8%) | 13 (38.2%) |
| Arts, Media & Entertainment | 7 (10.8%) | 58 (89.2%) |
| Health Diagnosing & Treating | 11 (31.4%) | 24 (68.6%) |
| Health Technologists | 11 (42.3%) | 15 (57.7%) |
| Total (Category) | 66 (34.2%) | 127 (65.8%) |
| Total (Overall) | 151 (47.8%) | 165 (52.2%) |
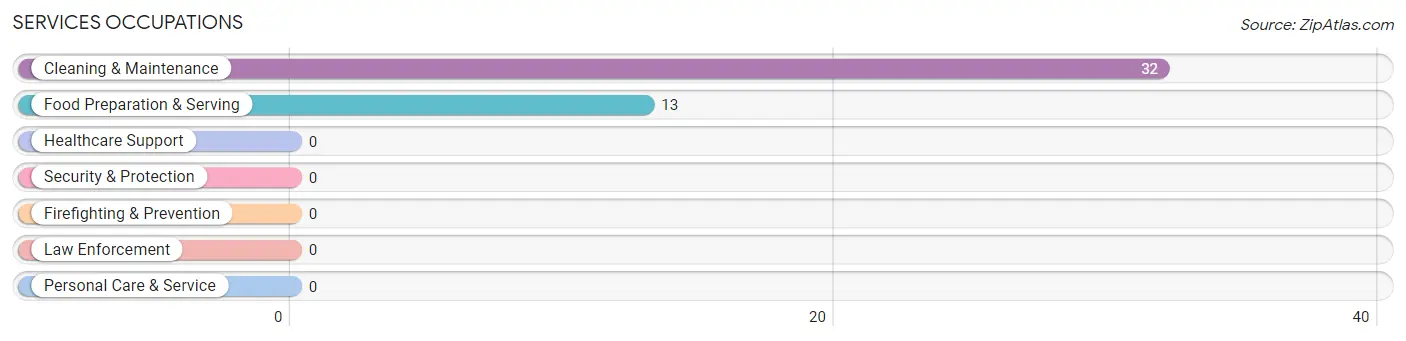
Services Occupations
The most common Services occupations in Patagonia are Cleaning & Maintenance (32 | 10.1%), and Food Preparation & Serving (13 | 4.1%).
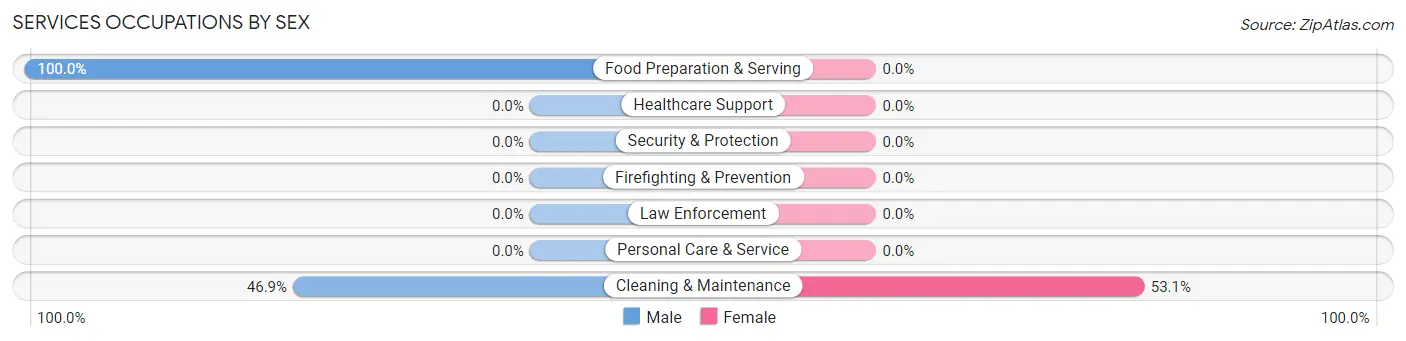
Services Occupations by Sex
| Occupation | Male | Female |
| Healthcare Support | 0 (0.0%) | 0 (0.0%) |
| Security & Protection | 0 (0.0%) | 0 (0.0%) |
| Firefighting & Prevention | 0 (0.0%) | 0 (0.0%) |
| Law Enforcement | 0 (0.0%) | 0 (0.0%) |
| Food Preparation & Serving | 13 (100.0%) | 0 (0.0%) |
| Cleaning & Maintenance | 15 (46.9%) | 17 (53.1%) |
| Personal Care & Service | 0 (0.0%) | 0 (0.0%) |
| Total (Category) | 28 (62.2%) | 17 (37.8%) |
| Total (Overall) | 151 (47.8%) | 165 (52.2%) |
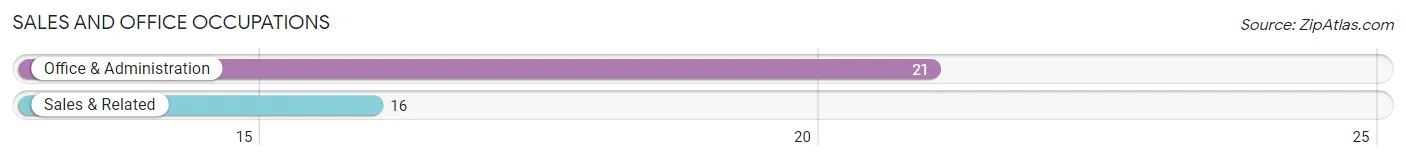
Sales and Office Occupations
The most common Sales and Office occupations in Patagonia are Office & Administration (21 | 6.7%), and Sales & Related (16 | 5.1%).
Sales and Office Occupations by Sex
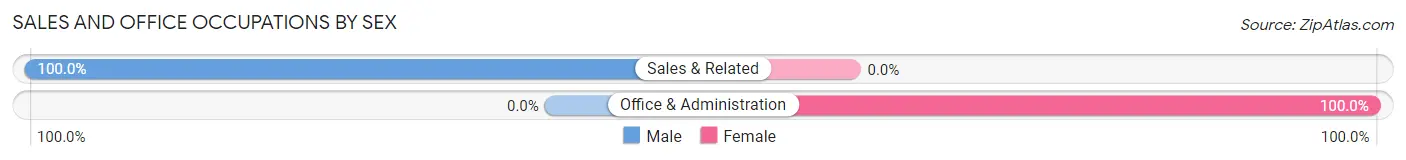
| Occupation | Male | Female |
| Sales & Related | 16 (100.0%) | 0 (0.0%) |
| Office & Administration | 0 (0.0%) | 21 (100.0%) |
| Total (Category) | 16 (43.2%) | 21 (56.8%) |
| Total (Overall) | 151 (47.8%) | 165 (52.2%) |
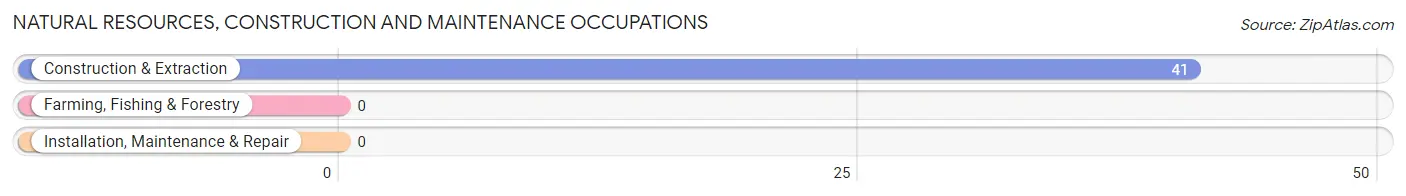
Natural Resources, Construction and Maintenance Occupations
The most common Natural Resources, Construction and Maintenance occupations in Patagonia are , and Construction & Extraction (41 | 13.0%).
Natural Resources, Construction and Maintenance Occupations by Sex
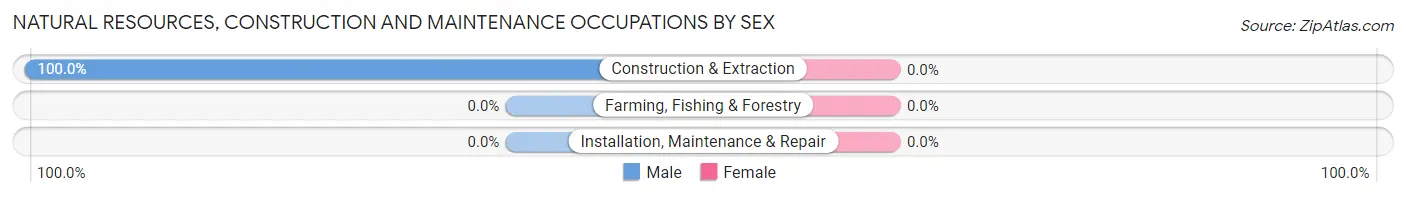
| Occupation | Male | Female |
| Farming, Fishing & Forestry | 0 (0.0%) | 0 (0.0%) |
| Construction & Extraction | 41 (100.0%) | 0 (0.0%) |
| Installation, Maintenance & Repair | 0 (0.0%) | 0 (0.0%) |
| Total (Category) | 41 (100.0%) | 0 (0.0%) |
| Total (Overall) | 151 (47.8%) | 165 (52.2%) |
Production, Transportation and Moving Occupations
Production, Transportation and Moving Occupations by Sex
| Occupation | Male | Female |
| Production | 0 (0.0%) | 0 (0.0%) |
| Transportation | 0 (0.0%) | 0 (0.0%) |
| Material Moving | 0 (0.0%) | 0 (0.0%) |
| Total (Category) | 0 (0.0%) | 0 (0.0%) |
| Total (Overall) | 151 (47.8%) | 165 (52.2%) |
Employment Industries by Sex in Patagonia
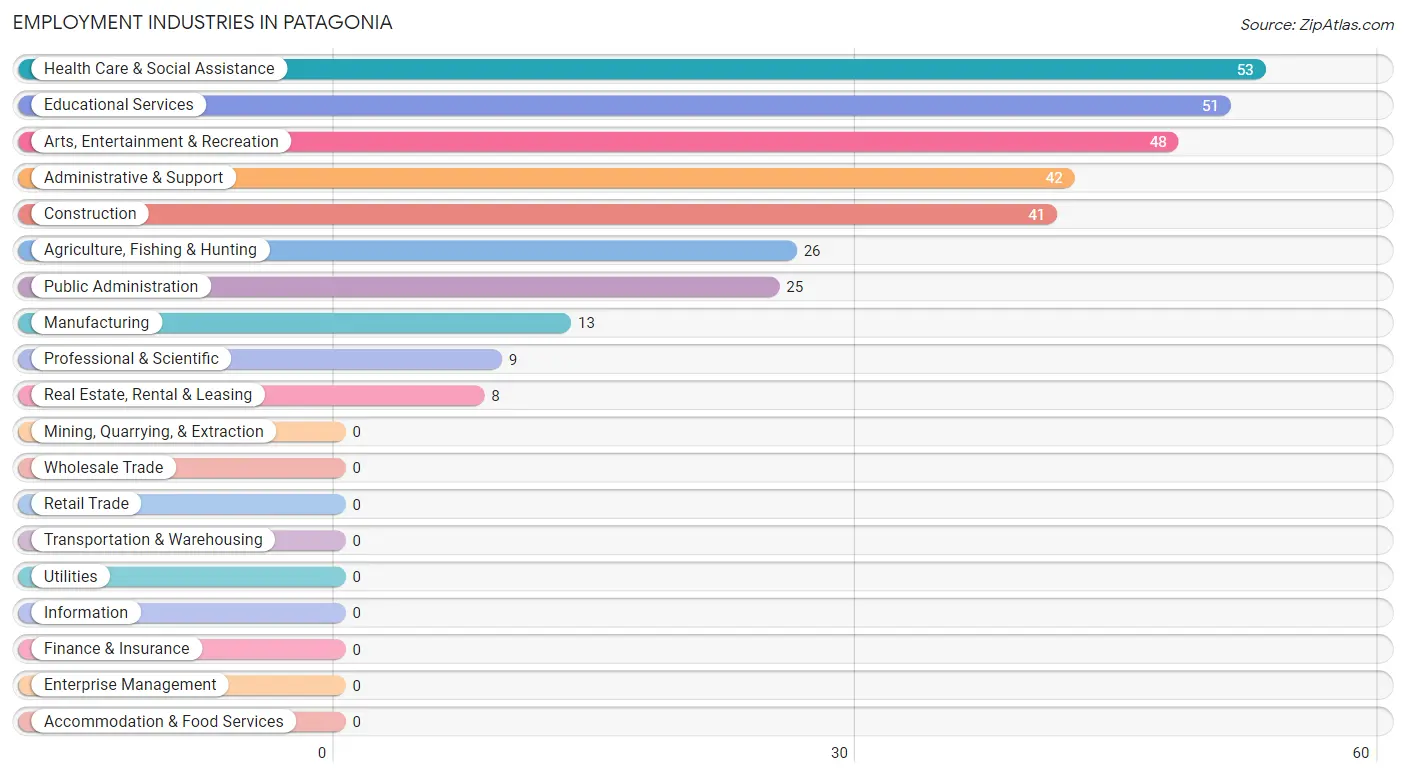
Employment Industries in Patagonia
The major employment industries in Patagonia include Health Care & Social Assistance (53 | 16.8%), Educational Services (51 | 16.1%), Arts, Entertainment & Recreation (48 | 15.2%), Administrative & Support (42 | 13.3%), and Construction (41 | 13.0%).
Employment Industries by Sex in Patagonia
The Patagonia industries that see more men than women are Construction (100.0%), Manufacturing (100.0%), and Real Estate, Rental & Leasing (100.0%), whereas the industries that tend to have a higher number of women are Arts, Entertainment & Recreation (100.0%), Health Care & Social Assistance (79.2%), and Administrative & Support (64.3%).
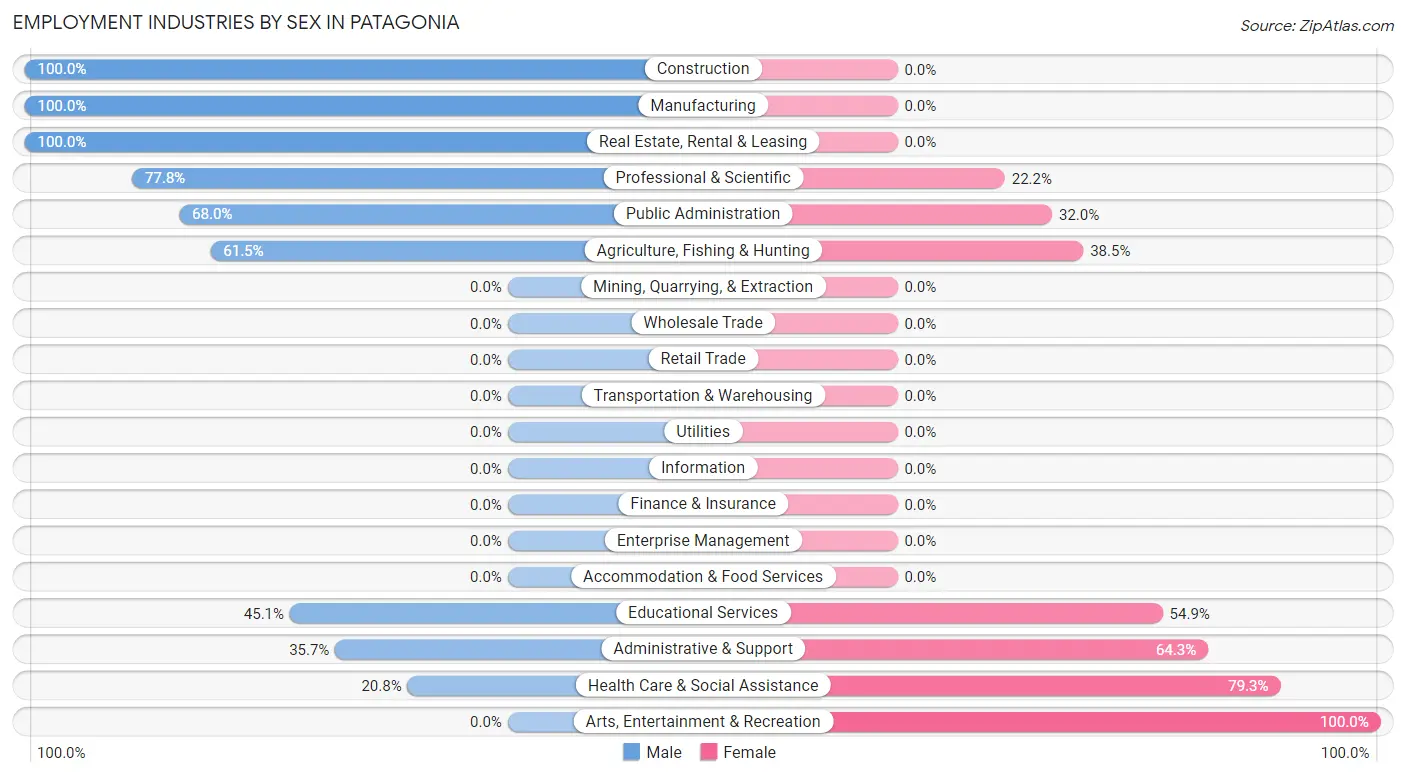
| Industry | Male | Female |
| Agriculture, Fishing & Hunting | 16 (61.5%) | 10 (38.5%) |
| Mining, Quarrying, & Extraction | 0 (0.0%) | 0 (0.0%) |
| Construction | 41 (100.0%) | 0 (0.0%) |
| Manufacturing | 13 (100.0%) | 0 (0.0%) |
| Wholesale Trade | 0 (0.0%) | 0 (0.0%) |
| Retail Trade | 0 (0.0%) | 0 (0.0%) |
| Transportation & Warehousing | 0 (0.0%) | 0 (0.0%) |
| Utilities | 0 (0.0%) | 0 (0.0%) |
| Information | 0 (0.0%) | 0 (0.0%) |
| Finance & Insurance | 0 (0.0%) | 0 (0.0%) |
| Real Estate, Rental & Leasing | 8 (100.0%) | 0 (0.0%) |
| Professional & Scientific | 7 (77.8%) | 2 (22.2%) |
| Enterprise Management | 0 (0.0%) | 0 (0.0%) |
| Administrative & Support | 15 (35.7%) | 27 (64.3%) |
| Educational Services | 23 (45.1%) | 28 (54.9%) |
| Health Care & Social Assistance | 11 (20.7%) | 42 (79.2%) |
| Arts, Entertainment & Recreation | 0 (0.0%) | 48 (100.0%) |
| Accommodation & Food Services | 0 (0.0%) | 0 (0.0%) |
| Public Administration | 17 (68.0%) | 8 (32.0%) |
| Total | 151 (47.8%) | 165 (52.2%) |
Education in Patagonia
School Enrollment in Patagonia
The most common levels of schooling among the 100 students in Patagonia are middle school (45 | 45.0%), high school (33 | 33.0%), and elementary school (22 | 22.0%).
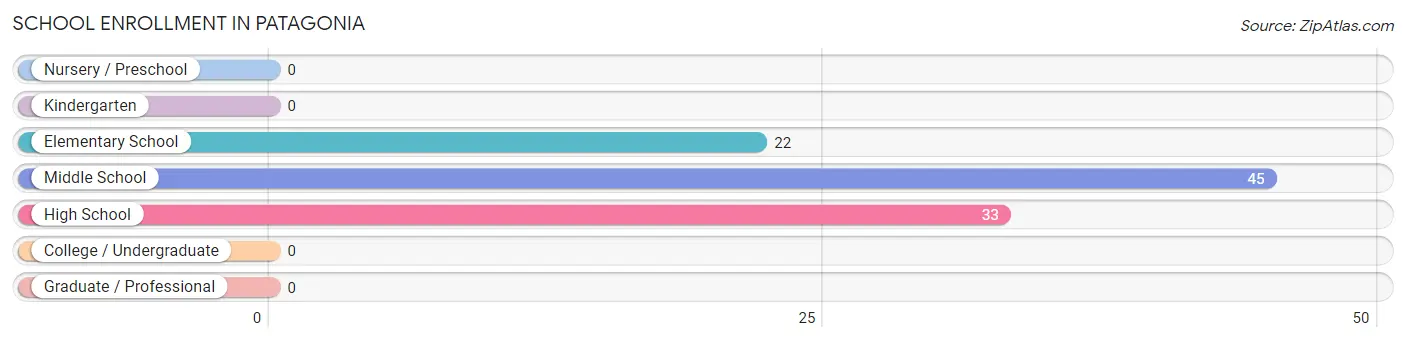
| School Level | # Students | % Students |
| Nursery / Preschool | 0 | 0.0% |
| Kindergarten | 0 | 0.0% |
| Elementary School | 22 | 22.0% |
| Middle School | 45 | 45.0% |
| High School | 33 | 33.0% |
| College / Undergraduate | 0 | 0.0% |
| Graduate / Professional | 0 | 0.0% |
| Total | 100 | 100.0% |
School Enrollment by Age by Funding Source in Patagonia
Out of a total of 100 students who are enrolled in schools in Patagonia, 9 (9.0%) attend a private institution, while the remaining 91 (91.0%) are enrolled in public schools. The age group of 10 to 14 year olds has the highest likelihood of being enrolled in private schools, with 9 (12.9% in the age bracket) enrolled. Conversely, the age group of 5 to 9 year old has the lowest likelihood of being enrolled in a private school, with 22 (100.0% in the age bracket) attending a public institution.
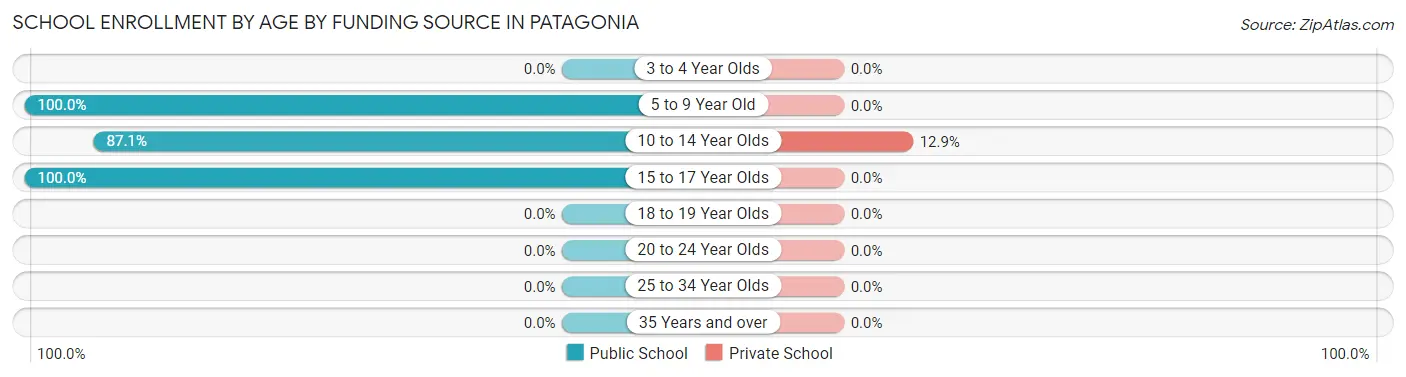
| Age Bracket | Public School | Private School |
| 3 to 4 Year Olds | 0 (0.0%) | 0 (0.0%) |
| 5 to 9 Year Old | 22 (100.0%) | 0 (0.0%) |
| 10 to 14 Year Olds | 61 (87.1%) | 9 (12.9%) |
| 15 to 17 Year Olds | 8 (100.0%) | 0 (0.0%) |
| 18 to 19 Year Olds | 0 (0.0%) | 0 (0.0%) |
| 20 to 24 Year Olds | 0 (0.0%) | 0 (0.0%) |
| 25 to 34 Year Olds | 0 (0.0%) | 0 (0.0%) |
| 35 Years and over | 0 (0.0%) | 0 (0.0%) |
| Total | 91 (91.0%) | 9 (9.0%) |
Educational Attainment by Field of Study in Patagonia
Visual & performing arts (70 | 22.3%), bio, nature & agricultural (54 | 17.2%), communications (48 | 15.3%), education (46 | 14.6%), and science & technology (29 | 9.2%) are the most common fields of study among 314 individuals in Patagonia who have obtained a bachelor's degree or higher.
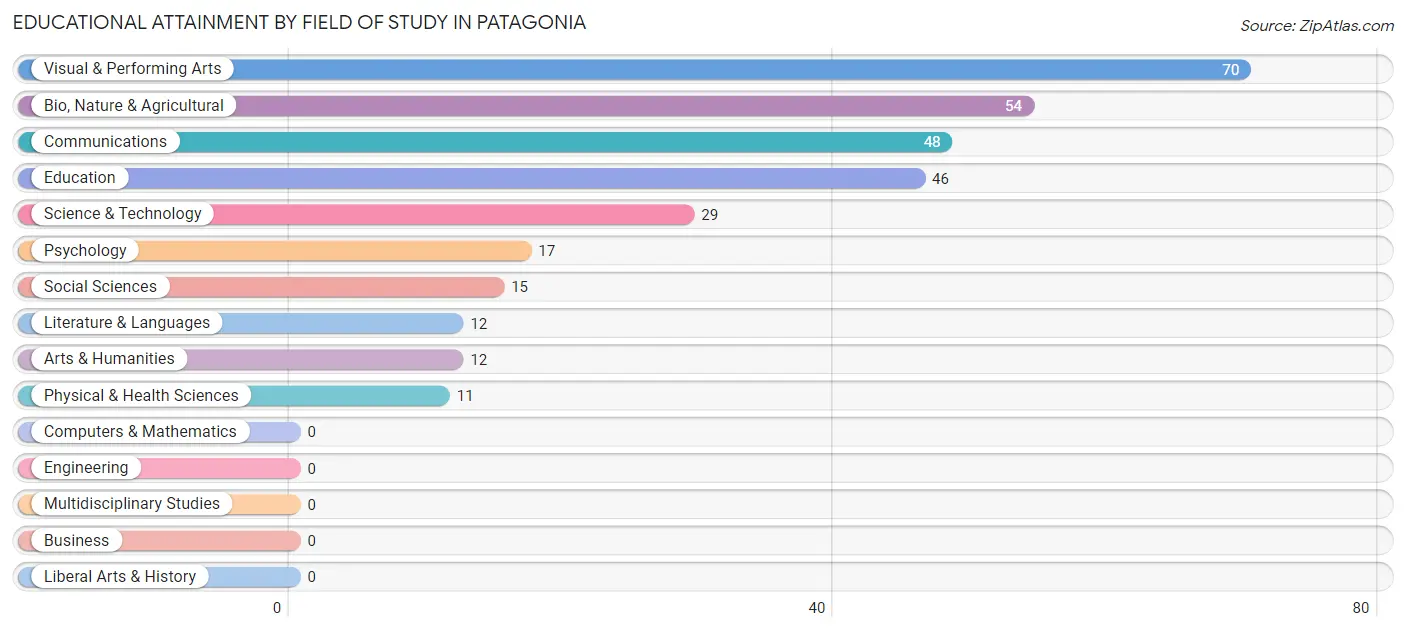
| Field of Study | # Graduates | % Graduates |
| Computers & Mathematics | 0 | 0.0% |
| Bio, Nature & Agricultural | 54 | 17.2% |
| Physical & Health Sciences | 11 | 3.5% |
| Psychology | 17 | 5.4% |
| Social Sciences | 15 | 4.8% |
| Engineering | 0 | 0.0% |
| Multidisciplinary Studies | 0 | 0.0% |
| Science & Technology | 29 | 9.2% |
| Business | 0 | 0.0% |
| Education | 46 | 14.6% |
| Literature & Languages | 12 | 3.8% |
| Liberal Arts & History | 0 | 0.0% |
| Visual & Performing Arts | 70 | 22.3% |
| Communications | 48 | 15.3% |
| Arts & Humanities | 12 | 3.8% |
| Total | 314 | 100.0% |
Transportation & Commute in Patagonia
Vehicle Availability by Sex in Patagonia
The most prevalent vehicle ownership categories in Patagonia are males with 3 vehicles (102, accounting for 67.5%) and females with 3 vehicles (47, making up 61.8%).
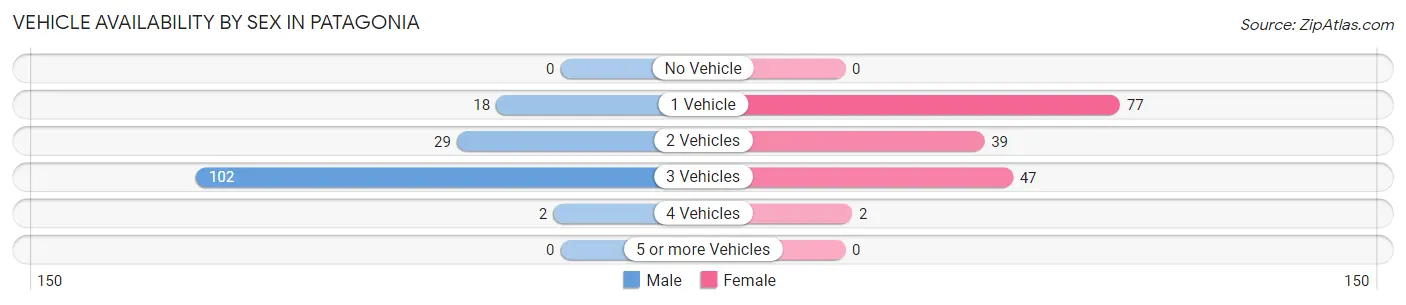
| Vehicles Available | Male | Female |
| No Vehicle | 0 (0.0%) | 0 (0.0%) |
| 1 Vehicle | 18 (11.9%) | 77 (46.7%) |
| 2 Vehicles | 29 (19.2%) | 39 (23.6%) |
| 3 Vehicles | 102 (67.5%) | 47 (28.5%) |
| 4 Vehicles | 2 (1.3%) | 2 (1.2%) |
| 5 or more Vehicles | 0 (0.0%) | 0 (0.0%) |
| Total | 151 (100.0%) | 165 (100.0%) |
Commute Time in Patagonia
The most frequently occuring commute durations in Patagonia are less than 5 minutes (47 commuters, 19.1%), 10 to 14 minutes (42 commuters, 17.1%), and 30 to 34 minutes (41 commuters, 16.7%).
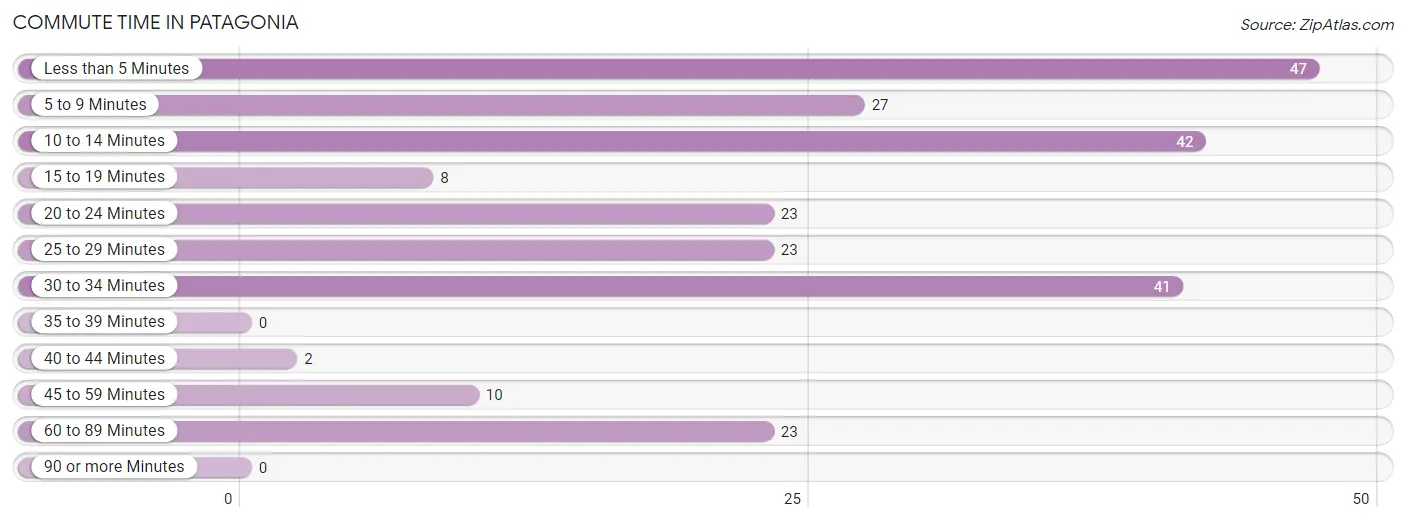
| Commute Time | # Commuters | % Commuters |
| Less than 5 Minutes | 47 | 19.1% |
| 5 to 9 Minutes | 27 | 11.0% |
| 10 to 14 Minutes | 42 | 17.1% |
| 15 to 19 Minutes | 8 | 3.3% |
| 20 to 24 Minutes | 23 | 9.3% |
| 25 to 29 Minutes | 23 | 9.3% |
| 30 to 34 Minutes | 41 | 16.7% |
| 35 to 39 Minutes | 0 | 0.0% |
| 40 to 44 Minutes | 2 | 0.8% |
| 45 to 59 Minutes | 10 | 4.1% |
| 60 to 89 Minutes | 23 | 9.3% |
| 90 or more Minutes | 0 | 0.0% |
Commute Time by Sex in Patagonia
The most common commute times in Patagonia are 10 to 14 minutes (42 commuters, 30.4%) for males and 5 to 9 minutes (27 commuters, 25.0%) for females.
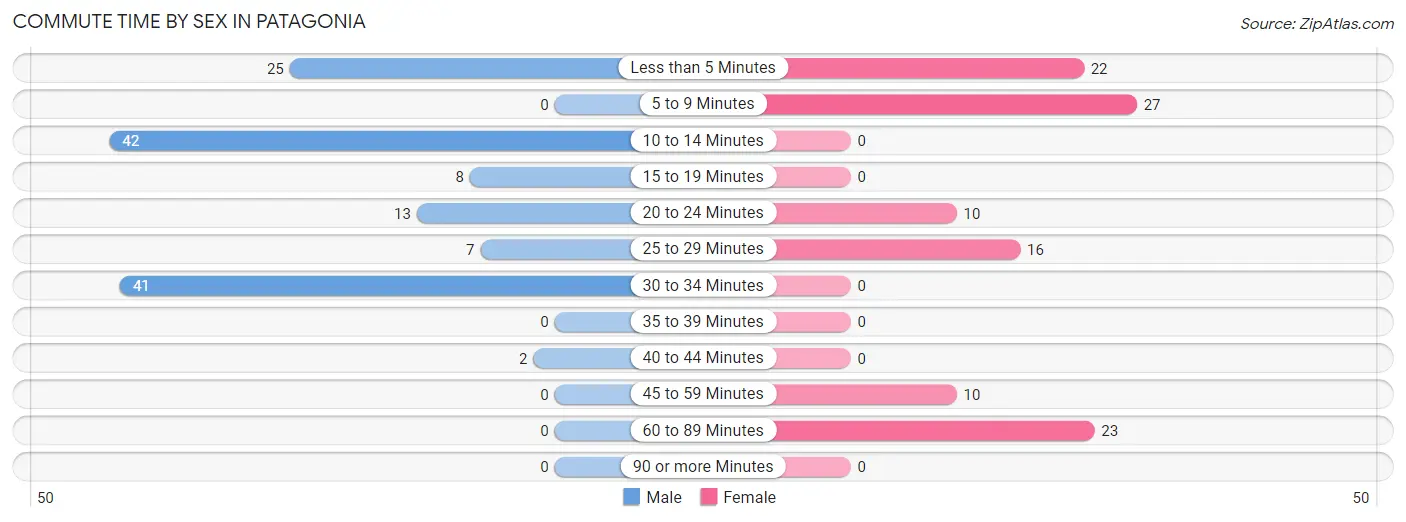
| Commute Time | Male | Female |
| Less than 5 Minutes | 25 (18.1%) | 22 (20.4%) |
| 5 to 9 Minutes | 0 (0.0%) | 27 (25.0%) |
| 10 to 14 Minutes | 42 (30.4%) | 0 (0.0%) |
| 15 to 19 Minutes | 8 (5.8%) | 0 (0.0%) |
| 20 to 24 Minutes | 13 (9.4%) | 10 (9.3%) |
| 25 to 29 Minutes | 7 (5.1%) | 16 (14.8%) |
| 30 to 34 Minutes | 41 (29.7%) | 0 (0.0%) |
| 35 to 39 Minutes | 0 (0.0%) | 0 (0.0%) |
| 40 to 44 Minutes | 2 (1.5%) | 0 (0.0%) |
| 45 to 59 Minutes | 0 (0.0%) | 10 (9.3%) |
| 60 to 89 Minutes | 0 (0.0%) | 23 (21.3%) |
| 90 or more Minutes | 0 (0.0%) | 0 (0.0%) |
Time of Departure to Work by Sex in Patagonia
The most frequent times of departure to work in Patagonia are 12:00 AM to 4:59 AM (31, 22.5%) for males and 8:00 AM to 8:29 AM (36, 33.3%) for females.
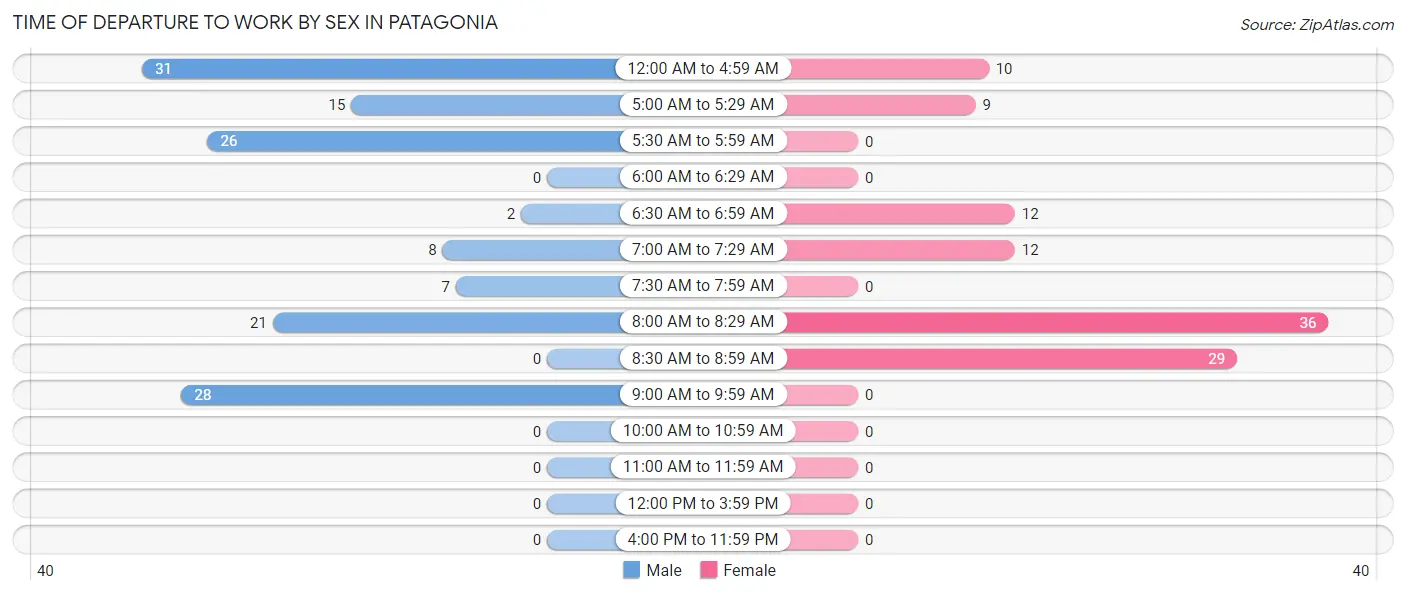
| Time of Departure | Male | Female |
| 12:00 AM to 4:59 AM | 31 (22.5%) | 10 (9.3%) |
| 5:00 AM to 5:29 AM | 15 (10.9%) | 9 (8.3%) |
| 5:30 AM to 5:59 AM | 26 (18.8%) | 0 (0.0%) |
| 6:00 AM to 6:29 AM | 0 (0.0%) | 0 (0.0%) |
| 6:30 AM to 6:59 AM | 2 (1.5%) | 12 (11.1%) |
| 7:00 AM to 7:29 AM | 8 (5.8%) | 12 (11.1%) |
| 7:30 AM to 7:59 AM | 7 (5.1%) | 0 (0.0%) |
| 8:00 AM to 8:29 AM | 21 (15.2%) | 36 (33.3%) |
| 8:30 AM to 8:59 AM | 0 (0.0%) | 29 (26.9%) |
| 9:00 AM to 9:59 AM | 28 (20.3%) | 0 (0.0%) |
| 10:00 AM to 10:59 AM | 0 (0.0%) | 0 (0.0%) |
| 11:00 AM to 11:59 AM | 0 (0.0%) | 0 (0.0%) |
| 12:00 PM to 3:59 PM | 0 (0.0%) | 0 (0.0%) |
| 4:00 PM to 11:59 PM | 0 (0.0%) | 0 (0.0%) |
| Total | 138 (100.0%) | 108 (100.0%) |
Housing Occupancy in Patagonia
Occupancy by Ownership in Patagonia
Of the total 501 dwellings in Patagonia, owner-occupied units account for 250 (49.9%), while renter-occupied units make up 251 (50.1%).
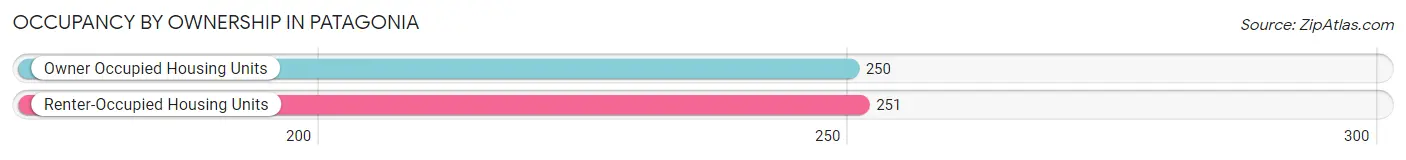
| Occupancy | # Housing Units | % Housing Units |
| Owner Occupied Housing Units | 250 | 49.9% |
| Renter-Occupied Housing Units | 251 | 50.1% |
| Total Occupied Housing Units | 501 | 100.0% |
Occupancy by Household Size in Patagonia
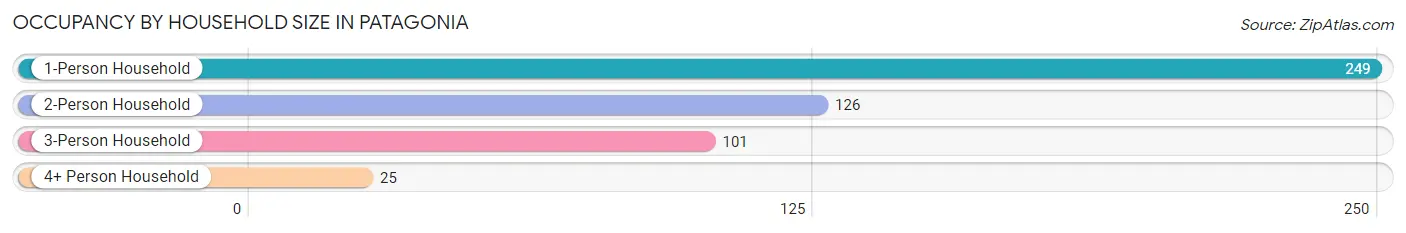
| Household Size | # Housing Units | % Housing Units |
| 1-Person Household | 249 | 49.7% |
| 2-Person Household | 126 | 25.2% |
| 3-Person Household | 101 | 20.2% |
| 4+ Person Household | 25 | 5.0% |
| Total Housing Units | 501 | 100.0% |
Occupancy by Ownership by Household Size in Patagonia
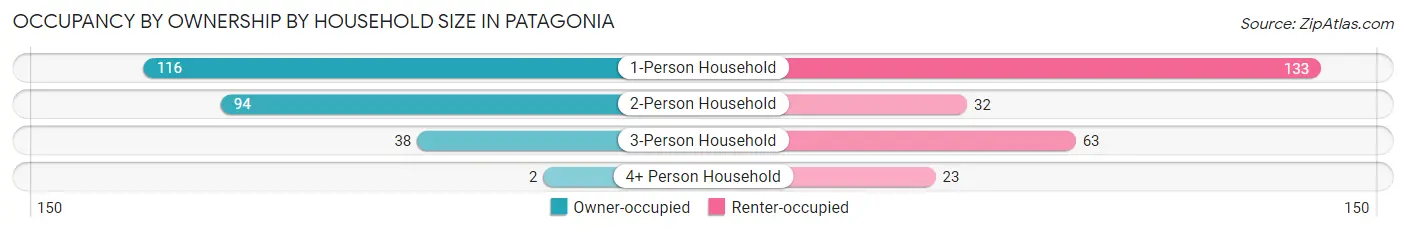
| Household Size | Owner-occupied | Renter-occupied |
| 1-Person Household | 116 (46.6%) | 133 (53.4%) |
| 2-Person Household | 94 (74.6%) | 32 (25.4%) |
| 3-Person Household | 38 (37.6%) | 63 (62.4%) |
| 4+ Person Household | 2 (8.0%) | 23 (92.0%) |
| Total Housing Units | 250 (49.9%) | 251 (50.1%) |
Occupancy by Educational Attainment in Patagonia
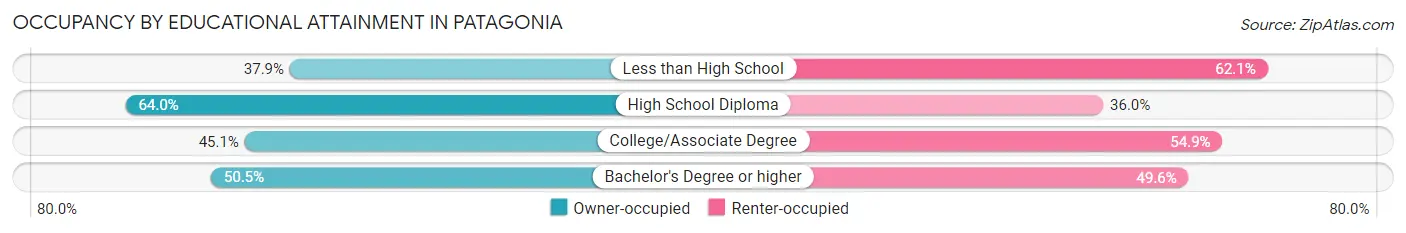
| Household Size | Owner-occupied | Renter-occupied |
| Less than High School | 11 (37.9%) | 18 (62.1%) |
| High School Diploma | 48 (64.0%) | 27 (36.0%) |
| College/Associate Degree | 78 (45.1%) | 95 (54.9%) |
| Bachelor's Degree or higher | 113 (50.4%) | 111 (49.5%) |
Occupancy by Age of Householder in Patagonia
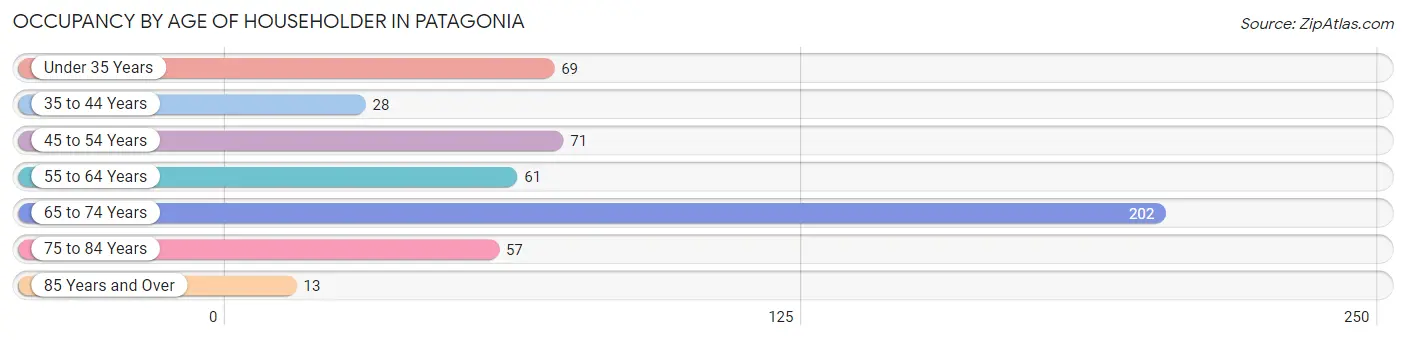
| Age Bracket | # Households | % Households |
| Under 35 Years | 69 | 13.8% |
| 35 to 44 Years | 28 | 5.6% |
| 45 to 54 Years | 71 | 14.2% |
| 55 to 64 Years | 61 | 12.2% |
| 65 to 74 Years | 202 | 40.3% |
| 75 to 84 Years | 57 | 11.4% |
| 85 Years and Over | 13 | 2.6% |
| Total | 501 | 100.0% |
Housing Finances in Patagonia
Median Income by Occupancy in Patagonia
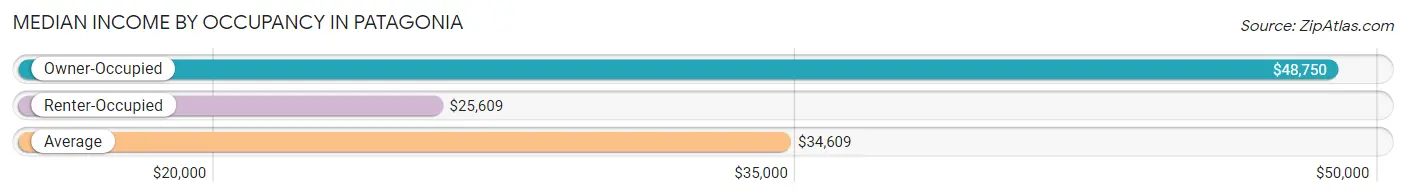
| Occupancy Type | # Households | Median Income |
| Owner-Occupied | 250 (49.9%) | $48,750 |
| Renter-Occupied | 251 (50.1%) | $25,609 |
| Average | 501 (100.0%) | $34,609 |
Occupancy by Householder Income Bracket in Patagonia
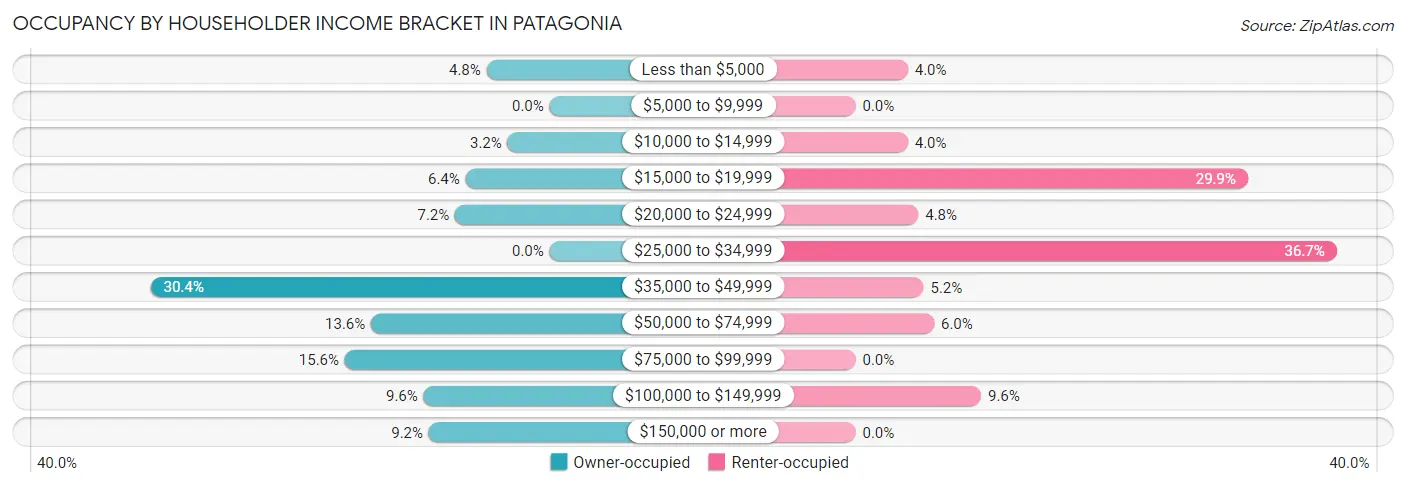
| Income Bracket | Owner-occupied | Renter-occupied |
| Less than $5,000 | 12 (4.8%) | 10 (4.0%) |
| $5,000 to $9,999 | 0 (0.0%) | 0 (0.0%) |
| $10,000 to $14,999 | 8 (3.2%) | 10 (4.0%) |
| $15,000 to $19,999 | 16 (6.4%) | 75 (29.9%) |
| $20,000 to $24,999 | 18 (7.2%) | 12 (4.8%) |
| $25,000 to $34,999 | 0 (0.0%) | 92 (36.6%) |
| $35,000 to $49,999 | 76 (30.4%) | 13 (5.2%) |
| $50,000 to $74,999 | 34 (13.6%) | 15 (6.0%) |
| $75,000 to $99,999 | 39 (15.6%) | 0 (0.0%) |
| $100,000 to $149,999 | 24 (9.6%) | 24 (9.6%) |
| $150,000 or more | 23 (9.2%) | 0 (0.0%) |
| Total | 250 (100.0%) | 251 (100.0%) |
Monthly Housing Cost Tiers in Patagonia
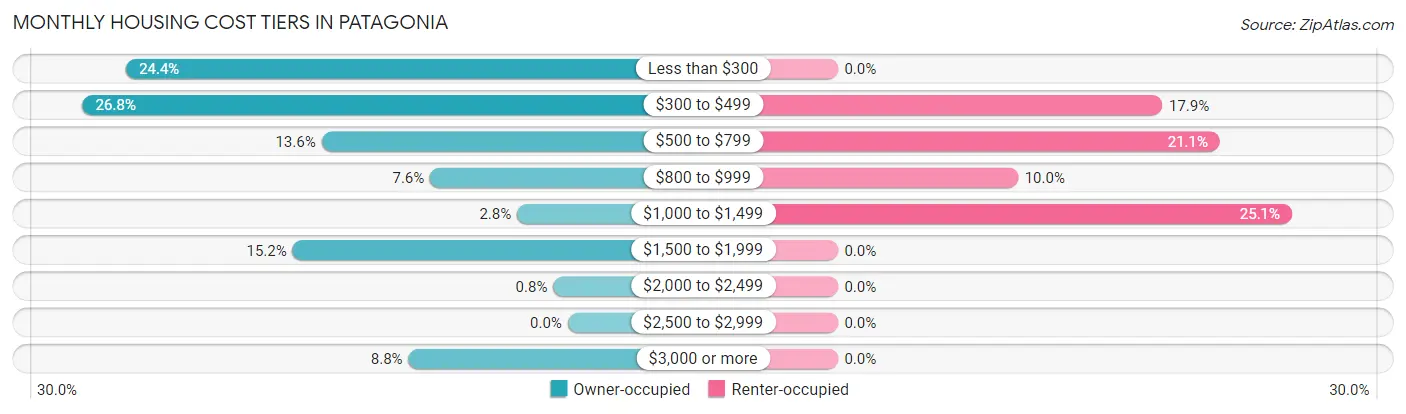
| Monthly Cost | Owner-occupied | Renter-occupied |
| Less than $300 | 61 (24.4%) | 0 (0.0%) |
| $300 to $499 | 67 (26.8%) | 45 (17.9%) |
| $500 to $799 | 34 (13.6%) | 53 (21.1%) |
| $800 to $999 | 19 (7.6%) | 25 (10.0%) |
| $1,000 to $1,499 | 7 (2.8%) | 63 (25.1%) |
| $1,500 to $1,999 | 38 (15.2%) | 0 (0.0%) |
| $2,000 to $2,499 | 2 (0.8%) | 0 (0.0%) |
| $2,500 to $2,999 | 0 (0.0%) | 0 (0.0%) |
| $3,000 or more | 22 (8.8%) | 0 (0.0%) |
| Total | 250 (100.0%) | 251 (100.0%) |
Physical Housing Characteristics in Patagonia
Housing Structures in Patagonia
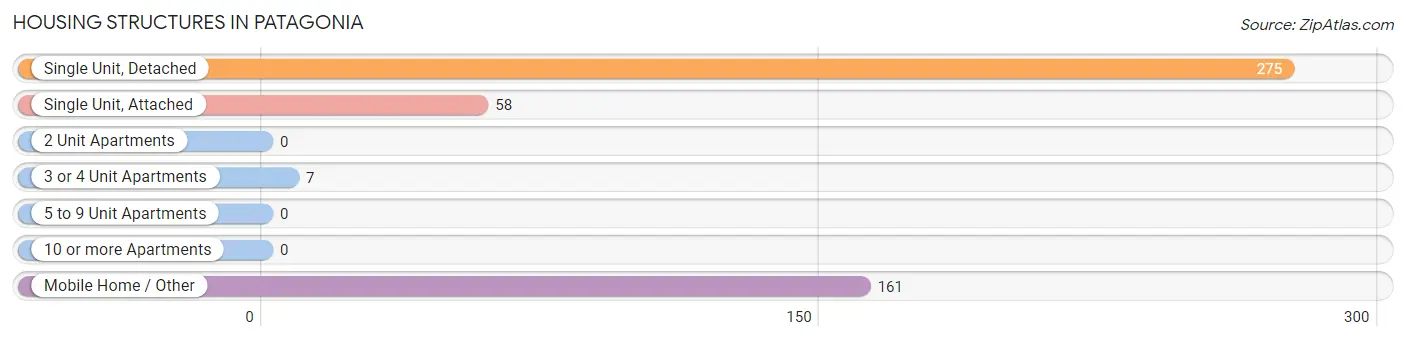
| Structure Type | # Housing Units | % Housing Units |
| Single Unit, Detached | 275 | 54.9% |
| Single Unit, Attached | 58 | 11.6% |
| 2 Unit Apartments | 0 | 0.0% |
| 3 or 4 Unit Apartments | 7 | 1.4% |
| 5 to 9 Unit Apartments | 0 | 0.0% |
| 10 or more Apartments | 0 | 0.0% |
| Mobile Home / Other | 161 | 32.1% |
| Total | 501 | 100.0% |
Housing Structures by Occupancy in Patagonia
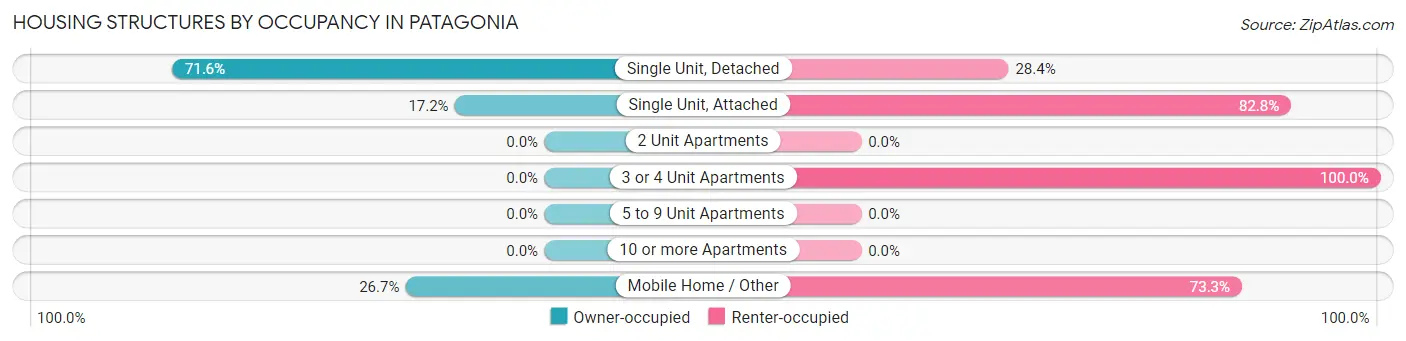
| Structure Type | Owner-occupied | Renter-occupied |
| Single Unit, Detached | 197 (71.6%) | 78 (28.4%) |
| Single Unit, Attached | 10 (17.2%) | 48 (82.8%) |
| 2 Unit Apartments | 0 (0.0%) | 0 (0.0%) |
| 3 or 4 Unit Apartments | 0 (0.0%) | 7 (100.0%) |
| 5 to 9 Unit Apartments | 0 (0.0%) | 0 (0.0%) |
| 10 or more Apartments | 0 (0.0%) | 0 (0.0%) |
| Mobile Home / Other | 43 (26.7%) | 118 (73.3%) |
| Total | 250 (49.9%) | 251 (50.1%) |
Housing Structures by Number of Rooms in Patagonia
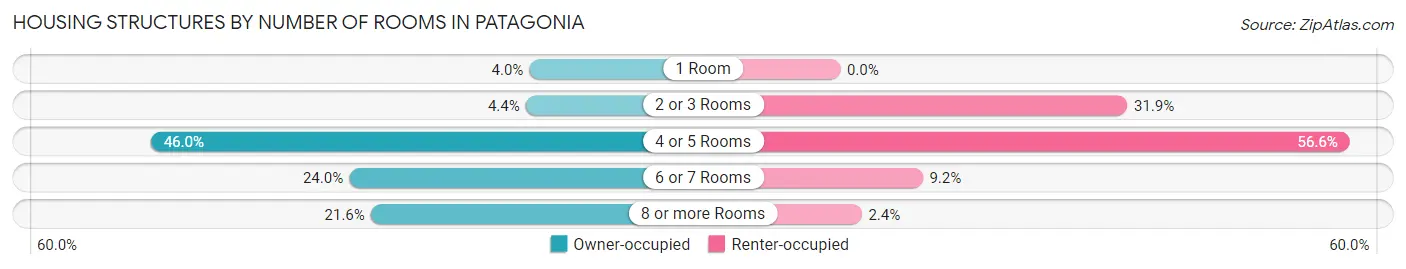
| Number of Rooms | Owner-occupied | Renter-occupied |
| 1 Room | 10 (4.0%) | 0 (0.0%) |
| 2 or 3 Rooms | 11 (4.4%) | 80 (31.9%) |
| 4 or 5 Rooms | 115 (46.0%) | 142 (56.6%) |
| 6 or 7 Rooms | 60 (24.0%) | 23 (9.2%) |
| 8 or more Rooms | 54 (21.6%) | 6 (2.4%) |
| Total | 250 (100.0%) | 251 (100.0%) |
Housing Structure by Heating Type in Patagonia
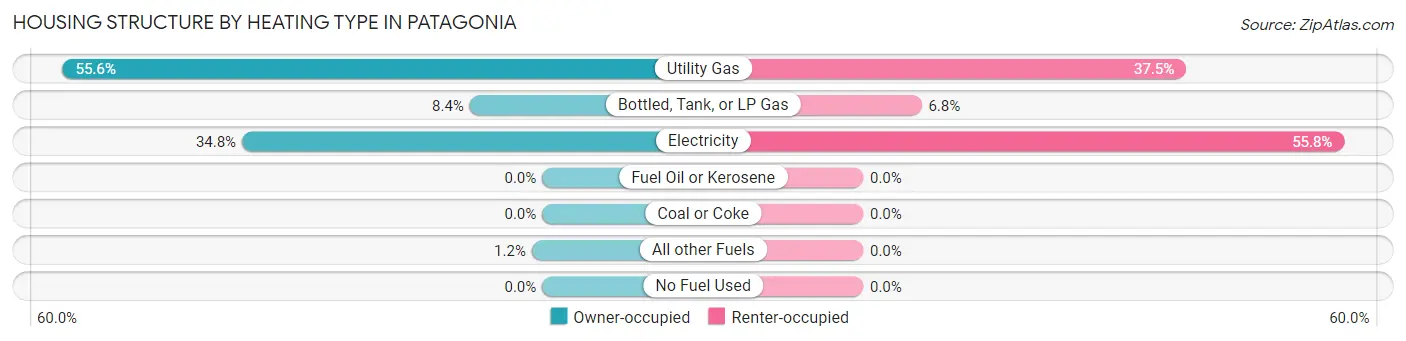
| Heating Type | Owner-occupied | Renter-occupied |
| Utility Gas | 139 (55.6%) | 94 (37.4%) |
| Bottled, Tank, or LP Gas | 21 (8.4%) | 17 (6.8%) |
| Electricity | 87 (34.8%) | 140 (55.8%) |
| Fuel Oil or Kerosene | 0 (0.0%) | 0 (0.0%) |
| Coal or Coke | 0 (0.0%) | 0 (0.0%) |
| All other Fuels | 3 (1.2%) | 0 (0.0%) |
| No Fuel Used | 0 (0.0%) | 0 (0.0%) |
| Total | 250 (100.0%) | 251 (100.0%) |
Household Vehicle Usage in Patagonia
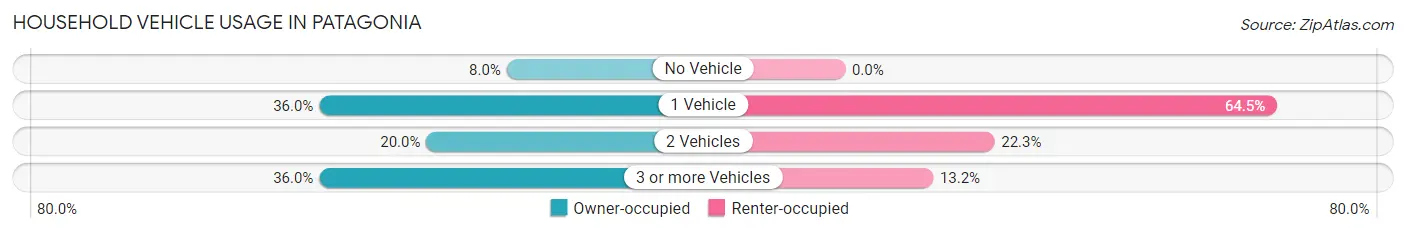
| Vehicles per Household | Owner-occupied | Renter-occupied |
| No Vehicle | 20 (8.0%) | 0 (0.0%) |
| 1 Vehicle | 90 (36.0%) | 162 (64.5%) |
| 2 Vehicles | 50 (20.0%) | 56 (22.3%) |
| 3 or more Vehicles | 90 (36.0%) | 33 (13.2%) |
| Total | 250 (100.0%) | 251 (100.0%) |
Real Estate & Mortgages in Patagonia
Real Estate and Mortgage Overview in Patagonia
| Characteristic | Without Mortgage | With Mortgage |
| Housing Units | 166 | 84 |
| Median Property Value | $309,200 | $335,700 |
| Median Household Income | $41,250 | $23 |
| Monthly Housing Costs | $401 | $22 |
| Real Estate Taxes | $1,710 | $0 |
Property Value by Mortgage Status in Patagonia
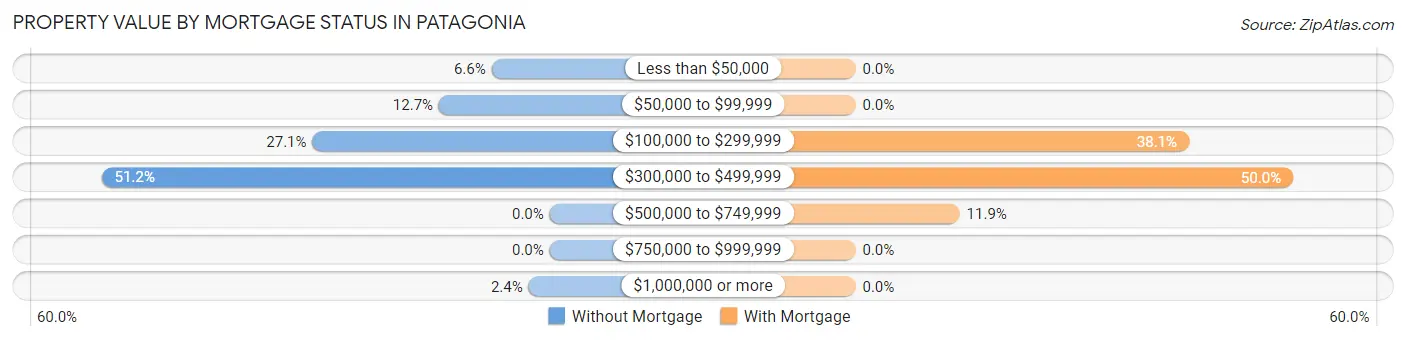
| Property Value | Without Mortgage | With Mortgage |
| Less than $50,000 | 11 (6.6%) | 0 (0.0%) |
| $50,000 to $99,999 | 21 (12.7%) | 0 (0.0%) |
| $100,000 to $299,999 | 45 (27.1%) | 32 (38.1%) |
| $300,000 to $499,999 | 85 (51.2%) | 42 (50.0%) |
| $500,000 to $749,999 | 0 (0.0%) | 10 (11.9%) |
| $750,000 to $999,999 | 0 (0.0%) | 0 (0.0%) |
| $1,000,000 or more | 4 (2.4%) | 0 (0.0%) |
| Total | 166 (100.0%) | 84 (100.0%) |
Household Income by Mortgage Status in Patagonia
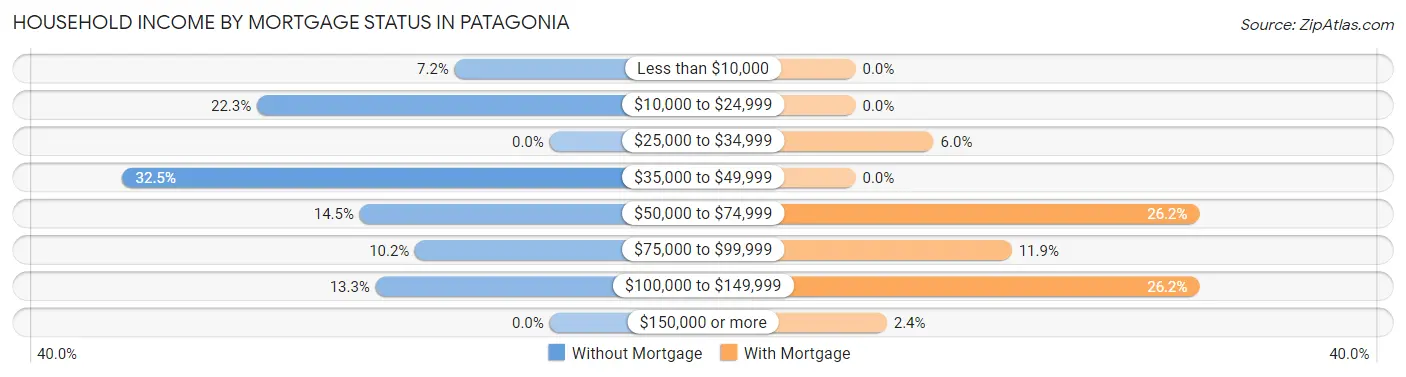
| Household Income | Without Mortgage | With Mortgage |
| Less than $10,000 | 12 (7.2%) | 0 (0.0%) |
| $10,000 to $24,999 | 37 (22.3%) | 0 (0.0%) |
| $25,000 to $34,999 | 0 (0.0%) | 5 (5.9%) |
| $35,000 to $49,999 | 54 (32.5%) | 0 (0.0%) |
| $50,000 to $74,999 | 24 (14.5%) | 22 (26.2%) |
| $75,000 to $99,999 | 17 (10.2%) | 10 (11.9%) |
| $100,000 to $149,999 | 22 (13.3%) | 22 (26.2%) |
| $150,000 or more | 0 (0.0%) | 2 (2.4%) |
| Total | 166 (100.0%) | 84 (100.0%) |
Property Value to Household Income Ratio in Patagonia
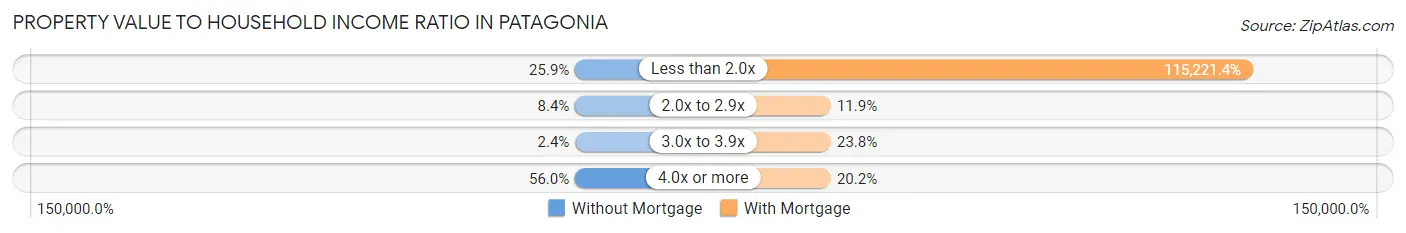
| Value-to-Income Ratio | Without Mortgage | With Mortgage |
| Less than 2.0x | 43 (25.9%) | 96,786 (115,221.4%) |
| 2.0x to 2.9x | 14 (8.4%) | 10 (11.9%) |
| 3.0x to 3.9x | 4 (2.4%) | 20 (23.8%) |
| 4.0x or more | 93 (56.0%) | 17 (20.2%) |
| Total | 166 (100.0%) | 84 (100.0%) |
Real Estate Taxes by Mortgage Status in Patagonia
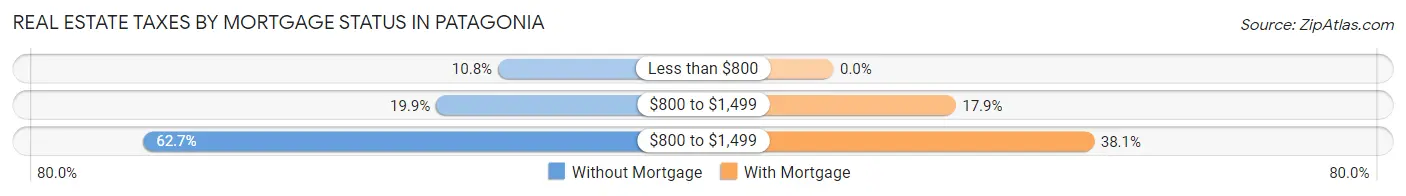
| Property Taxes | Without Mortgage | With Mortgage |
| Less than $800 | 18 (10.8%) | 0 (0.0%) |
| $800 to $1,499 | 33 (19.9%) | 15 (17.9%) |
| $800 to $1,499 | 104 (62.6%) | 32 (38.1%) |
| Total | 166 (100.0%) | 84 (100.0%) |
Health & Disability in Patagonia
Health Insurance Coverage by Age in Patagonia
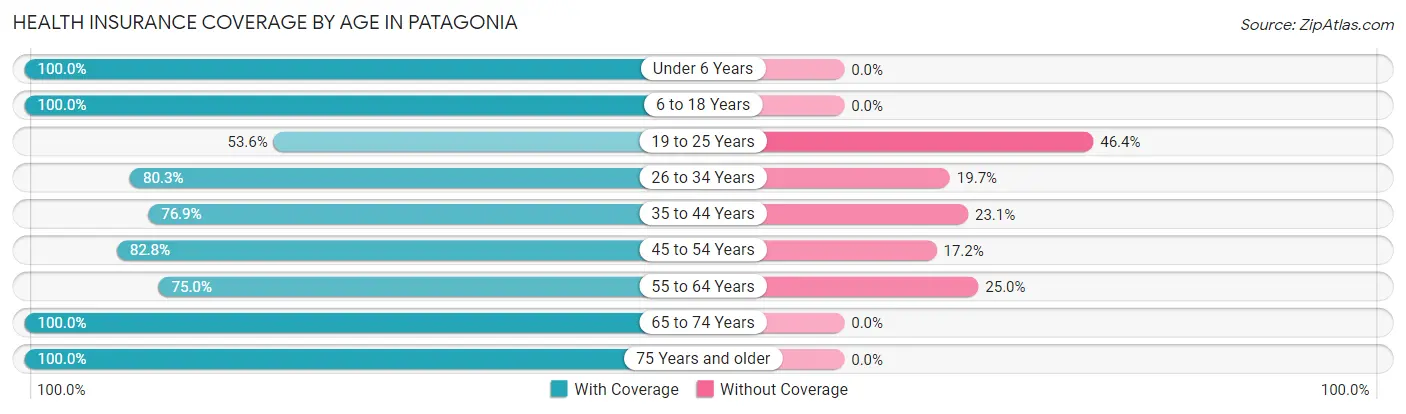
| Age Bracket | With Coverage | Without Coverage |
| Under 6 Years | 36 (100.0%) | 0 (0.0%) |
| 6 to 18 Years | 108 (100.0%) | 0 (0.0%) |
| 19 to 25 Years | 15 (53.6%) | 13 (46.4%) |
| 26 to 34 Years | 102 (80.3%) | 25 (19.7%) |
| 35 to 44 Years | 30 (76.9%) | 9 (23.1%) |
| 45 to 54 Years | 77 (82.8%) | 16 (17.2%) |
| 55 to 64 Years | 66 (75.0%) | 22 (25.0%) |
| 65 to 74 Years | 250 (100.0%) | 0 (0.0%) |
| 75 Years and older | 127 (100.0%) | 0 (0.0%) |
| Total | 811 (90.5%) | 85 (9.5%) |
Health Insurance Coverage by Citizenship Status in Patagonia
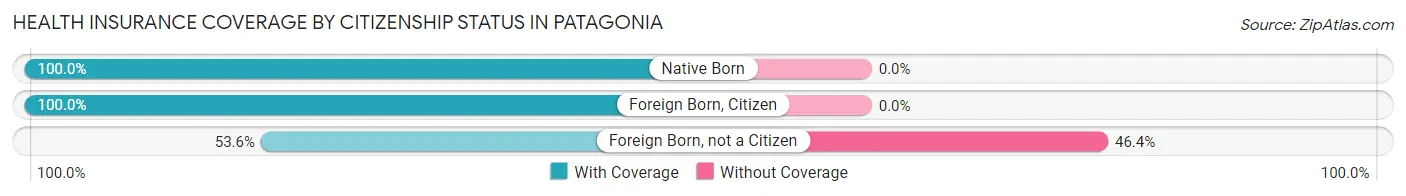
| Citizenship Status | With Coverage | Without Coverage |
| Native Born | 36 (100.0%) | 0 (0.0%) |
| Foreign Born, Citizen | 108 (100.0%) | 0 (0.0%) |
| Foreign Born, not a Citizen | 15 (53.6%) | 13 (46.4%) |
Health Insurance Coverage by Household Income in Patagonia
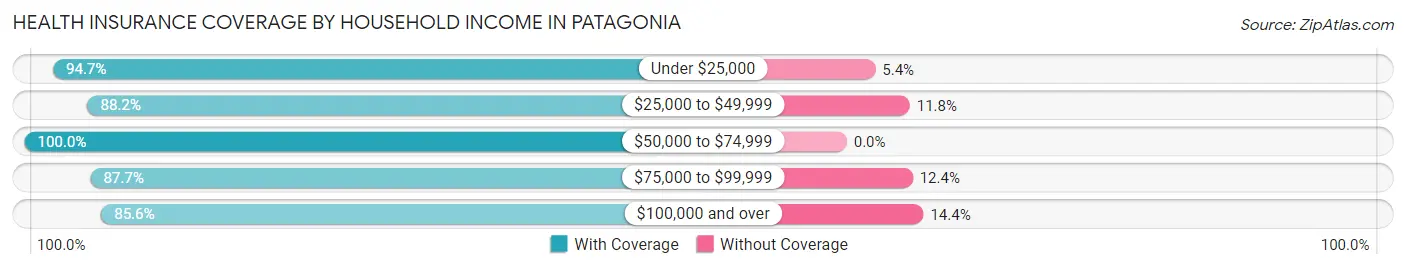
| Household Income | With Coverage | Without Coverage |
| Under $25,000 | 177 (94.7%) | 10 (5.3%) |
| $25,000 to $49,999 | 299 (88.2%) | 40 (11.8%) |
| $50,000 to $74,999 | 115 (100.0%) | 0 (0.0%) |
| $75,000 to $99,999 | 71 (87.6%) | 10 (12.3%) |
| $100,000 and over | 149 (85.6%) | 25 (14.4%) |
Public vs Private Health Insurance Coverage by Age in Patagonia
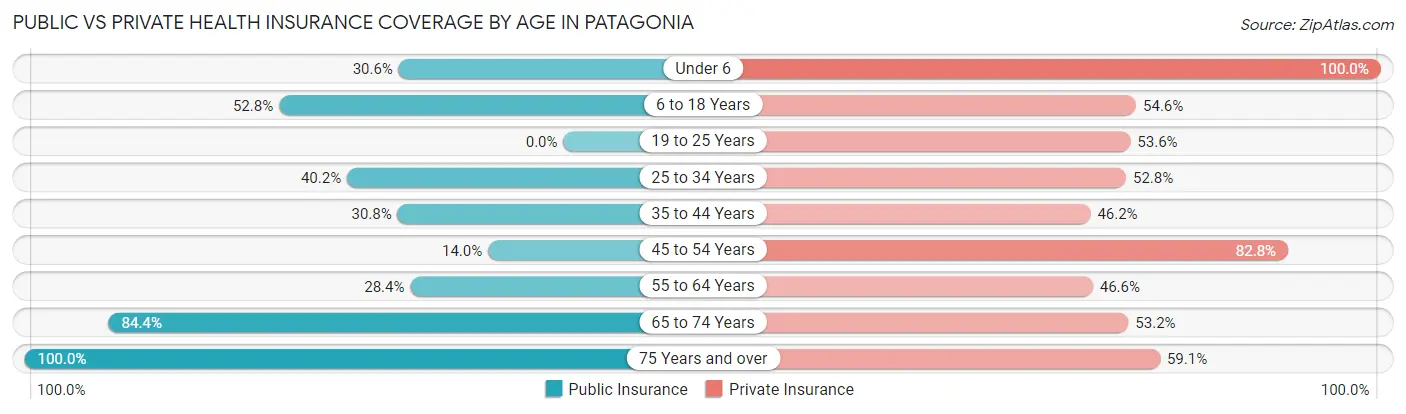
| Age Bracket | Public Insurance | Private Insurance |
| Under 6 | 11 (30.6%) | 36 (100.0%) |
| 6 to 18 Years | 57 (52.8%) | 59 (54.6%) |
| 19 to 25 Years | 0 (0.0%) | 15 (53.6%) |
| 25 to 34 Years | 51 (40.2%) | 67 (52.8%) |
| 35 to 44 Years | 12 (30.8%) | 18 (46.2%) |
| 45 to 54 Years | 13 (14.0%) | 77 (82.8%) |
| 55 to 64 Years | 25 (28.4%) | 41 (46.6%) |
| 65 to 74 Years | 211 (84.4%) | 133 (53.2%) |
| 75 Years and over | 127 (100.0%) | 75 (59.1%) |
| Total | 507 (56.6%) | 521 (58.2%) |
Disability Status by Sex by Age in Patagonia
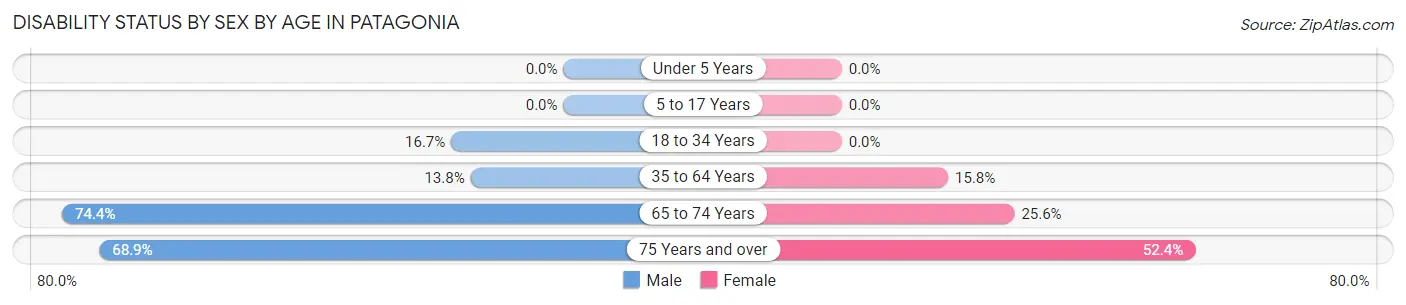
| Age Bracket | Male | Female |
| Under 5 Years | 0 (0.0%) | 0 (0.0%) |
| 5 to 17 Years | 0 (0.0%) | 0 (0.0%) |
| 18 to 34 Years | 15 (16.7%) | 0 (0.0%) |
| 35 to 64 Years | 12 (13.8%) | 21 (15.8%) |
| 65 to 74 Years | 99 (74.4%) | 30 (25.6%) |
| 75 Years and over | 31 (68.9%) | 43 (52.4%) |
Disability Class by Sex by Age in Patagonia
Disability Class: Hearing Difficulty
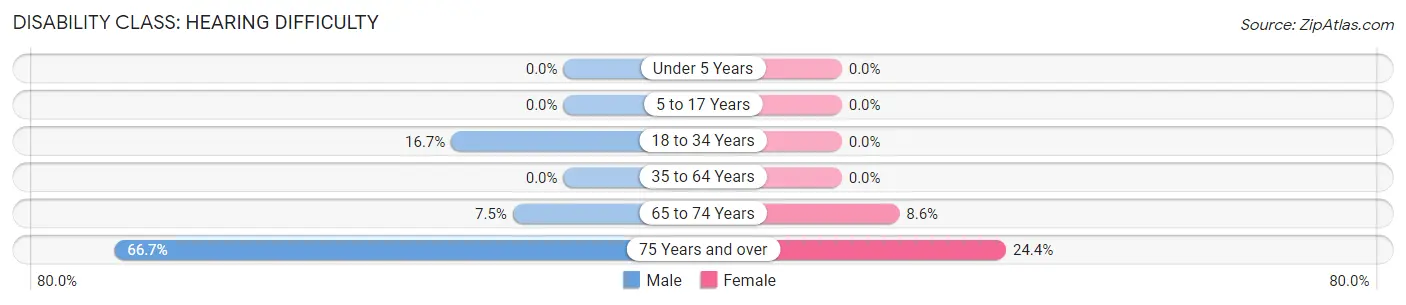
| Age Bracket | Male | Female |
| Under 5 Years | 0 (0.0%) | 0 (0.0%) |
| 5 to 17 Years | 0 (0.0%) | 0 (0.0%) |
| 18 to 34 Years | 15 (16.7%) | 0 (0.0%) |
| 35 to 64 Years | 0 (0.0%) | 0 (0.0%) |
| 65 to 74 Years | 10 (7.5%) | 10 (8.6%) |
| 75 Years and over | 30 (66.7%) | 20 (24.4%) |
Disability Class: Vision Difficulty
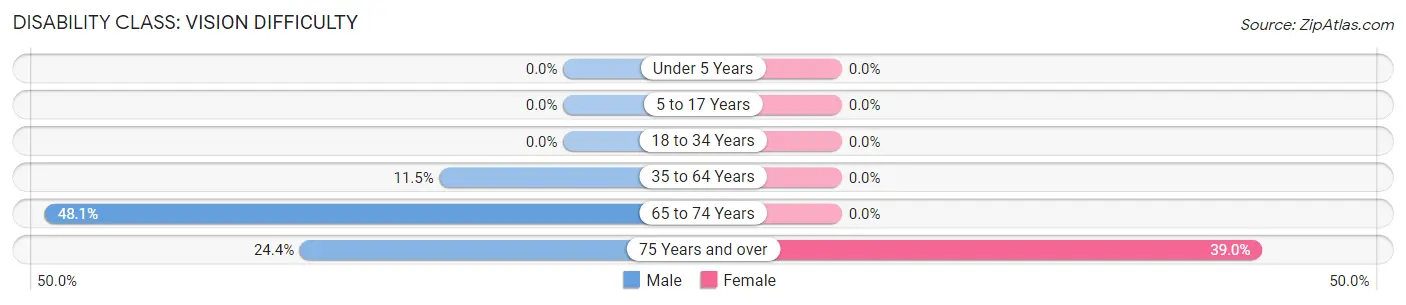
| Age Bracket | Male | Female |
| Under 5 Years | 0 (0.0%) | 0 (0.0%) |
| 5 to 17 Years | 0 (0.0%) | 0 (0.0%) |
| 18 to 34 Years | 0 (0.0%) | 0 (0.0%) |
| 35 to 64 Years | 10 (11.5%) | 0 (0.0%) |
| 65 to 74 Years | 64 (48.1%) | 0 (0.0%) |
| 75 Years and over | 11 (24.4%) | 32 (39.0%) |
Disability Class: Cognitive Difficulty
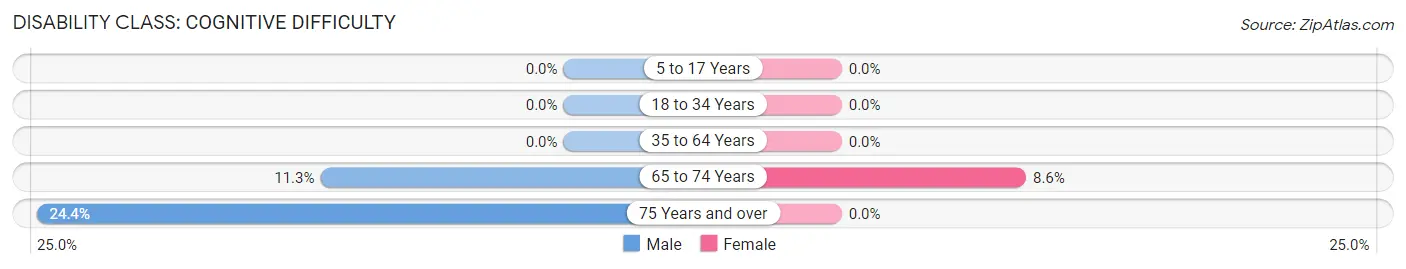
| Age Bracket | Male | Female |
| 5 to 17 Years | 0 (0.0%) | 0 (0.0%) |
| 18 to 34 Years | 0 (0.0%) | 0 (0.0%) |
| 35 to 64 Years | 0 (0.0%) | 0 (0.0%) |
| 65 to 74 Years | 15 (11.3%) | 10 (8.6%) |
| 75 Years and over | 11 (24.4%) | 0 (0.0%) |
Disability Class: Ambulatory Difficulty
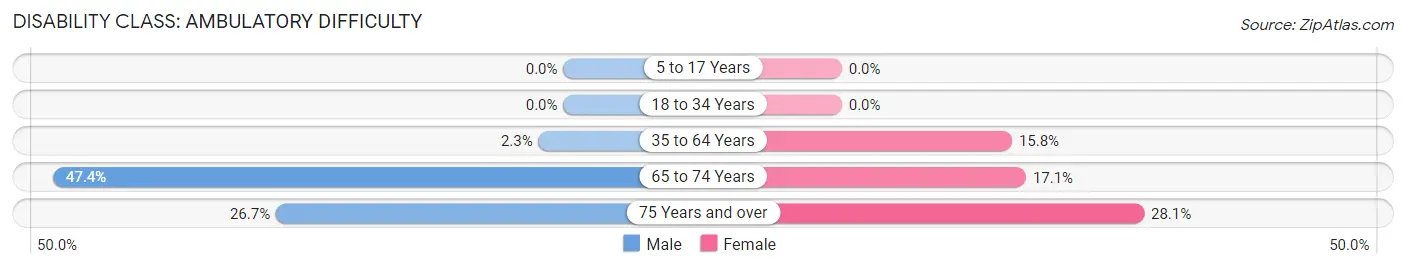
| Age Bracket | Male | Female |
| 5 to 17 Years | 0 (0.0%) | 0 (0.0%) |
| 18 to 34 Years | 0 (0.0%) | 0 (0.0%) |
| 35 to 64 Years | 2 (2.3%) | 21 (15.8%) |
| 65 to 74 Years | 63 (47.4%) | 20 (17.1%) |
| 75 Years and over | 12 (26.7%) | 23 (28.1%) |
Disability Class: Self-Care Difficulty
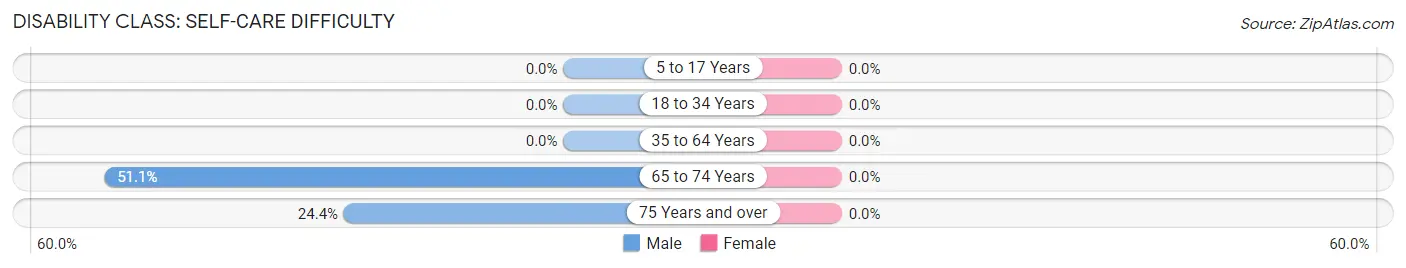
| Age Bracket | Male | Female |
| 5 to 17 Years | 0 (0.0%) | 0 (0.0%) |
| 18 to 34 Years | 0 (0.0%) | 0 (0.0%) |
| 35 to 64 Years | 0 (0.0%) | 0 (0.0%) |
| 65 to 74 Years | 68 (51.1%) | 0 (0.0%) |
| 75 Years and over | 11 (24.4%) | 0 (0.0%) |
Technology Access in Patagonia
Computing Device Access in Patagonia
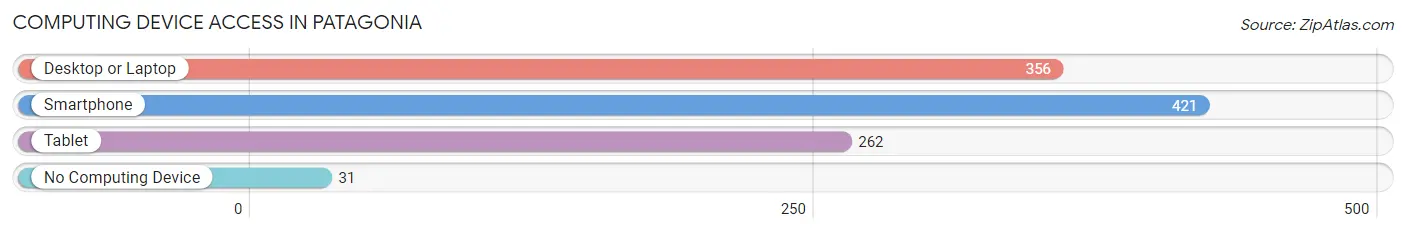
| Device Type | # Households | % Households |
| Desktop or Laptop | 356 | 71.1% |
| Smartphone | 421 | 84.0% |
| Tablet | 262 | 52.3% |
| No Computing Device | 31 | 6.2% |
| Total | 501 | 100.0% |
Internet Access in Patagonia
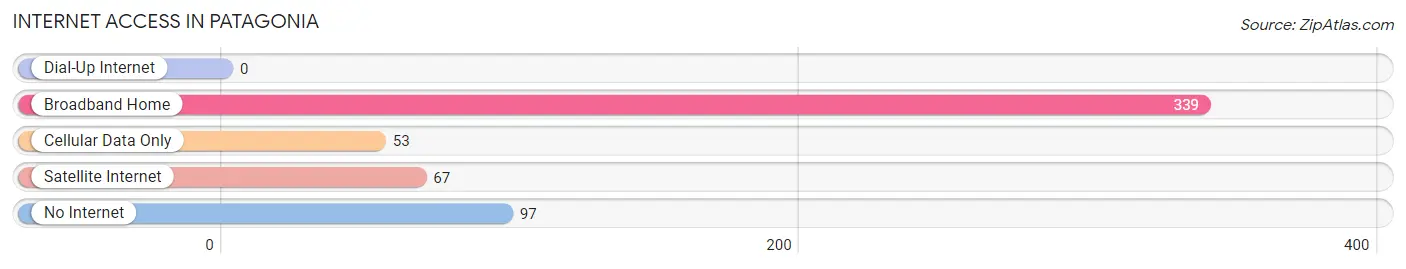
| Internet Type | # Households | % Households |
| Dial-Up Internet | 0 | 0.0% |
| Broadband Home | 339 | 67.7% |
| Cellular Data Only | 53 | 10.6% |
| Satellite Internet | 67 | 13.4% |
| No Internet | 97 | 19.4% |
| Total | 501 | 100.0% |
Patagonia Summary
Patagonia, Arizona is a small town located in Santa Cruz County in the southeastern corner of the state. It is situated in the foothills of the Santa Rita Mountains, approximately 30 miles south of Tucson. The town was founded in 1883 by a group of settlers from the Midwest, and it has since become a popular tourist destination due to its proximity to the Coronado National Forest and the Patagonia-Sonoita Creek Preserve.
History
Patagonia was founded in 1883 by a group of settlers from the Midwest, led by William H. Hardy. The settlers were attracted to the area by the abundance of natural resources, including water, timber, and minerals. The town was originally named Hardyville, but the name was changed to Patagonia in 1885. The name was chosen to honor the Patagonian Indians, who were the original inhabitants of the area.
The town quickly grew, and by the early 1900s, it had become a bustling center of commerce and industry. The town was home to several businesses, including a general store, a hotel, a blacksmith shop, and a sawmill. The town also had a post office, a school, and a newspaper.
In the 1920s, the town began to decline as the mining industry in the area declined. The population dropped from a peak of 1,000 in the early 1900s to just over 500 by the 1950s. The town was revitalized in the 1970s when it became a popular tourist destination due to its proximity to the Coronado National Forest and the Patagonia-Sonoita Creek Preserve.
Geography
Patagonia is located in the southeastern corner of Arizona, in Santa Cruz County. It is situated in the foothills of the Santa Rita Mountains, approximately 30 miles south of Tucson. The town is located at an elevation of 4,000 feet, and the climate is semi-arid, with hot summers and mild winters.
The town is surrounded by the Coronado National Forest and the Patagonia-Sonoita Creek Preserve. The Coronado National Forest is a 1.78 million acre forest that is home to a variety of wildlife, including deer, javelina, mountain lions, and black bears. The Patagonia-Sonoita Creek Preserve is a 4,000 acre preserve that is home to a variety of birds, including the endangered Southwestern willow flycatcher.
Economy
The economy of Patagonia is largely based on tourism. The town is a popular destination for outdoor enthusiasts, and it is home to several businesses that cater to tourists, including restaurants, hotels, and shops. The town is also home to several wineries, and it is a popular destination for wine tasting.
The town is also home to several small businesses, including a general store, a hardware store, and a gas station. The town is also home to a number of artists and artisans, and there are several galleries and studios in the area.
Demographics
As of the 2010 census, the population of Patagonia was 1,152. The population is predominantly white (90.2%), with a small Hispanic population (7.2%). The median household income is $37,500, and the median age is 48. The town is home to a number of retirees, and the median age of the population is higher than the state average.
Conclusion
Patagonia, Arizona is a small town located in Santa Cruz County in the southeastern corner of the state. It was founded in 1883 by a group of settlers from the Midwest, and it has since become a popular tourist destination due to its proximity to the Coronado National Forest and the Patagonia-Sonoita Creek Preserve. The economy of the town is largely based on tourism, and it is home to a number of small businesses and artisans. The population of the town is predominantly white, with a small Hispanic population. The median household income is $37,500, and the median age is 48.
Common Questions
What is Per Capita Income in Patagonia?
Per Capita income in Patagonia is $27,845.
What is the Median Family Income in Patagonia?
Median Family Income in Patagonia is $47,969.
What is the Median Household income in Patagonia?
Median Household Income in Patagonia is $34,609.
What is Income or Wage Gap in Patagonia?
Income or Wage Gap in Patagonia is 14.0%.
Women in Patagonia earn 86.0 cents for every dollar earned by a man.
What is Inequality or Gini Index in Patagonia?
Inequality or Gini Index in Patagonia is 0.43.
What is the Total Population of Patagonia?
Total Population of Patagonia is 896.
What is the Total Male Population of Patagonia?
Total Male Population of Patagonia is 412.
What is the Total Female Population of Patagonia?
Total Female Population of Patagonia is 484.
What is the Ratio of Males per 100 Females in Patagonia?
There are 85.12 Males per 100 Females in Patagonia.
What is the Ratio of Females per 100 Males in Patagonia?
There are 117.48 Females per 100 Males in Patagonia.
What is the Median Population Age in Patagonia?
Median Population Age in Patagonia is 57.2 Years.
What is the Average Family Size in Patagonia
Average Family Size in Patagonia is 2.5 People.
What is the Average Household Size in Patagonia
Average Household Size in Patagonia is 1.8 People.
How Large is the Labor Force in Patagonia?
There are 340 People in the Labor Forcein in Patagonia.
What is the Percentage of People in the Labor Force in Patagonia?
44.3% of People are in the Labor Force in Patagonia.
What is the Unemployment Rate in Patagonia?
Unemployment Rate in Patagonia is 7.1%.