Saddlebrooke, AZ Map & Demographics
Saddlebrooke Map
Saddlebrooke Overview
$60,376
PER CAPITA INCOME
$116,819
AVG FAMILY INCOME
$95,313
AVG HOUSEHOLD INCOME
61.2%
WAGE / INCOME GAP [ % ]
38.8¢/ $1
WAGE / INCOME GAP [ $ ]
0.40
INEQUALITY / GINI INDEX
12,014
TOTAL POPULATION
5,936
MALE POPULATION
6,078
FEMALE POPULATION
97.66
MALES / 100 FEMALES
102.39
FEMALES / 100 MALES
71.1
MEDIAN AGE
2.2
AVG FAMILY SIZE
1.9
AVG HOUSEHOLD SIZE
2,200
LABOR FORCE [ PEOPLE ]
19.3%
PERCENT IN LABOR FORCE
14.7%
UNEMPLOYMENT RATE
Saddlebrooke Area Codes
Income in Saddlebrooke
Income Overview in Saddlebrooke
Per Capita Income in Saddlebrooke is $60,376, while median incomes of families and households are $116,819 and $95,313 respectively.
| Characteristic | Number | Measure |
| Per Capita Income | 12,014 | $60,376 |
| Median Family Income | 4,709 | $116,819 |
| Mean Family Income | 4,709 | $132,824 |
| Median Household Income | 6,203 | $95,313 |
| Mean Household Income | 6,203 | $117,830 |
| Income Deficit | 4,709 | $0 |
| Wage / Income Gap (%) | 12,014 | 61.20% |
| Wage / Income Gap ($) | 12,014 | 38.80¢ per $1 |
| Gini / Inequality Index | 12,014 | 0.40 |
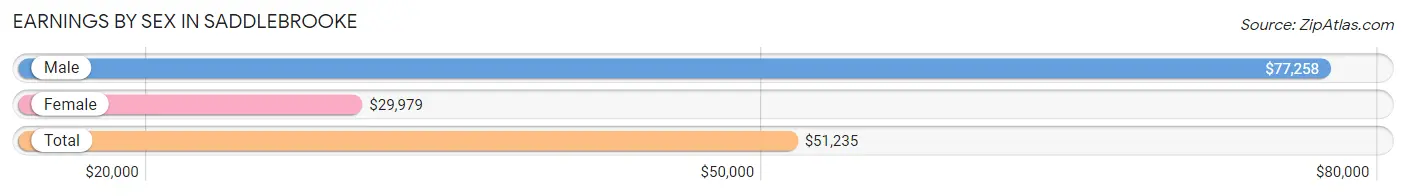
Earnings by Sex in Saddlebrooke
Average Earnings in Saddlebrooke are $51,235, $77,258 for men and $29,979 for women, a difference of 61.2%.
| Sex | Number | Average Earnings |
| Male | 1,384 (58.5%) | $77,258 |
| Female | 984 (41.5%) | $29,979 |
| Total | 2,368 (100.0%) | $51,235 |
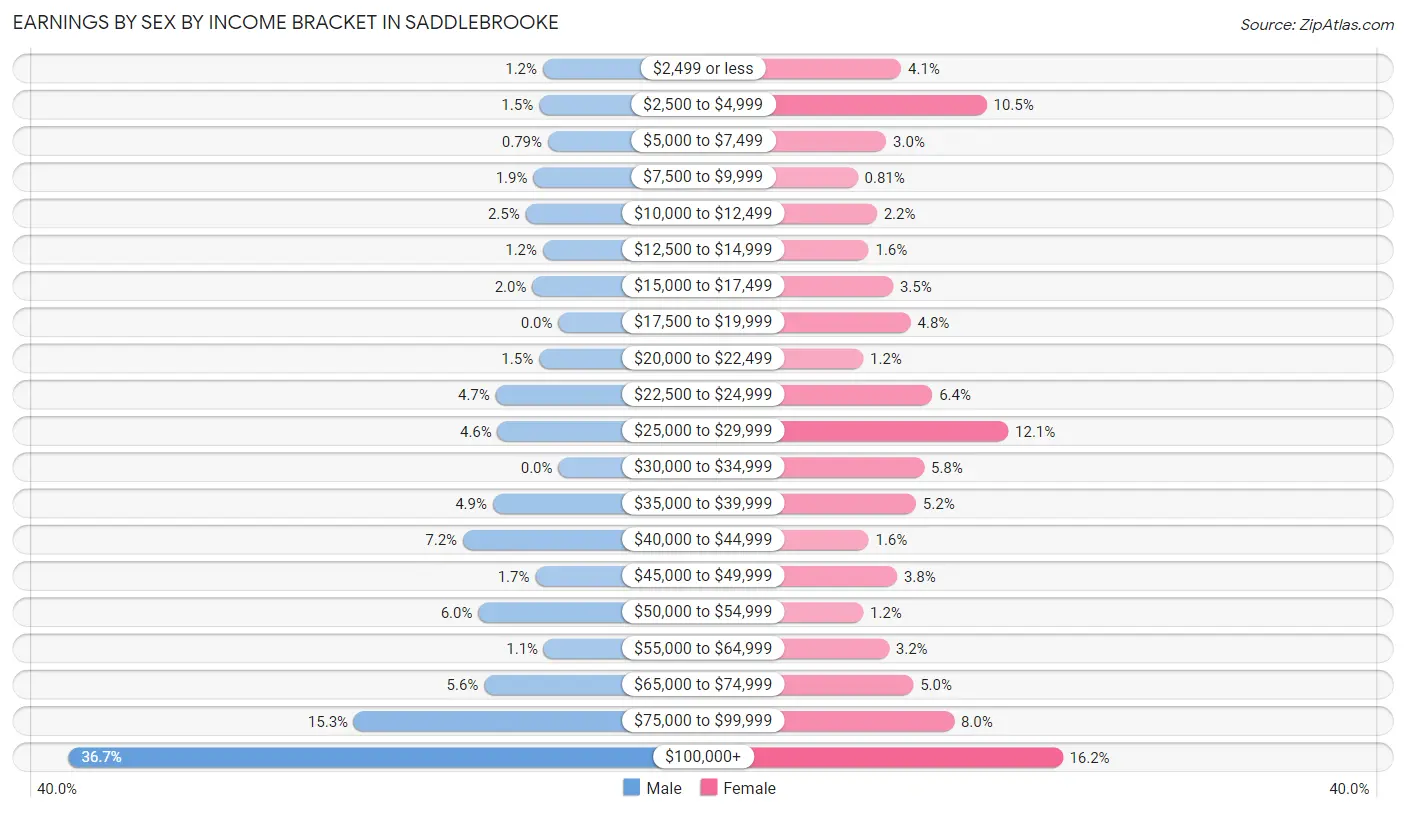
Earnings by Sex by Income Bracket in Saddlebrooke
The most common earnings brackets in Saddlebrooke are $100,000+ for men (508 | 36.7%) and $100,000+ for women (159 | 16.2%).
| Income | Male | Female |
| $2,499 or less | 16 (1.2%) | 40 (4.1%) |
| $2,500 to $4,999 | 20 (1.5%) | 103 (10.5%) |
| $5,000 to $7,499 | 11 (0.8%) | 29 (2.9%) |
| $7,500 to $9,999 | 26 (1.9%) | 8 (0.8%) |
| $10,000 to $12,499 | 34 (2.5%) | 22 (2.2%) |
| $12,500 to $14,999 | 16 (1.2%) | 16 (1.6%) |
| $15,000 to $17,499 | 27 (1.9%) | 34 (3.5%) |
| $17,500 to $19,999 | 0 (0.0%) | 47 (4.8%) |
| $20,000 to $22,499 | 20 (1.5%) | 12 (1.2%) |
| $22,500 to $24,999 | 65 (4.7%) | 63 (6.4%) |
| $25,000 to $29,999 | 63 (4.5%) | 119 (12.1%) |
| $30,000 to $34,999 | 0 (0.0%) | 57 (5.8%) |
| $35,000 to $39,999 | 68 (4.9%) | 51 (5.2%) |
| $40,000 to $44,999 | 99 (7.1%) | 16 (1.6%) |
| $45,000 to $49,999 | 24 (1.7%) | 37 (3.8%) |
| $50,000 to $54,999 | 83 (6.0%) | 12 (1.2%) |
| $55,000 to $64,999 | 15 (1.1%) | 31 (3.2%) |
| $65,000 to $74,999 | 77 (5.6%) | 49 (5.0%) |
| $75,000 to $99,999 | 212 (15.3%) | 79 (8.0%) |
| $100,000+ | 508 (36.7%) | 159 (16.2%) |
| Total | 1,384 (100.0%) | 984 (100.0%) |
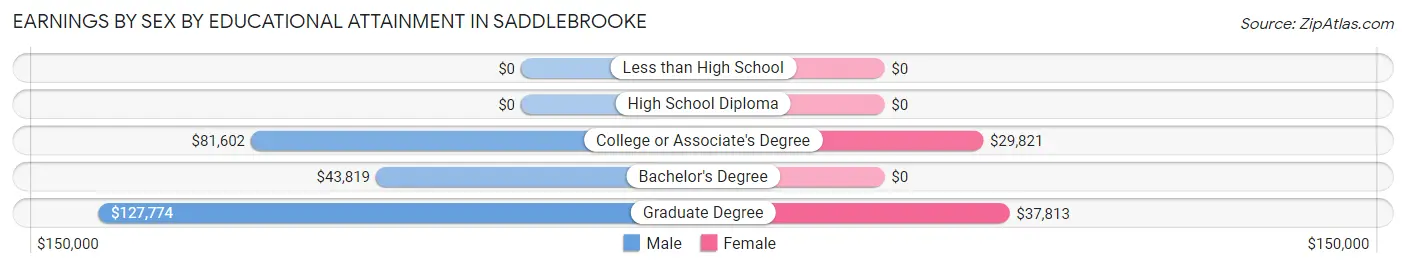
Earnings by Sex by Educational Attainment in Saddlebrooke
Average earnings in Saddlebrooke are $81,016 for men and $29,695 for women, a difference of 63.3%. Men with an educational attainment of graduate degree enjoy the highest average annual earnings of $127,774, while those with bachelor's degree education earn the least with $43,819. Women with an educational attainment of graduate degree earn the most with the average annual earnings of $37,813, while those with college or associate's degree education have the smallest earnings of $29,821.
| Educational Attainment | Male Income | Female Income |
| Less than High School | - | - |
| High School Diploma | - | - |
| College or Associate's Degree | $81,602 | $29,821 |
| Bachelor's Degree | $43,819 | $0 |
| Graduate Degree | $127,774 | $37,813 |
| Total | $81,016 | $29,695 |
Family Income in Saddlebrooke
Family Income Brackets in Saddlebrooke
According to the Saddlebrooke family income data, there are 1,276 families falling into the $100,000 to $149,999 income range, which is the most common income bracket and makes up 27.1% of all families. Conversely, the $15,000 to $24,999 income bracket is the least frequent group with only 24 families (0.5%) belonging to this category.
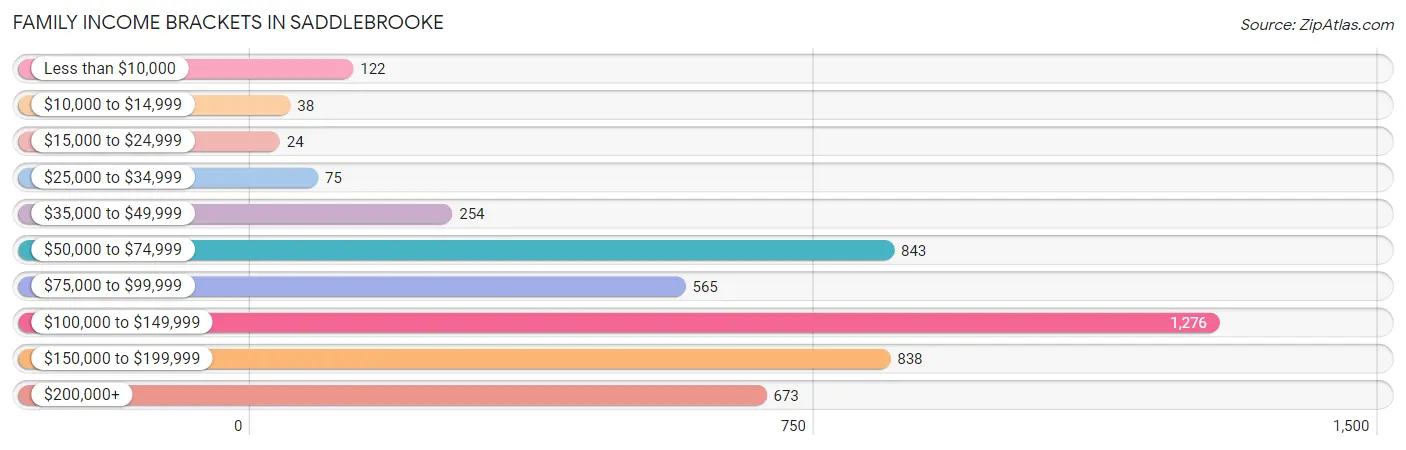
| Income Bracket | # Families | % Families |
| Less than $10,000 | 122 | 2.6% |
| $10,000 to $14,999 | 38 | 0.8% |
| $15,000 to $24,999 | 24 | 0.5% |
| $25,000 to $34,999 | 75 | 1.6% |
| $35,000 to $49,999 | 254 | 5.4% |
| $50,000 to $74,999 | 843 | 17.9% |
| $75,000 to $99,999 | 565 | 12.0% |
| $100,000 to $149,999 | 1,276 | 27.1% |
| $150,000 to $199,999 | 838 | 17.8% |
| $200,000+ | 673 | 14.3% |
Family Income by Famaliy Size in Saddlebrooke
3-person families (212 | 4.5%) account for the highest median family income in Saddlebrooke with $250,001 per family, while 3-person families (212 | 4.5%) have the highest median income of $83,334 per family member.
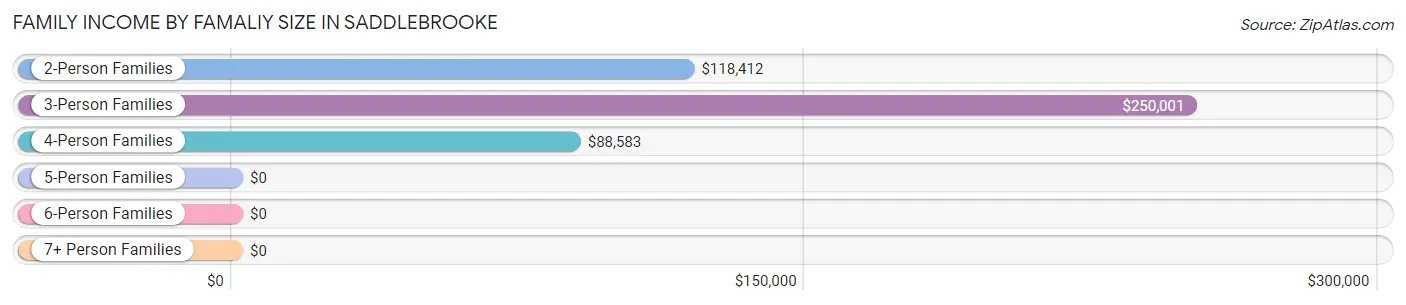
| Income Bracket | # Families | Median Income |
| 2-Person Families | 4,149 (88.1%) | $118,412 |
| 3-Person Families | 212 (4.5%) | $250,001 |
| 4-Person Families | 255 (5.4%) | $88,583 |
| 5-Person Families | 39 (0.8%) | $0 |
| 6-Person Families | 39 (0.8%) | $0 |
| 7+ Person Families | 15 (0.3%) | $0 |
| Total | 4,709 (100.0%) | $116,819 |
Family Income by Number of Earners in Saddlebrooke
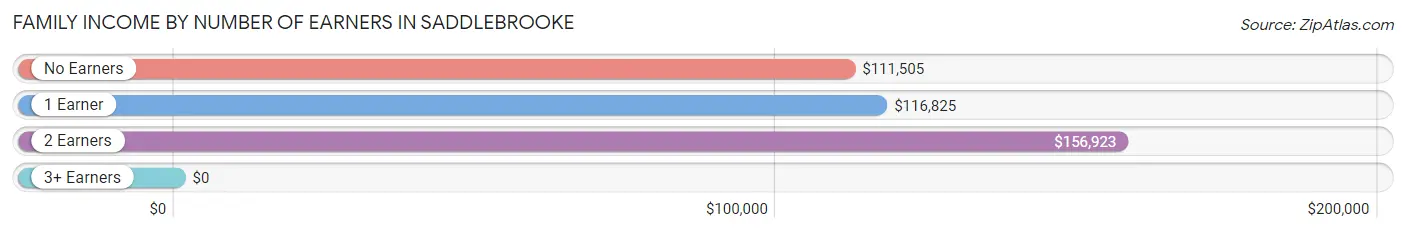
| Number of Earners | # Families | Median Income |
| No Earners | 3,205 (68.1%) | $111,505 |
| 1 Earner | 965 (20.5%) | $116,825 |
| 2 Earners | 510 (10.8%) | $156,923 |
| 3+ Earners | 29 (0.6%) | $0 |
| Total | 4,709 (100.0%) | $116,819 |
Household Income in Saddlebrooke
Household Income Brackets in Saddlebrooke
With 1,408 households falling in the category, the $100,000 to $149,999 income range is the most frequent in Saddlebrooke, accounting for 22.7% of all households. In contrast, only 56 households (0.9%) fall into the $10,000 to $14,999 income bracket, making it the least populous group.
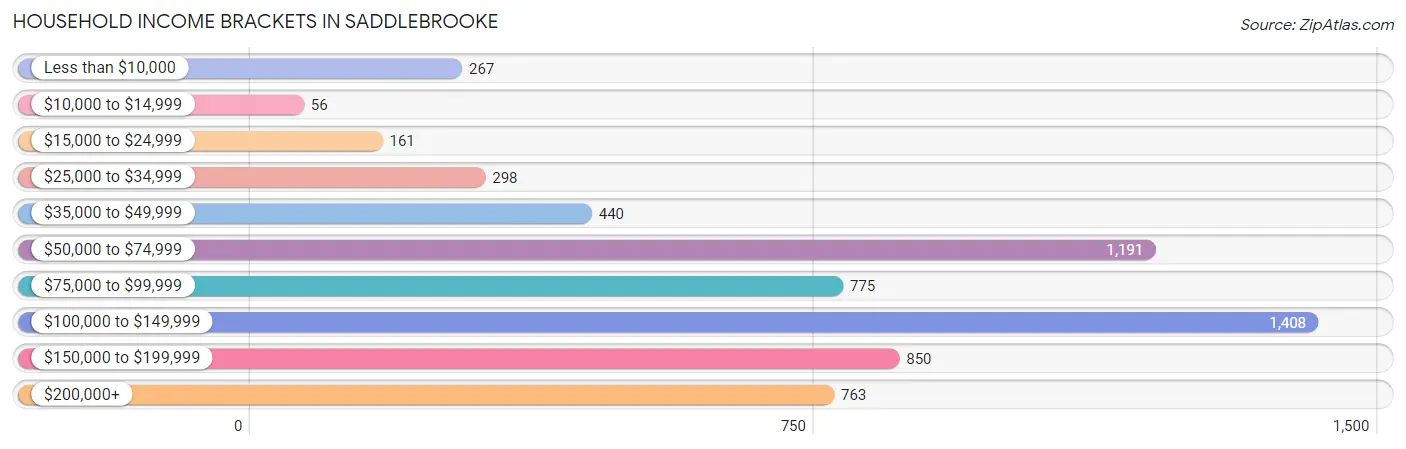
| Income Bracket | # Households | % Households |
| Less than $10,000 | 267 | 4.3% |
| $10,000 to $14,999 | 56 | 0.9% |
| $15,000 to $24,999 | 161 | 2.6% |
| $25,000 to $34,999 | 298 | 4.8% |
| $35,000 to $49,999 | 440 | 7.1% |
| $50,000 to $74,999 | 1,191 | 19.2% |
| $75,000 to $99,999 | 775 | 12.5% |
| $100,000 to $149,999 | 1,408 | 22.7% |
| $150,000 to $199,999 | 850 | 13.7% |
| $200,000+ | 763 | 12.3% |
Household Income by Householder Age in Saddlebrooke
The median household income in Saddlebrooke is $95,313, with the highest median household income of $100,371 found in the 65+ years age bracket for the primary householder. A total of 4,765 households (76.8%) fall into this category. Meanwhile, the 15 to 24 years age bracket for the primary householder has the lowest median household income of $0, with 35 households (0.6%) in this group.
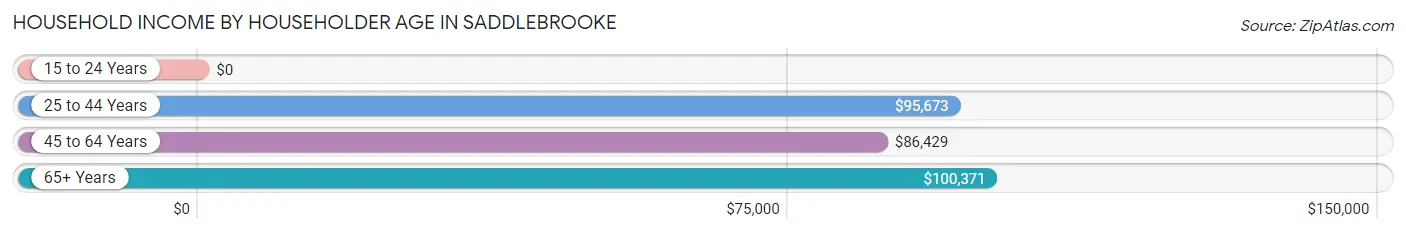
| Income Bracket | # Households | Median Income |
| 15 to 24 Years | 35 (0.6%) | $0 |
| 25 to 44 Years | 459 (7.4%) | $95,673 |
| 45 to 64 Years | 944 (15.2%) | $86,429 |
| 65+ Years | 4,765 (76.8%) | $100,371 |
| Total | 6,203 (100.0%) | $95,313 |
Poverty in Saddlebrooke
Income Below Poverty by Sex and Age in Saddlebrooke
With 3.4% poverty level for males and 5.6% for females among the residents of Saddlebrooke, 55 to 64 year old males and 55 to 64 year old females are the most vulnerable to poverty, with 80 males (14.2%) and 111 females (14.4%) in their respective age groups living below the poverty level.
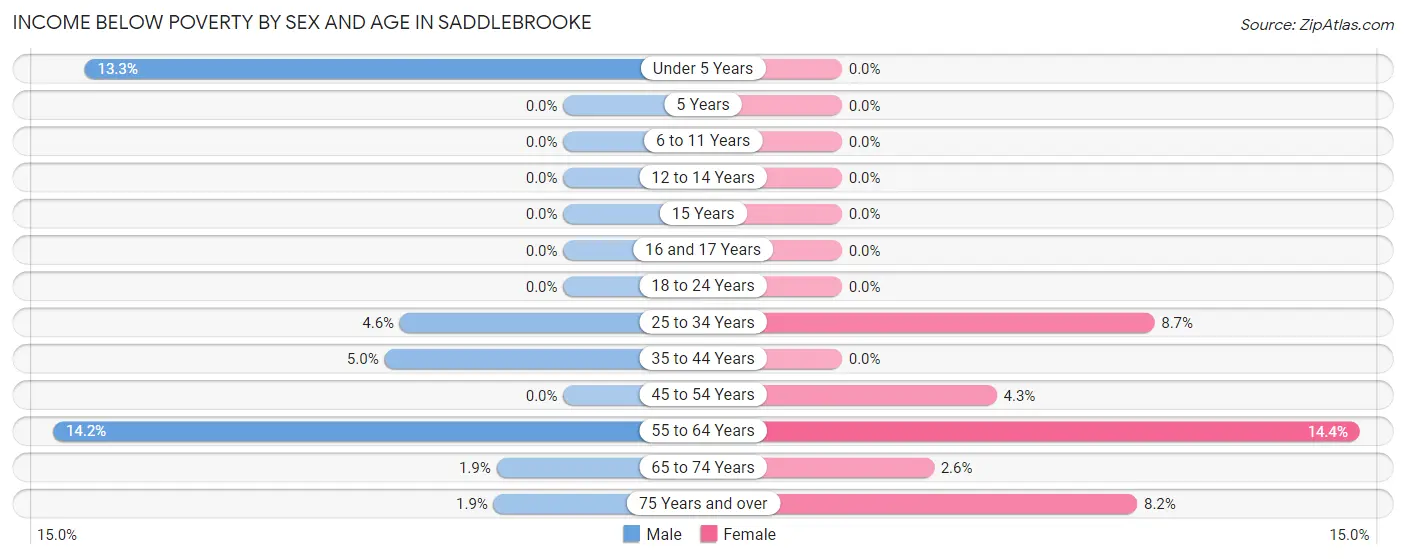
| Age Bracket | Male | Female |
| Under 5 Years | 16 (13.3%) | 0 (0.0%) |
| 5 Years | 0 (0.0%) | 0 (0.0%) |
| 6 to 11 Years | 0 (0.0%) | 0 (0.0%) |
| 12 to 14 Years | 0 (0.0%) | 0 (0.0%) |
| 15 Years | 0 (0.0%) | 0 (0.0%) |
| 16 and 17 Years | 0 (0.0%) | 0 (0.0%) |
| 18 to 24 Years | 0 (0.0%) | 0 (0.0%) |
| 25 to 34 Years | 12 (4.5%) | 10 (8.7%) |
| 35 to 44 Years | 15 (5.0%) | 0 (0.0%) |
| 45 to 54 Years | 0 (0.0%) | 11 (4.3%) |
| 55 to 64 Years | 80 (14.2%) | 111 (14.4%) |
| 65 to 74 Years | 37 (1.9%) | 62 (2.6%) |
| 75 Years and over | 42 (1.9%) | 147 (8.2%) |
| Total | 202 (3.4%) | 341 (5.6%) |
Income Above Poverty by Sex and Age in Saddlebrooke
According to the poverty statistics in Saddlebrooke, males aged 6 to 11 years and females aged under 5 years are the age groups that are most secure financially, with 100.0% of males and 100.0% of females in these age groups living above the poverty line.
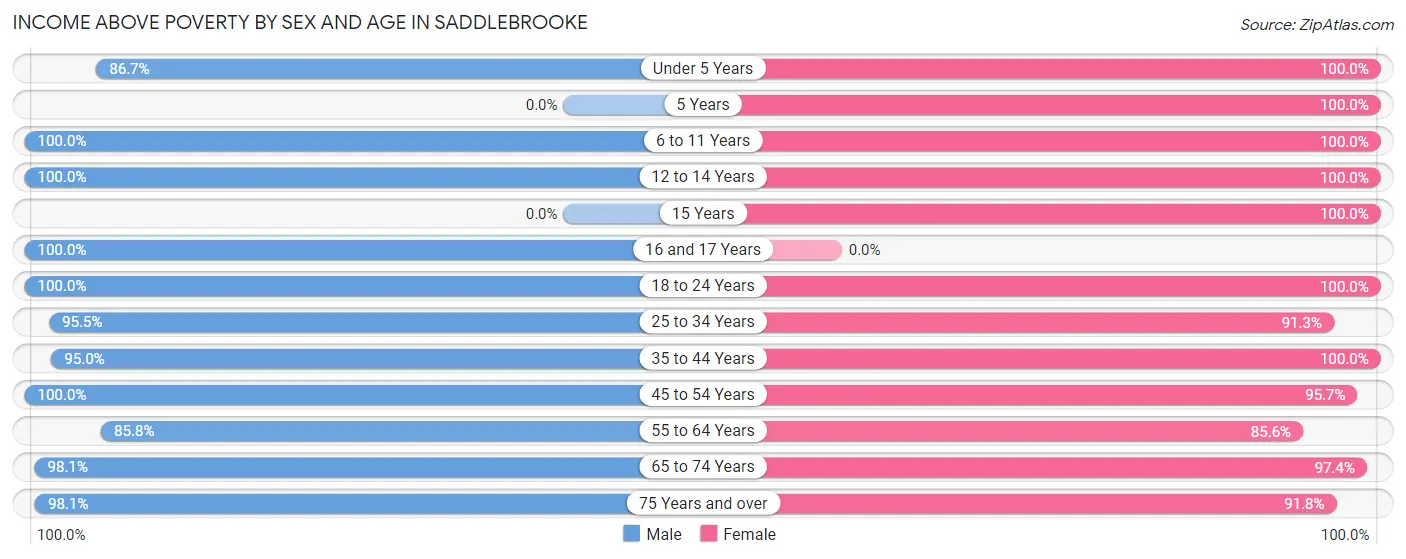
| Age Bracket | Male | Female |
| Under 5 Years | 104 (86.7%) | 66 (100.0%) |
| 5 Years | 0 (0.0%) | 45 (100.0%) |
| 6 to 11 Years | 73 (100.0%) | 90 (100.0%) |
| 12 to 14 Years | 143 (100.0%) | 56 (100.0%) |
| 15 Years | 0 (0.0%) | 22 (100.0%) |
| 16 and 17 Years | 12 (100.0%) | 0 (0.0%) |
| 18 to 24 Years | 62 (100.0%) | 143 (100.0%) |
| 25 to 34 Years | 252 (95.5%) | 105 (91.3%) |
| 35 to 44 Years | 286 (95.0%) | 307 (100.0%) |
| 45 to 54 Years | 244 (100.0%) | 244 (95.7%) |
| 55 to 64 Years | 483 (85.8%) | 659 (85.6%) |
| 65 to 74 Years | 1,955 (98.1%) | 2,359 (97.4%) |
| 75 Years and over | 2,120 (98.1%) | 1,641 (91.8%) |
| Total | 5,734 (96.6%) | 5,737 (94.4%) |
Income Below Poverty Among Married-Couple Families in Saddlebrooke
The poverty statistics for married-couple families in Saddlebrooke show that 2.9% or 131 of the total 4,561 families live below the poverty line. Families with no children have the highest poverty rate of 3.1%, comprising of 131 families. On the other hand, families with 1 or 2 children have the lowest poverty rate of 0.0%, which includes 0 families.
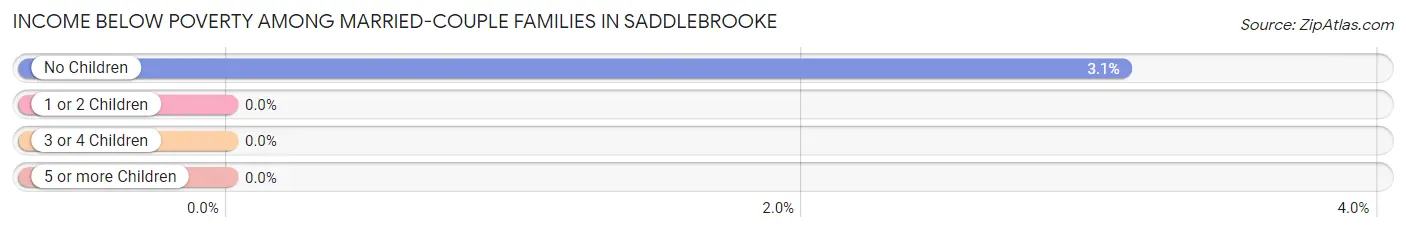
| Children | Above Poverty | Below Poverty |
| No Children | 4,082 (96.9%) | 131 (3.1%) |
| 1 or 2 Children | 291 (100.0%) | 0 (0.0%) |
| 3 or 4 Children | 57 (100.0%) | 0 (0.0%) |
| 5 or more Children | 0 (0.0%) | 0 (0.0%) |
| Total | 4,430 (97.1%) | 131 (2.9%) |
Income Below Poverty Among Single-Parent Households in Saddlebrooke
According to the poverty data in Saddlebrooke, 42.3% or 11 single-father households and 27.1% or 33 single-mother households are living below the poverty line. Among single-father households, those with no children have the highest poverty rate, with 11 households (100.0%) experiencing poverty. Likewise, among single-mother households, those with no children have the highest poverty rate, with 23 households (36.5%) falling below the poverty line.
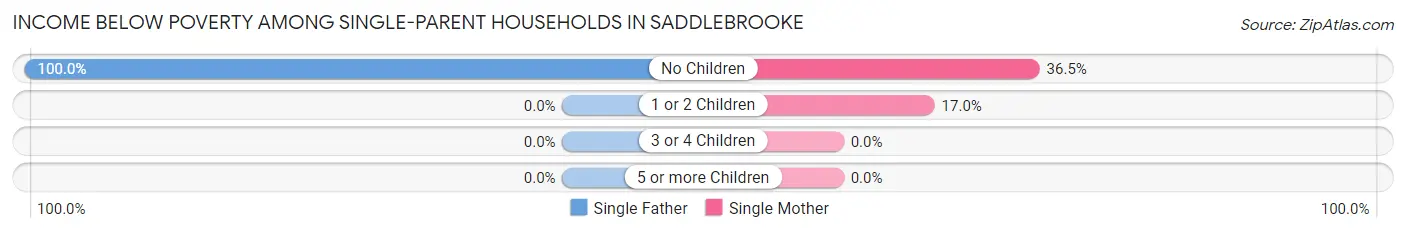
| Children | Single Father | Single Mother |
| No Children | 11 (100.0%) | 23 (36.5%) |
| 1 or 2 Children | 0 (0.0%) | 10 (17.0%) |
| 3 or 4 Children | 0 (0.0%) | 0 (0.0%) |
| 5 or more Children | 0 (0.0%) | 0 (0.0%) |
| Total | 11 (42.3%) | 33 (27.1%) |
Income Below Poverty Among Married-Couple vs Single-Parent Households in Saddlebrooke
The poverty data for Saddlebrooke shows that 131 of the married-couple family households (2.9%) and 44 of the single-parent households (29.7%) are living below the poverty level. Within the married-couple family households, those with no children have the highest poverty rate, with 131 households (3.1%) falling below the poverty line. Among the single-parent households, those with no children have the highest poverty rate, with 34 household (46.0%) living below poverty.
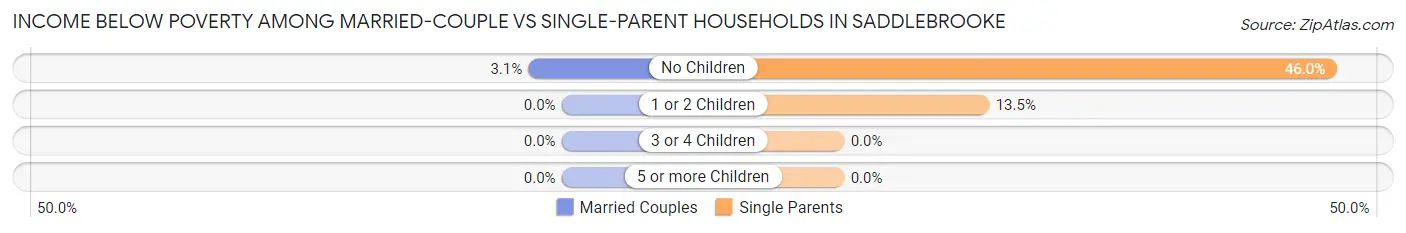
| Children | Married-Couple Families | Single-Parent Households |
| No Children | 131 (3.1%) | 34 (46.0%) |
| 1 or 2 Children | 0 (0.0%) | 10 (13.5%) |
| 3 or 4 Children | 0 (0.0%) | 0 (0.0%) |
| 5 or more Children | 0 (0.0%) | 0 (0.0%) |
| Total | 131 (2.9%) | 44 (29.7%) |
Race in Saddlebrooke
The most populous races in Saddlebrooke are White / Caucasian (10,943 | 91.1%), Hispanic or Latino (1,015 | 8.5%), and Two or more Races (456 | 3.8%).
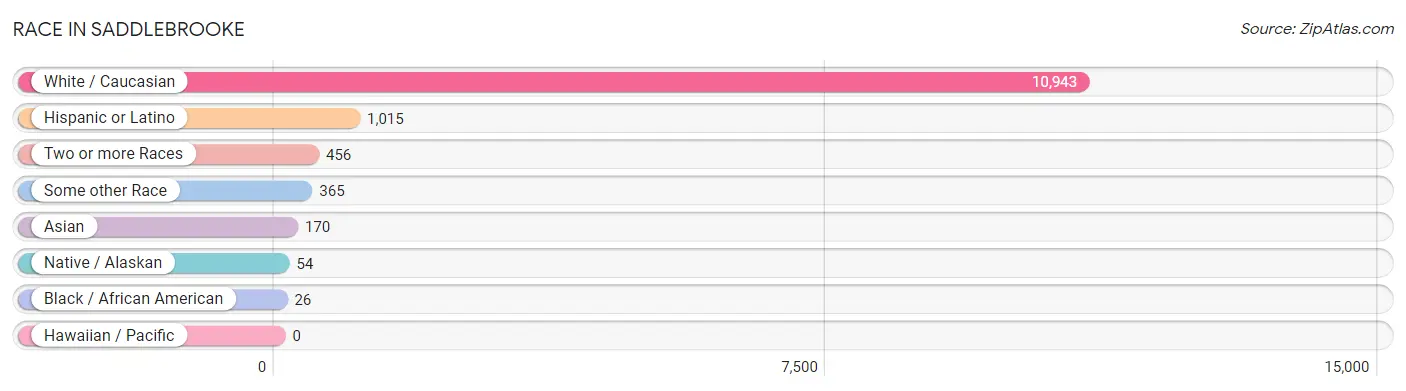
| Race | # Population | % Population |
| Asian | 170 | 1.4% |
| Black / African American | 26 | 0.2% |
| Hawaiian / Pacific | 0 | 0.0% |
| Hispanic or Latino | 1,015 | 8.5% |
| Native / Alaskan | 54 | 0.4% |
| White / Caucasian | 10,943 | 91.1% |
| Two or more Races | 456 | 3.8% |
| Some other Race | 365 | 3.0% |
| Total | 12,014 | 100.0% |
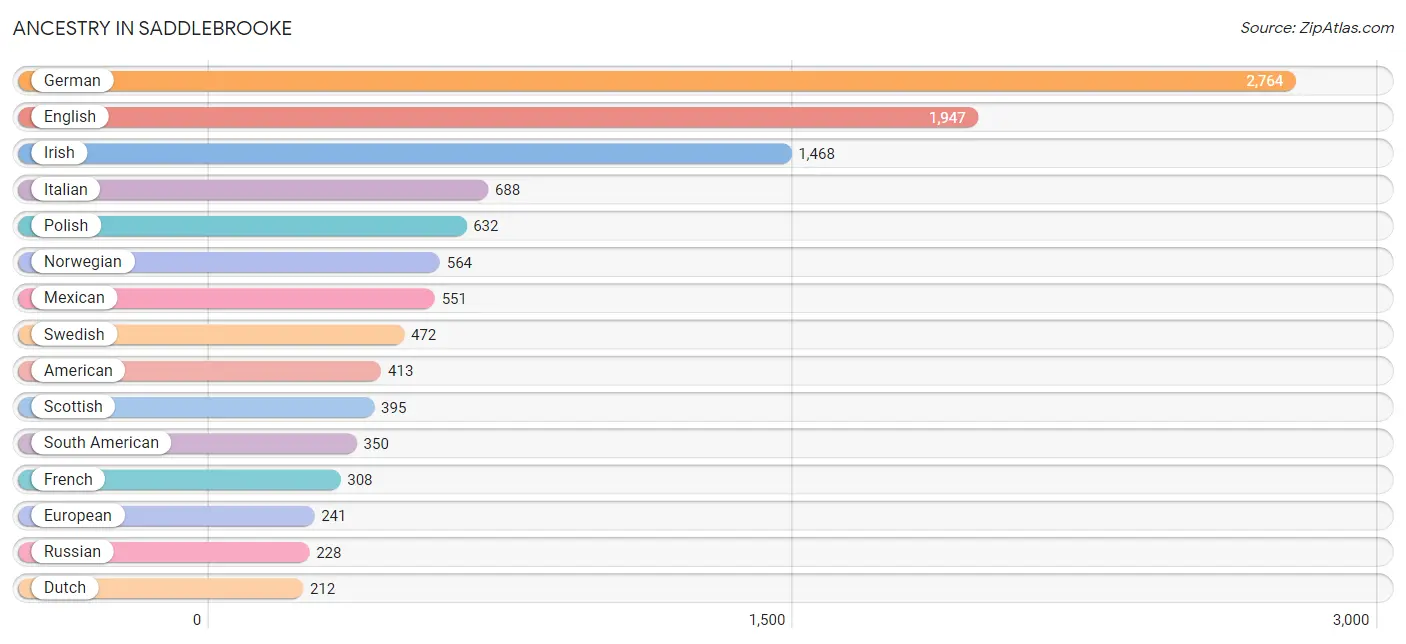
Ancestry in Saddlebrooke
The most populous ancestries reported in Saddlebrooke are German (2,764 | 23.0%), English (1,947 | 16.2%), Irish (1,468 | 12.2%), Italian (688 | 5.7%), and Polish (632 | 5.3%), together accounting for 62.4% of all Saddlebrooke residents.
| Ancestry | # Population | % Population |
| Albanian | 15 | 0.1% |
| American | 413 | 3.4% |
| Arab | 12 | 0.1% |
| Austrian | 44 | 0.4% |
| Belgian | 79 | 0.7% |
| Bhutanese | 14 | 0.1% |
| British | 110 | 0.9% |
| Bulgarian | 29 | 0.2% |
| Burmese | 33 | 0.3% |
| Canadian | 75 | 0.6% |
| Cherokee | 23 | 0.2% |
| Chilean | 36 | 0.3% |
| Colombian | 88 | 0.7% |
| Croatian | 49 | 0.4% |
| Czech | 36 | 0.3% |
| Czechoslovakian | 24 | 0.2% |
| Danish | 135 | 1.1% |
| Dutch | 212 | 1.8% |
| Eastern European | 110 | 0.9% |
| English | 1,947 | 16.2% |
| European | 241 | 2.0% |
| Finnish | 153 | 1.3% |
| French | 308 | 2.6% |
| French Canadian | 104 | 0.9% |
| German | 2,764 | 23.0% |
| Greek | 13 | 0.1% |
| Hungarian | 171 | 1.4% |
| Indian (Asian) | 85 | 0.7% |
| Irish | 1,468 | 12.2% |
| Italian | 688 | 5.7% |
| Korean | 38 | 0.3% |
| Lebanese | 12 | 0.1% |
| Lithuanian | 76 | 0.6% |
| Mexican | 551 | 4.6% |
| Native Hawaiian | 7 | 0.1% |
| Navajo | 40 | 0.3% |
| Nigerian | 21 | 0.2% |
| Northern European | 73 | 0.6% |
| Norwegian | 564 | 4.7% |
| Pennsylvania German | 15 | 0.1% |
| Peruvian | 126 | 1.1% |
| Polish | 632 | 5.3% |
| Portuguese | 23 | 0.2% |
| Puerto Rican | 19 | 0.2% |
| Romanian | 61 | 0.5% |
| Russian | 228 | 1.9% |
| Scandinavian | 29 | 0.2% |
| Scotch-Irish | 162 | 1.3% |
| Scottish | 395 | 3.3% |
| Sioux | 38 | 0.3% |
| Slavic | 11 | 0.1% |
| Slovene | 45 | 0.4% |
| South African | 29 | 0.2% |
| South American | 350 | 2.9% |
| Spaniard | 81 | 0.7% |
| Subsaharan African | 93 | 0.8% |
| Swedish | 472 | 3.9% |
| Swiss | 135 | 1.1% |
| Thai | 29 | 0.2% |
| Ukrainian | 57 | 0.5% |
| Venezuelan | 100 | 0.8% |
| Welsh | 154 | 1.3% | View All 62 Rows |
Immigrants in Saddlebrooke
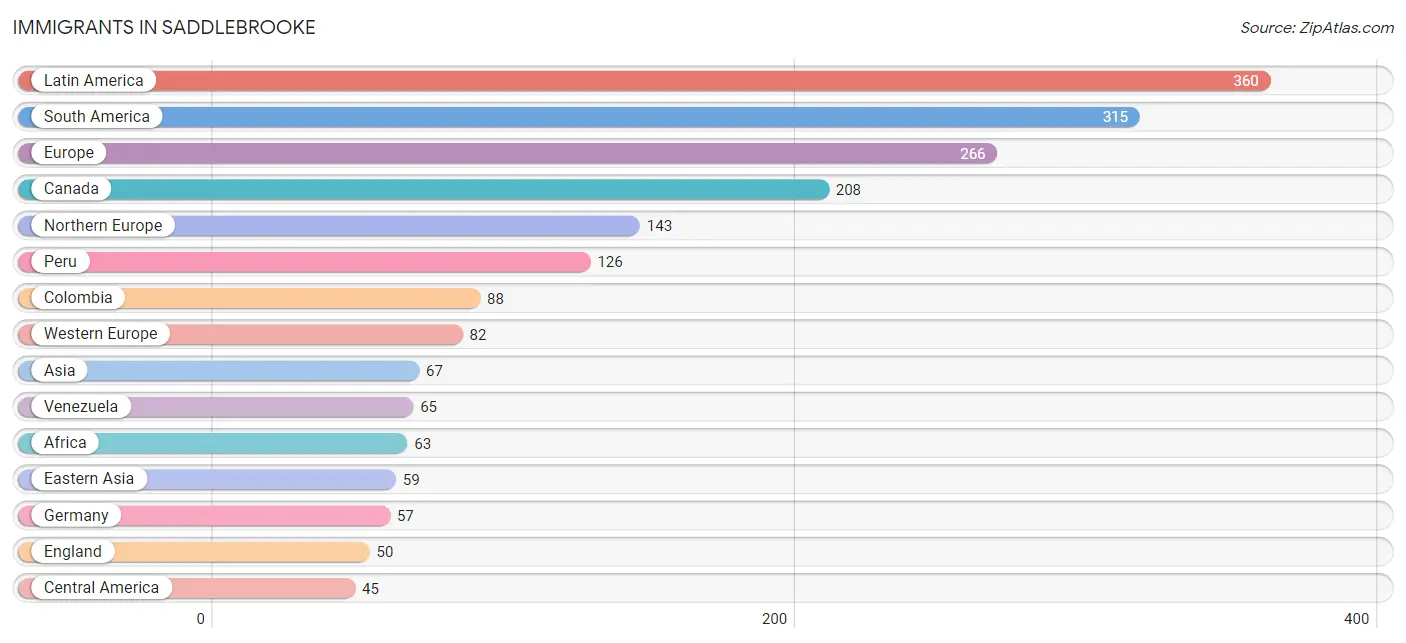
The most numerous immigrant groups reported in Saddlebrooke came from Latin America (360 | 3.0%), South America (315 | 2.6%), Europe (266 | 2.2%), Canada (208 | 1.7%), and Northern Europe (143 | 1.2%), together accounting for 10.8% of all Saddlebrooke residents.
| Immigration Origin | # Population | % Population |
| Africa | 63 | 0.5% |
| Asia | 67 | 0.6% |
| Austria | 13 | 0.1% |
| Bulgaria | 29 | 0.2% |
| Canada | 208 | 1.7% |
| Central America | 45 | 0.4% |
| Chile | 36 | 0.3% |
| China | 26 | 0.2% |
| Colombia | 88 | 0.7% |
| Denmark | 40 | 0.3% |
| Eastern Asia | 59 | 0.5% |
| Eastern Europe | 29 | 0.2% |
| England | 50 | 0.4% |
| Europe | 266 | 2.2% |
| France | 12 | 0.1% |
| Germany | 57 | 0.5% |
| Italy | 12 | 0.1% |
| Korea | 33 | 0.3% |
| Latin America | 360 | 3.0% |
| Mexico | 45 | 0.4% |
| Northern Africa | 34 | 0.3% |
| Northern Europe | 143 | 1.2% |
| Peru | 126 | 1.1% |
| Philippines | 8 | 0.1% |
| South Africa | 29 | 0.2% |
| South America | 315 | 2.6% |
| South Eastern Asia | 8 | 0.1% |
| Southern Europe | 12 | 0.1% |
| Venezuela | 65 | 0.5% |
| Western Europe | 82 | 0.7% | View All 30 Rows |
Sex and Age in Saddlebrooke
Sex and Age in Saddlebrooke
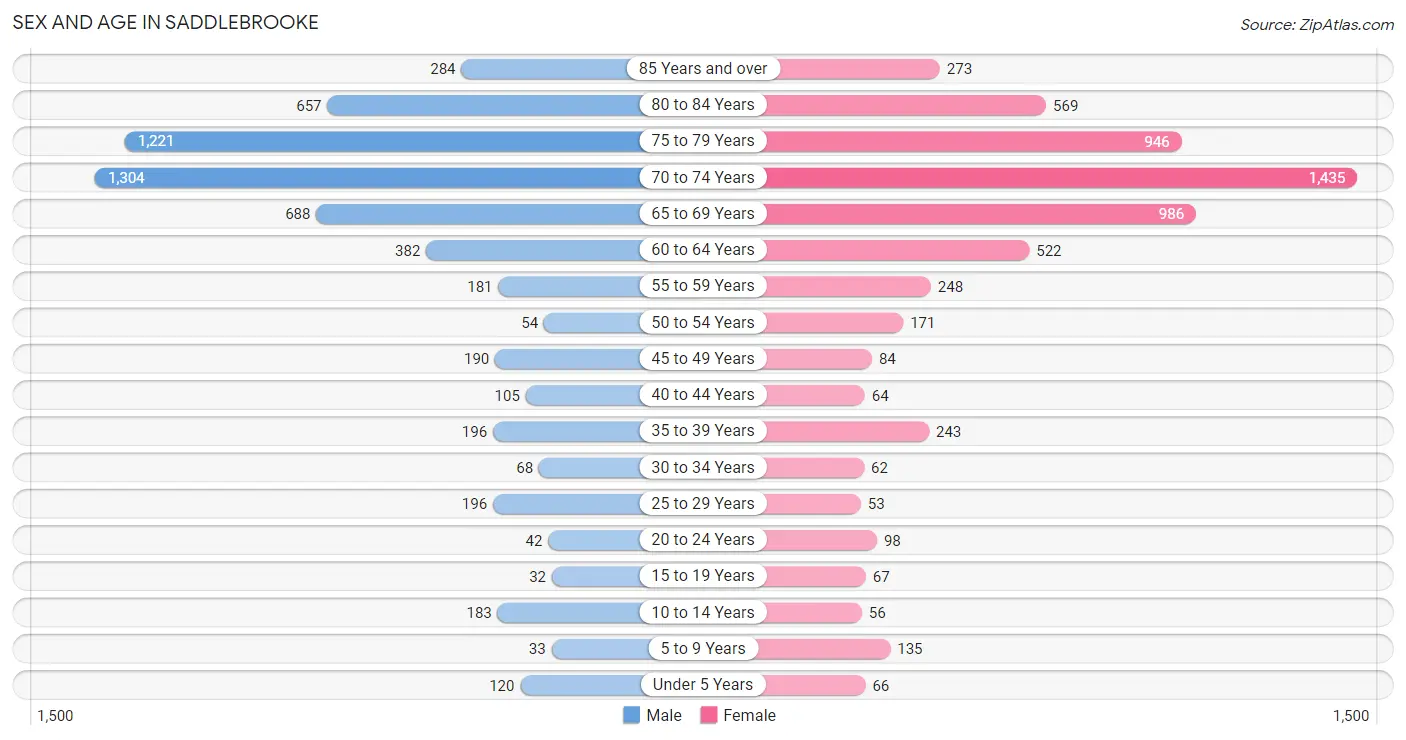
The most populous age groups in Saddlebrooke are 70 to 74 Years (1,304 | 22.0%) for men and 70 to 74 Years (1,435 | 23.6%) for women.
| Age Bracket | Male | Female |
| Under 5 Years | 120 (2.0%) | 66 (1.1%) |
| 5 to 9 Years | 33 (0.6%) | 135 (2.2%) |
| 10 to 14 Years | 183 (3.1%) | 56 (0.9%) |
| 15 to 19 Years | 32 (0.5%) | 67 (1.1%) |
| 20 to 24 Years | 42 (0.7%) | 98 (1.6%) |
| 25 to 29 Years | 196 (3.3%) | 53 (0.9%) |
| 30 to 34 Years | 68 (1.1%) | 62 (1.0%) |
| 35 to 39 Years | 196 (3.3%) | 243 (4.0%) |
| 40 to 44 Years | 105 (1.8%) | 64 (1.1%) |
| 45 to 49 Years | 190 (3.2%) | 84 (1.4%) |
| 50 to 54 Years | 54 (0.9%) | 171 (2.8%) |
| 55 to 59 Years | 181 (3.0%) | 248 (4.1%) |
| 60 to 64 Years | 382 (6.4%) | 522 (8.6%) |
| 65 to 69 Years | 688 (11.6%) | 986 (16.2%) |
| 70 to 74 Years | 1,304 (22.0%) | 1,435 (23.6%) |
| 75 to 79 Years | 1,221 (20.6%) | 946 (15.6%) |
| 80 to 84 Years | 657 (11.1%) | 569 (9.4%) |
| 85 Years and over | 284 (4.8%) | 273 (4.5%) |
| Total | 5,936 (100.0%) | 6,078 (100.0%) |
Families and Households in Saddlebrooke
Median Family Size in Saddlebrooke
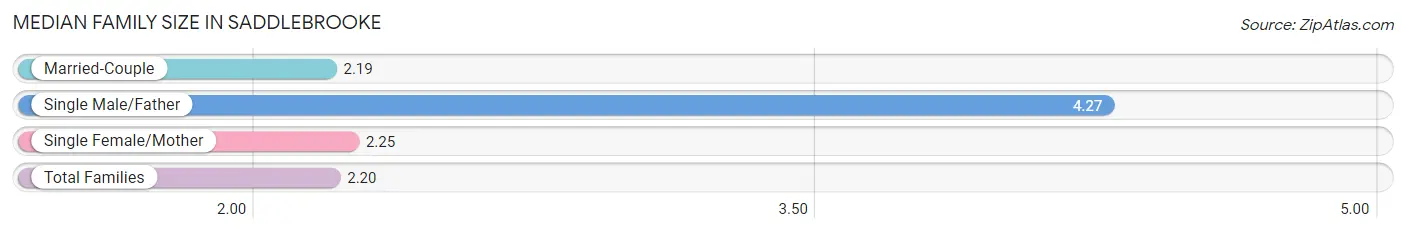
The median family size in Saddlebrooke is 2.20 persons per family, with single male/father families (26 | 0.5%) accounting for the largest median family size of 4.27 persons per family. On the other hand, married-couple families (4,561 | 96.9%) represent the smallest median family size with 2.19 persons per family.
| Family Type | # Families | Family Size |
| Married-Couple | 4,561 (96.9%) | 2.19 |
| Single Male/Father | 26 (0.5%) | 4.27 |
| Single Female/Mother | 122 (2.6%) | 2.25 |
| Total Families | 4,709 (100.0%) | 2.20 |
Median Household Size in Saddlebrooke
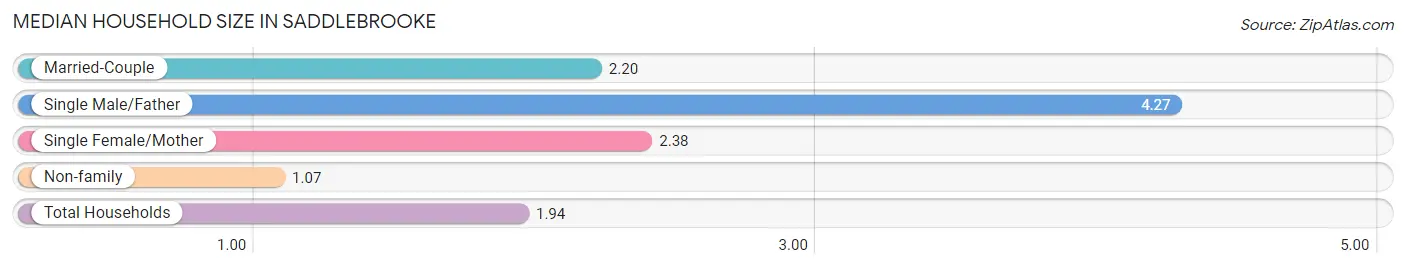
The median household size in Saddlebrooke is 1.94 persons per household, with single male/father households (26 | 0.4%) accounting for the largest median household size of 4.27 persons per household. non-family households (1,494 | 24.1%) represent the smallest median household size with 1.07 persons per household.
| Household Type | # Households | Household Size |
| Married-Couple | 4,561 (73.5%) | 2.20 |
| Single Male/Father | 26 (0.4%) | 4.27 |
| Single Female/Mother | 122 (2.0%) | 2.38 |
| Non-family | 1,494 (24.1%) | 1.07 |
| Total Households | 6,203 (100.0%) | 1.94 |
Household Size by Marriage Status in Saddlebrooke
Out of a total of 6,203 households in Saddlebrooke, 4,709 (75.9%) are family households, while 1,494 (24.1%) are nonfamily households. The most numerous type of family households are 2-person households, comprising 4,125, and the most common type of nonfamily households are 1-person households, comprising 1,400.
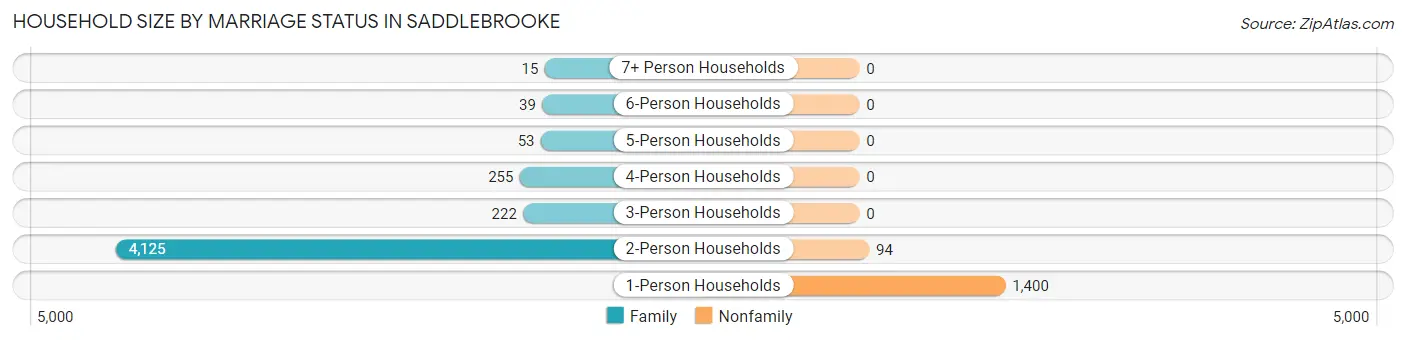
| Household Size | Family Households | Nonfamily Households |
| 1-Person Households | - | 1,400 (22.6%) |
| 2-Person Households | 4,125 (66.5%) | 94 (1.5%) |
| 3-Person Households | 222 (3.6%) | 0 (0.0%) |
| 4-Person Households | 255 (4.1%) | 0 (0.0%) |
| 5-Person Households | 53 (0.9%) | 0 (0.0%) |
| 6-Person Households | 39 (0.6%) | 0 (0.0%) |
| 7+ Person Households | 15 (0.2%) | 0 (0.0%) |
| Total | 4,709 (75.9%) | 1,494 (24.1%) |
Female Fertility in Saddlebrooke
Fertility by Age in Saddlebrooke
Average fertility rate in Saddlebrooke is 130.0 births per 1,000 women. Women in the age bracket of 20 to 34 years have the highest fertility rate with 291.0 births per 1,000 women. Women in the age bracket of 20 to 34 years acount for 71.3% of all women with births.
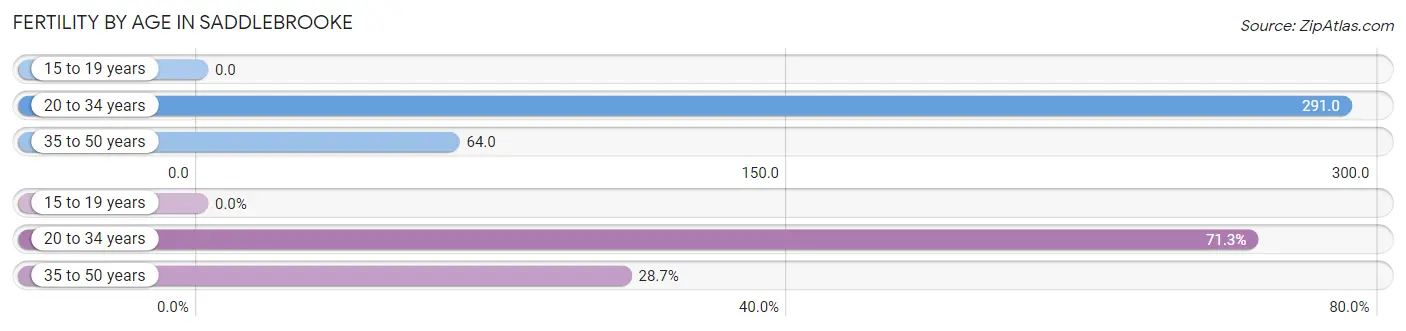
| Age Bracket | Women with Births | Births / 1,000 Women |
| 15 to 19 years | 0 (0.0%) | 0.0 |
| 20 to 34 years | 62 (71.3%) | 291.0 |
| 35 to 50 years | 25 (28.7%) | 64.0 |
| Total | 87 (100.0%) | 130.0 |
Fertility by Age by Marriage Status in Saddlebrooke
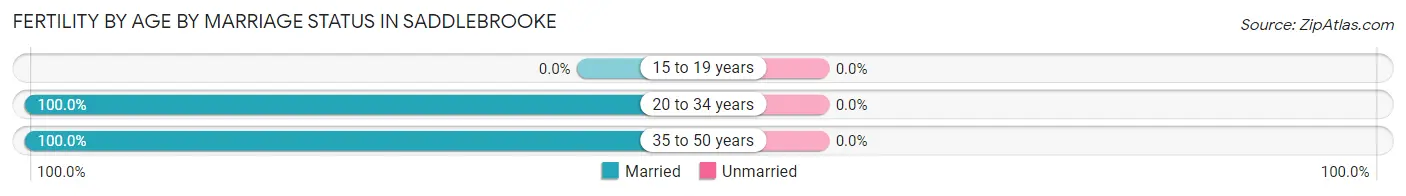
| Age Bracket | Married | Unmarried |
| 15 to 19 years | 0 (0.0%) | 0 (0.0%) |
| 20 to 34 years | 62 (100.0%) | 0 (0.0%) |
| 35 to 50 years | 25 (100.0%) | 0 (0.0%) |
| Total | 87 (100.0%) | 0 (0.0%) |
Fertility by Education in Saddlebrooke
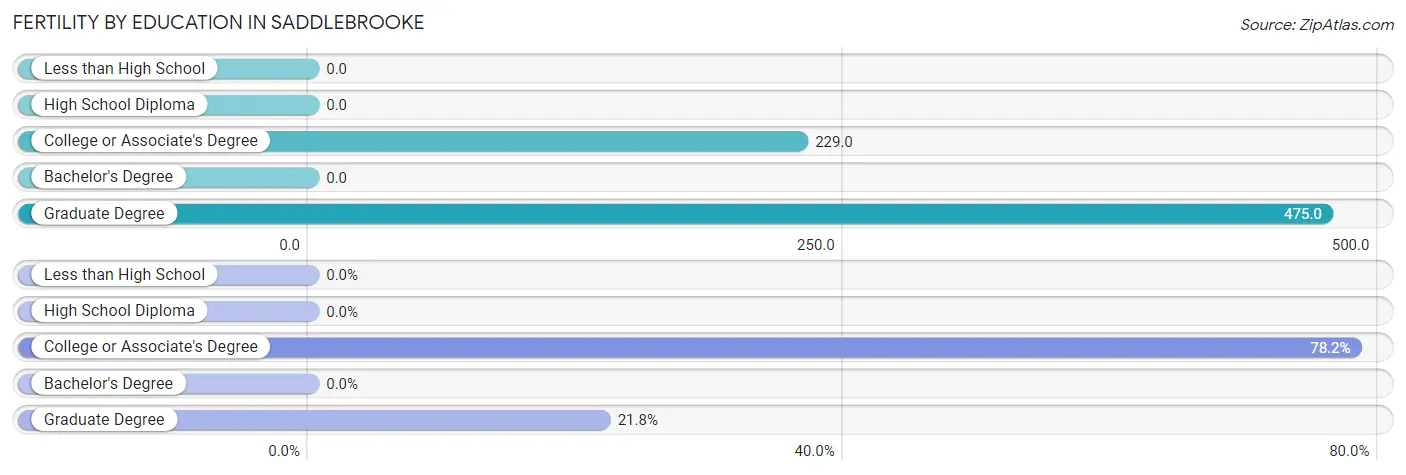
| Educational Attainment | Women with Births | Births / 1,000 Women |
| Less than High School | 0 (0.0%) | 0.0 |
| High School Diploma | 0 (0.0%) | 0.0 |
| College or Associate's Degree | 68 (78.2%) | 229.0 |
| Bachelor's Degree | 0 (0.0%) | 0.0 |
| Graduate Degree | 19 (21.8%) | 475.0 |
| Total | 87 (100.0%) | 130.0 |
Fertility by Education by Marriage Status in Saddlebrooke
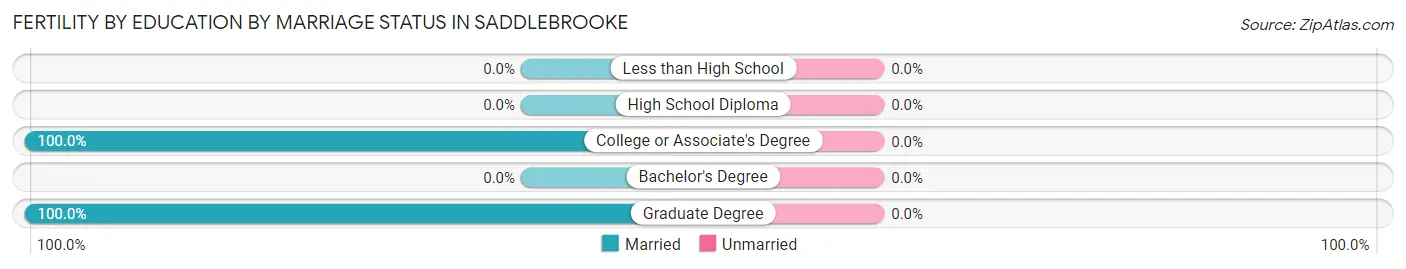
| Educational Attainment | Married | Unmarried |
| Less than High School | 0 (0.0%) | 0 (0.0%) |
| High School Diploma | 0 (0.0%) | 0 (0.0%) |
| College or Associate's Degree | 68 (100.0%) | 0 (0.0%) |
| Bachelor's Degree | 0 (0.0%) | 0 (0.0%) |
| Graduate Degree | 19 (100.0%) | 0 (0.0%) |
| Total | 87 (100.0%) | 0 (0.0%) |
Employment Characteristics in Saddlebrooke
Employment by Class of Employer in Saddlebrooke
Among the 1,851 employed individuals in Saddlebrooke, private company employees (1,292 | 69.8%), self-employed (not incorporated) (233 | 12.6%), and self-employed (incorporated) (142 | 7.7%) make up the most common classes of employment.
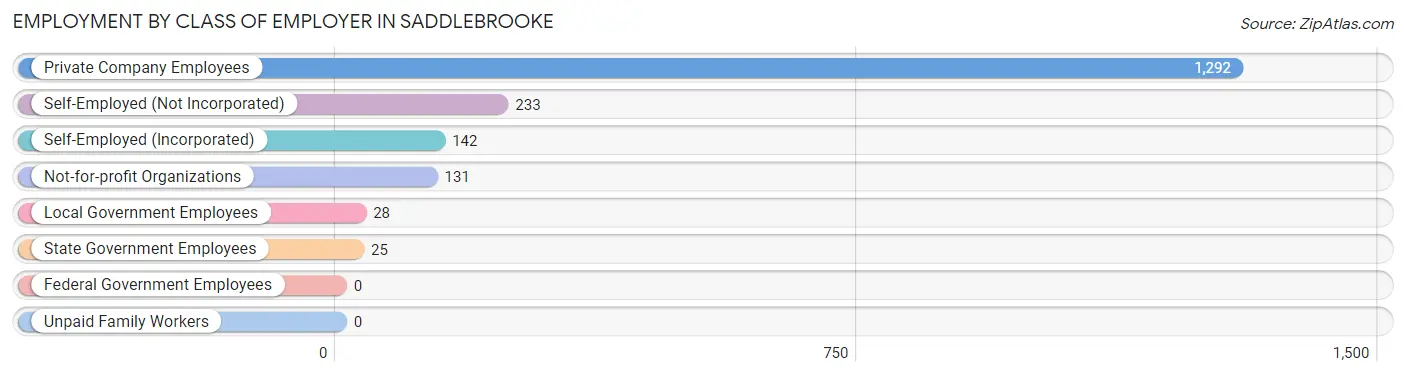
| Employer Class | # Employees | % Employees |
| Private Company Employees | 1,292 | 69.8% |
| Self-Employed (Incorporated) | 142 | 7.7% |
| Self-Employed (Not Incorporated) | 233 | 12.6% |
| Not-for-profit Organizations | 131 | 7.1% |
| Local Government Employees | 28 | 1.5% |
| State Government Employees | 25 | 1.3% |
| Federal Government Employees | 0 | 0.0% |
| Unpaid Family Workers | 0 | 0.0% |
| Total | 1,851 | 100.0% |
Employment Status by Age in Saddlebrooke
According to the labor force statistics for Saddlebrooke, out of the total population over 16 years of age (11,399), 19.3% or 2,200 individuals are in the labor force, with 14.7% or 323 of them unemployed. The age group with the highest labor force participation rate is 45 to 54 years, with 89.0% or 444 individuals in the labor force. Within the labor force, the 16 to 19 years age range has the highest percentage of unemployed individuals, with 61.5% or 40 of them being unemployed.
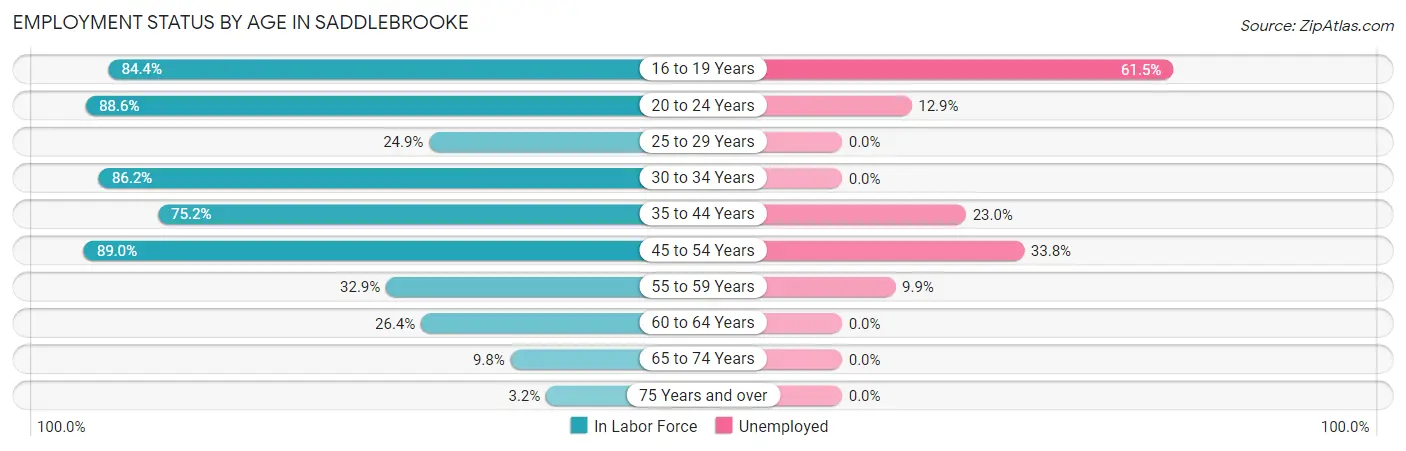
| Age Bracket | In Labor Force | Unemployed |
| 16 to 19 Years | 65 (84.4%) | 40 (61.5%) |
| 20 to 24 Years | 124 (88.6%) | 16 (12.9%) |
| 25 to 29 Years | 62 (24.9%) | 0 (0.0%) |
| 30 to 34 Years | 112 (86.2%) | 0 (0.0%) |
| 35 to 44 Years | 457 (75.2%) | 105 (23.0%) |
| 45 to 54 Years | 444 (89.0%) | 150 (33.8%) |
| 55 to 59 Years | 141 (32.9%) | 14 (9.9%) |
| 60 to 64 Years | 239 (26.4%) | 0 (0.0%) |
| 65 to 74 Years | 432 (9.8%) | 0 (0.0%) |
| 75 Years and over | 126 (3.2%) | 0 (0.0%) |
| Total | 2,200 (19.3%) | 323 (14.7%) |
Employment Status by Educational Attainment in Saddlebrooke
According to labor force statistics for Saddlebrooke, 51.6% of individuals (1,455) out of the total population between 25 and 64 years of age (2,819) are in the labor force, with 18.5% or 269 of them being unemployed. The group with the highest labor force participation rate are those with the educational attainment of high school diploma, with 81.6% or 292 individuals in the labor force. Within the labor force, individuals with high school diploma education have the highest percentage of unemployment, with 28.8% or 84 of them being unemployed.
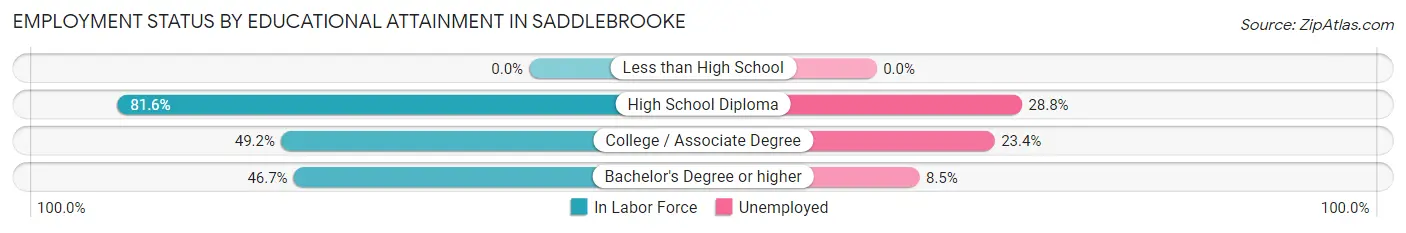
| Educational Attainment | In Labor Force | Unemployed |
| Less than High School | 0 (0.0%) | 0 (0.0%) |
| High School Diploma | 292 (81.6%) | 103 (28.8%) |
| College / Associate Degree | 578 (49.2%) | 275 (23.4%) |
| Bachelor's Degree or higher | 585 (46.7%) | 106 (8.5%) |
| Total | 1,455 (51.6%) | 522 (18.5%) |
Employment Occupations by Sex in Saddlebrooke
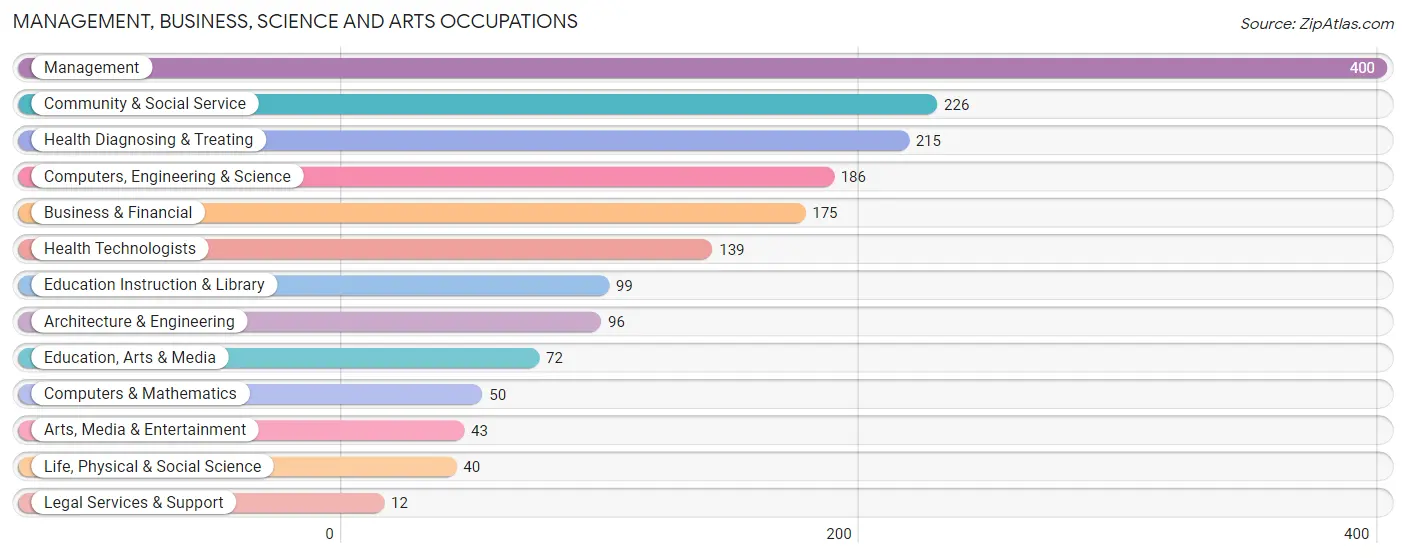
Management, Business, Science and Arts Occupations
The most common Management, Business, Science and Arts occupations in Saddlebrooke are Management (400 | 21.3%), Community & Social Service (226 | 12.0%), Health Diagnosing & Treating (215 | 11.4%), Computers, Engineering & Science (186 | 9.9%), and Business & Financial (175 | 9.3%).
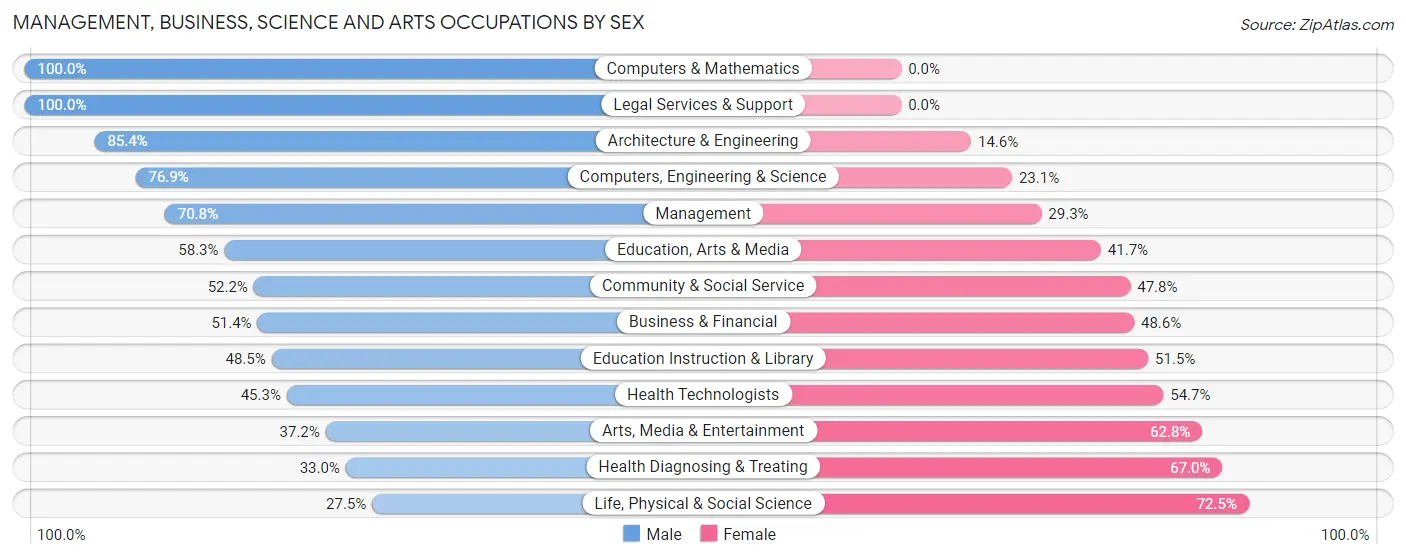
Management, Business, Science and Arts Occupations by Sex
Within the Management, Business, Science and Arts occupations in Saddlebrooke, the most male-oriented occupations are Computers & Mathematics (100.0%), Legal Services & Support (100.0%), and Architecture & Engineering (85.4%), while the most female-oriented occupations are Life, Physical & Social Science (72.5%), Health Diagnosing & Treating (67.0%), and Arts, Media & Entertainment (62.8%).
| Occupation | Male | Female |
| Management | 283 (70.8%) | 117 (29.2%) |
| Business & Financial | 90 (51.4%) | 85 (48.6%) |
| Computers, Engineering & Science | 143 (76.9%) | 43 (23.1%) |
| Computers & Mathematics | 50 (100.0%) | 0 (0.0%) |
| Architecture & Engineering | 82 (85.4%) | 14 (14.6%) |
| Life, Physical & Social Science | 11 (27.5%) | 29 (72.5%) |
| Community & Social Service | 118 (52.2%) | 108 (47.8%) |
| Education, Arts & Media | 42 (58.3%) | 30 (41.7%) |
| Legal Services & Support | 12 (100.0%) | 0 (0.0%) |
| Education Instruction & Library | 48 (48.5%) | 51 (51.5%) |
| Arts, Media & Entertainment | 16 (37.2%) | 27 (62.8%) |
| Health Diagnosing & Treating | 71 (33.0%) | 144 (67.0%) |
| Health Technologists | 63 (45.3%) | 76 (54.7%) |
| Total (Category) | 705 (58.7%) | 497 (41.3%) |
| Total (Overall) | 1,147 (61.0%) | 732 (39.0%) |
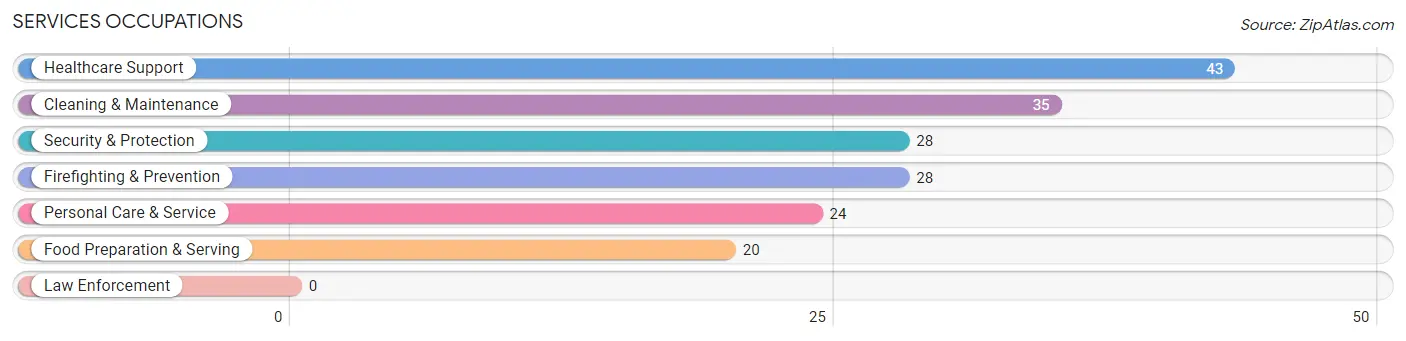
Services Occupations
The most common Services occupations in Saddlebrooke are Healthcare Support (43 | 2.3%), Cleaning & Maintenance (35 | 1.9%), Security & Protection (28 | 1.5%), Firefighting & Prevention (28 | 1.5%), and Personal Care & Service (24 | 1.3%).
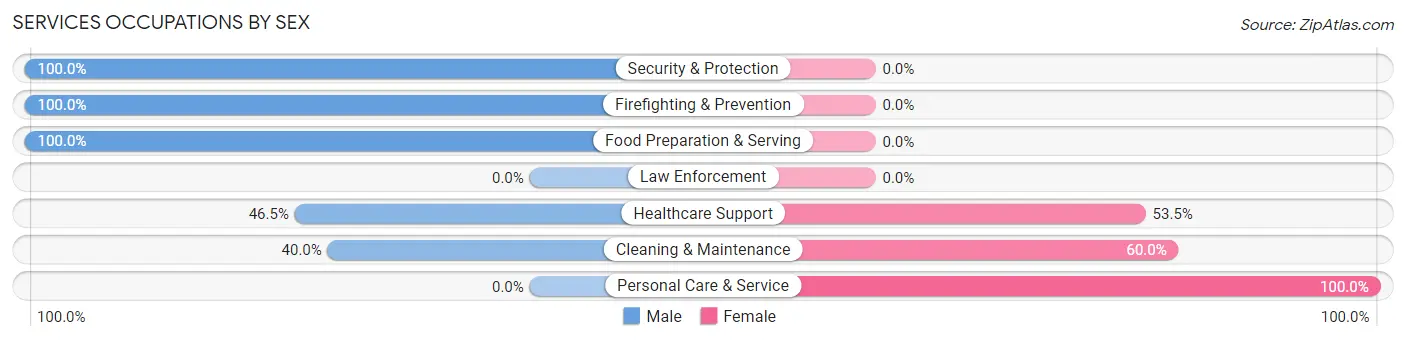
Services Occupations by Sex
Within the Services occupations in Saddlebrooke, the most male-oriented occupations are Security & Protection (100.0%), Firefighting & Prevention (100.0%), and Food Preparation & Serving (100.0%), while the most female-oriented occupations are Personal Care & Service (100.0%), Cleaning & Maintenance (60.0%), and Healthcare Support (53.5%).
| Occupation | Male | Female |
| Healthcare Support | 20 (46.5%) | 23 (53.5%) |
| Security & Protection | 28 (100.0%) | 0 (0.0%) |
| Firefighting & Prevention | 28 (100.0%) | 0 (0.0%) |
| Law Enforcement | 0 (0.0%) | 0 (0.0%) |
| Food Preparation & Serving | 20 (100.0%) | 0 (0.0%) |
| Cleaning & Maintenance | 14 (40.0%) | 21 (60.0%) |
| Personal Care & Service | 0 (0.0%) | 24 (100.0%) |
| Total (Category) | 82 (54.7%) | 68 (45.3%) |
| Total (Overall) | 1,147 (61.0%) | 732 (39.0%) |
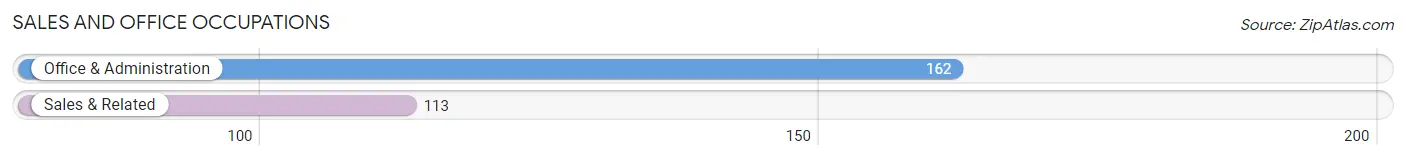
Sales and Office Occupations
The most common Sales and Office occupations in Saddlebrooke are Office & Administration (162 | 8.6%), and Sales & Related (113 | 6.0%).
Sales and Office Occupations by Sex
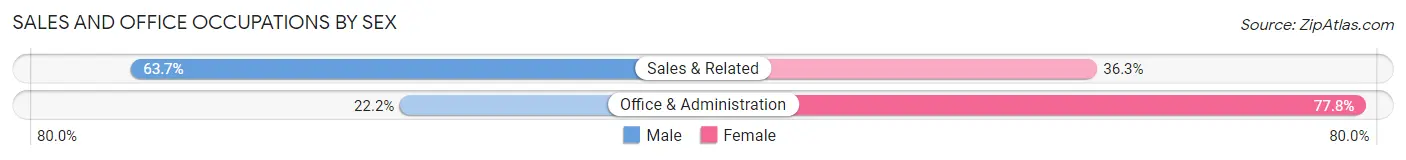
| Occupation | Male | Female |
| Sales & Related | 72 (63.7%) | 41 (36.3%) |
| Office & Administration | 36 (22.2%) | 126 (77.8%) |
| Total (Category) | 108 (39.3%) | 167 (60.7%) |
| Total (Overall) | 1,147 (61.0%) | 732 (39.0%) |
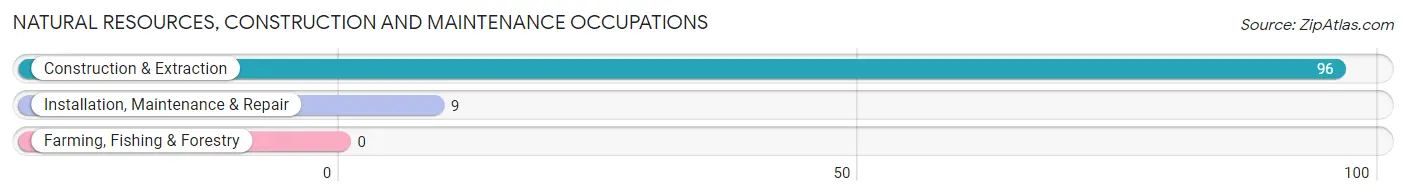
Natural Resources, Construction and Maintenance Occupations
The most common Natural Resources, Construction and Maintenance occupations in Saddlebrooke are Construction & Extraction (96 | 5.1%), and Installation, Maintenance & Repair (9 | 0.5%).
Natural Resources, Construction and Maintenance Occupations by Sex
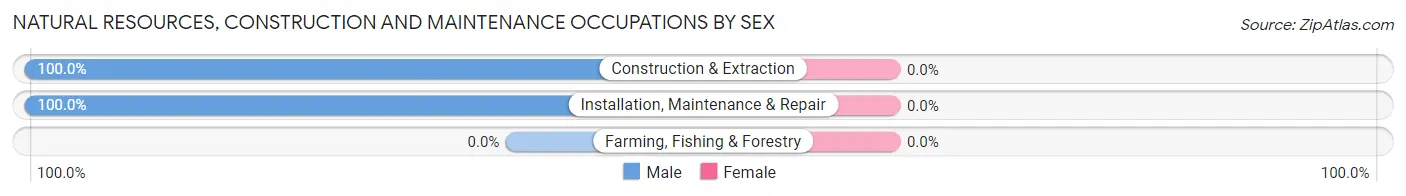
| Occupation | Male | Female |
| Farming, Fishing & Forestry | 0 (0.0%) | 0 (0.0%) |
| Construction & Extraction | 96 (100.0%) | 0 (0.0%) |
| Installation, Maintenance & Repair | 9 (100.0%) | 0 (0.0%) |
| Total (Category) | 105 (100.0%) | 0 (0.0%) |
| Total (Overall) | 1,147 (61.0%) | 732 (39.0%) |
Production, Transportation and Moving Occupations
The most common Production, Transportation and Moving occupations in Saddlebrooke are Transportation (116 | 6.2%), and Production (31 | 1.7%).
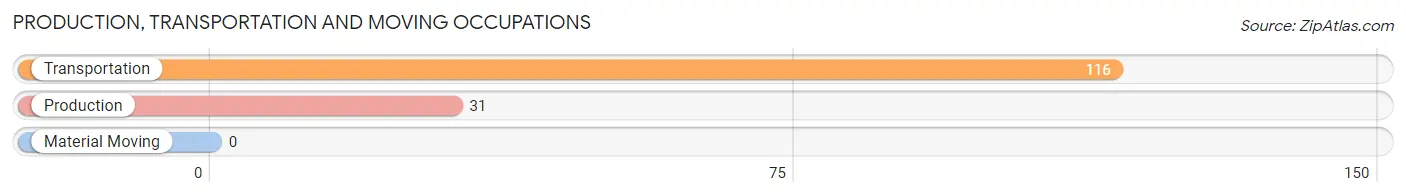
Production, Transportation and Moving Occupations by Sex
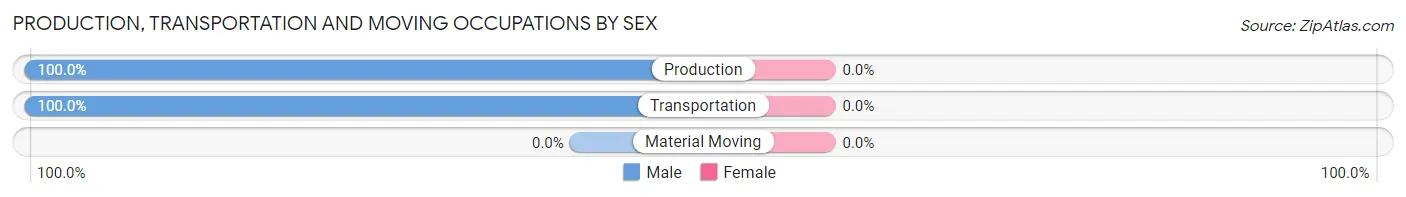
| Occupation | Male | Female |
| Production | 31 (100.0%) | 0 (0.0%) |
| Transportation | 116 (100.0%) | 0 (0.0%) |
| Material Moving | 0 (0.0%) | 0 (0.0%) |
| Total (Category) | 147 (100.0%) | 0 (0.0%) |
| Total (Overall) | 1,147 (61.0%) | 732 (39.0%) |
Employment Industries by Sex in Saddlebrooke
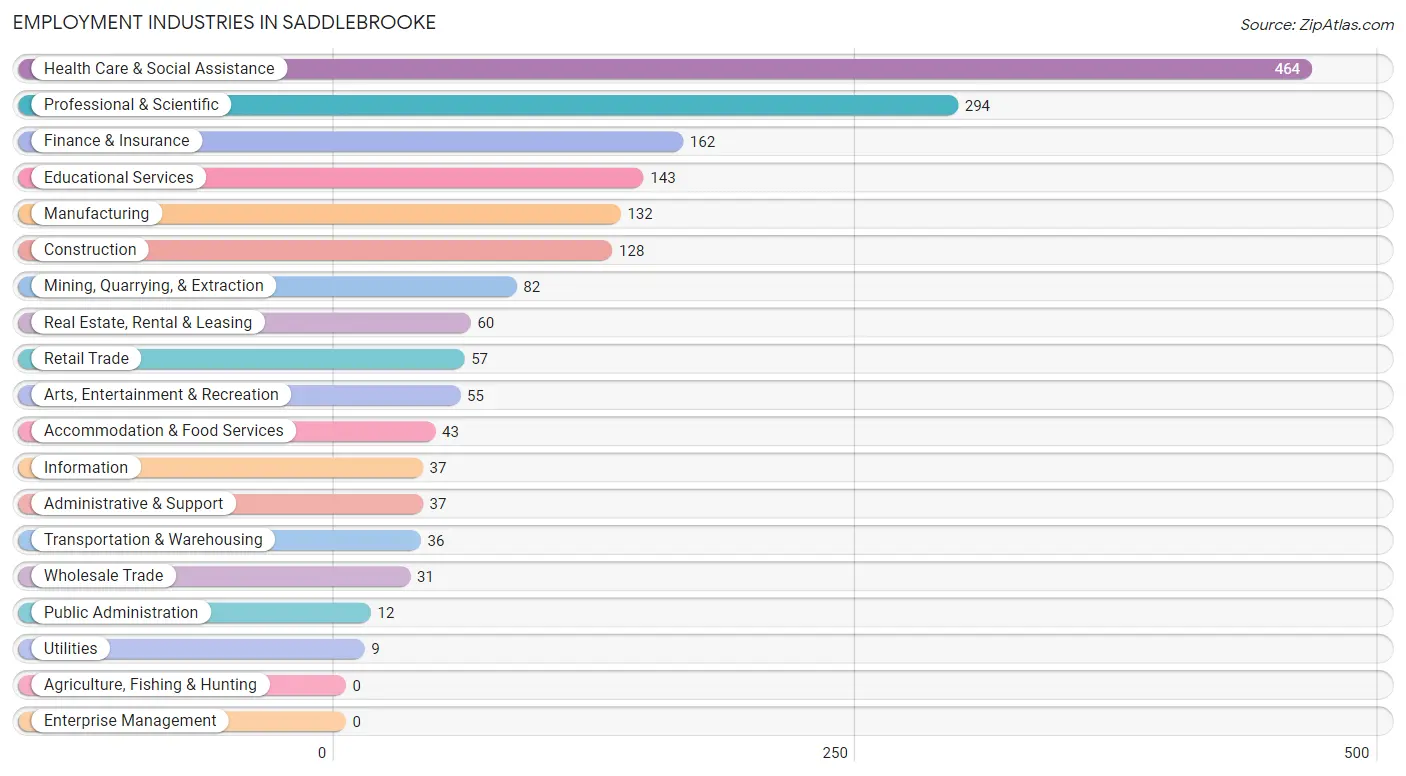
Employment Industries in Saddlebrooke
The major employment industries in Saddlebrooke include Health Care & Social Assistance (464 | 24.7%), Professional & Scientific (294 | 15.7%), Finance & Insurance (162 | 8.6%), Educational Services (143 | 7.6%), and Manufacturing (132 | 7.0%).
Employment Industries by Sex in Saddlebrooke
The Saddlebrooke industries that see more men than women are Mining, Quarrying, & Extraction (100.0%), Manufacturing (100.0%), and Utilities (100.0%), whereas the industries that tend to have a higher number of women are Information (100.0%), Administrative & Support (100.0%), and Public Administration (100.0%).
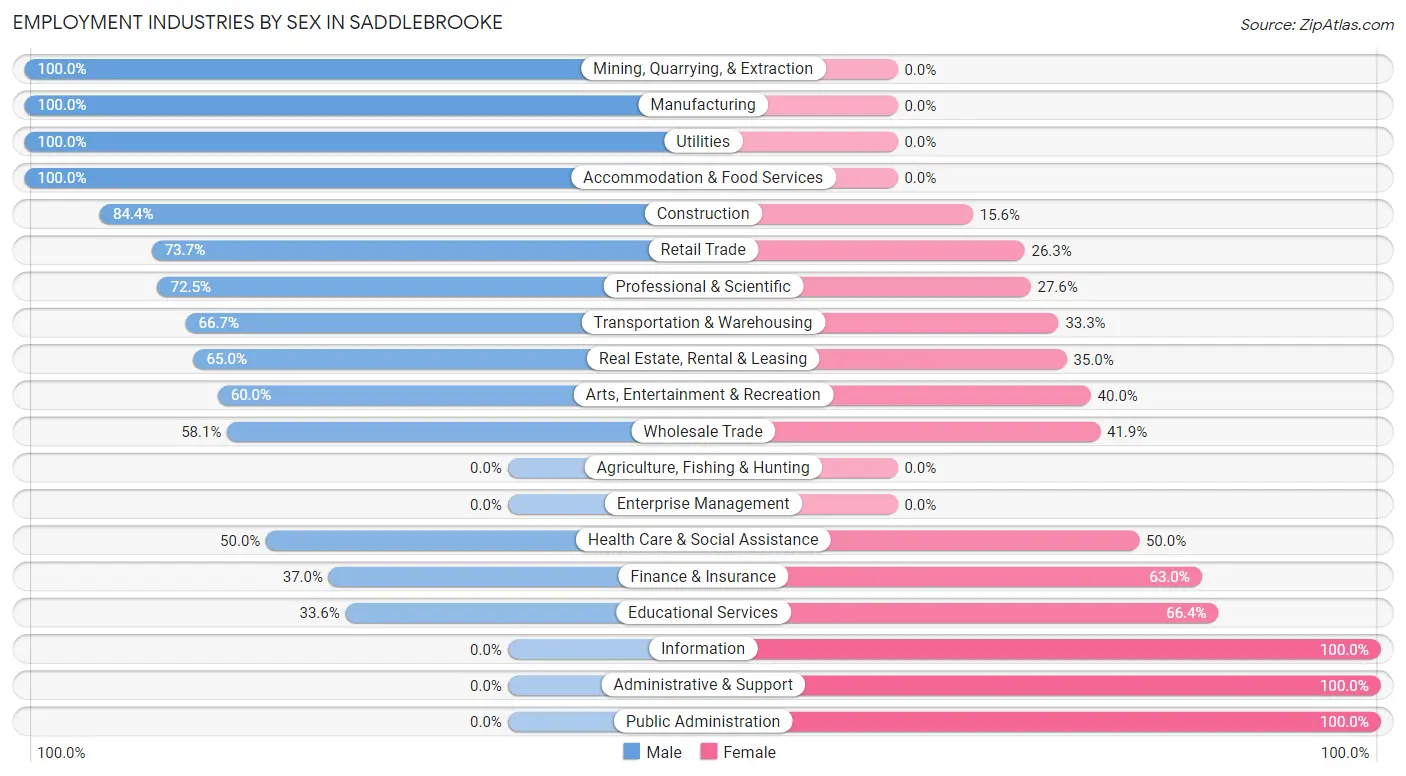
| Industry | Male | Female |
| Agriculture, Fishing & Hunting | 0 (0.0%) | 0 (0.0%) |
| Mining, Quarrying, & Extraction | 82 (100.0%) | 0 (0.0%) |
| Construction | 108 (84.4%) | 20 (15.6%) |
| Manufacturing | 132 (100.0%) | 0 (0.0%) |
| Wholesale Trade | 18 (58.1%) | 13 (41.9%) |
| Retail Trade | 42 (73.7%) | 15 (26.3%) |
| Transportation & Warehousing | 24 (66.7%) | 12 (33.3%) |
| Utilities | 9 (100.0%) | 0 (0.0%) |
| Information | 0 (0.0%) | 37 (100.0%) |
| Finance & Insurance | 60 (37.0%) | 102 (63.0%) |
| Real Estate, Rental & Leasing | 39 (65.0%) | 21 (35.0%) |
| Professional & Scientific | 213 (72.5%) | 81 (27.6%) |
| Enterprise Management | 0 (0.0%) | 0 (0.0%) |
| Administrative & Support | 0 (0.0%) | 37 (100.0%) |
| Educational Services | 48 (33.6%) | 95 (66.4%) |
| Health Care & Social Assistance | 232 (50.0%) | 232 (50.0%) |
| Arts, Entertainment & Recreation | 33 (60.0%) | 22 (40.0%) |
| Accommodation & Food Services | 43 (100.0%) | 0 (0.0%) |
| Public Administration | 0 (0.0%) | 12 (100.0%) |
| Total | 1,147 (61.0%) | 732 (39.0%) |
Education in Saddlebrooke
School Enrollment in Saddlebrooke
The most common levels of schooling among the 659 students in Saddlebrooke are middle school (239 | 36.3%), college / undergraduate (114 | 17.3%), and elementary school (105 | 15.9%).
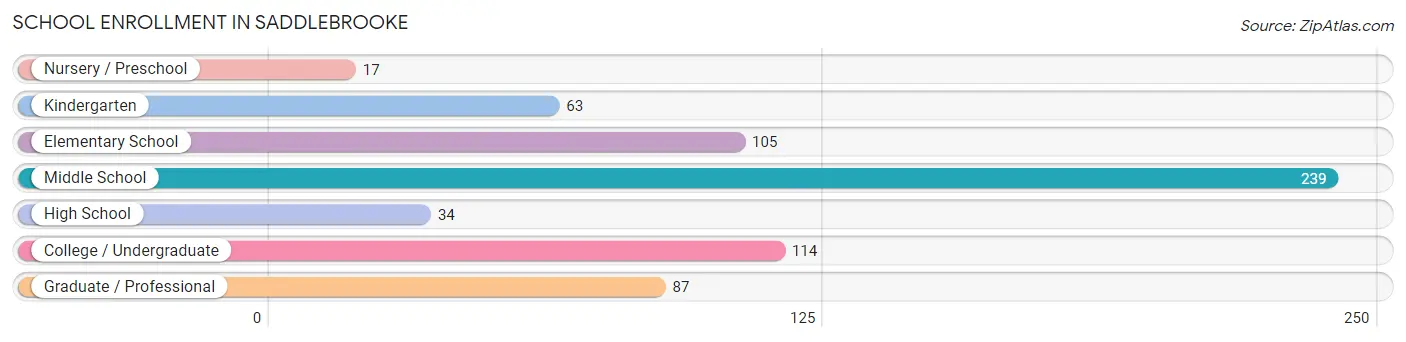
| School Level | # Students | % Students |
| Nursery / Preschool | 17 | 2.6% |
| Kindergarten | 63 | 9.6% |
| Elementary School | 105 | 15.9% |
| Middle School | 239 | 36.3% |
| High School | 34 | 5.2% |
| College / Undergraduate | 114 | 17.3% |
| Graduate / Professional | 87 | 13.2% |
| Total | 659 | 100.0% |
School Enrollment by Age by Funding Source in Saddlebrooke
Out of a total of 659 students who are enrolled in schools in Saddlebrooke, 126 (19.1%) attend a private institution, while the remaining 533 (80.9%) are enrolled in public schools. The age group of 15 to 17 year olds has the highest likelihood of being enrolled in private schools, with 34 (100.0% in the age bracket) enrolled. Conversely, the age group of 3 to 4 year olds has the lowest likelihood of being enrolled in a private school, with 17 (100.0% in the age bracket) attending a public institution.
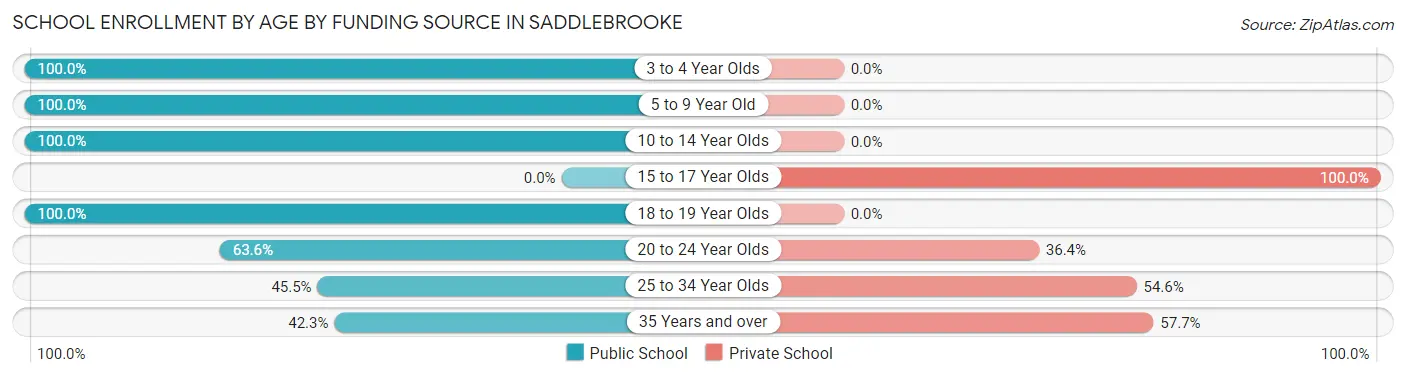
| Age Bracket | Public School | Private School |
| 3 to 4 Year Olds | 17 (100.0%) | 0 (0.0%) |
| 5 to 9 Year Old | 168 (100.0%) | 0 (0.0%) |
| 10 to 14 Year Olds | 239 (100.0%) | 0 (0.0%) |
| 15 to 17 Year Olds | 0 (0.0%) | 34 (100.0%) |
| 18 to 19 Year Olds | 20 (100.0%) | 0 (0.0%) |
| 20 to 24 Year Olds | 35 (63.6%) | 20 (36.4%) |
| 25 to 34 Year Olds | 10 (45.5%) | 12 (54.5%) |
| 35 Years and over | 44 (42.3%) | 60 (57.7%) |
| Total | 533 (80.9%) | 126 (19.1%) |
Educational Attainment by Field of Study in Saddlebrooke
Business (1,207 | 18.5%), education (1,160 | 17.8%), social sciences (653 | 10.0%), engineering (584 | 9.0%), and science & technology (474 | 7.3%) are the most common fields of study among 6,509 individuals in Saddlebrooke who have obtained a bachelor's degree or higher.
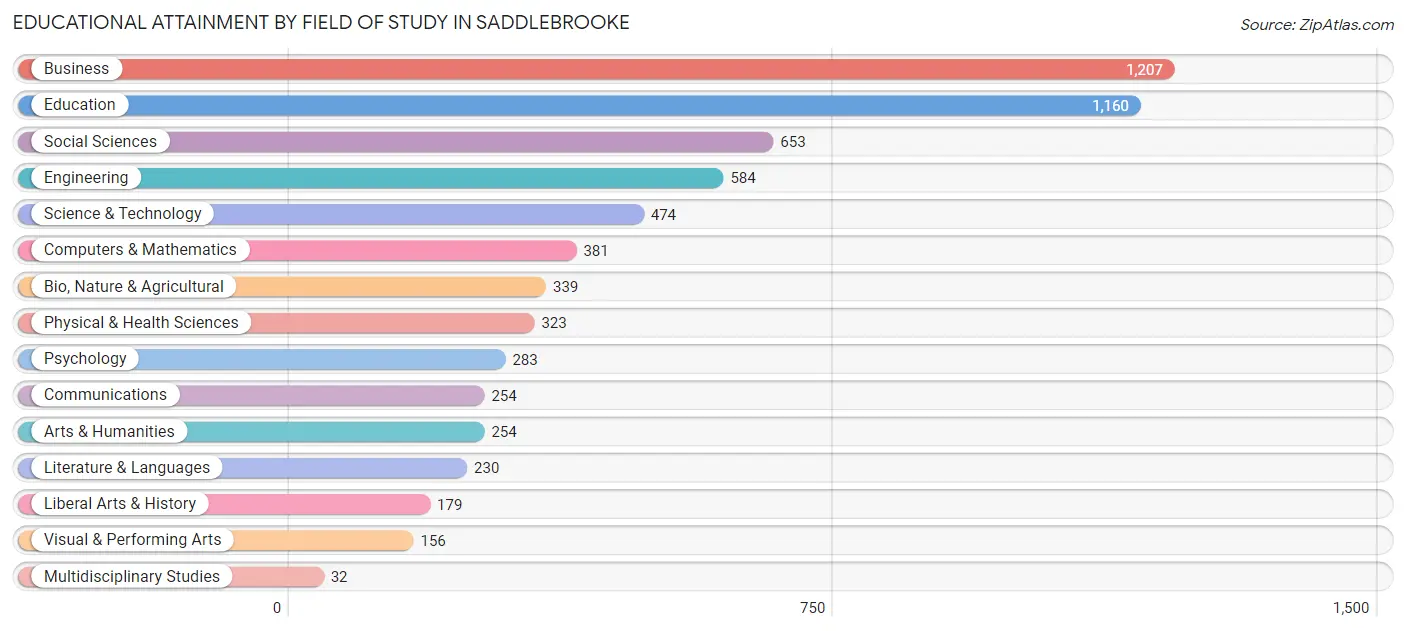
| Field of Study | # Graduates | % Graduates |
| Computers & Mathematics | 381 | 5.9% |
| Bio, Nature & Agricultural | 339 | 5.2% |
| Physical & Health Sciences | 323 | 5.0% |
| Psychology | 283 | 4.3% |
| Social Sciences | 653 | 10.0% |
| Engineering | 584 | 9.0% |
| Multidisciplinary Studies | 32 | 0.5% |
| Science & Technology | 474 | 7.3% |
| Business | 1,207 | 18.5% |
| Education | 1,160 | 17.8% |
| Literature & Languages | 230 | 3.5% |
| Liberal Arts & History | 179 | 2.8% |
| Visual & Performing Arts | 156 | 2.4% |
| Communications | 254 | 3.9% |
| Arts & Humanities | 254 | 3.9% |
| Total | 6,509 | 100.0% |
Transportation & Commute in Saddlebrooke
Vehicle Availability by Sex in Saddlebrooke
The most prevalent vehicle ownership categories in Saddlebrooke are males with 2 vehicles (670, accounting for 59.0%) and females with 2 vehicles (343, making up 93.7%).
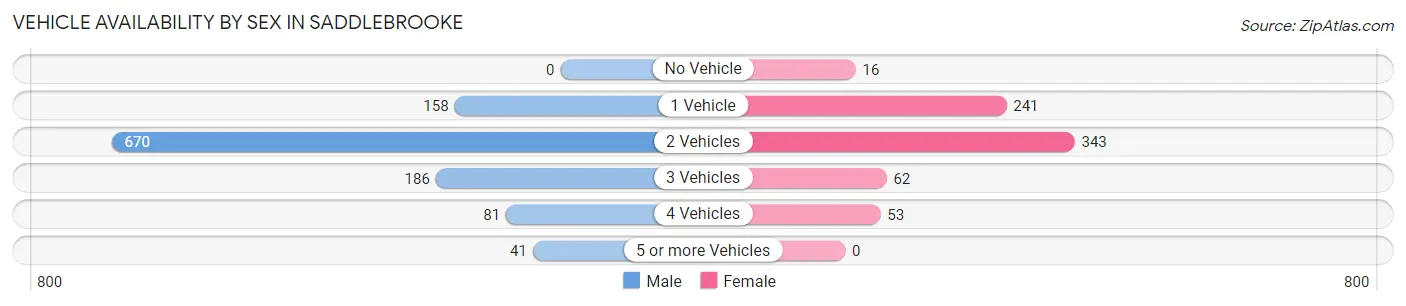
| Vehicles Available | Male | Female |
| No Vehicle | 0 (0.0%) | 16 (2.2%) |
| 1 Vehicle | 158 (13.9%) | 241 (33.7%) |
| 2 Vehicles | 670 (59.0%) | 343 (48.0%) |
| 3 Vehicles | 186 (16.4%) | 62 (8.7%) |
| 4 Vehicles | 81 (7.1%) | 53 (7.4%) |
| 5 or more Vehicles | 41 (3.6%) | 0 (0.0%) |
| Total | 1,136 (100.0%) | 715 (100.0%) |
Commute Time in Saddlebrooke
The most frequently occuring commute durations in Saddlebrooke are 30 to 34 minutes (276 commuters, 18.7%), 40 to 44 minutes (231 commuters, 15.6%), and 45 to 59 minutes (168 commuters, 11.4%).
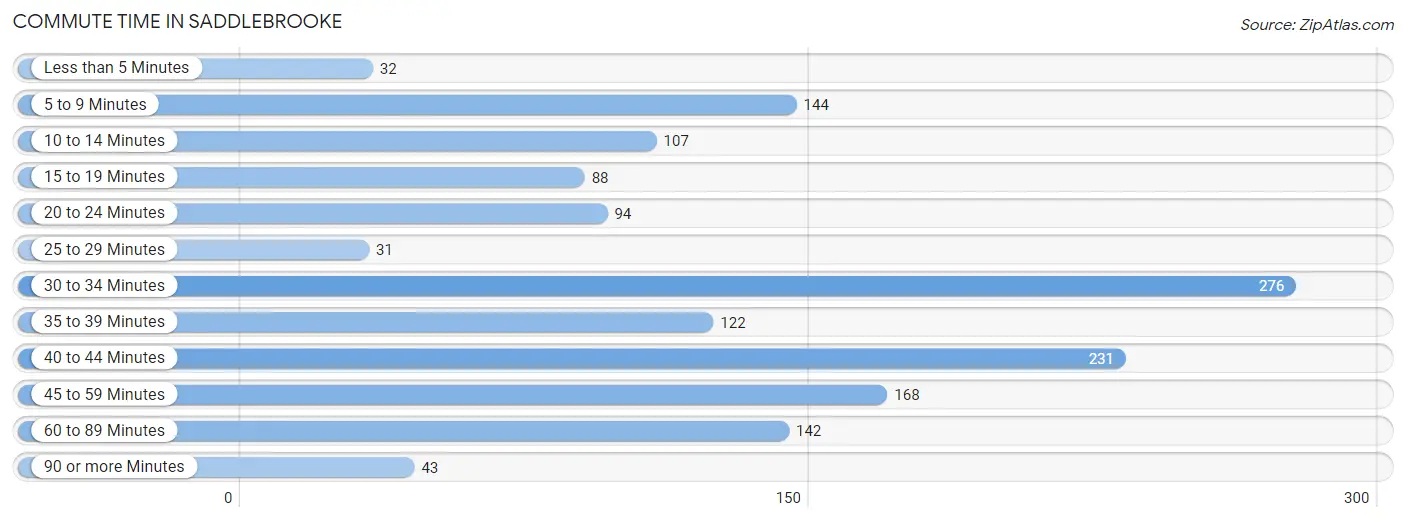
| Commute Time | # Commuters | % Commuters |
| Less than 5 Minutes | 32 | 2.2% |
| 5 to 9 Minutes | 144 | 9.7% |
| 10 to 14 Minutes | 107 | 7.2% |
| 15 to 19 Minutes | 88 | 5.9% |
| 20 to 24 Minutes | 94 | 6.4% |
| 25 to 29 Minutes | 31 | 2.1% |
| 30 to 34 Minutes | 276 | 18.7% |
| 35 to 39 Minutes | 122 | 8.3% |
| 40 to 44 Minutes | 231 | 15.6% |
| 45 to 59 Minutes | 168 | 11.4% |
| 60 to 89 Minutes | 142 | 9.6% |
| 90 or more Minutes | 43 | 2.9% |
Commute Time by Sex in Saddlebrooke
The most common commute times in Saddlebrooke are 30 to 34 minutes (183 commuters, 20.1%) for males and 45 to 59 minutes (121 commuters, 21.3%) for females.
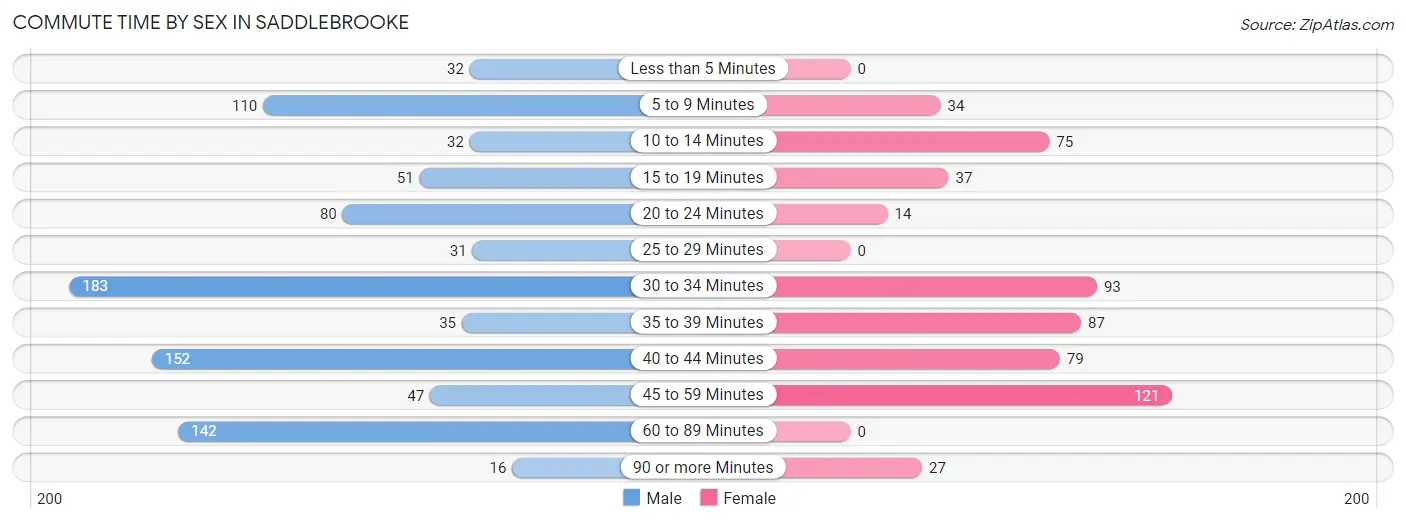
| Commute Time | Male | Female |
| Less than 5 Minutes | 32 (3.5%) | 0 (0.0%) |
| 5 to 9 Minutes | 110 (12.1%) | 34 (6.0%) |
| 10 to 14 Minutes | 32 (3.5%) | 75 (13.2%) |
| 15 to 19 Minutes | 51 (5.6%) | 37 (6.5%) |
| 20 to 24 Minutes | 80 (8.8%) | 14 (2.5%) |
| 25 to 29 Minutes | 31 (3.4%) | 0 (0.0%) |
| 30 to 34 Minutes | 183 (20.1%) | 93 (16.4%) |
| 35 to 39 Minutes | 35 (3.8%) | 87 (15.3%) |
| 40 to 44 Minutes | 152 (16.7%) | 79 (13.9%) |
| 45 to 59 Minutes | 47 (5.2%) | 121 (21.3%) |
| 60 to 89 Minutes | 142 (15.6%) | 0 (0.0%) |
| 90 or more Minutes | 16 (1.8%) | 27 (4.8%) |
Time of Departure to Work by Sex in Saddlebrooke
The most frequent times of departure to work in Saddlebrooke are 6:30 AM to 6:59 AM (128, 14.1%) for males and 7:00 AM to 7:29 AM (133, 23.5%) for females.
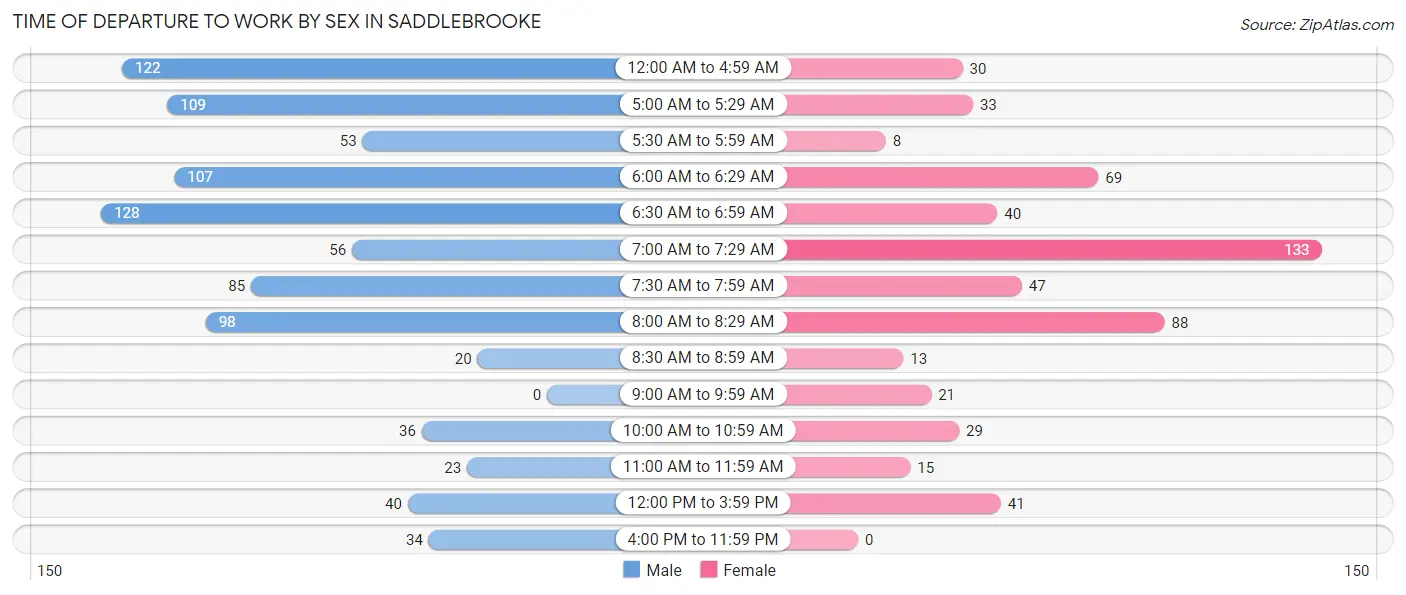
| Time of Departure | Male | Female |
| 12:00 AM to 4:59 AM | 122 (13.4%) | 30 (5.3%) |
| 5:00 AM to 5:29 AM | 109 (12.0%) | 33 (5.8%) |
| 5:30 AM to 5:59 AM | 53 (5.8%) | 8 (1.4%) |
| 6:00 AM to 6:29 AM | 107 (11.7%) | 69 (12.2%) |
| 6:30 AM to 6:59 AM | 128 (14.1%) | 40 (7.0%) |
| 7:00 AM to 7:29 AM | 56 (6.1%) | 133 (23.5%) |
| 7:30 AM to 7:59 AM | 85 (9.3%) | 47 (8.3%) |
| 8:00 AM to 8:29 AM | 98 (10.8%) | 88 (15.5%) |
| 8:30 AM to 8:59 AM | 20 (2.2%) | 13 (2.3%) |
| 9:00 AM to 9:59 AM | 0 (0.0%) | 21 (3.7%) |
| 10:00 AM to 10:59 AM | 36 (4.0%) | 29 (5.1%) |
| 11:00 AM to 11:59 AM | 23 (2.5%) | 15 (2.6%) |
| 12:00 PM to 3:59 PM | 40 (4.4%) | 41 (7.2%) |
| 4:00 PM to 11:59 PM | 34 (3.7%) | 0 (0.0%) |
| Total | 911 (100.0%) | 567 (100.0%) |
Housing Occupancy in Saddlebrooke
Occupancy by Ownership in Saddlebrooke
Of the total 6,203 dwellings in Saddlebrooke, owner-occupied units account for 5,914 (95.3%), while renter-occupied units make up 289 (4.7%).
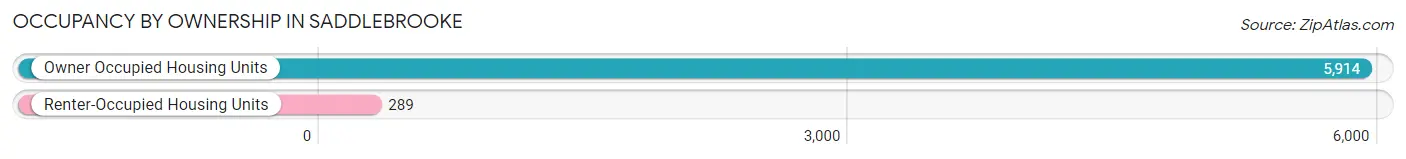
| Occupancy | # Housing Units | % Housing Units |
| Owner Occupied Housing Units | 5,914 | 95.3% |
| Renter-Occupied Housing Units | 289 | 4.7% |
| Total Occupied Housing Units | 6,203 | 100.0% |
Occupancy by Household Size in Saddlebrooke
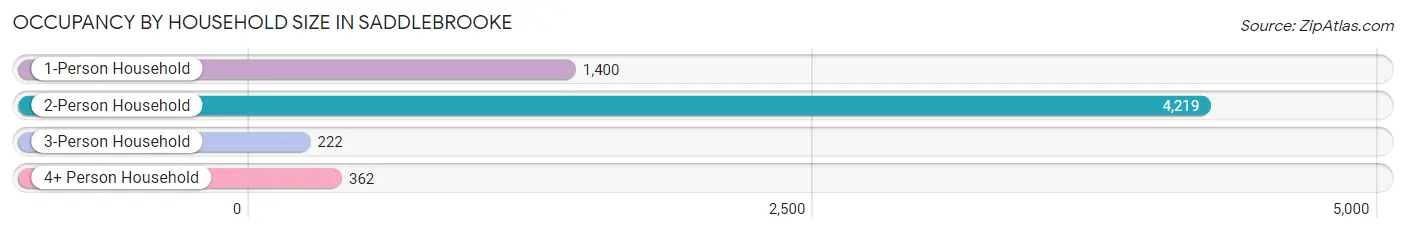
| Household Size | # Housing Units | % Housing Units |
| 1-Person Household | 1,400 | 22.6% |
| 2-Person Household | 4,219 | 68.0% |
| 3-Person Household | 222 | 3.6% |
| 4+ Person Household | 362 | 5.8% |
| Total Housing Units | 6,203 | 100.0% |
Occupancy by Ownership by Household Size in Saddlebrooke
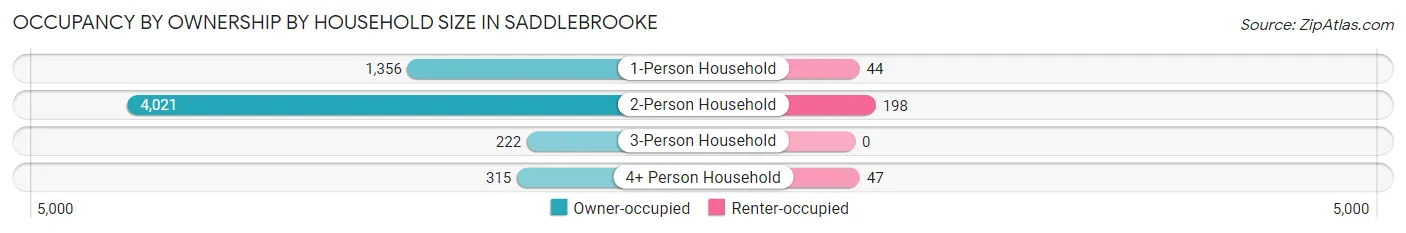
| Household Size | Owner-occupied | Renter-occupied |
| 1-Person Household | 1,356 (96.9%) | 44 (3.1%) |
| 2-Person Household | 4,021 (95.3%) | 198 (4.7%) |
| 3-Person Household | 222 (100.0%) | 0 (0.0%) |
| 4+ Person Household | 315 (87.0%) | 47 (13.0%) |
| Total Housing Units | 5,914 (95.3%) | 289 (4.7%) |
Occupancy by Educational Attainment in Saddlebrooke
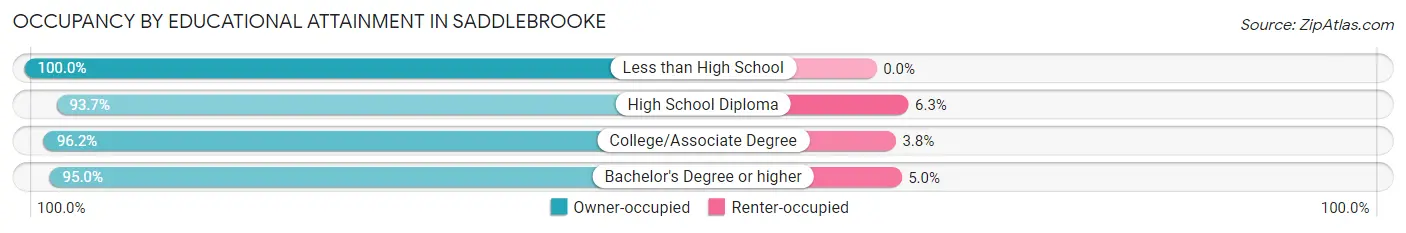
| Household Size | Owner-occupied | Renter-occupied |
| Less than High School | 48 (100.0%) | 0 (0.0%) |
| High School Diploma | 444 (93.7%) | 30 (6.3%) |
| College/Associate Degree | 1,960 (96.2%) | 78 (3.8%) |
| Bachelor's Degree or higher | 3,462 (95.0%) | 181 (5.0%) |
Occupancy by Age of Householder in Saddlebrooke
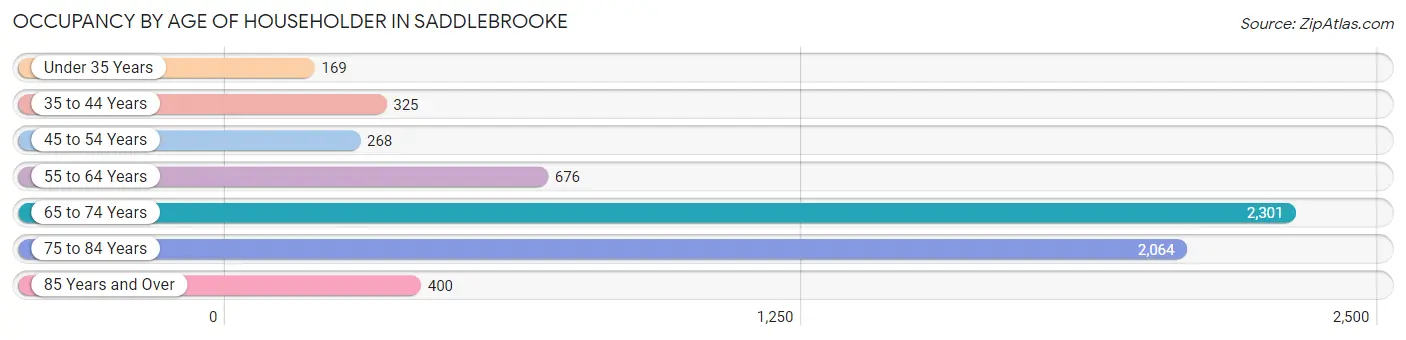
| Age Bracket | # Households | % Households |
| Under 35 Years | 169 | 2.7% |
| 35 to 44 Years | 325 | 5.2% |
| 45 to 54 Years | 268 | 4.3% |
| 55 to 64 Years | 676 | 10.9% |
| 65 to 74 Years | 2,301 | 37.1% |
| 75 to 84 Years | 2,064 | 33.3% |
| 85 Years and Over | 400 | 6.5% |
| Total | 6,203 | 100.0% |
Housing Finances in Saddlebrooke
Median Income by Occupancy in Saddlebrooke
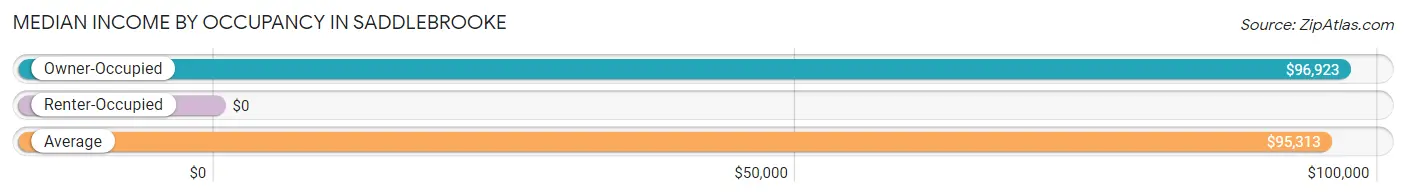
| Occupancy Type | # Households | Median Income |
| Owner-Occupied | 5,914 (95.3%) | $96,923 |
| Renter-Occupied | 289 (4.7%) | $0 |
| Average | 6,203 (100.0%) | $95,313 |
Occupancy by Householder Income Bracket in Saddlebrooke
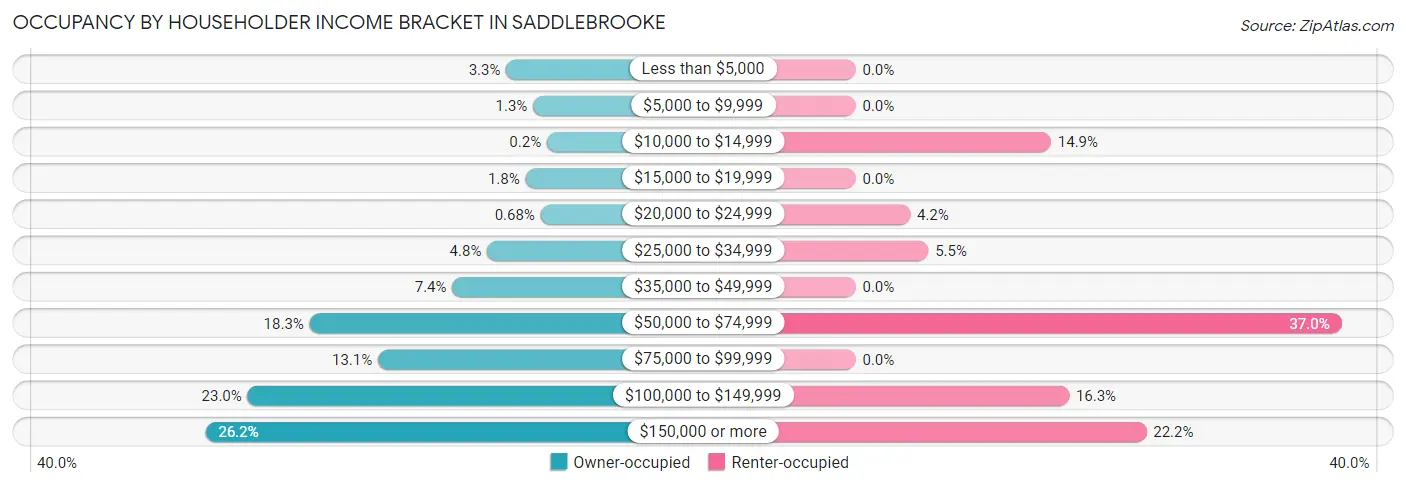
| Income Bracket | Owner-occupied | Renter-occupied |
| Less than $5,000 | 195 (3.3%) | 0 (0.0%) |
| $5,000 to $9,999 | 74 (1.3%) | 0 (0.0%) |
| $10,000 to $14,999 | 12 (0.2%) | 43 (14.9%) |
| $15,000 to $19,999 | 108 (1.8%) | 0 (0.0%) |
| $20,000 to $24,999 | 40 (0.7%) | 12 (4.2%) |
| $25,000 to $34,999 | 281 (4.8%) | 16 (5.5%) |
| $35,000 to $49,999 | 438 (7.4%) | 0 (0.0%) |
| $50,000 to $74,999 | 1,081 (18.3%) | 107 (37.0%) |
| $75,000 to $99,999 | 773 (13.1%) | 0 (0.0%) |
| $100,000 to $149,999 | 1,361 (23.0%) | 47 (16.3%) |
| $150,000 or more | 1,551 (26.2%) | 64 (22.2%) |
| Total | 5,914 (100.0%) | 289 (100.0%) |
Monthly Housing Cost Tiers in Saddlebrooke
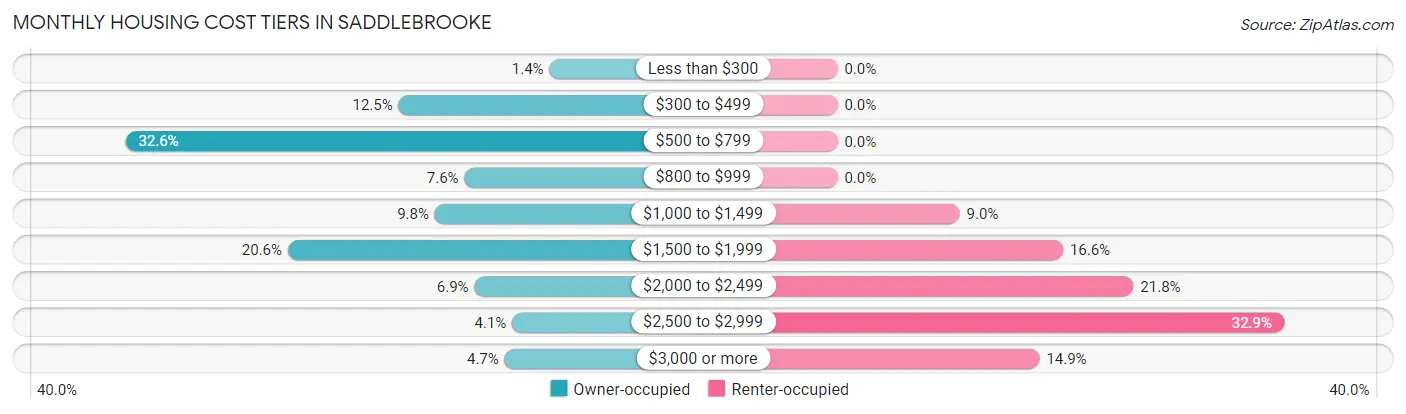
| Monthly Cost | Owner-occupied | Renter-occupied |
| Less than $300 | 80 (1.3%) | 0 (0.0%) |
| $300 to $499 | 737 (12.5%) | 0 (0.0%) |
| $500 to $799 | 1,926 (32.6%) | 0 (0.0%) |
| $800 to $999 | 450 (7.6%) | 0 (0.0%) |
| $1,000 to $1,499 | 579 (9.8%) | 26 (9.0%) |
| $1,500 to $1,999 | 1,219 (20.6%) | 48 (16.6%) |
| $2,000 to $2,499 | 406 (6.9%) | 63 (21.8%) |
| $2,500 to $2,999 | 242 (4.1%) | 95 (32.9%) |
| $3,000 or more | 275 (4.6%) | 43 (14.9%) |
| Total | 5,914 (100.0%) | 289 (100.0%) |
Physical Housing Characteristics in Saddlebrooke
Housing Structures in Saddlebrooke
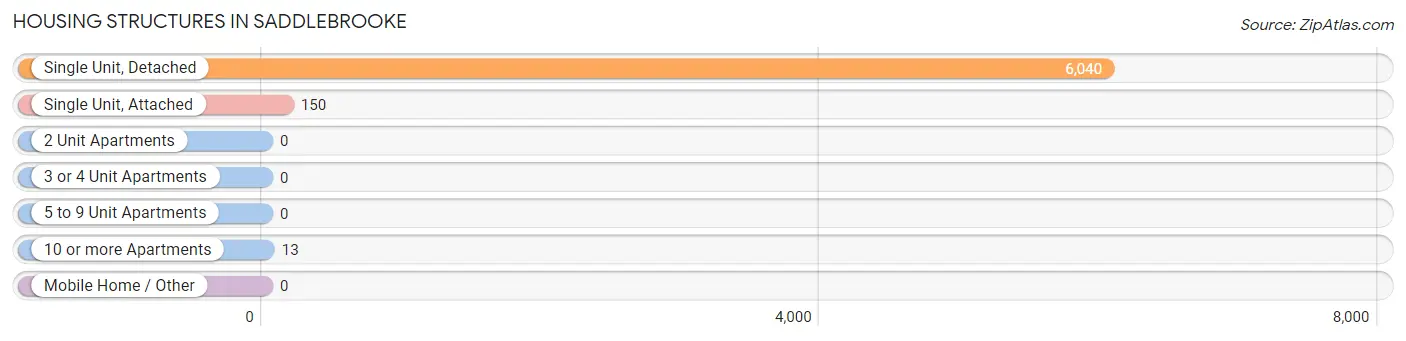
| Structure Type | # Housing Units | % Housing Units |
| Single Unit, Detached | 6,040 | 97.4% |
| Single Unit, Attached | 150 | 2.4% |
| 2 Unit Apartments | 0 | 0.0% |
| 3 or 4 Unit Apartments | 0 | 0.0% |
| 5 to 9 Unit Apartments | 0 | 0.0% |
| 10 or more Apartments | 13 | 0.2% |
| Mobile Home / Other | 0 | 0.0% |
| Total | 6,203 | 100.0% |
Housing Structures by Occupancy in Saddlebrooke
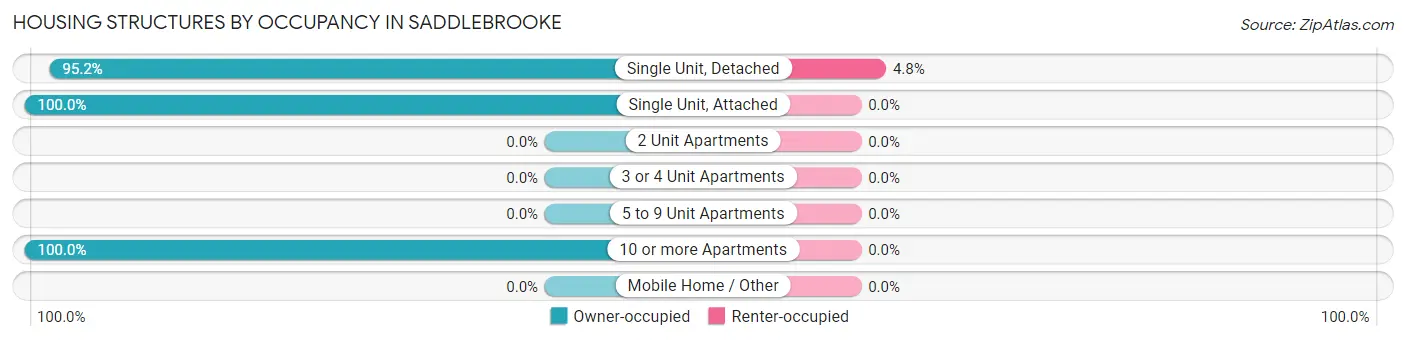
| Structure Type | Owner-occupied | Renter-occupied |
| Single Unit, Detached | 5,751 (95.2%) | 289 (4.8%) |
| Single Unit, Attached | 150 (100.0%) | 0 (0.0%) |
| 2 Unit Apartments | 0 (0.0%) | 0 (0.0%) |
| 3 or 4 Unit Apartments | 0 (0.0%) | 0 (0.0%) |
| 5 to 9 Unit Apartments | 0 (0.0%) | 0 (0.0%) |
| 10 or more Apartments | 13 (100.0%) | 0 (0.0%) |
| Mobile Home / Other | 0 (0.0%) | 0 (0.0%) |
| Total | 5,914 (95.3%) | 289 (4.7%) |
Housing Structures by Number of Rooms in Saddlebrooke
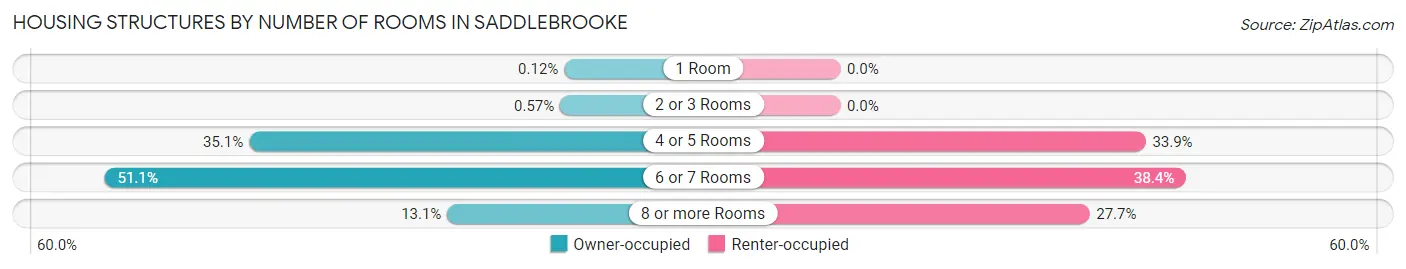
| Number of Rooms | Owner-occupied | Renter-occupied |
| 1 Room | 7 (0.1%) | 0 (0.0%) |
| 2 or 3 Rooms | 34 (0.6%) | 0 (0.0%) |
| 4 or 5 Rooms | 2,075 (35.1%) | 98 (33.9%) |
| 6 or 7 Rooms | 3,023 (51.1%) | 111 (38.4%) |
| 8 or more Rooms | 775 (13.1%) | 80 (27.7%) |
| Total | 5,914 (100.0%) | 289 (100.0%) |
Housing Structure by Heating Type in Saddlebrooke
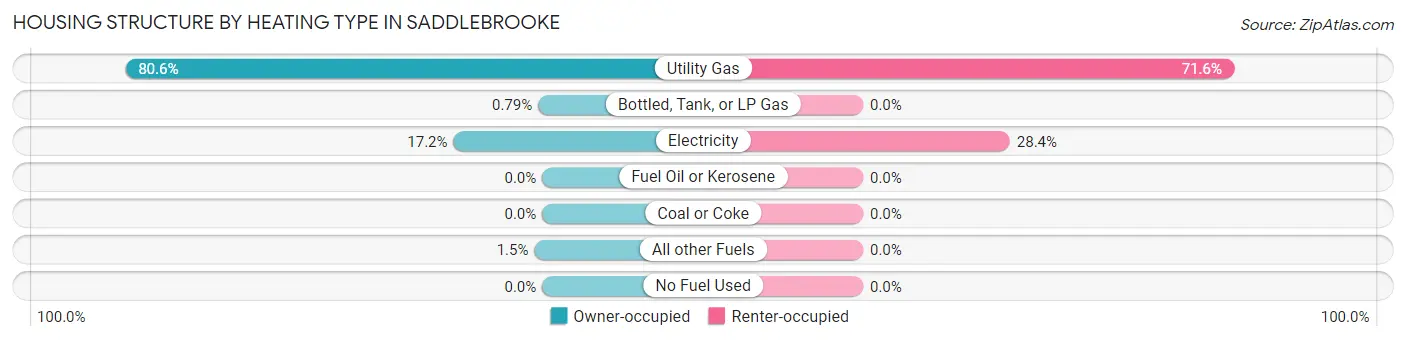
| Heating Type | Owner-occupied | Renter-occupied |
| Utility Gas | 4,764 (80.5%) | 207 (71.6%) |
| Bottled, Tank, or LP Gas | 47 (0.8%) | 0 (0.0%) |
| Electricity | 1,014 (17.2%) | 82 (28.4%) |
| Fuel Oil or Kerosene | 0 (0.0%) | 0 (0.0%) |
| Coal or Coke | 0 (0.0%) | 0 (0.0%) |
| All other Fuels | 89 (1.5%) | 0 (0.0%) |
| No Fuel Used | 0 (0.0%) | 0 (0.0%) |
| Total | 5,914 (100.0%) | 289 (100.0%) |
Household Vehicle Usage in Saddlebrooke
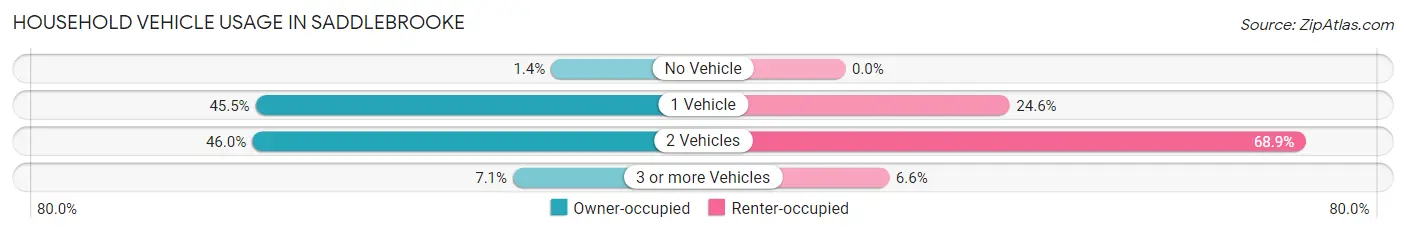
| Vehicles per Household | Owner-occupied | Renter-occupied |
| No Vehicle | 81 (1.4%) | 0 (0.0%) |
| 1 Vehicle | 2,692 (45.5%) | 71 (24.6%) |
| 2 Vehicles | 2,723 (46.0%) | 199 (68.9%) |
| 3 or more Vehicles | 418 (7.1%) | 19 (6.6%) |
| Total | 5,914 (100.0%) | 289 (100.0%) |
Real Estate & Mortgages in Saddlebrooke
Real Estate and Mortgage Overview in Saddlebrooke
| Characteristic | Without Mortgage | With Mortgage |
| Housing Units | 3,083 | 2,831 |
| Median Property Value | $451,000 | $445,700 |
| Median Household Income | $99,950 | $687 |
| Monthly Housing Costs | $596 | $275 |
| Real Estate Taxes | $3,232 | $23 |
Property Value by Mortgage Status in Saddlebrooke
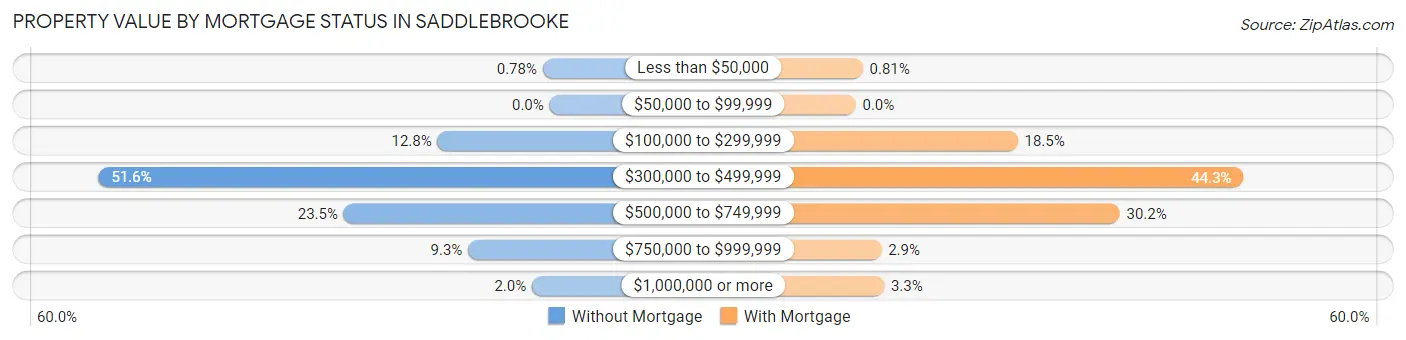
| Property Value | Without Mortgage | With Mortgage |
| Less than $50,000 | 24 (0.8%) | 23 (0.8%) |
| $50,000 to $99,999 | 0 (0.0%) | 0 (0.0%) |
| $100,000 to $299,999 | 395 (12.8%) | 524 (18.5%) |
| $300,000 to $499,999 | 1,590 (51.6%) | 1,255 (44.3%) |
| $500,000 to $749,999 | 725 (23.5%) | 854 (30.2%) |
| $750,000 to $999,999 | 287 (9.3%) | 83 (2.9%) |
| $1,000,000 or more | 62 (2.0%) | 92 (3.3%) |
| Total | 3,083 (100.0%) | 2,831 (100.0%) |
Household Income by Mortgage Status in Saddlebrooke
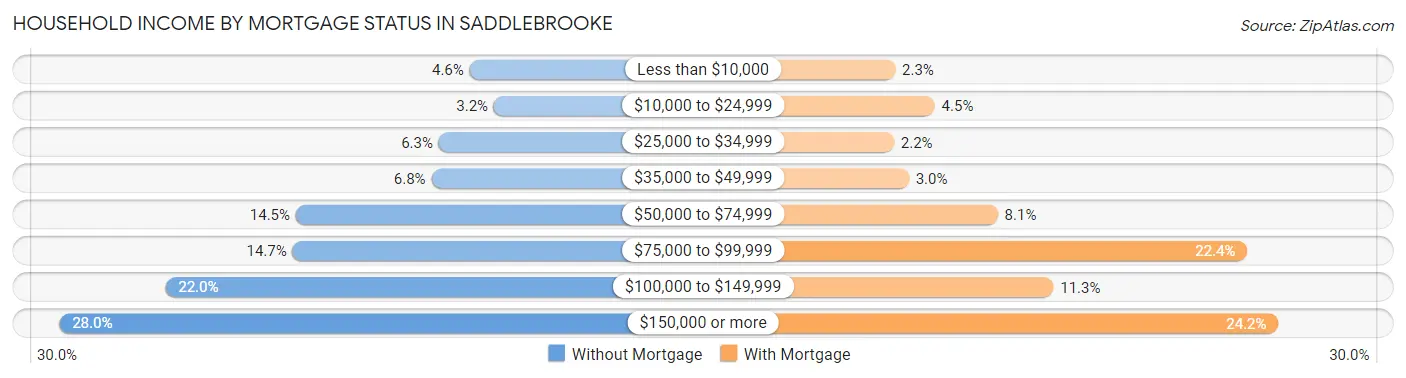
| Household Income | Without Mortgage | With Mortgage |
| Less than $10,000 | 141 (4.6%) | 64 (2.3%) |
| $10,000 to $24,999 | 98 (3.2%) | 128 (4.5%) |
| $25,000 to $34,999 | 195 (6.3%) | 62 (2.2%) |
| $35,000 to $49,999 | 208 (6.8%) | 86 (3.0%) |
| $50,000 to $74,999 | 447 (14.5%) | 230 (8.1%) |
| $75,000 to $99,999 | 453 (14.7%) | 634 (22.4%) |
| $100,000 to $149,999 | 677 (22.0%) | 320 (11.3%) |
| $150,000 or more | 864 (28.0%) | 684 (24.2%) |
| Total | 3,083 (100.0%) | 2,831 (100.0%) |
Property Value to Household Income Ratio in Saddlebrooke
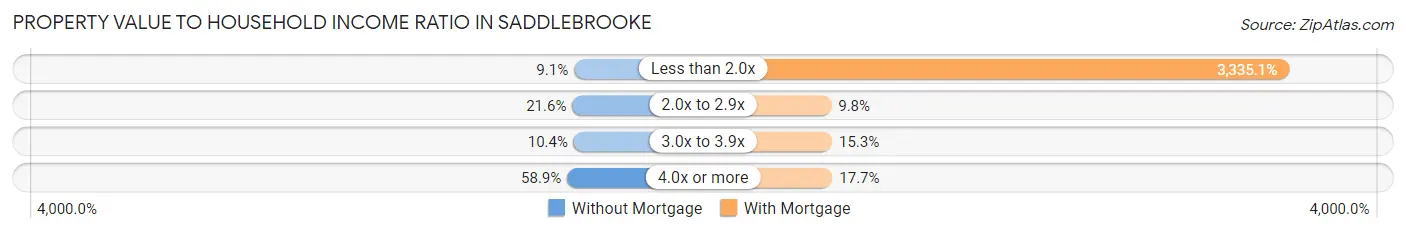
| Value-to-Income Ratio | Without Mortgage | With Mortgage |
| Less than 2.0x | 280 (9.1%) | 94,417 (3,335.1%) |
| 2.0x to 2.9x | 665 (21.6%) | 278 (9.8%) |
| 3.0x to 3.9x | 321 (10.4%) | 434 (15.3%) |
| 4.0x or more | 1,817 (58.9%) | 502 (17.7%) |
| Total | 3,083 (100.0%) | 2,831 (100.0%) |
Real Estate Taxes by Mortgage Status in Saddlebrooke
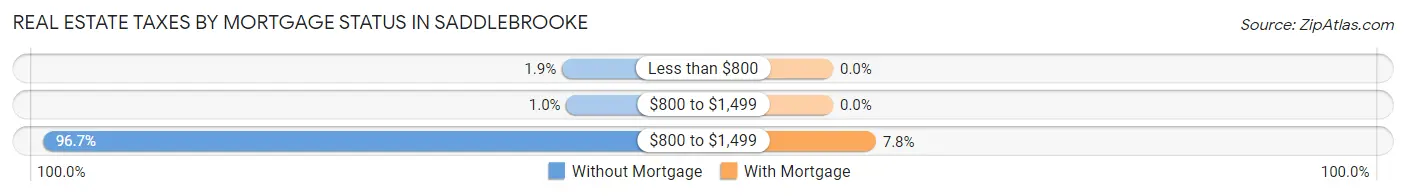
| Property Taxes | Without Mortgage | With Mortgage |
| Less than $800 | 57 (1.8%) | 0 (0.0%) |
| $800 to $1,499 | 32 (1.0%) | 0 (0.0%) |
| $800 to $1,499 | 2,981 (96.7%) | 221 (7.8%) |
| Total | 3,083 (100.0%) | 2,831 (100.0%) |
Health & Disability in Saddlebrooke
Health Insurance Coverage by Age in Saddlebrooke
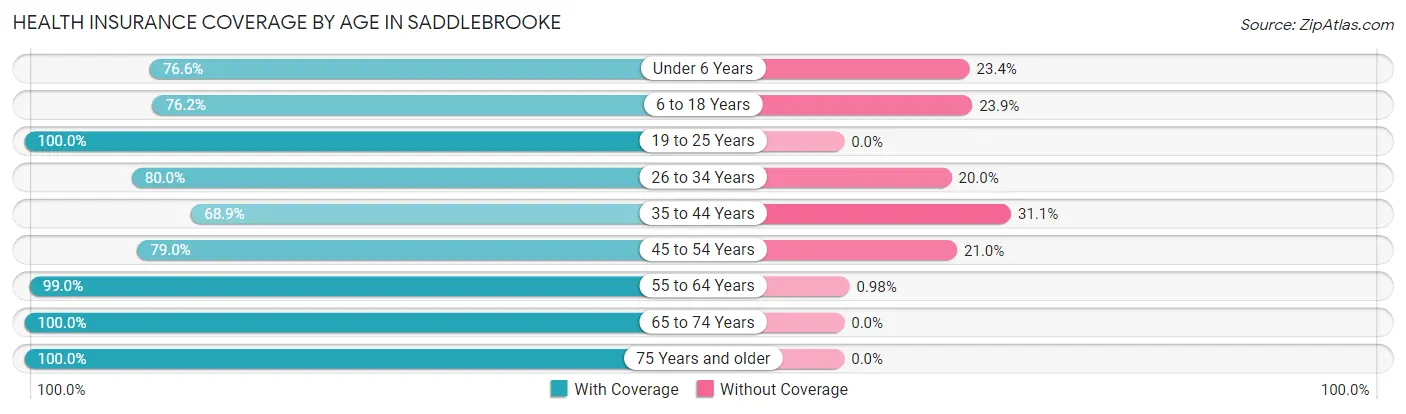
| Age Bracket | With Coverage | Without Coverage |
| Under 6 Years | 177 (76.6%) | 54 (23.4%) |
| 6 to 18 Years | 332 (76.1%) | 104 (23.8%) |
| 19 to 25 Years | 299 (100.0%) | 0 (0.0%) |
| 26 to 34 Years | 196 (80.0%) | 49 (20.0%) |
| 35 to 44 Years | 419 (68.9%) | 189 (31.1%) |
| 45 to 54 Years | 394 (79.0%) | 105 (21.0%) |
| 55 to 64 Years | 1,320 (99.0%) | 13 (1.0%) |
| 65 to 74 Years | 4,413 (100.0%) | 0 (0.0%) |
| 75 Years and older | 3,950 (100.0%) | 0 (0.0%) |
| Total | 11,500 (95.7%) | 514 (4.3%) |
Health Insurance Coverage by Citizenship Status in Saddlebrooke
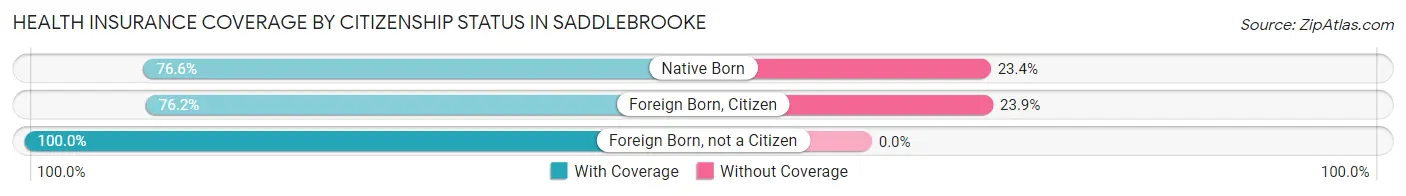
| Citizenship Status | With Coverage | Without Coverage |
| Native Born | 177 (76.6%) | 54 (23.4%) |
| Foreign Born, Citizen | 332 (76.1%) | 104 (23.8%) |
| Foreign Born, not a Citizen | 299 (100.0%) | 0 (0.0%) |
Health Insurance Coverage by Household Income in Saddlebrooke
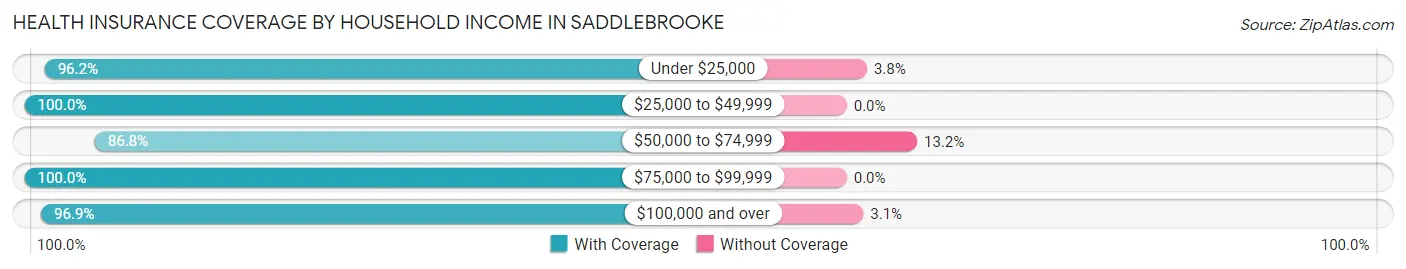
| Household Income | With Coverage | Without Coverage |
| Under $25,000 | 637 (96.2%) | 25 (3.8%) |
| $25,000 to $49,999 | 1,144 (100.0%) | 0 (0.0%) |
| $50,000 to $74,999 | 1,932 (86.8%) | 293 (13.2%) |
| $75,000 to $99,999 | 1,658 (100.0%) | 0 (0.0%) |
| $100,000 and over | 6,129 (96.9%) | 196 (3.1%) |
Public vs Private Health Insurance Coverage by Age in Saddlebrooke
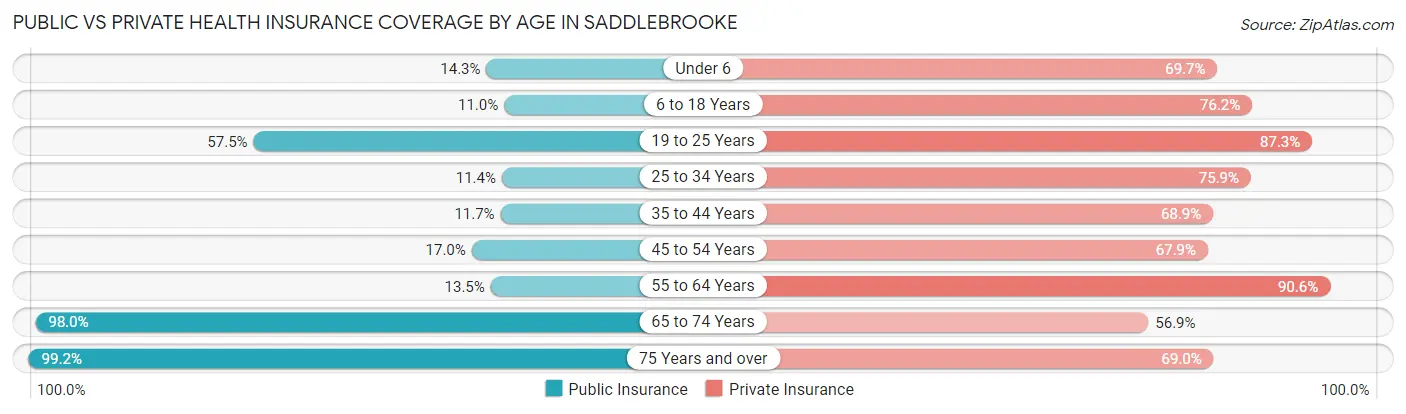
| Age Bracket | Public Insurance | Private Insurance |
| Under 6 | 33 (14.3%) | 161 (69.7%) |
| 6 to 18 Years | 48 (11.0%) | 332 (76.1%) |
| 19 to 25 Years | 172 (57.5%) | 261 (87.3%) |
| 25 to 34 Years | 28 (11.4%) | 186 (75.9%) |
| 35 to 44 Years | 71 (11.7%) | 419 (68.9%) |
| 45 to 54 Years | 85 (17.0%) | 339 (67.9%) |
| 55 to 64 Years | 180 (13.5%) | 1,208 (90.6%) |
| 65 to 74 Years | 4,325 (98.0%) | 2,511 (56.9%) |
| 75 Years and over | 3,920 (99.2%) | 2,726 (69.0%) |
| Total | 8,862 (73.8%) | 8,143 (67.8%) |
Disability Status by Sex by Age in Saddlebrooke
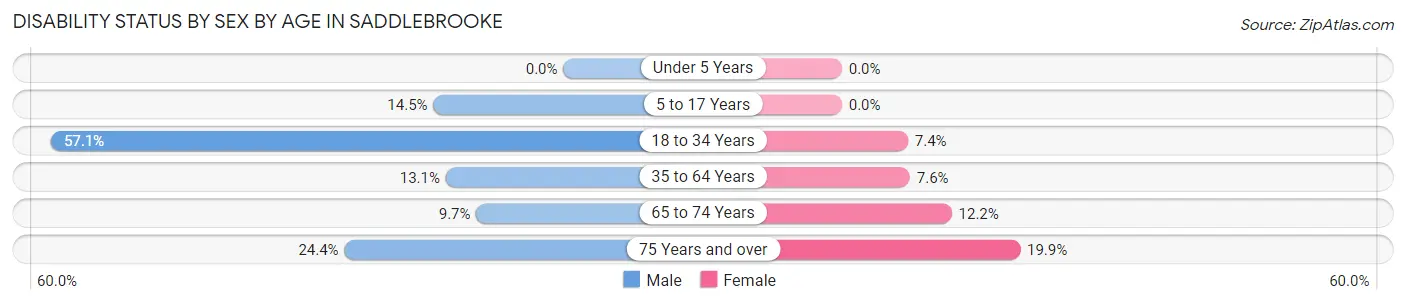
| Age Bracket | Male | Female |
| Under 5 Years | 0 (0.0%) | 0 (0.0%) |
| 5 to 17 Years | 33 (14.5%) | 0 (0.0%) |
| 18 to 34 Years | 186 (57.1%) | 19 (7.4%) |
| 35 to 64 Years | 145 (13.1%) | 101 (7.6%) |
| 65 to 74 Years | 193 (9.7%) | 296 (12.2%) |
| 75 Years and over | 527 (24.4%) | 355 (19.9%) |
Disability Class by Sex by Age in Saddlebrooke
Disability Class: Hearing Difficulty
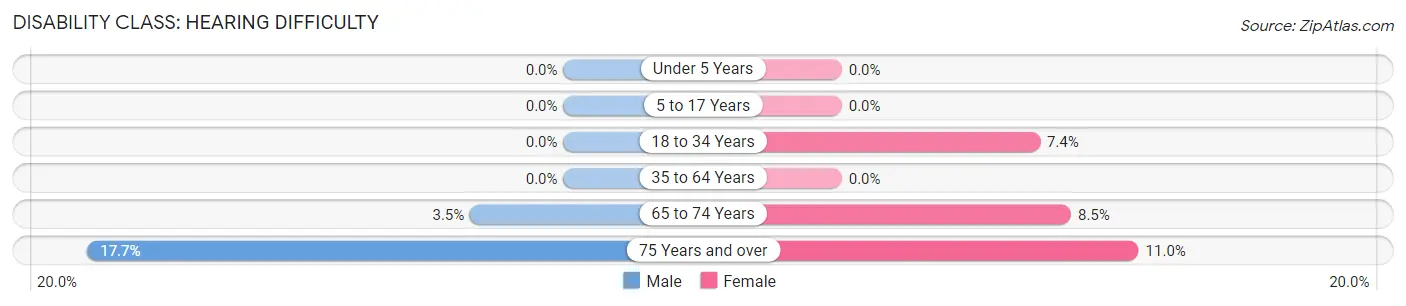
| Age Bracket | Male | Female |
| Under 5 Years | 0 (0.0%) | 0 (0.0%) |
| 5 to 17 Years | 0 (0.0%) | 0 (0.0%) |
| 18 to 34 Years | 0 (0.0%) | 19 (7.4%) |
| 35 to 64 Years | 0 (0.0%) | 0 (0.0%) |
| 65 to 74 Years | 69 (3.5%) | 206 (8.5%) |
| 75 Years and over | 382 (17.7%) | 197 (11.0%) |
Disability Class: Vision Difficulty
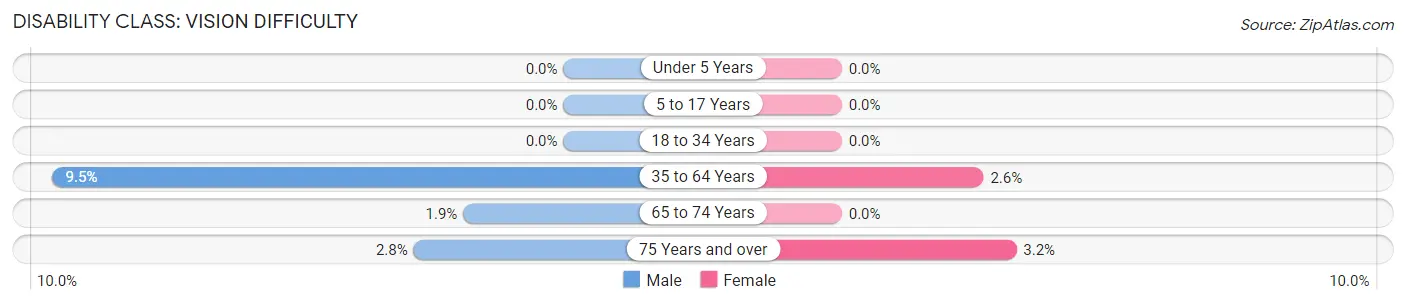
| Age Bracket | Male | Female |
| Under 5 Years | 0 (0.0%) | 0 (0.0%) |
| 5 to 17 Years | 0 (0.0%) | 0 (0.0%) |
| 18 to 34 Years | 0 (0.0%) | 0 (0.0%) |
| 35 to 64 Years | 105 (9.5%) | 35 (2.6%) |
| 65 to 74 Years | 37 (1.9%) | 0 (0.0%) |
| 75 Years and over | 60 (2.8%) | 58 (3.2%) |
Disability Class: Cognitive Difficulty
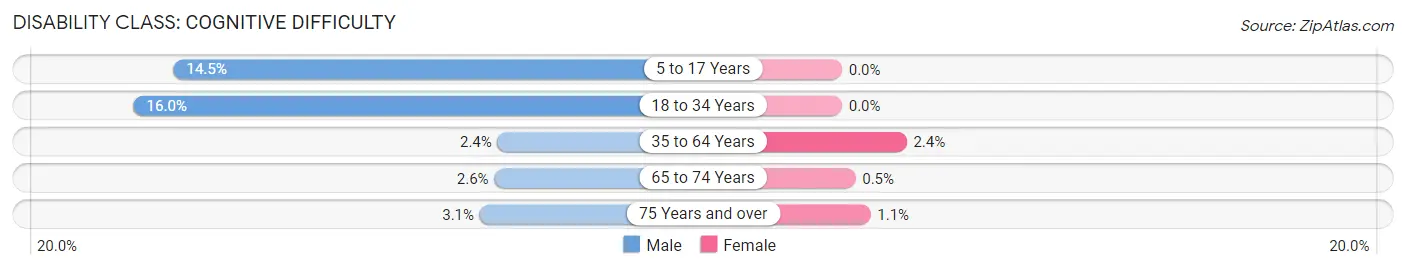
| Age Bracket | Male | Female |
| 5 to 17 Years | 33 (14.5%) | 0 (0.0%) |
| 18 to 34 Years | 52 (16.0%) | 0 (0.0%) |
| 35 to 64 Years | 27 (2.4%) | 32 (2.4%) |
| 65 to 74 Years | 51 (2.6%) | 12 (0.5%) |
| 75 Years and over | 67 (3.1%) | 19 (1.1%) |
Disability Class: Ambulatory Difficulty
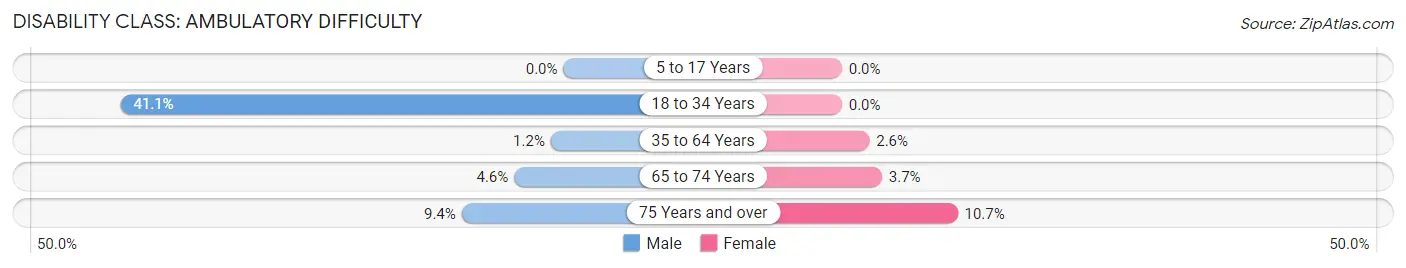
| Age Bracket | Male | Female |
| 5 to 17 Years | 0 (0.0%) | 0 (0.0%) |
| 18 to 34 Years | 134 (41.1%) | 0 (0.0%) |
| 35 to 64 Years | 13 (1.2%) | 34 (2.5%) |
| 65 to 74 Years | 91 (4.6%) | 90 (3.7%) |
| 75 Years and over | 204 (9.4%) | 192 (10.7%) |
Disability Class: Self-Care Difficulty
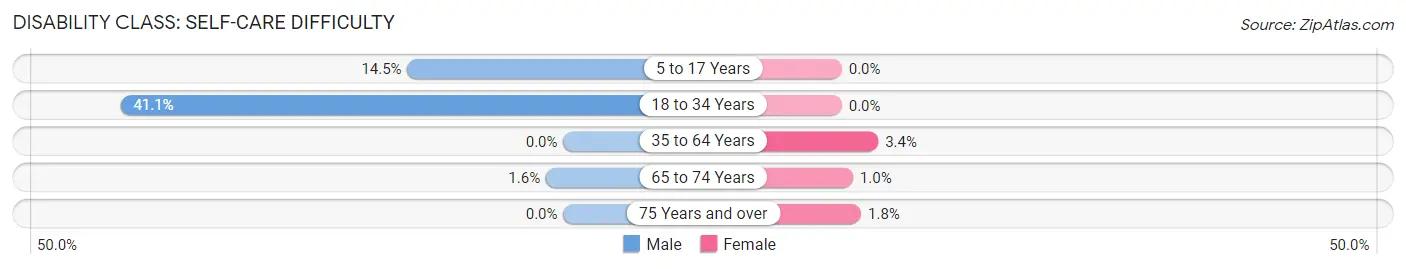
| Age Bracket | Male | Female |
| 5 to 17 Years | 33 (14.5%) | 0 (0.0%) |
| 18 to 34 Years | 134 (41.1%) | 0 (0.0%) |
| 35 to 64 Years | 0 (0.0%) | 45 (3.4%) |
| 65 to 74 Years | 32 (1.6%) | 25 (1.0%) |
| 75 Years and over | 0 (0.0%) | 32 (1.8%) |
Technology Access in Saddlebrooke
Computing Device Access in Saddlebrooke
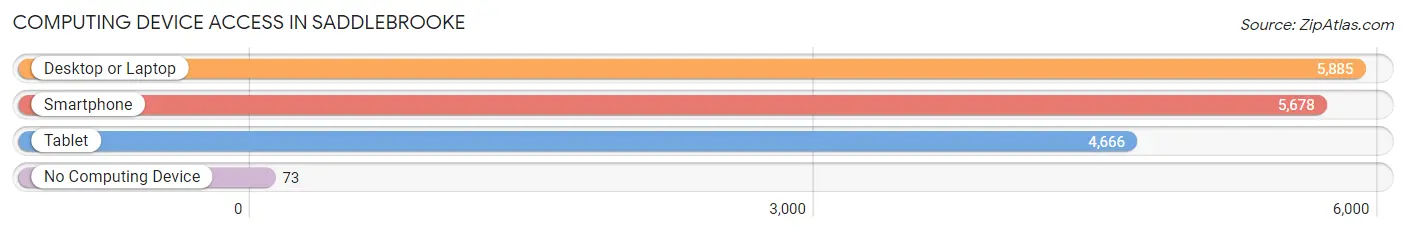
| Device Type | # Households | % Households |
| Desktop or Laptop | 5,885 | 94.9% |
| Smartphone | 5,678 | 91.5% |
| Tablet | 4,666 | 75.2% |
| No Computing Device | 73 | 1.2% |
| Total | 6,203 | 100.0% |
Internet Access in Saddlebrooke
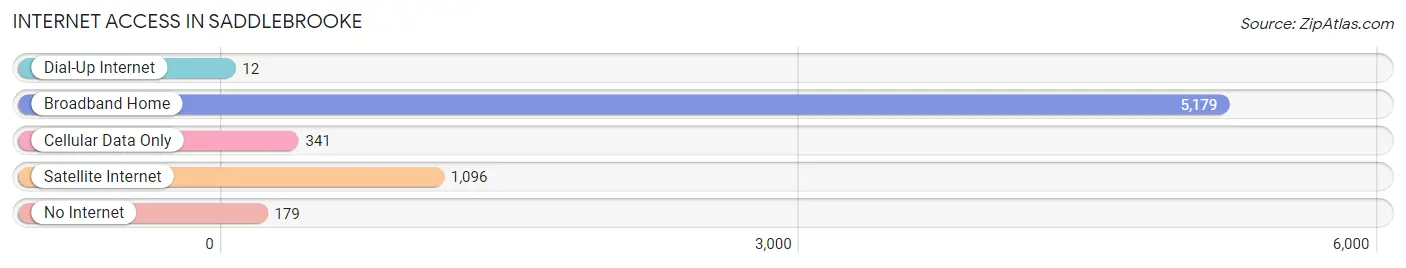
| Internet Type | # Households | % Households |
| Dial-Up Internet | 12 | 0.2% |
| Broadband Home | 5,179 | 83.5% |
| Cellular Data Only | 341 | 5.5% |
| Satellite Internet | 1,096 | 17.7% |
| No Internet | 179 | 2.9% |
| Total | 6,203 | 100.0% |
Saddlebrooke Summary
Saddlebrooke is an unincorporated community located in Pinal County, Arizona. It is situated in the foothills of the Santa Catalina Mountains, approximately 25 miles north of Tucson. The community is a retirement community, with a population of approximately 8,000 people.
History
Saddlebrooke was founded in 1987 by the Robson Communities, a real estate development company. The community was designed to be a retirement community, and was marketed as such. The community was designed to be a self-contained community, with its own shopping, dining, and recreational facilities. The community was designed to be a safe and secure place for retirees to live.
Geography
Saddlebrooke is located in the foothills of the Santa Catalina Mountains, approximately 25 miles north of Tucson. The community is situated at an elevation of 2,400 feet, and is surrounded by desert and mountain terrain. The climate in Saddlebrooke is arid, with hot summers and mild winters. The average annual temperature is 73 degrees Fahrenheit.
Economy
Saddlebrooke is a retirement community, and the majority of the population is retired. The community is home to a variety of businesses, including restaurants, retail stores, and medical facilities. The community also has a golf course, and a variety of recreational activities.
Demographics
As of the 2010 census, the population of Saddlebrooke was 8,000. The median age of the population was 72. The racial makeup of the community was 94.3% White, 1.2% African American, 0.7% Native American, 0.7% Asian, 0.2% Pacific Islander, and 2.1% from other races. The median household income was $50,000, and the median home value was $250,000.
Saddlebrooke is a retirement community, and the majority of the population is retired. The community is home to a variety of businesses, and is a safe and secure place for retirees to live. The community is situated in the foothills of the Santa Catalina Mountains, and has a variety of recreational activities. The population is diverse, and the median household income is above the national average. Saddlebrooke is a great place for retirees to live and enjoy their retirement.
Common Questions
What is Per Capita Income in Saddlebrooke?
Per Capita income in Saddlebrooke is $60,376.
What is the Median Family Income in Saddlebrooke?
Median Family Income in Saddlebrooke is $116,819.
What is the Median Household income in Saddlebrooke?
Median Household Income in Saddlebrooke is $95,313.
What is Income or Wage Gap in Saddlebrooke?
Income or Wage Gap in Saddlebrooke is 61.2%.
Women in Saddlebrooke earn 38.8 cents for every dollar earned by a man.
What is Inequality or Gini Index in Saddlebrooke?
Inequality or Gini Index in Saddlebrooke is 0.40.
What is the Total Population of Saddlebrooke?
Total Population of Saddlebrooke is 12,014.
What is the Total Male Population of Saddlebrooke?
Total Male Population of Saddlebrooke is 5,936.
What is the Total Female Population of Saddlebrooke?
Total Female Population of Saddlebrooke is 6,078.
What is the Ratio of Males per 100 Females in Saddlebrooke?
There are 97.66 Males per 100 Females in Saddlebrooke.
What is the Ratio of Females per 100 Males in Saddlebrooke?
There are 102.39 Females per 100 Males in Saddlebrooke.
What is the Median Population Age in Saddlebrooke?
Median Population Age in Saddlebrooke is 71.1 Years.
What is the Average Family Size in Saddlebrooke
Average Family Size in Saddlebrooke is 2.2 People.
What is the Average Household Size in Saddlebrooke
Average Household Size in Saddlebrooke is 1.9 People.
How Large is the Labor Force in Saddlebrooke?
There are 2,200 People in the Labor Forcein in Saddlebrooke.
What is the Percentage of People in the Labor Force in Saddlebrooke?
19.3% of People are in the Labor Force in Saddlebrooke.
What is the Unemployment Rate in Saddlebrooke?
Unemployment Rate in Saddlebrooke is 14.7%.