Timberline-Fernwood, AZ Map & Demographics
Timberline-Fernwood Overview
$46,210
PER CAPITA INCOME
$117,955
AVG FAMILY INCOME
$120,203
AVG HOUSEHOLD INCOME
8.5%
WAGE / INCOME GAP [ % ]
91.5¢/ $1
WAGE / INCOME GAP [ $ ]
0.35
INEQUALITY / GINI INDEX
2,685
TOTAL POPULATION
1,526
MALE POPULATION
1,159
FEMALE POPULATION
131.67
MALES / 100 FEMALES
75.95
FEMALES / 100 MALES
40.5
MEDIAN AGE
3.1
AVG FAMILY SIZE
2.9
AVG HOUSEHOLD SIZE
1,529
LABOR FORCE [ PEOPLE ]
69.3%
PERCENT IN LABOR FORCE
4.2%
UNEMPLOYMENT RATE
Income in Timberline-Fernwood
Income Overview in Timberline-Fernwood
Per Capita Income in Timberline-Fernwood is $46,210, while median incomes of families and households are $117,955 and $120,203 respectively.
| Characteristic | Number | Measure |
| Per Capita Income | 2,685 | $46,210 |
| Median Family Income | 758 | $117,955 |
| Mean Family Income | 758 | $129,693 |
| Median Household Income | 928 | $120,203 |
| Mean Household Income | 928 | $133,598 |
| Income Deficit | 758 | $0 |
| Wage / Income Gap (%) | 2,685 | 8.52% |
| Wage / Income Gap ($) | 2,685 | 91.48¢ per $1 |
| Gini / Inequality Index | 2,685 | 0.35 |
Earnings by Sex in Timberline-Fernwood
Average Earnings in Timberline-Fernwood are $49,256, $53,000 for men and $48,482 for women, a difference of 8.5%.
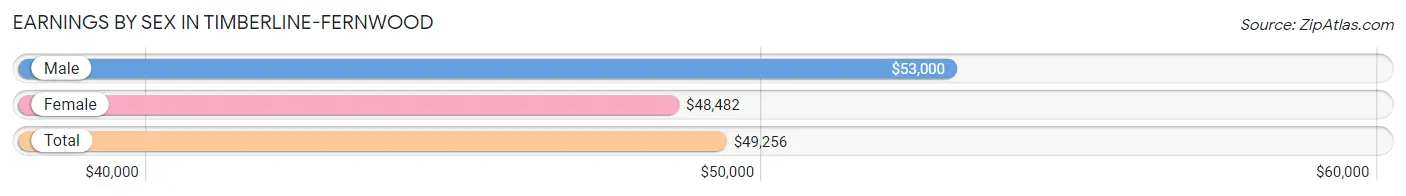
| Sex | Number | Average Earnings |
| Male | 906 (55.2%) | $53,000 |
| Female | 736 (44.8%) | $48,482 |
| Total | 1,642 (100.0%) | $49,256 |
Earnings by Sex by Income Bracket in Timberline-Fernwood
The most common earnings brackets in Timberline-Fernwood are $65,000 to $74,999 for men (169 | 18.6%) and $45,000 to $49,999 for women (125 | 17.0%).
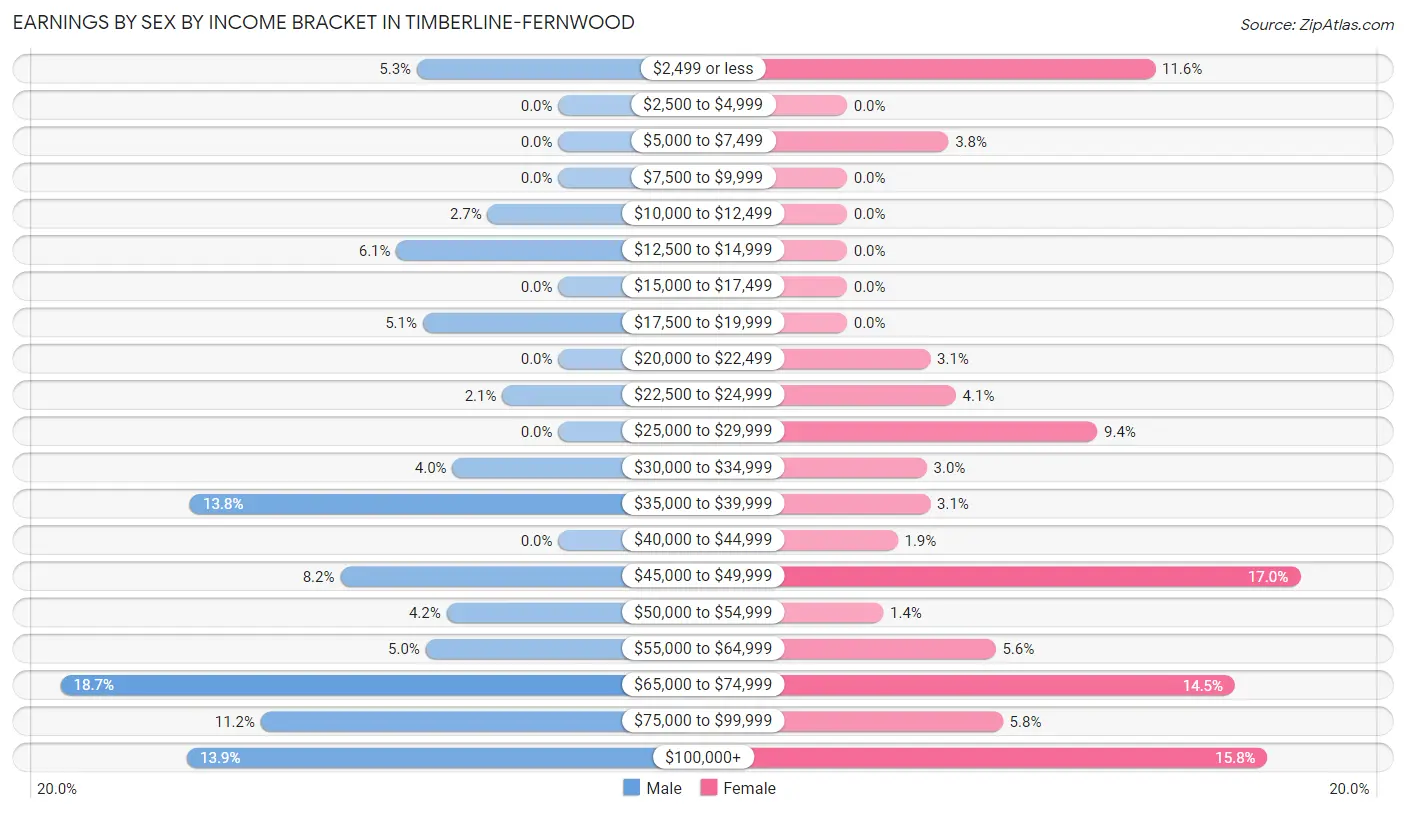
| Income | Male | Female |
| $2,499 or less | 48 (5.3%) | 85 (11.6%) |
| $2,500 to $4,999 | 0 (0.0%) | 0 (0.0%) |
| $5,000 to $7,499 | 0 (0.0%) | 28 (3.8%) |
| $7,500 to $9,999 | 0 (0.0%) | 0 (0.0%) |
| $10,000 to $12,499 | 24 (2.6%) | 0 (0.0%) |
| $12,500 to $14,999 | 55 (6.1%) | 0 (0.0%) |
| $15,000 to $17,499 | 0 (0.0%) | 0 (0.0%) |
| $17,500 to $19,999 | 46 (5.1%) | 0 (0.0%) |
| $20,000 to $22,499 | 0 (0.0%) | 23 (3.1%) |
| $22,500 to $24,999 | 19 (2.1%) | 30 (4.1%) |
| $25,000 to $29,999 | 0 (0.0%) | 69 (9.4%) |
| $30,000 to $34,999 | 36 (4.0%) | 22 (3.0%) |
| $35,000 to $39,999 | 125 (13.8%) | 23 (3.1%) |
| $40,000 to $44,999 | 0 (0.0%) | 14 (1.9%) |
| $45,000 to $49,999 | 74 (8.2%) | 125 (17.0%) |
| $50,000 to $54,999 | 38 (4.2%) | 10 (1.4%) |
| $55,000 to $64,999 | 45 (5.0%) | 41 (5.6%) |
| $65,000 to $74,999 | 169 (18.6%) | 107 (14.5%) |
| $75,000 to $99,999 | 101 (11.2%) | 43 (5.8%) |
| $100,000+ | 126 (13.9%) | 116 (15.8%) |
| Total | 906 (100.0%) | 736 (100.0%) |
Earnings by Sex by Educational Attainment in Timberline-Fernwood
Average earnings in Timberline-Fernwood are $66,781 for men and $49,479 for women, a difference of 25.9%. Men with an educational attainment of graduate degree enjoy the highest average annual earnings of $122,826, while those with high school diploma education earn the least with $46,013. Women with an educational attainment of high school diploma earn the most with the average annual earnings of $68,929, while those with college or associate's degree education have the smallest earnings of $42,411.
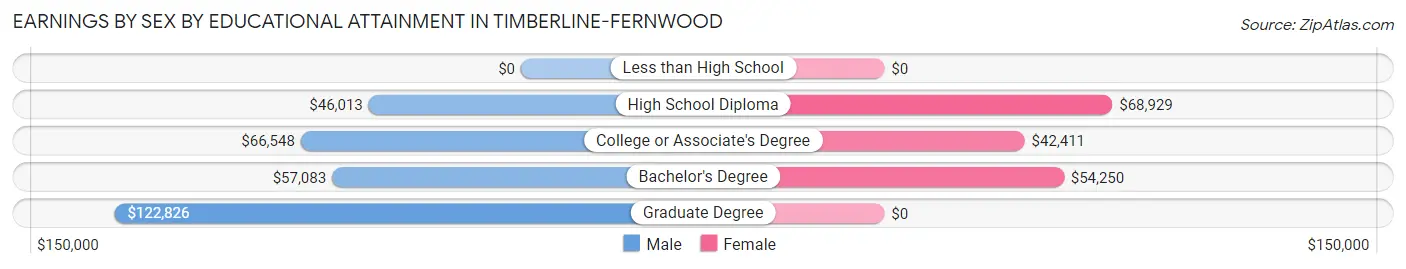
| Educational Attainment | Male Income | Female Income |
| Less than High School | - | - |
| High School Diploma | $46,013 | $68,929 |
| College or Associate's Degree | $66,548 | $42,411 |
| Bachelor's Degree | $57,083 | $54,250 |
| Graduate Degree | $122,826 | $0 |
| Total | $66,781 | $49,479 |
Family Income in Timberline-Fernwood
Family Income Brackets in Timberline-Fernwood
According to the Timberline-Fernwood family income data, there are 192 families falling into the $50,000 to $74,999 income range, which is the most common income bracket and makes up 25.3% of all families.
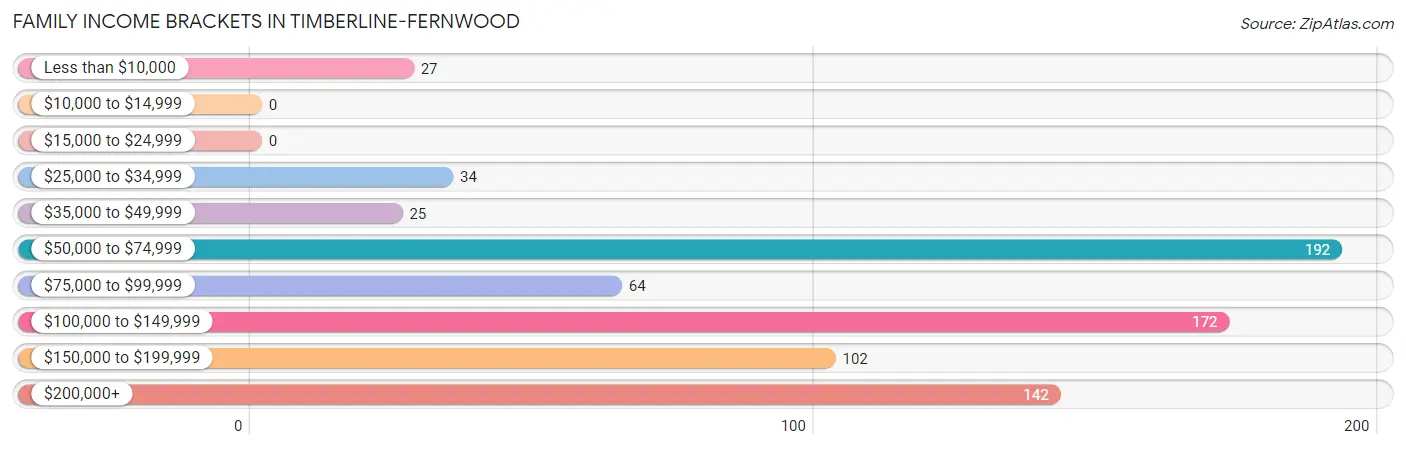
| Income Bracket | # Families | % Families |
| Less than $10,000 | 27 | 3.6% |
| $10,000 to $14,999 | 0 | 0.0% |
| $15,000 to $24,999 | 0 | 0.0% |
| $25,000 to $34,999 | 34 | 4.5% |
| $35,000 to $49,999 | 25 | 3.3% |
| $50,000 to $74,999 | 192 | 25.3% |
| $75,000 to $99,999 | 64 | 8.4% |
| $100,000 to $149,999 | 172 | 22.7% |
| $150,000 to $199,999 | 102 | 13.5% |
| $200,000+ | 142 | 18.7% |
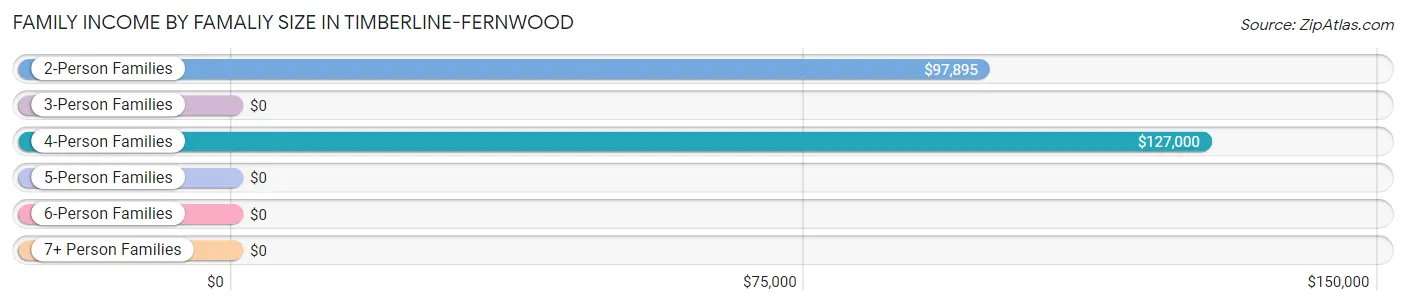
Family Income by Famaliy Size in Timberline-Fernwood
4-person families (166 | 21.9%) account for the highest median family income in Timberline-Fernwood with $127,000 per family, while 2-person families (282 | 37.2%) have the highest median income of $48,948 per family member.
| Income Bracket | # Families | Median Income |
| 2-Person Families | 282 (37.2%) | $97,895 |
| 3-Person Families | 254 (33.5%) | $0 |
| 4-Person Families | 166 (21.9%) | $127,000 |
| 5-Person Families | 16 (2.1%) | $0 |
| 6-Person Families | 40 (5.3%) | $0 |
| 7+ Person Families | 0 (0.0%) | $0 |
| Total | 758 (100.0%) | $117,955 |
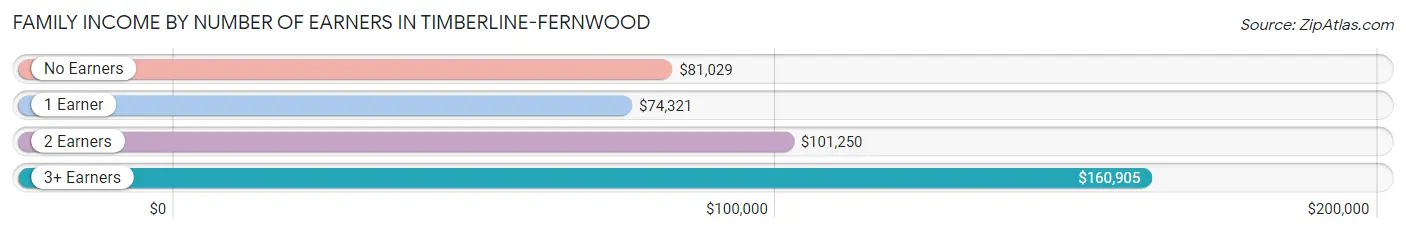
Family Income by Number of Earners in Timberline-Fernwood
The median family income in Timberline-Fernwood is $117,955, with families comprising 3+ earners (151) having the highest median family income of $160,905, while families with 1 earner (203) have the lowest median family income of $74,321, accounting for 19.9% and 26.8% of families, respectively.
| Number of Earners | # Families | Median Income |
| No Earners | 80 (10.5%) | $81,029 |
| 1 Earner | 203 (26.8%) | $74,321 |
| 2 Earners | 324 (42.7%) | $101,250 |
| 3+ Earners | 151 (19.9%) | $160,905 |
| Total | 758 (100.0%) | $117,955 |
Household Income in Timberline-Fernwood
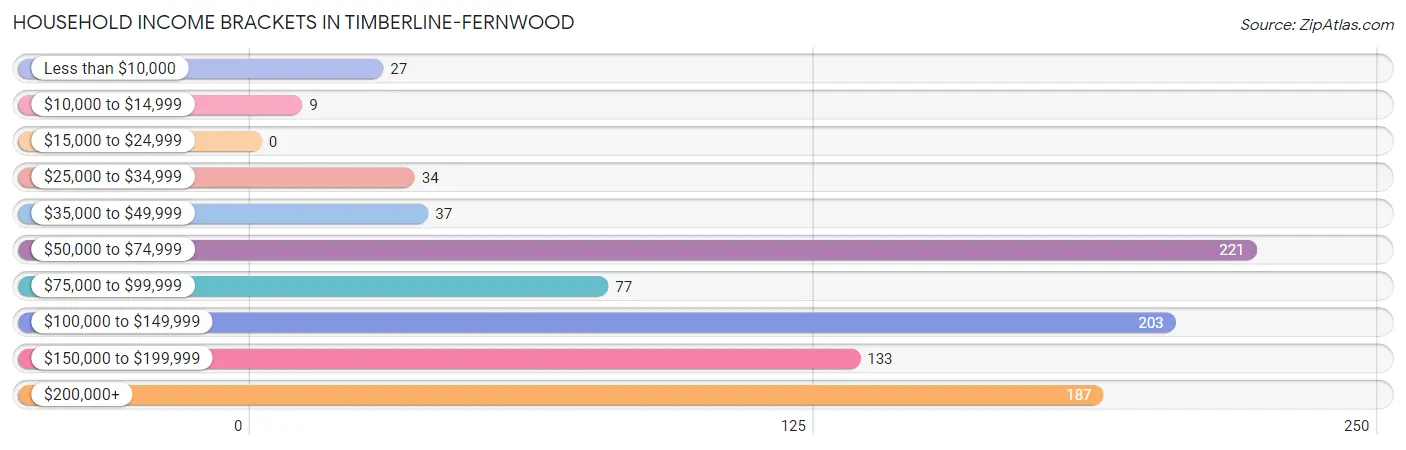
Household Income Brackets in Timberline-Fernwood
With 221 households falling in the category, the $50,000 to $74,999 income range is the most frequent in Timberline-Fernwood, accounting for 23.8% of all households.
| Income Bracket | # Households | % Households |
| Less than $10,000 | 27 | 2.9% |
| $10,000 to $14,999 | 9 | 1.0% |
| $15,000 to $24,999 | 0 | 0.0% |
| $25,000 to $34,999 | 34 | 3.7% |
| $35,000 to $49,999 | 37 | 4.0% |
| $50,000 to $74,999 | 221 | 23.8% |
| $75,000 to $99,999 | 77 | 8.3% |
| $100,000 to $149,999 | 203 | 21.9% |
| $150,000 to $199,999 | 133 | 14.3% |
| $200,000+ | 187 | 20.2% |
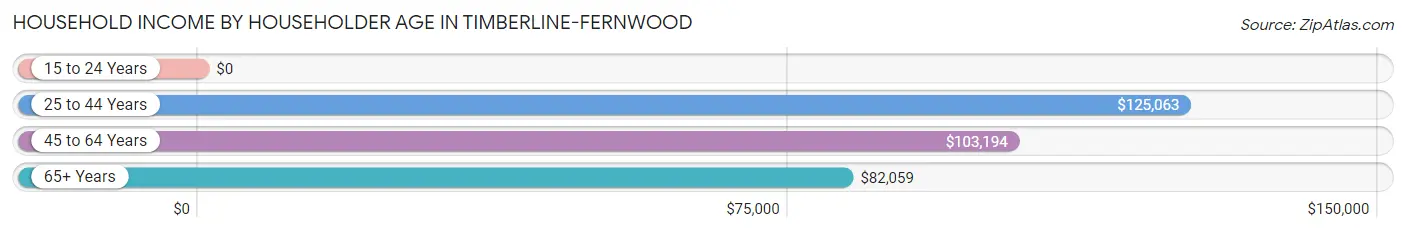
Household Income by Householder Age in Timberline-Fernwood
The median household income in Timberline-Fernwood is $120,203, with the highest median household income of $125,063 found in the 25 to 44 years age bracket for the primary householder. A total of 263 households (28.3%) fall into this category. Meanwhile, the 15 to 24 years age bracket for the primary householder has the lowest median household income of $0, with 16 households (1.7%) in this group.
| Income Bracket | # Households | Median Income |
| 15 to 24 Years | 16 (1.7%) | $0 |
| 25 to 44 Years | 263 (28.3%) | $125,063 |
| 45 to 64 Years | 447 (48.2%) | $103,194 |
| 65+ Years | 202 (21.8%) | $82,059 |
| Total | 928 (100.0%) | $120,203 |
Poverty in Timberline-Fernwood
Income Below Poverty by Sex and Age in Timberline-Fernwood
With 3.3% poverty level for males and 2.2% for females among the residents of Timberline-Fernwood, 75 year old and over males and 55 to 64 year old females are the most vulnerable to poverty, with 12 males (18.2%) and 15 females (7.0%) in their respective age groups living below the poverty level.
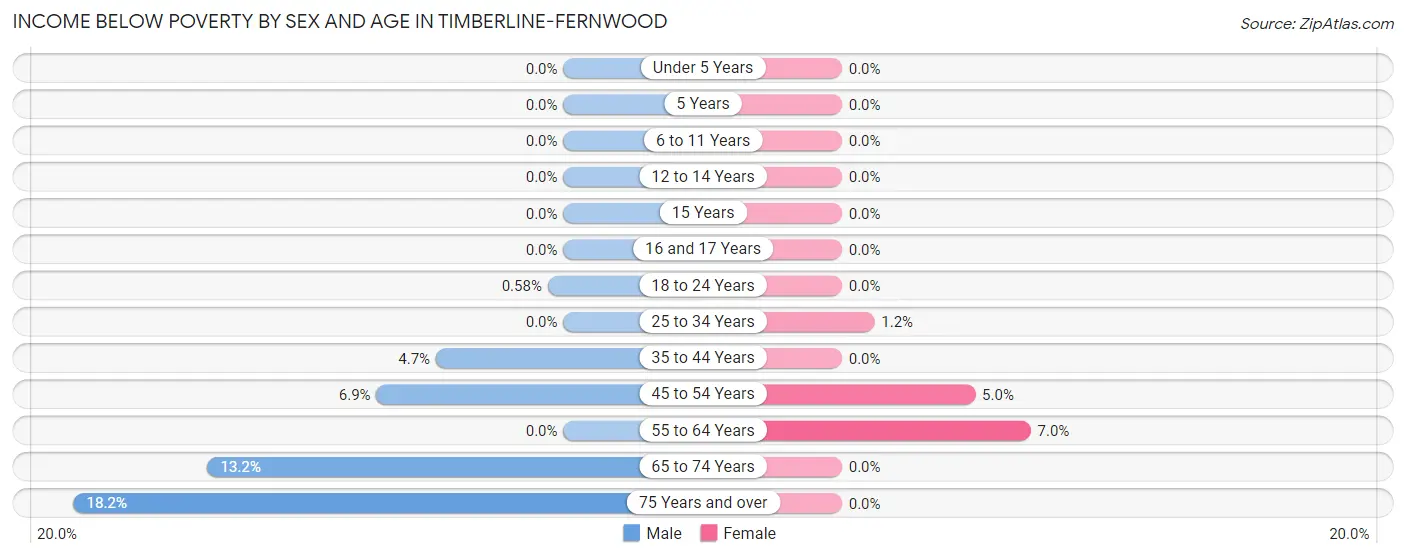
| Age Bracket | Male | Female |
| Under 5 Years | 0 (0.0%) | 0 (0.0%) |
| 5 Years | 0 (0.0%) | 0 (0.0%) |
| 6 to 11 Years | 0 (0.0%) | 0 (0.0%) |
| 12 to 14 Years | 0 (0.0%) | 0 (0.0%) |
| 15 Years | 0 (0.0%) | 0 (0.0%) |
| 16 and 17 Years | 0 (0.0%) | 0 (0.0%) |
| 18 to 24 Years | 1 (0.6%) | 0 (0.0%) |
| 25 to 34 Years | 0 (0.0%) | 2 (1.2%) |
| 35 to 44 Years | 8 (4.7%) | 0 (0.0%) |
| 45 to 54 Years | 15 (6.9%) | 9 (5.0%) |
| 55 to 64 Years | 0 (0.0%) | 15 (7.0%) |
| 65 to 74 Years | 14 (13.2%) | 0 (0.0%) |
| 75 Years and over | 12 (18.2%) | 0 (0.0%) |
| Total | 50 (3.3%) | 26 (2.2%) |
Income Above Poverty by Sex and Age in Timberline-Fernwood
According to the poverty statistics in Timberline-Fernwood, males aged under 5 years and females aged under 5 years are the age groups that are most secure financially, with 100.0% of males and 100.0% of females in these age groups living above the poverty line.
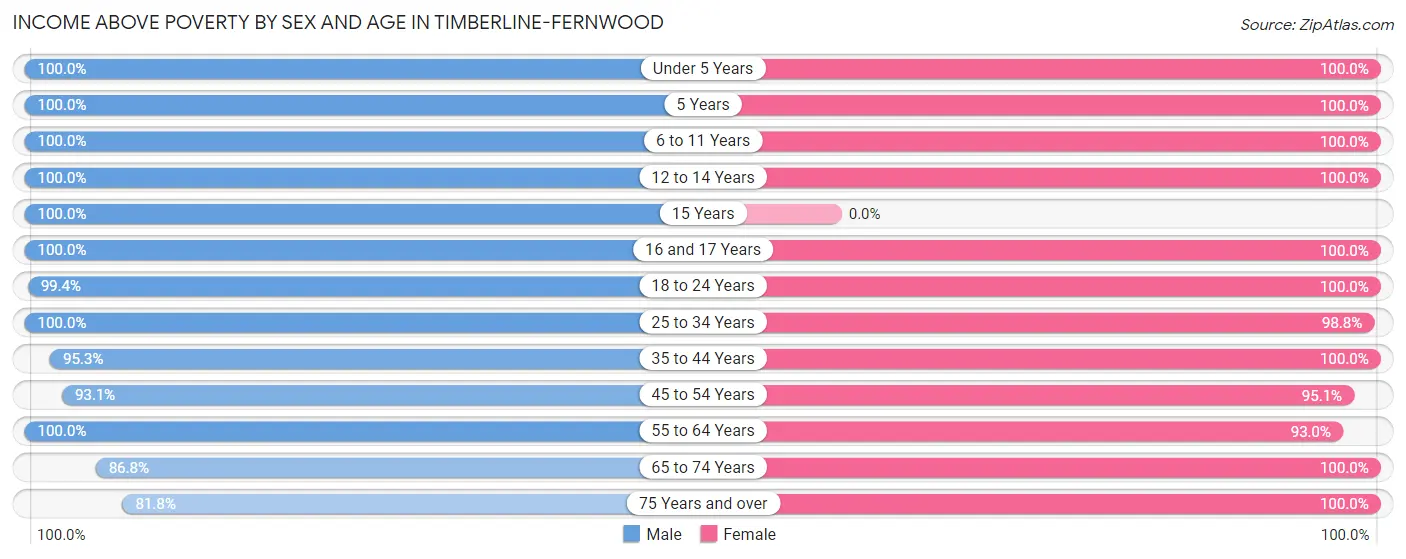
| Age Bracket | Male | Female |
| Under 5 Years | 115 (100.0%) | 58 (100.0%) |
| 5 Years | 29 (100.0%) | 3 (100.0%) |
| 6 to 11 Years | 33 (100.0%) | 95 (100.0%) |
| 12 to 14 Years | 57 (100.0%) | 47 (100.0%) |
| 15 Years | 40 (100.0%) | 0 (0.0%) |
| 16 and 17 Years | 42 (100.0%) | 32 (100.0%) |
| 18 to 24 Years | 171 (99.4%) | 67 (100.0%) |
| 25 to 34 Years | 223 (100.0%) | 163 (98.8%) |
| 35 to 44 Years | 161 (95.3%) | 174 (100.0%) |
| 45 to 54 Years | 201 (93.1%) | 173 (95.1%) |
| 55 to 64 Years | 255 (100.0%) | 199 (93.0%) |
| 65 to 74 Years | 92 (86.8%) | 100 (100.0%) |
| 75 Years and over | 54 (81.8%) | 22 (100.0%) |
| Total | 1,473 (96.7%) | 1,133 (97.8%) |
Income Below Poverty Among Married-Couple Families in Timberline-Fernwood
The poverty statistics for married-couple families in Timberline-Fernwood show that 2.2% or 15 of the total 687 families live below the poverty line. Families with no children have the highest poverty rate of 3.3%, comprising of 15 families. On the other hand, families with 1 or 2 children have the lowest poverty rate of 0.0%, which includes 0 families.
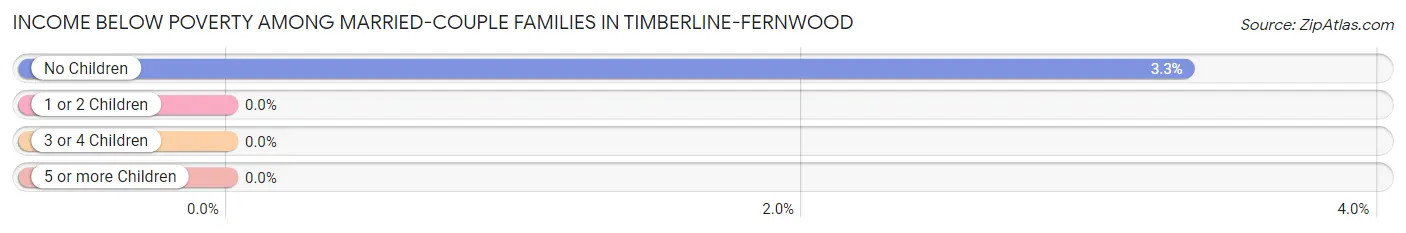
| Children | Above Poverty | Below Poverty |
| No Children | 436 (96.7%) | 15 (3.3%) |
| 1 or 2 Children | 180 (100.0%) | 0 (0.0%) |
| 3 or 4 Children | 56 (100.0%) | 0 (0.0%) |
| 5 or more Children | 0 (0.0%) | 0 (0.0%) |
| Total | 672 (97.8%) | 15 (2.2%) |
Income Below Poverty Among Single-Parent Households in Timberline-Fernwood
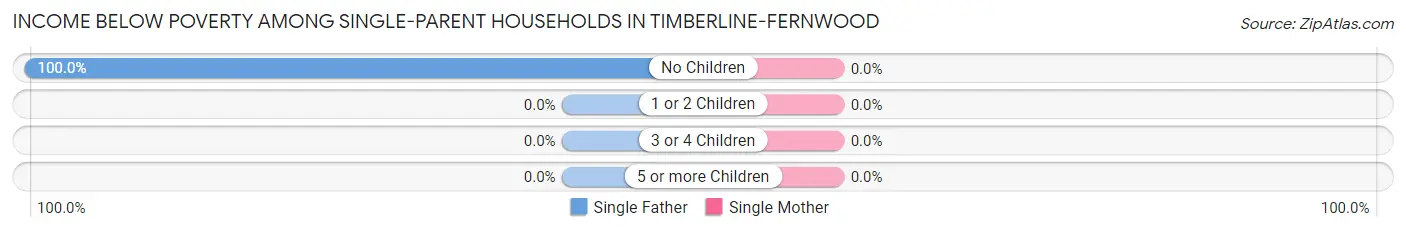
| Children | Single Father | Single Mother |
| No Children | 12 (100.0%) | 0 (0.0%) |
| 1 or 2 Children | 0 (0.0%) | 0 (0.0%) |
| 3 or 4 Children | 0 (0.0%) | 0 (0.0%) |
| 5 or more Children | 0 (0.0%) | 0 (0.0%) |
| Total | 12 (26.1%) | 0 (0.0%) |
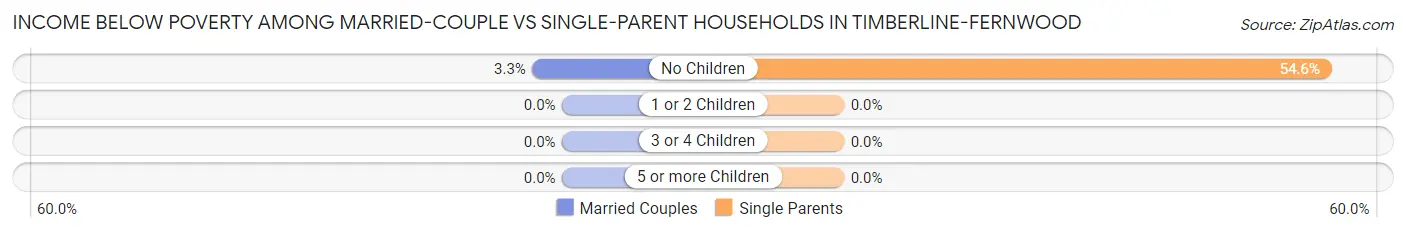
Income Below Poverty Among Married-Couple vs Single-Parent Households in Timberline-Fernwood
The poverty data for Timberline-Fernwood shows that 15 of the married-couple family households (2.2%) and 12 of the single-parent households (16.9%) are living below the poverty level. Within the married-couple family households, those with no children have the highest poverty rate, with 15 households (3.3%) falling below the poverty line. Among the single-parent households, those with no children have the highest poverty rate, with 12 household (54.5%) living below poverty.
| Children | Married-Couple Families | Single-Parent Households |
| No Children | 15 (3.3%) | 12 (54.5%) |
| 1 or 2 Children | 0 (0.0%) | 0 (0.0%) |
| 3 or 4 Children | 0 (0.0%) | 0 (0.0%) |
| 5 or more Children | 0 (0.0%) | 0 (0.0%) |
| Total | 15 (2.2%) | 12 (16.9%) |
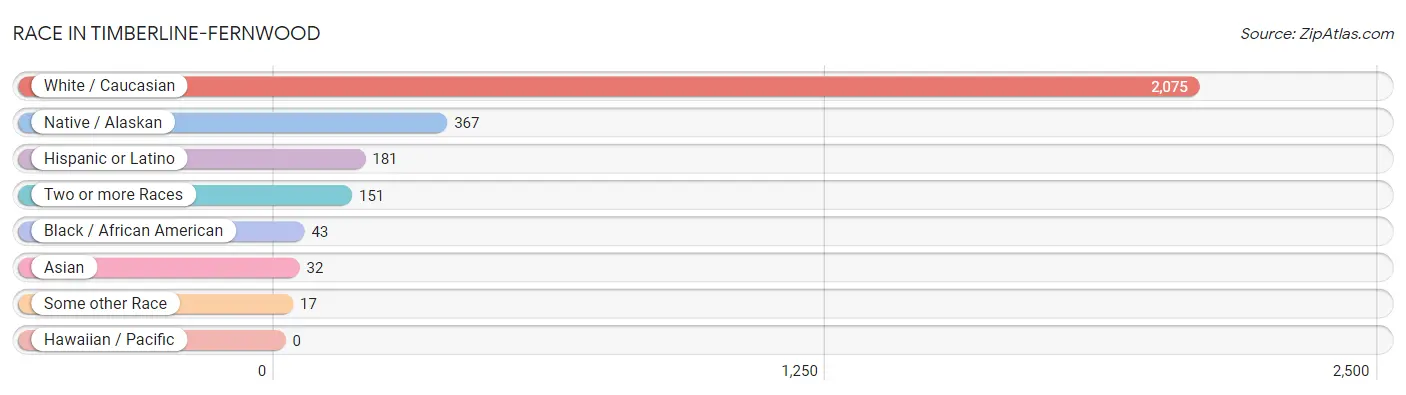
Race in Timberline-Fernwood
The most populous races in Timberline-Fernwood are White / Caucasian (2,075 | 77.3%), Native / Alaskan (367 | 13.7%), and Hispanic or Latino (181 | 6.7%).
| Race | # Population | % Population |
| Asian | 32 | 1.2% |
| Black / African American | 43 | 1.6% |
| Hawaiian / Pacific | 0 | 0.0% |
| Hispanic or Latino | 181 | 6.7% |
| Native / Alaskan | 367 | 13.7% |
| White / Caucasian | 2,075 | 77.3% |
| Two or more Races | 151 | 5.6% |
| Some other Race | 17 | 0.6% |
| Total | 2,685 | 100.0% |
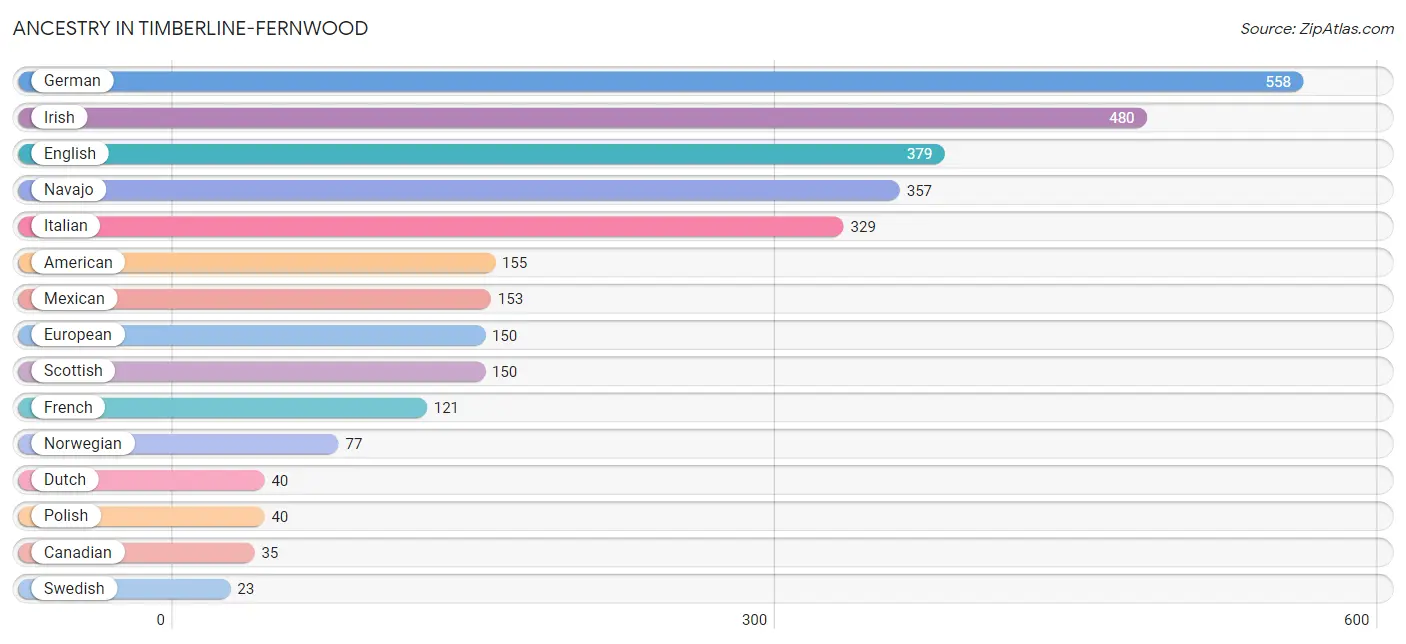
Ancestry in Timberline-Fernwood
The most populous ancestries reported in Timberline-Fernwood are German (558 | 20.8%), Irish (480 | 17.9%), English (379 | 14.1%), Navajo (357 | 13.3%), and Italian (329 | 12.2%), together accounting for 78.3% of all Timberline-Fernwood residents.
| Ancestry | # Population | % Population |
| American | 155 | 5.8% |
| Apache | 21 | 0.8% |
| Canadian | 35 | 1.3% |
| Cherokee | 9 | 0.3% |
| Cree | 12 | 0.4% |
| Czechoslovakian | 21 | 0.8% |
| Dutch | 40 | 1.5% |
| English | 379 | 14.1% |
| European | 150 | 5.6% |
| French | 121 | 4.5% |
| French Canadian | 11 | 0.4% |
| German | 558 | 20.8% |
| Hopi | 22 | 0.8% |
| Irish | 480 | 17.9% |
| Italian | 329 | 12.2% |
| Mexican | 153 | 5.7% |
| Navajo | 357 | 13.3% |
| Norwegian | 77 | 2.9% |
| Polish | 40 | 1.5% |
| Romanian | 7 | 0.3% |
| Scotch-Irish | 19 | 0.7% |
| Scottish | 150 | 5.6% |
| Slavic | 9 | 0.3% |
| Swedish | 23 | 0.9% | View All 24 Rows |
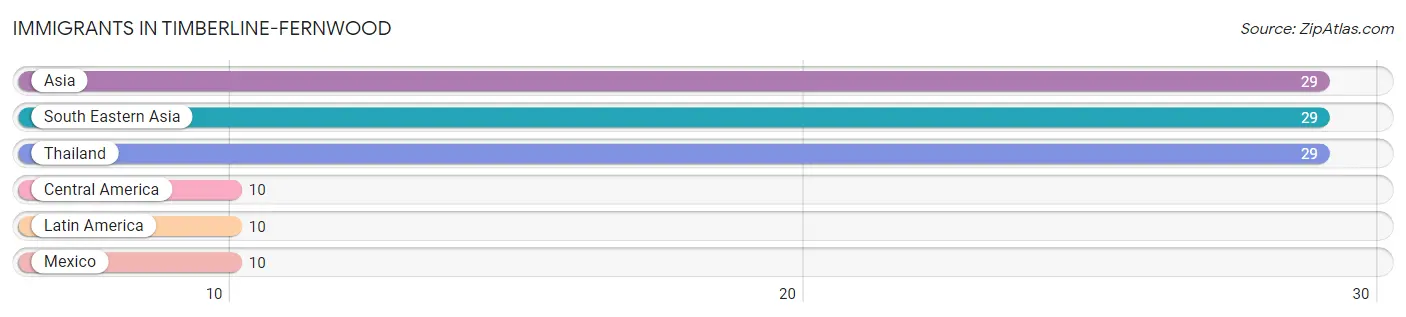
Immigrants in Timberline-Fernwood
The most numerous immigrant groups reported in Timberline-Fernwood came from Asia (29 | 1.1%), South Eastern Asia (29 | 1.1%), Thailand (29 | 1.1%), Central America (10 | 0.4%), and Latin America (10 | 0.4%), together accounting for 4.0% of all Timberline-Fernwood residents.
| Immigration Origin | # Population | % Population |
| Asia | 29 | 1.1% |
| Central America | 10 | 0.4% |
| Latin America | 10 | 0.4% |
| Mexico | 10 | 0.4% |
| South Eastern Asia | 29 | 1.1% |
| Thailand | 29 | 1.1% | View All 6 Rows |
Sex and Age in Timberline-Fernwood
Sex and Age in Timberline-Fernwood
The most populous age groups in Timberline-Fernwood are 25 to 29 Years (175 | 11.5%) for men and 40 to 44 Years (127 | 11.0%) for women.
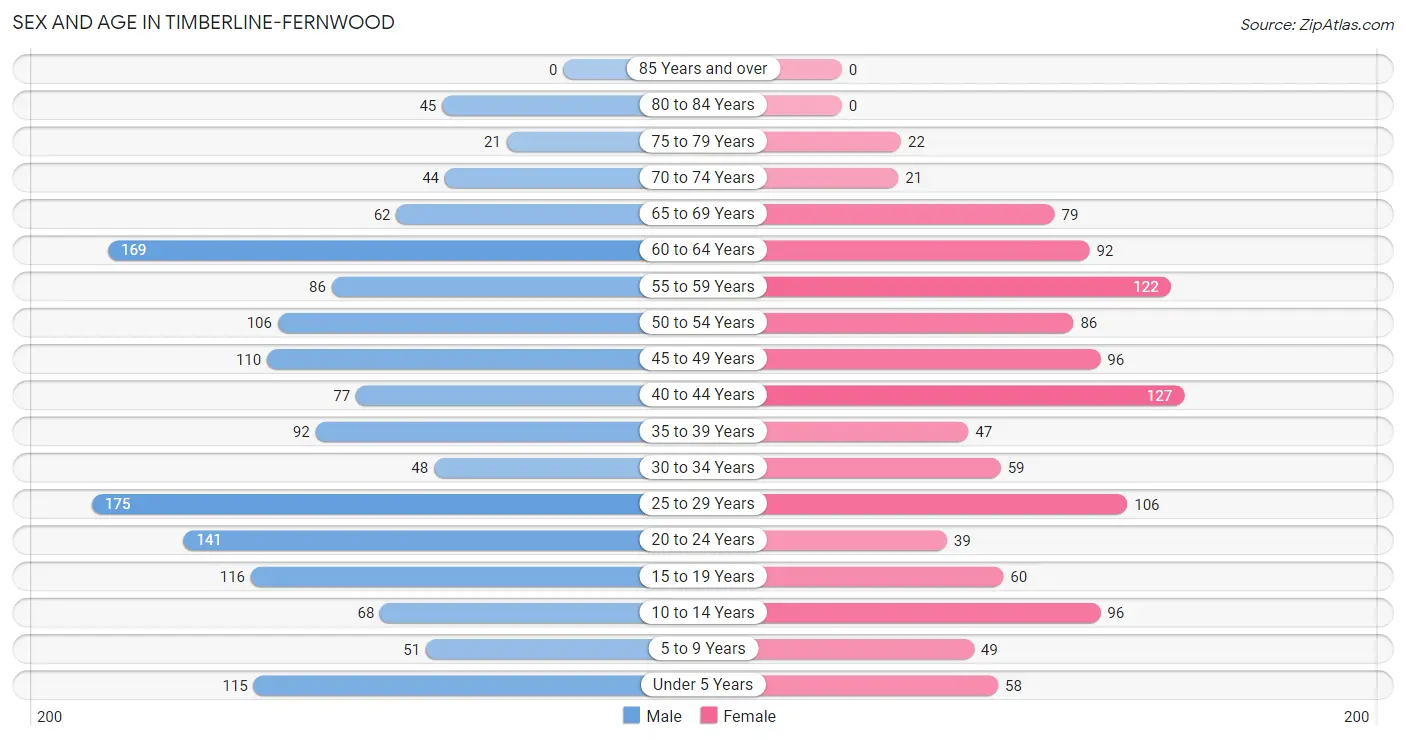
| Age Bracket | Male | Female |
| Under 5 Years | 115 (7.5%) | 58 (5.0%) |
| 5 to 9 Years | 51 (3.3%) | 49 (4.2%) |
| 10 to 14 Years | 68 (4.5%) | 96 (8.3%) |
| 15 to 19 Years | 116 (7.6%) | 60 (5.2%) |
| 20 to 24 Years | 141 (9.2%) | 39 (3.4%) |
| 25 to 29 Years | 175 (11.5%) | 106 (9.1%) |
| 30 to 34 Years | 48 (3.2%) | 59 (5.1%) |
| 35 to 39 Years | 92 (6.0%) | 47 (4.1%) |
| 40 to 44 Years | 77 (5.1%) | 127 (11.0%) |
| 45 to 49 Years | 110 (7.2%) | 96 (8.3%) |
| 50 to 54 Years | 106 (7.0%) | 86 (7.4%) |
| 55 to 59 Years | 86 (5.6%) | 122 (10.5%) |
| 60 to 64 Years | 169 (11.1%) | 92 (7.9%) |
| 65 to 69 Years | 62 (4.1%) | 79 (6.8%) |
| 70 to 74 Years | 44 (2.9%) | 21 (1.8%) |
| 75 to 79 Years | 21 (1.4%) | 22 (1.9%) |
| 80 to 84 Years | 45 (2.9%) | 0 (0.0%) |
| 85 Years and over | 0 (0.0%) | 0 (0.0%) |
| Total | 1,526 (100.0%) | 1,159 (100.0%) |
Families and Households in Timberline-Fernwood
Median Family Size in Timberline-Fernwood
The median family size in Timberline-Fernwood is 3.07 persons per family, with single male/father families (46 | 6.1%) accounting for the largest median family size of 3.85 persons per family. On the other hand, single female/mother families (25 | 3.3%) represent the smallest median family size with 2.56 persons per family.
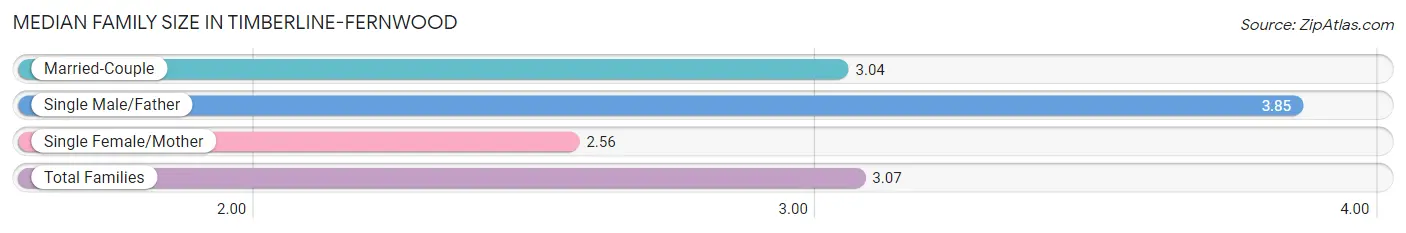
| Family Type | # Families | Family Size |
| Married-Couple | 687 (90.6%) | 3.04 |
| Single Male/Father | 46 (6.1%) | 3.85 |
| Single Female/Mother | 25 (3.3%) | 2.56 |
| Total Families | 758 (100.0%) | 3.07 |
Median Household Size in Timberline-Fernwood
The median household size in Timberline-Fernwood is 2.88 persons per household, with single male/father households (46 | 5.0%) accounting for the largest median household size of 3.85 persons per household. non-family households (170 | 18.3%) represent the smallest median household size with 1.94 persons per household.
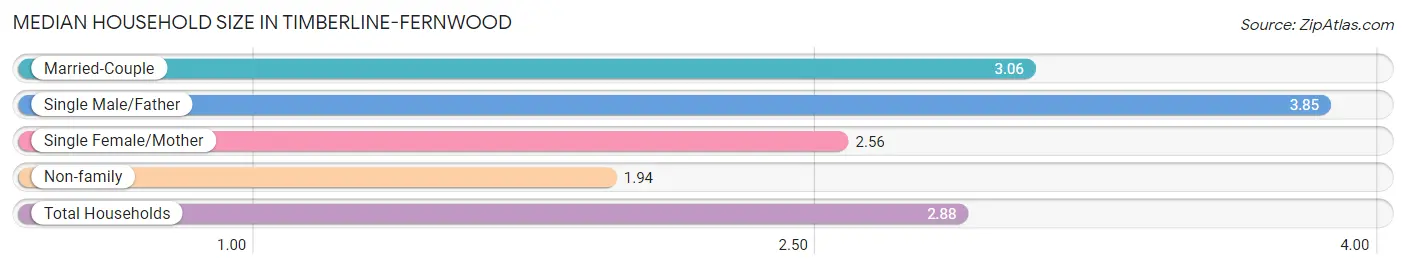
| Household Type | # Households | Household Size |
| Married-Couple | 687 (74.0%) | 3.06 |
| Single Male/Father | 46 (5.0%) | 3.85 |
| Single Female/Mother | 25 (2.7%) | 2.56 |
| Non-family | 170 (18.3%) | 1.94 |
| Total Households | 928 (100.0%) | 2.88 |
Household Size by Marriage Status in Timberline-Fernwood
Out of a total of 928 households in Timberline-Fernwood, 758 (81.7%) are family households, while 170 (18.3%) are nonfamily households. The most numerous type of family households are 2-person households, comprising 282, and the most common type of nonfamily households are 1-person households, comprising 78.
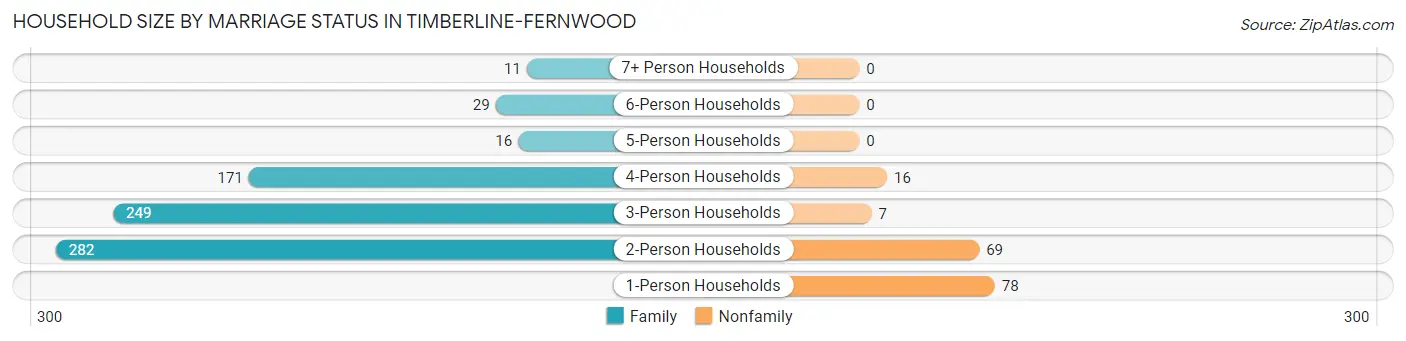
| Household Size | Family Households | Nonfamily Households |
| 1-Person Households | - | 78 (8.4%) |
| 2-Person Households | 282 (30.4%) | 69 (7.4%) |
| 3-Person Households | 249 (26.8%) | 7 (0.7%) |
| 4-Person Households | 171 (18.4%) | 16 (1.7%) |
| 5-Person Households | 16 (1.7%) | 0 (0.0%) |
| 6-Person Households | 29 (3.1%) | 0 (0.0%) |
| 7+ Person Households | 11 (1.2%) | 0 (0.0%) |
| Total | 758 (81.7%) | 170 (18.3%) |
Female Fertility in Timberline-Fernwood
Fertility by Age in Timberline-Fernwood
| Age Bracket | Women with Births | Births / 1,000 Women |
| 15 to 19 years | 0 (0.0%) | 0.0 |
| 20 to 34 years | 0 (0.0%) | 0.0 |
| 35 to 50 years | 0 (0.0%) | 0.0 |
| Total | 0 (0.0%) | 0.0 |
Fertility by Age by Marriage Status in Timberline-Fernwood
| Age Bracket | Married | Unmarried |
| 15 to 19 years | 0 (0.0%) | 0 (0.0%) |
| 20 to 34 years | 0 (0.0%) | 0 (0.0%) |
| 35 to 50 years | 0 (0.0%) | 0 (0.0%) |
| Total | 0 (0.0%) | 0 (0.0%) |
Fertility by Education in Timberline-Fernwood
| Educational Attainment | Women with Births | Births / 1,000 Women |
| Less than High School | 0 (0.0%) | 0.0 |
| High School Diploma | 0 (0.0%) | 0.0 |
| College or Associate's Degree | 0 (0.0%) | 0.0 |
| Bachelor's Degree | 0 (0.0%) | 0.0 |
| Graduate Degree | 0 (0.0%) | 0.0 |
| Total | 0 (0.0%) | 0.0 |
Fertility by Education by Marriage Status in Timberline-Fernwood
| Educational Attainment | Married | Unmarried |
| Less than High School | 0 (0.0%) | 0 (0.0%) |
| High School Diploma | 0 (0.0%) | 0 (0.0%) |
| College or Associate's Degree | 0 (0.0%) | 0 (0.0%) |
| Bachelor's Degree | 0 (0.0%) | 0 (0.0%) |
| Graduate Degree | 0 (0.0%) | 0 (0.0%) |
| Total | 0 (0.0%) | 0 (0.0%) |
Employment Characteristics in Timberline-Fernwood
Employment by Class of Employer in Timberline-Fernwood
Among the 1,445 employed individuals in Timberline-Fernwood, private company employees (772 | 53.4%), local government employees (155 | 10.7%), and self-employed (incorporated) (150 | 10.4%) make up the most common classes of employment.
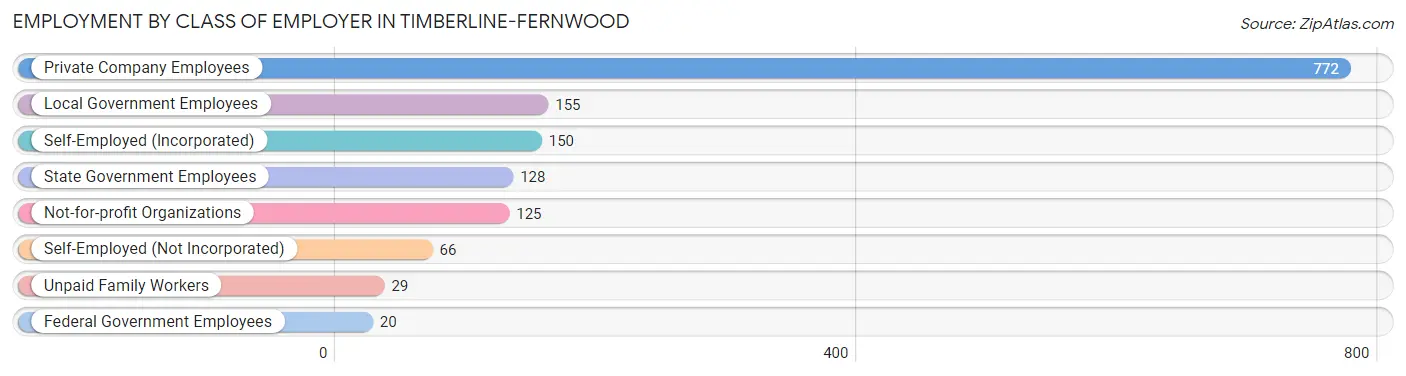
| Employer Class | # Employees | % Employees |
| Private Company Employees | 772 | 53.4% |
| Self-Employed (Incorporated) | 150 | 10.4% |
| Self-Employed (Not Incorporated) | 66 | 4.6% |
| Not-for-profit Organizations | 125 | 8.6% |
| Local Government Employees | 155 | 10.7% |
| State Government Employees | 128 | 8.9% |
| Federal Government Employees | 20 | 1.4% |
| Unpaid Family Workers | 29 | 2.0% |
| Total | 1,445 | 100.0% |
Employment Status by Age in Timberline-Fernwood
According to the labor force statistics for Timberline-Fernwood, out of the total population over 16 years of age (2,206), 69.3% or 1,529 individuals are in the labor force, with 4.2% or 64 of them unemployed. The age group with the highest labor force participation rate is 20 to 24 years, with 99.4% or 179 individuals in the labor force. Within the labor force, the 20 to 24 years age range has the highest percentage of unemployed individuals, with 30.7% or 55 of them being unemployed.
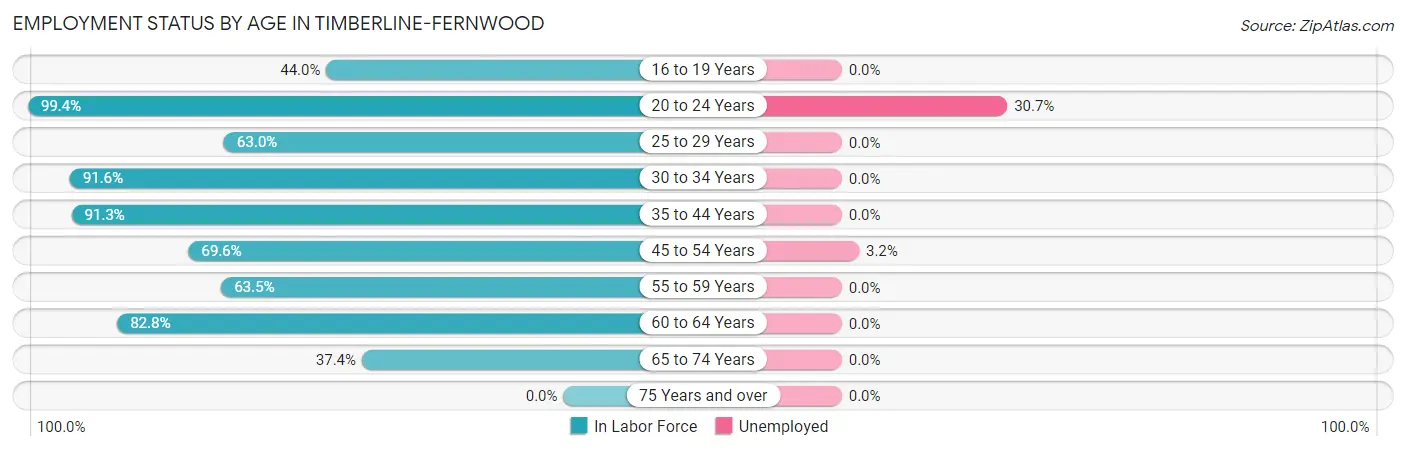
| Age Bracket | In Labor Force | Unemployed |
| 16 to 19 Years | 59 (44.0%) | 0 (0.0%) |
| 20 to 24 Years | 179 (99.4%) | 55 (30.7%) |
| 25 to 29 Years | 177 (63.0%) | 0 (0.0%) |
| 30 to 34 Years | 98 (91.6%) | 0 (0.0%) |
| 35 to 44 Years | 313 (91.3%) | 0 (0.0%) |
| 45 to 54 Years | 277 (69.6%) | 9 (3.2%) |
| 55 to 59 Years | 132 (63.5%) | 0 (0.0%) |
| 60 to 64 Years | 216 (82.8%) | 0 (0.0%) |
| 65 to 74 Years | 77 (37.4%) | 0 (0.0%) |
| 75 Years and over | 0 (0.0%) | 0 (0.0%) |
| Total | 1,529 (69.3%) | 64 (4.2%) |
Employment Status by Educational Attainment in Timberline-Fernwood
According to labor force statistics for Timberline-Fernwood, 75.9% of individuals (1,213) out of the total population between 25 and 64 years of age (1,598) are in the labor force, with 0.7% or 8 of them being unemployed. The group with the highest labor force participation rate are those with the educational attainment of college / associate degree, with 85.0% or 352 individuals in the labor force. Within the labor force, individuals with college / associate degree education have the highest percentage of unemployment, with 2.6% or 9 of them being unemployed.
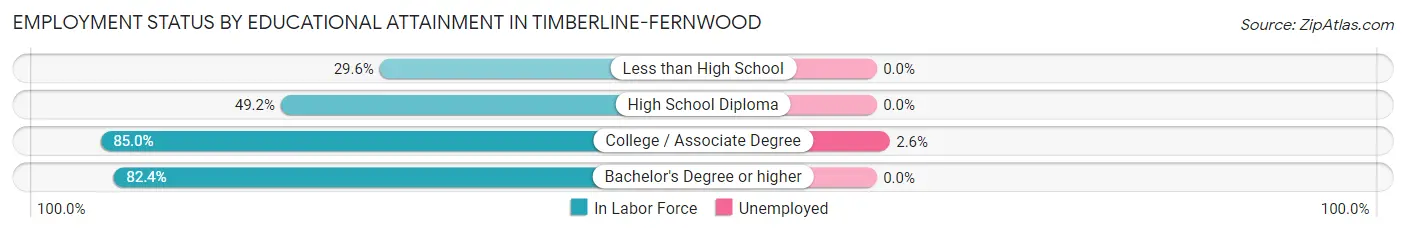
| Educational Attainment | In Labor Force | Unemployed |
| Less than High School | 8 (29.6%) | 0 (0.0%) |
| High School Diploma | 149 (49.2%) | 0 (0.0%) |
| College / Associate Degree | 352 (85.0%) | 11 (2.6%) |
| Bachelor's Degree or higher | 704 (82.4%) | 0 (0.0%) |
| Total | 1,213 (75.9%) | 11 (0.7%) |
Employment Occupations by Sex in Timberline-Fernwood
Management, Business, Science and Arts Occupations
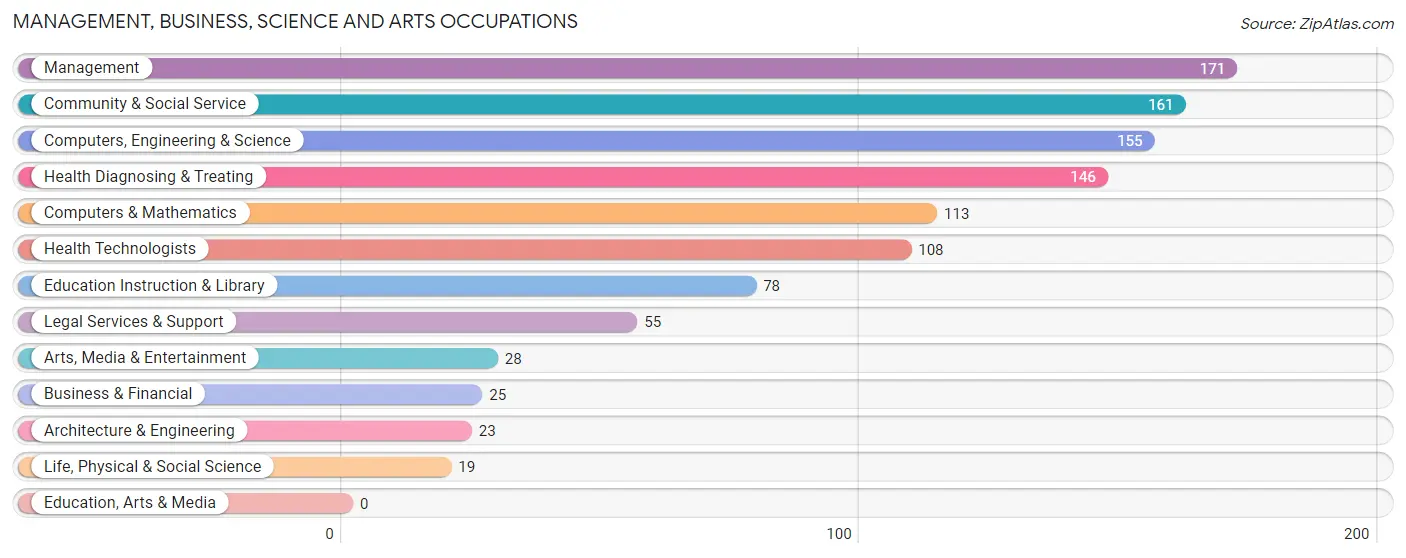
The most common Management, Business, Science and Arts occupations in Timberline-Fernwood are Management (171 | 11.7%), Community & Social Service (161 | 11.0%), Computers, Engineering & Science (155 | 10.6%), Health Diagnosing & Treating (146 | 10.0%), and Computers & Mathematics (113 | 7.7%).
Management, Business, Science and Arts Occupations by Sex
Within the Management, Business, Science and Arts occupations in Timberline-Fernwood, the most male-oriented occupations are Architecture & Engineering (100.0%), Life, Physical & Social Science (100.0%), and Computers, Engineering & Science (76.8%), while the most female-oriented occupations are Education Instruction & Library (100.0%), Arts, Media & Entertainment (100.0%), and Health Diagnosing & Treating (89.0%).
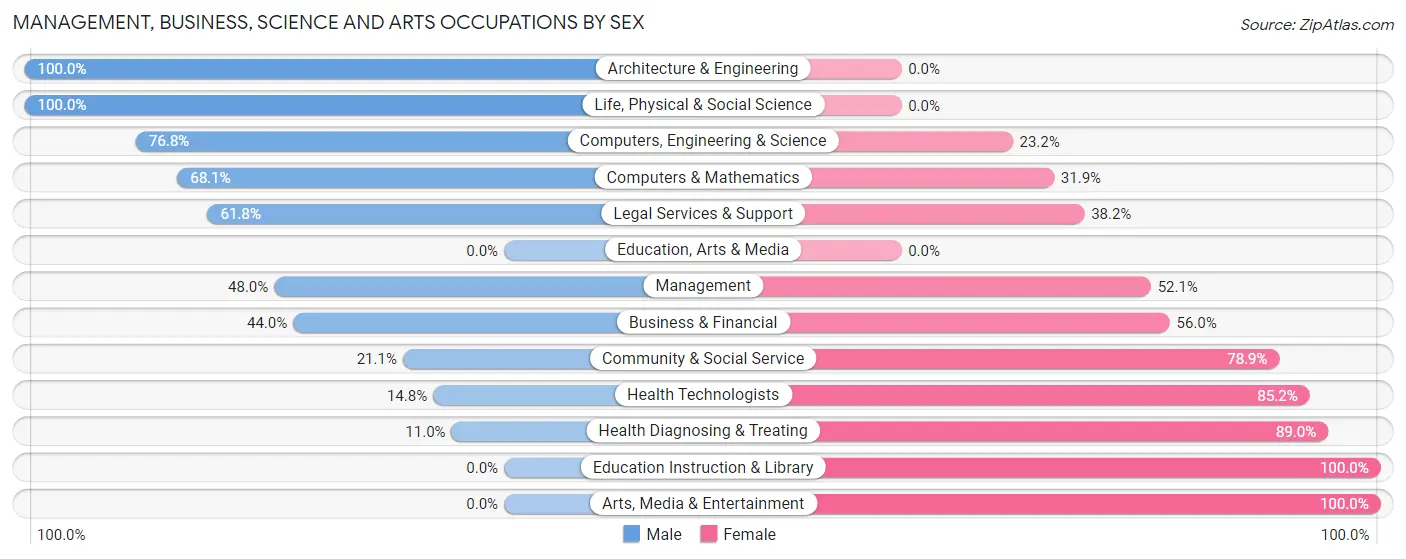
| Occupation | Male | Female |
| Management | 82 (47.9%) | 89 (52.0%) |
| Business & Financial | 11 (44.0%) | 14 (56.0%) |
| Computers, Engineering & Science | 119 (76.8%) | 36 (23.2%) |
| Computers & Mathematics | 77 (68.1%) | 36 (31.9%) |
| Architecture & Engineering | 23 (100.0%) | 0 (0.0%) |
| Life, Physical & Social Science | 19 (100.0%) | 0 (0.0%) |
| Community & Social Service | 34 (21.1%) | 127 (78.9%) |
| Education, Arts & Media | 0 (0.0%) | 0 (0.0%) |
| Legal Services & Support | 34 (61.8%) | 21 (38.2%) |
| Education Instruction & Library | 0 (0.0%) | 78 (100.0%) |
| Arts, Media & Entertainment | 0 (0.0%) | 28 (100.0%) |
| Health Diagnosing & Treating | 16 (11.0%) | 130 (89.0%) |
| Health Technologists | 16 (14.8%) | 92 (85.2%) |
| Total (Category) | 262 (39.8%) | 396 (60.2%) |
| Total (Overall) | 813 (55.5%) | 651 (44.5%) |
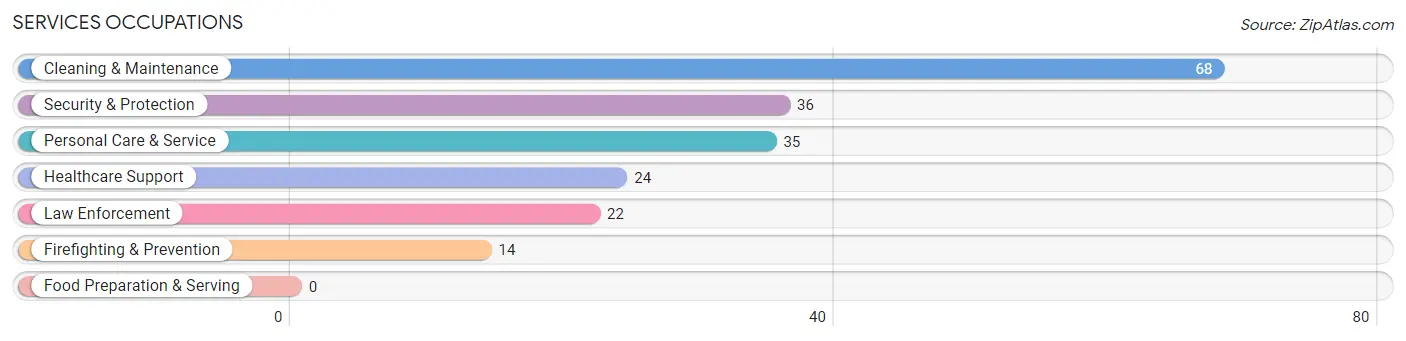
Services Occupations
The most common Services occupations in Timberline-Fernwood are Cleaning & Maintenance (68 | 4.6%), Security & Protection (36 | 2.5%), Personal Care & Service (35 | 2.4%), Healthcare Support (24 | 1.6%), and Law Enforcement (22 | 1.5%).
Services Occupations by Sex
Within the Services occupations in Timberline-Fernwood, the most male-oriented occupations are Security & Protection (100.0%), Firefighting & Prevention (100.0%), and Law Enforcement (100.0%), while the most female-oriented occupations are Personal Care & Service (45.7%), Cleaning & Maintenance (42.6%), and Healthcare Support (29.2%).
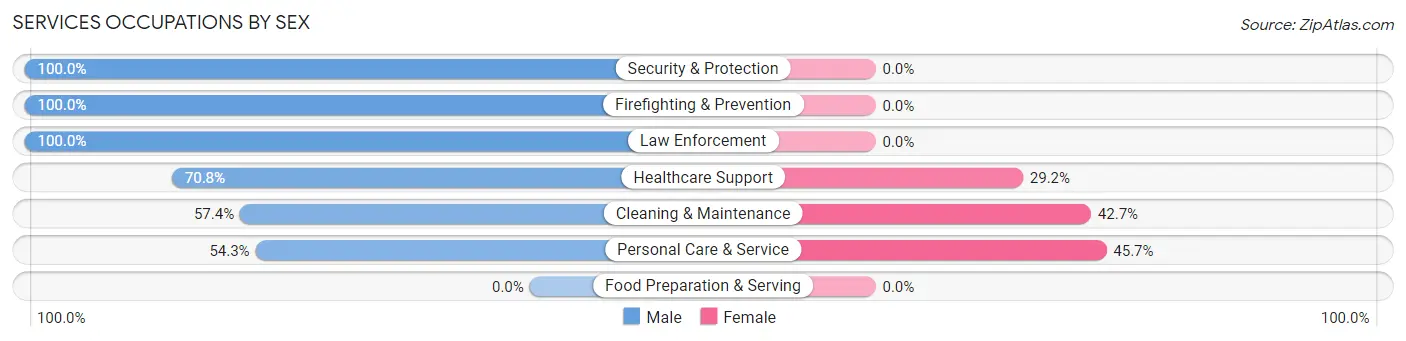
| Occupation | Male | Female |
| Healthcare Support | 17 (70.8%) | 7 (29.2%) |
| Security & Protection | 36 (100.0%) | 0 (0.0%) |
| Firefighting & Prevention | 14 (100.0%) | 0 (0.0%) |
| Law Enforcement | 22 (100.0%) | 0 (0.0%) |
| Food Preparation & Serving | 0 (0.0%) | 0 (0.0%) |
| Cleaning & Maintenance | 39 (57.4%) | 29 (42.6%) |
| Personal Care & Service | 19 (54.3%) | 16 (45.7%) |
| Total (Category) | 111 (68.1%) | 52 (31.9%) |
| Total (Overall) | 813 (55.5%) | 651 (44.5%) |
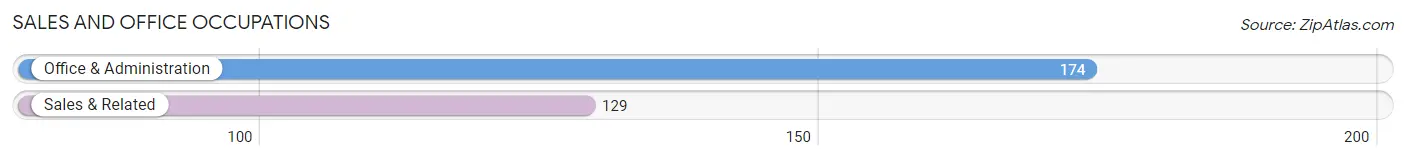
Sales and Office Occupations
The most common Sales and Office occupations in Timberline-Fernwood are Office & Administration (174 | 11.9%), and Sales & Related (129 | 8.8%).
Sales and Office Occupations by Sex
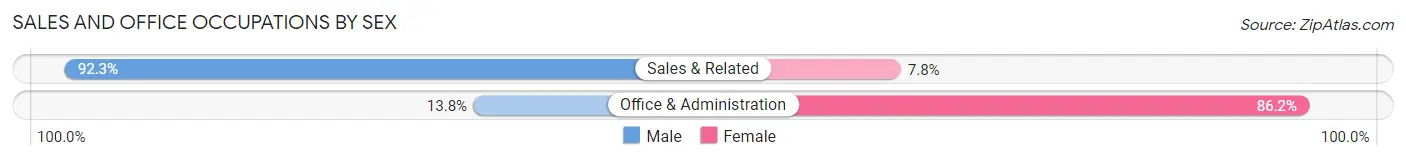
| Occupation | Male | Female |
| Sales & Related | 119 (92.2%) | 10 (7.7%) |
| Office & Administration | 24 (13.8%) | 150 (86.2%) |
| Total (Category) | 143 (47.2%) | 160 (52.8%) |
| Total (Overall) | 813 (55.5%) | 651 (44.5%) |
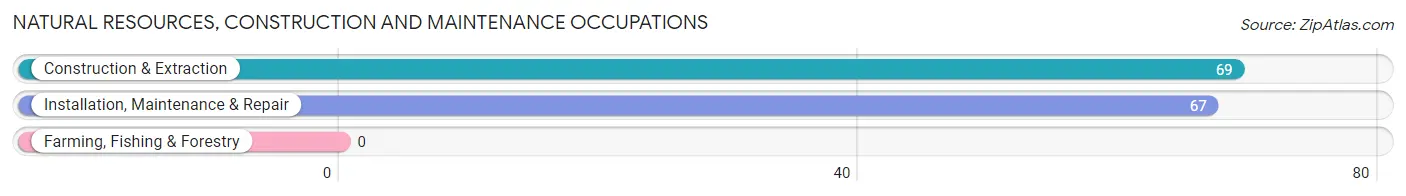
Natural Resources, Construction and Maintenance Occupations
The most common Natural Resources, Construction and Maintenance occupations in Timberline-Fernwood are Construction & Extraction (69 | 4.7%), and Installation, Maintenance & Repair (67 | 4.6%).
Natural Resources, Construction and Maintenance Occupations by Sex
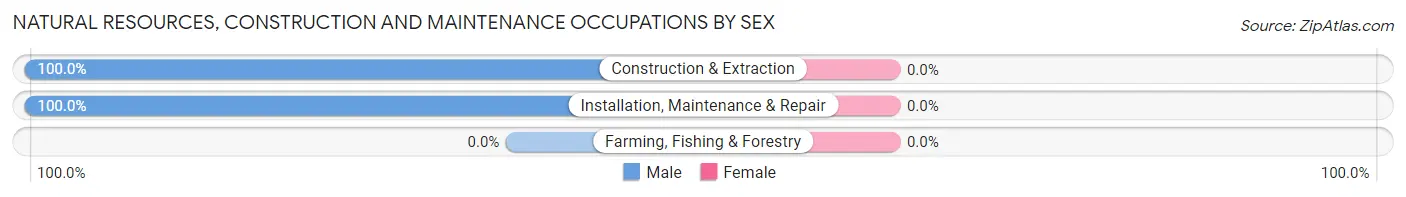
| Occupation | Male | Female |
| Farming, Fishing & Forestry | 0 (0.0%) | 0 (0.0%) |
| Construction & Extraction | 69 (100.0%) | 0 (0.0%) |
| Installation, Maintenance & Repair | 67 (100.0%) | 0 (0.0%) |
| Total (Category) | 136 (100.0%) | 0 (0.0%) |
| Total (Overall) | 813 (55.5%) | 651 (44.5%) |
Production, Transportation and Moving Occupations
The most common Production, Transportation and Moving occupations in Timberline-Fernwood are Transportation (90 | 6.1%), Production (78 | 5.3%), and Material Moving (36 | 2.5%).
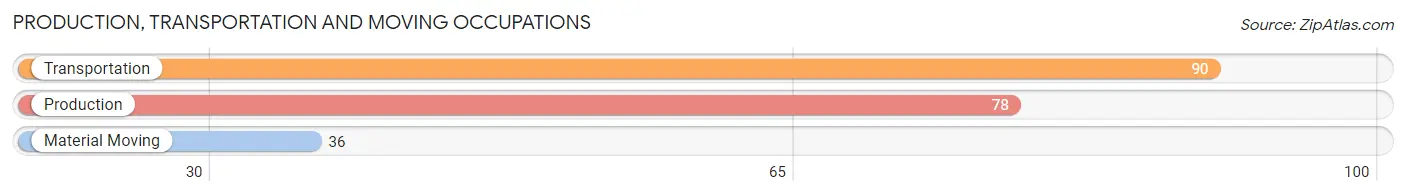
Production, Transportation and Moving Occupations by Sex
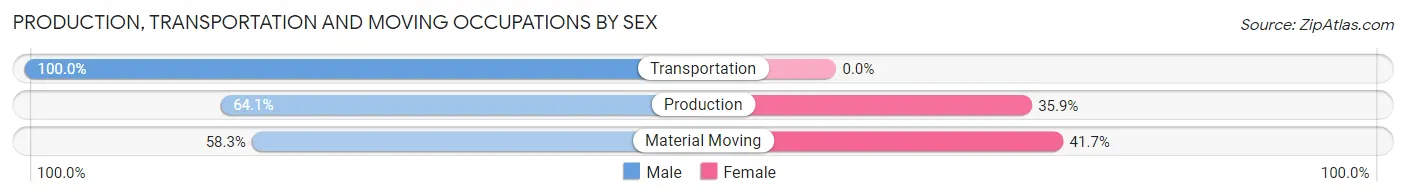
| Occupation | Male | Female |
| Production | 50 (64.1%) | 28 (35.9%) |
| Transportation | 90 (100.0%) | 0 (0.0%) |
| Material Moving | 21 (58.3%) | 15 (41.7%) |
| Total (Category) | 161 (78.9%) | 43 (21.1%) |
| Total (Overall) | 813 (55.5%) | 651 (44.5%) |
Employment Industries by Sex in Timberline-Fernwood
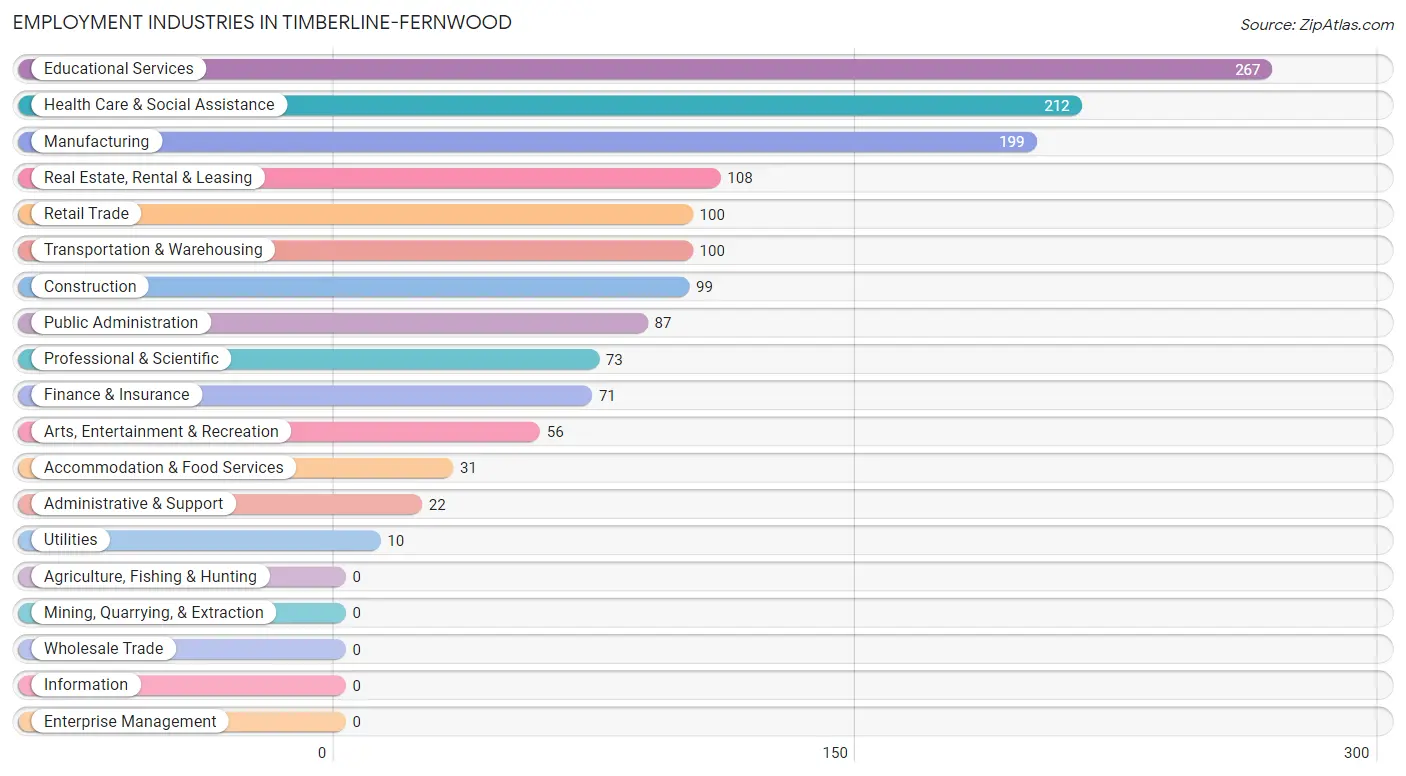
Employment Industries in Timberline-Fernwood
The major employment industries in Timberline-Fernwood include Educational Services (267 | 18.2%), Health Care & Social Assistance (212 | 14.5%), Manufacturing (199 | 13.6%), Real Estate, Rental & Leasing (108 | 7.4%), and Retail Trade (100 | 6.8%).
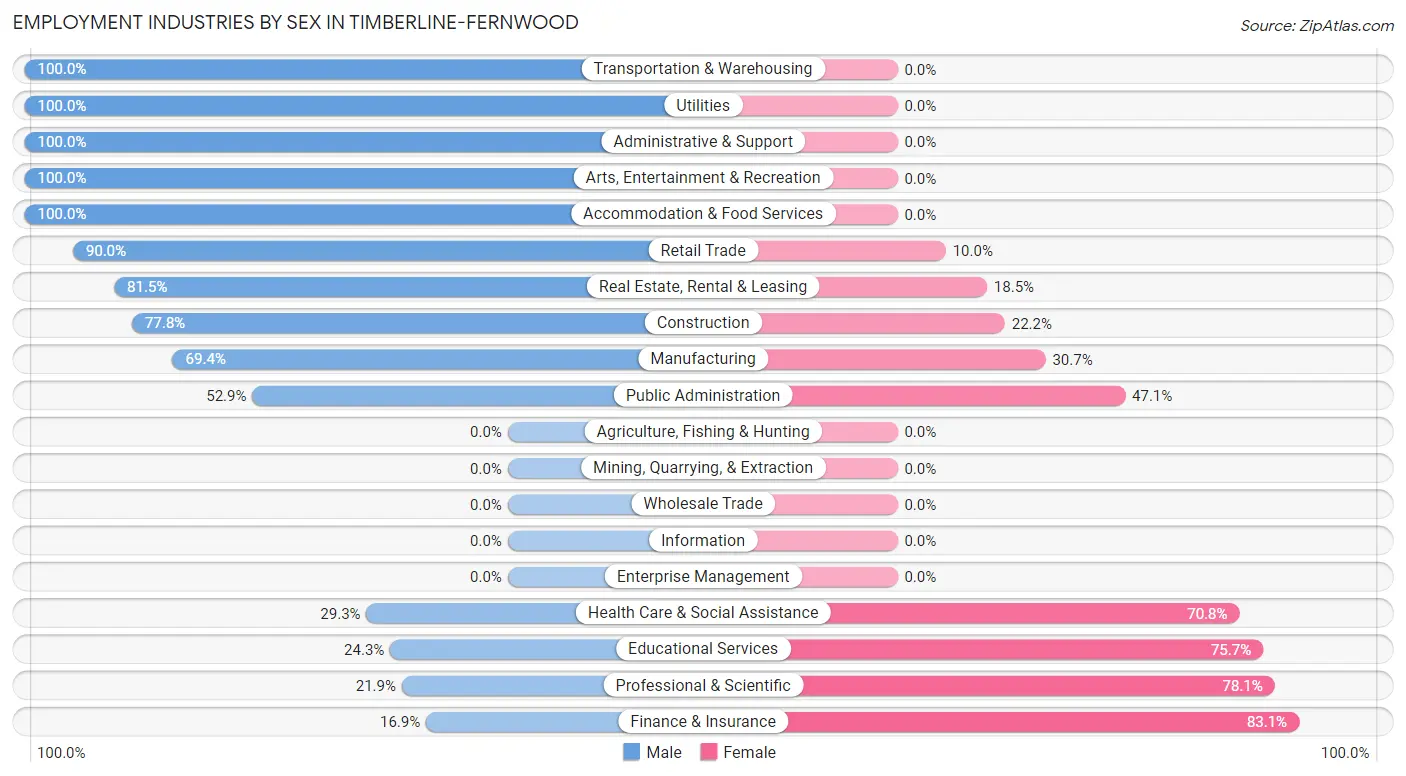
Employment Industries by Sex in Timberline-Fernwood
The Timberline-Fernwood industries that see more men than women are Transportation & Warehousing (100.0%), Utilities (100.0%), and Administrative & Support (100.0%), whereas the industries that tend to have a higher number of women are Finance & Insurance (83.1%), Professional & Scientific (78.1%), and Educational Services (75.7%).
| Industry | Male | Female |
| Agriculture, Fishing & Hunting | 0 (0.0%) | 0 (0.0%) |
| Mining, Quarrying, & Extraction | 0 (0.0%) | 0 (0.0%) |
| Construction | 77 (77.8%) | 22 (22.2%) |
| Manufacturing | 138 (69.4%) | 61 (30.6%) |
| Wholesale Trade | 0 (0.0%) | 0 (0.0%) |
| Retail Trade | 90 (90.0%) | 10 (10.0%) |
| Transportation & Warehousing | 100 (100.0%) | 0 (0.0%) |
| Utilities | 10 (100.0%) | 0 (0.0%) |
| Information | 0 (0.0%) | 0 (0.0%) |
| Finance & Insurance | 12 (16.9%) | 59 (83.1%) |
| Real Estate, Rental & Leasing | 88 (81.5%) | 20 (18.5%) |
| Professional & Scientific | 16 (21.9%) | 57 (78.1%) |
| Enterprise Management | 0 (0.0%) | 0 (0.0%) |
| Administrative & Support | 22 (100.0%) | 0 (0.0%) |
| Educational Services | 65 (24.3%) | 202 (75.7%) |
| Health Care & Social Assistance | 62 (29.2%) | 150 (70.8%) |
| Arts, Entertainment & Recreation | 56 (100.0%) | 0 (0.0%) |
| Accommodation & Food Services | 31 (100.0%) | 0 (0.0%) |
| Public Administration | 46 (52.9%) | 41 (47.1%) |
| Total | 813 (55.5%) | 651 (44.5%) |
Education in Timberline-Fernwood
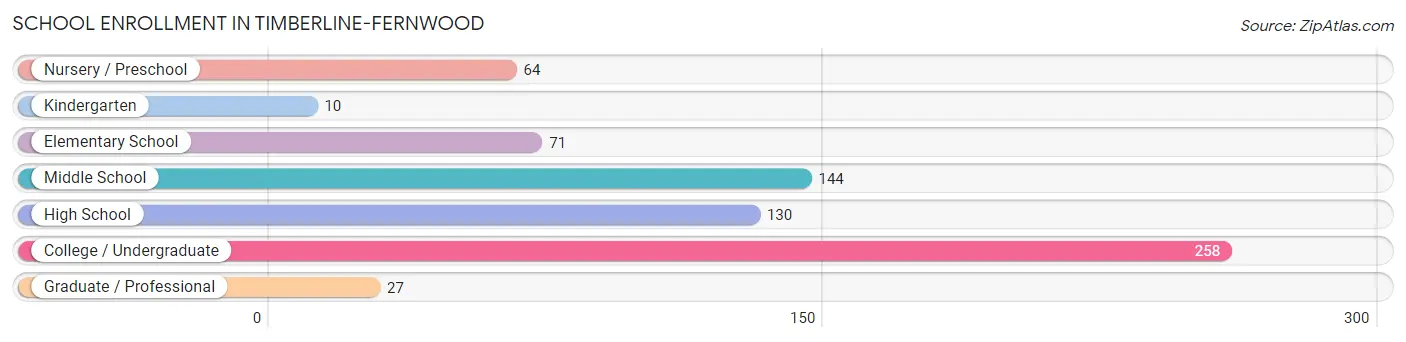
School Enrollment in Timberline-Fernwood
The most common levels of schooling among the 704 students in Timberline-Fernwood are college / undergraduate (258 | 36.6%), middle school (144 | 20.4%), and high school (130 | 18.5%).
| School Level | # Students | % Students |
| Nursery / Preschool | 64 | 9.1% |
| Kindergarten | 10 | 1.4% |
| Elementary School | 71 | 10.1% |
| Middle School | 144 | 20.4% |
| High School | 130 | 18.5% |
| College / Undergraduate | 258 | 36.6% |
| Graduate / Professional | 27 | 3.8% |
| Total | 704 | 100.0% |
School Enrollment by Age by Funding Source in Timberline-Fernwood
Out of a total of 704 students who are enrolled in schools in Timberline-Fernwood, 88 (12.5%) attend a private institution, while the remaining 616 (87.5%) are enrolled in public schools. The age group of 3 to 4 year olds has the highest likelihood of being enrolled in private schools, with 19 (42.2% in the age bracket) enrolled. Conversely, the age group of 5 to 9 year old has the lowest likelihood of being enrolled in a private school, with 100 (100.0% in the age bracket) attending a public institution.
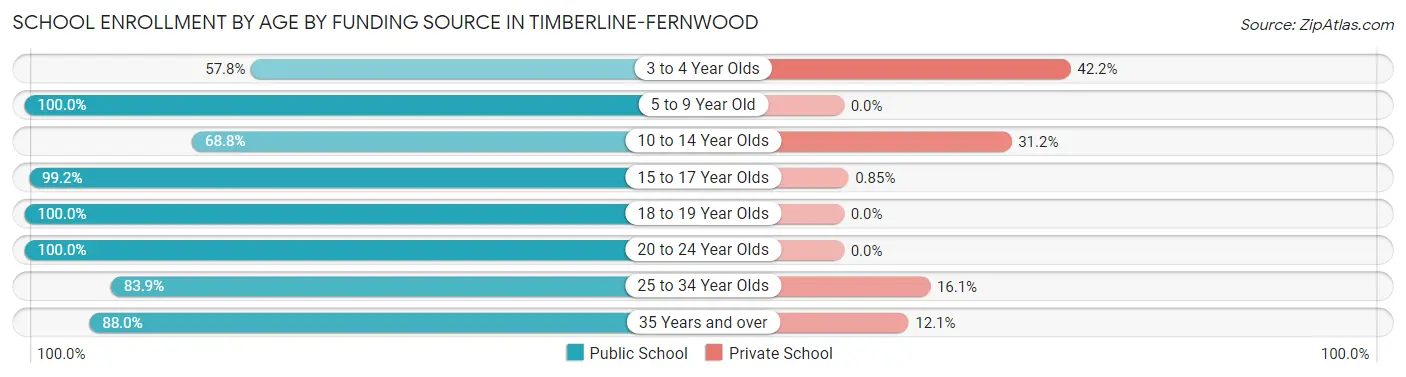
| Age Bracket | Public School | Private School |
| 3 to 4 Year Olds | 26 (57.8%) | 19 (42.2%) |
| 5 to 9 Year Old | 100 (100.0%) | 0 (0.0%) |
| 10 to 14 Year Olds | 108 (68.8%) | 49 (31.2%) |
| 15 to 17 Year Olds | 116 (99.2%) | 1 (0.9%) |
| 18 to 19 Year Olds | 28 (100.0%) | 0 (0.0%) |
| 20 to 24 Year Olds | 118 (100.0%) | 0 (0.0%) |
| 25 to 34 Year Olds | 47 (83.9%) | 9 (16.1%) |
| 35 Years and over | 73 (87.9%) | 10 (12.0%) |
| Total | 616 (87.5%) | 88 (12.5%) |
Educational Attainment by Field of Study in Timberline-Fernwood
Business (240 | 21.7%), science & technology (174 | 15.8%), education (141 | 12.8%), bio, nature & agricultural (110 | 10.0%), and computers & mathematics (97 | 8.8%) are the most common fields of study among 1,104 individuals in Timberline-Fernwood who have obtained a bachelor's degree or higher.
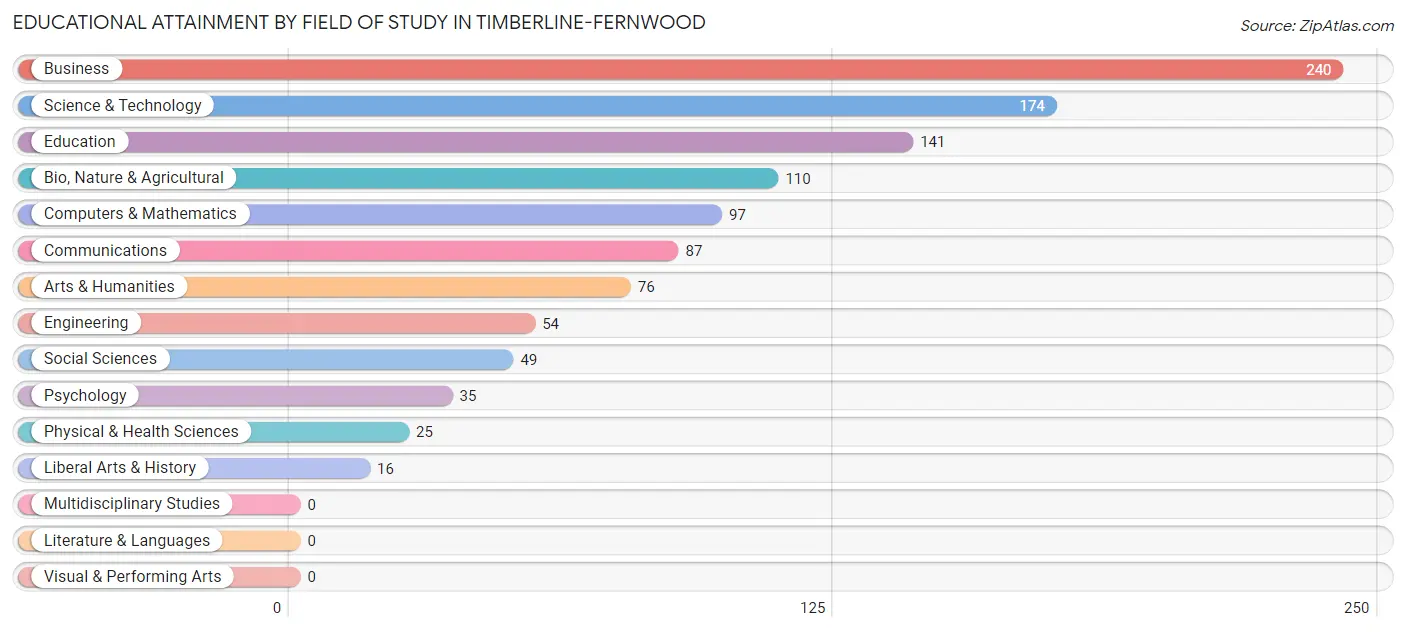
| Field of Study | # Graduates | % Graduates |
| Computers & Mathematics | 97 | 8.8% |
| Bio, Nature & Agricultural | 110 | 10.0% |
| Physical & Health Sciences | 25 | 2.3% |
| Psychology | 35 | 3.2% |
| Social Sciences | 49 | 4.4% |
| Engineering | 54 | 4.9% |
| Multidisciplinary Studies | 0 | 0.0% |
| Science & Technology | 174 | 15.8% |
| Business | 240 | 21.7% |
| Education | 141 | 12.8% |
| Literature & Languages | 0 | 0.0% |
| Liberal Arts & History | 16 | 1.5% |
| Visual & Performing Arts | 0 | 0.0% |
| Communications | 87 | 7.9% |
| Arts & Humanities | 76 | 6.9% |
| Total | 1,104 | 100.0% |
Transportation & Commute in Timberline-Fernwood
Vehicle Availability by Sex in Timberline-Fernwood
The most prevalent vehicle ownership categories in Timberline-Fernwood are males with 3 vehicles (272, accounting for 34.3%) and females with 3 vehicles (202, making up 41.8%).
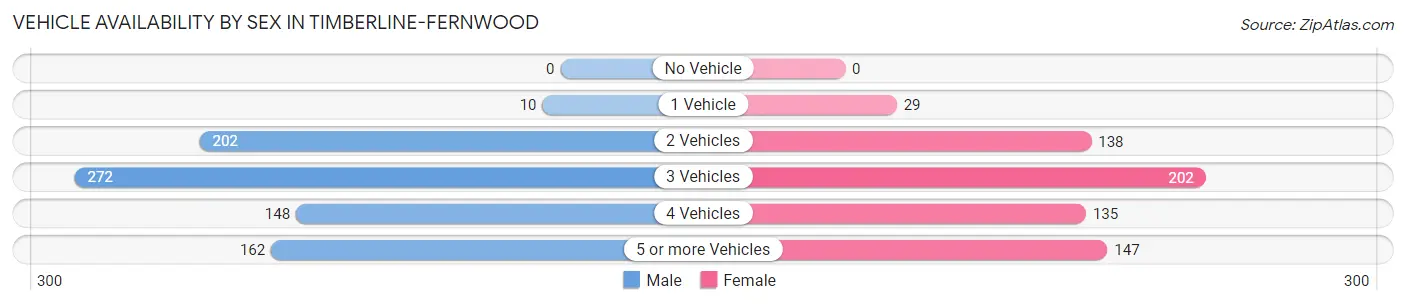
| Vehicles Available | Male | Female |
| No Vehicle | 0 (0.0%) | 0 (0.0%) |
| 1 Vehicle | 10 (1.3%) | 29 (4.4%) |
| 2 Vehicles | 202 (25.4%) | 138 (21.2%) |
| 3 Vehicles | 272 (34.3%) | 202 (31.0%) |
| 4 Vehicles | 148 (18.6%) | 135 (20.7%) |
| 5 or more Vehicles | 162 (20.4%) | 147 (22.6%) |
| Total | 794 (100.0%) | 651 (100.0%) |
Commute Time in Timberline-Fernwood
The most frequently occuring commute durations in Timberline-Fernwood are 20 to 24 minutes (584 commuters, 43.4%), 30 to 34 minutes (187 commuters, 13.9%), and 10 to 14 minutes (173 commuters, 12.9%).
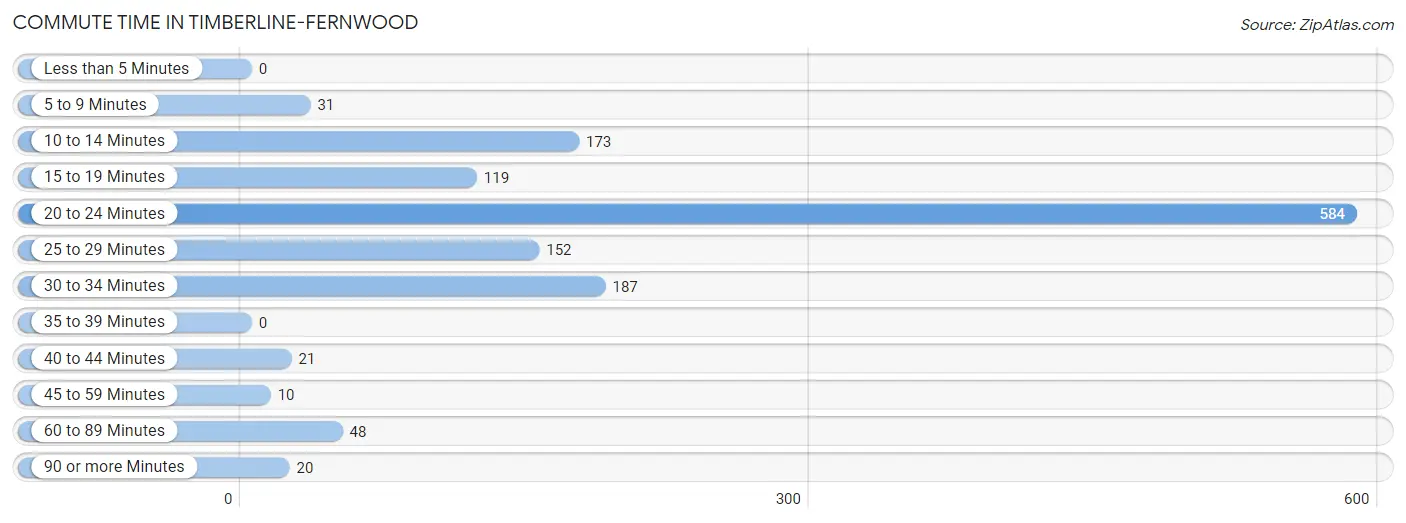
| Commute Time | # Commuters | % Commuters |
| Less than 5 Minutes | 0 | 0.0% |
| 5 to 9 Minutes | 31 | 2.3% |
| 10 to 14 Minutes | 173 | 12.9% |
| 15 to 19 Minutes | 119 | 8.8% |
| 20 to 24 Minutes | 584 | 43.4% |
| 25 to 29 Minutes | 152 | 11.3% |
| 30 to 34 Minutes | 187 | 13.9% |
| 35 to 39 Minutes | 0 | 0.0% |
| 40 to 44 Minutes | 21 | 1.6% |
| 45 to 59 Minutes | 10 | 0.7% |
| 60 to 89 Minutes | 48 | 3.6% |
| 90 or more Minutes | 20 | 1.5% |
Commute Time by Sex in Timberline-Fernwood
The most common commute times in Timberline-Fernwood are 20 to 24 minutes (260 commuters, 34.5%) for males and 20 to 24 minutes (324 commuters, 54.8%) for females.
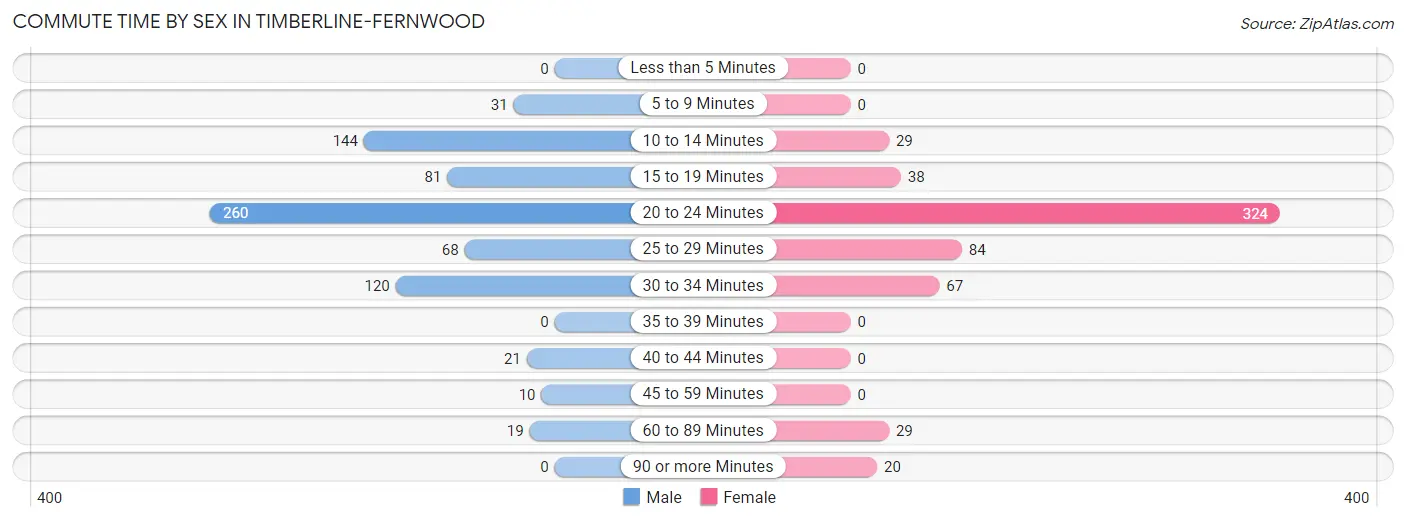
| Commute Time | Male | Female |
| Less than 5 Minutes | 0 (0.0%) | 0 (0.0%) |
| 5 to 9 Minutes | 31 (4.1%) | 0 (0.0%) |
| 10 to 14 Minutes | 144 (19.1%) | 29 (4.9%) |
| 15 to 19 Minutes | 81 (10.7%) | 38 (6.4%) |
| 20 to 24 Minutes | 260 (34.5%) | 324 (54.8%) |
| 25 to 29 Minutes | 68 (9.0%) | 84 (14.2%) |
| 30 to 34 Minutes | 120 (15.9%) | 67 (11.3%) |
| 35 to 39 Minutes | 0 (0.0%) | 0 (0.0%) |
| 40 to 44 Minutes | 21 (2.8%) | 0 (0.0%) |
| 45 to 59 Minutes | 10 (1.3%) | 0 (0.0%) |
| 60 to 89 Minutes | 19 (2.5%) | 29 (4.9%) |
| 90 or more Minutes | 0 (0.0%) | 20 (3.4%) |
Time of Departure to Work by Sex in Timberline-Fernwood
The most frequent times of departure to work in Timberline-Fernwood are 9:00 AM to 9:59 AM (167, 22.2%) for males and 7:00 AM to 7:29 AM (114, 19.3%) for females.
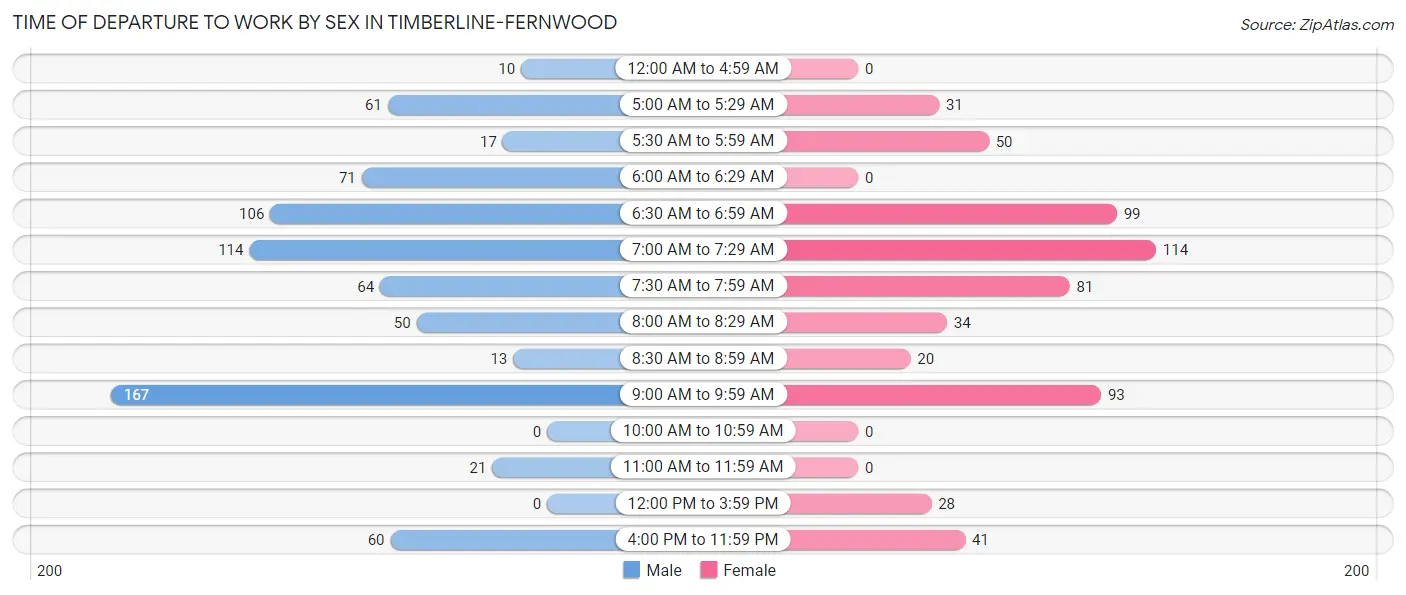
| Time of Departure | Male | Female |
| 12:00 AM to 4:59 AM | 10 (1.3%) | 0 (0.0%) |
| 5:00 AM to 5:29 AM | 61 (8.1%) | 31 (5.2%) |
| 5:30 AM to 5:59 AM | 17 (2.2%) | 50 (8.5%) |
| 6:00 AM to 6:29 AM | 71 (9.4%) | 0 (0.0%) |
| 6:30 AM to 6:59 AM | 106 (14.1%) | 99 (16.8%) |
| 7:00 AM to 7:29 AM | 114 (15.1%) | 114 (19.3%) |
| 7:30 AM to 7:59 AM | 64 (8.5%) | 81 (13.7%) |
| 8:00 AM to 8:29 AM | 50 (6.6%) | 34 (5.8%) |
| 8:30 AM to 8:59 AM | 13 (1.7%) | 20 (3.4%) |
| 9:00 AM to 9:59 AM | 167 (22.2%) | 93 (15.7%) |
| 10:00 AM to 10:59 AM | 0 (0.0%) | 0 (0.0%) |
| 11:00 AM to 11:59 AM | 21 (2.8%) | 0 (0.0%) |
| 12:00 PM to 3:59 PM | 0 (0.0%) | 28 (4.7%) |
| 4:00 PM to 11:59 PM | 60 (8.0%) | 41 (6.9%) |
| Total | 754 (100.0%) | 591 (100.0%) |
Housing Occupancy in Timberline-Fernwood
Occupancy by Ownership in Timberline-Fernwood
Of the total 928 dwellings in Timberline-Fernwood, owner-occupied units account for 800 (86.2%), while renter-occupied units make up 128 (13.8%).
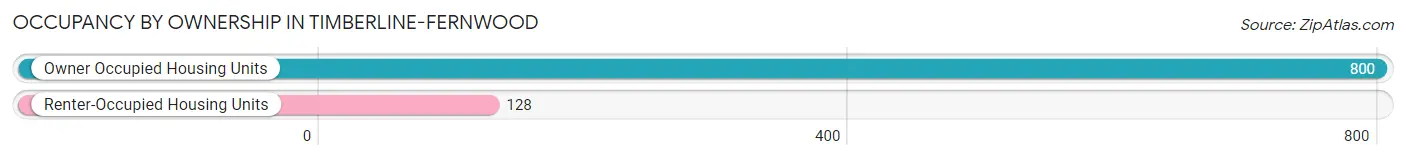
| Occupancy | # Housing Units | % Housing Units |
| Owner Occupied Housing Units | 800 | 86.2% |
| Renter-Occupied Housing Units | 128 | 13.8% |
| Total Occupied Housing Units | 928 | 100.0% |
Occupancy by Household Size in Timberline-Fernwood
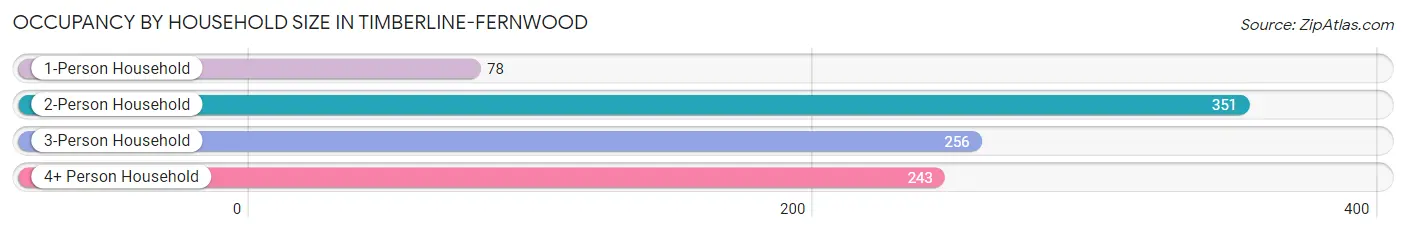
| Household Size | # Housing Units | % Housing Units |
| 1-Person Household | 78 | 8.4% |
| 2-Person Household | 351 | 37.8% |
| 3-Person Household | 256 | 27.6% |
| 4+ Person Household | 243 | 26.2% |
| Total Housing Units | 928 | 100.0% |
Occupancy by Ownership by Household Size in Timberline-Fernwood
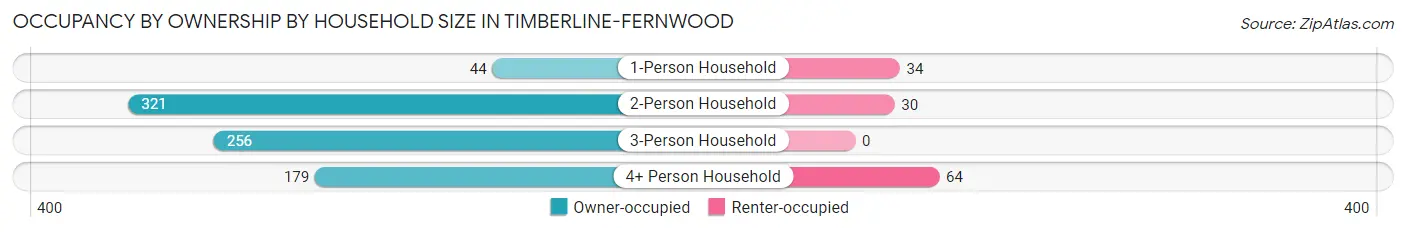
| Household Size | Owner-occupied | Renter-occupied |
| 1-Person Household | 44 (56.4%) | 34 (43.6%) |
| 2-Person Household | 321 (91.4%) | 30 (8.6%) |
| 3-Person Household | 256 (100.0%) | 0 (0.0%) |
| 4+ Person Household | 179 (73.7%) | 64 (26.3%) |
| Total Housing Units | 800 (86.2%) | 128 (13.8%) |
Occupancy by Educational Attainment in Timberline-Fernwood
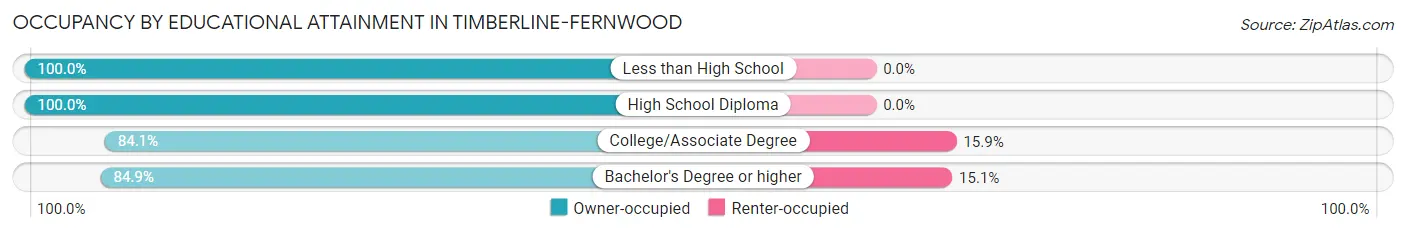
| Household Size | Owner-occupied | Renter-occupied |
| Less than High School | 8 (100.0%) | 0 (0.0%) |
| High School Diploma | 87 (100.0%) | 0 (0.0%) |
| College/Associate Degree | 243 (84.1%) | 46 (15.9%) |
| Bachelor's Degree or higher | 462 (84.9%) | 82 (15.1%) |
Occupancy by Age of Householder in Timberline-Fernwood
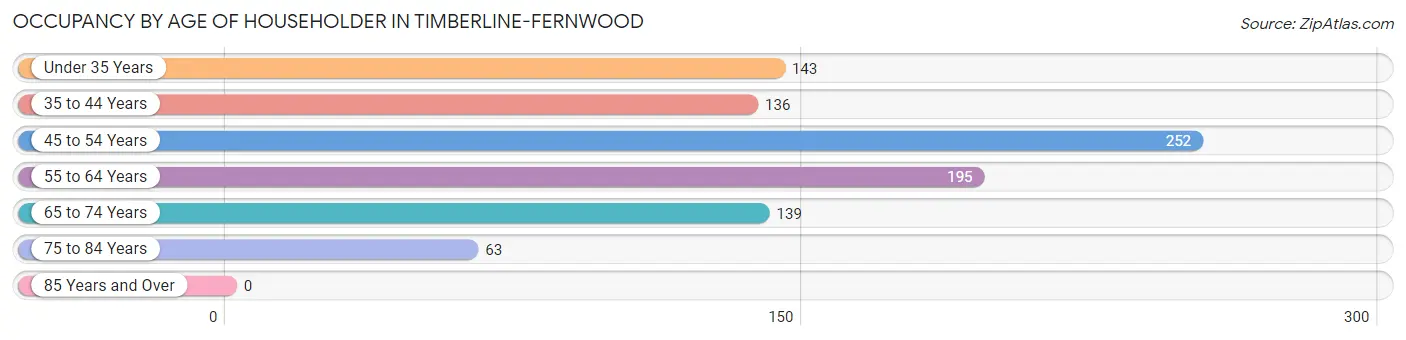
| Age Bracket | # Households | % Households |
| Under 35 Years | 143 | 15.4% |
| 35 to 44 Years | 136 | 14.7% |
| 45 to 54 Years | 252 | 27.2% |
| 55 to 64 Years | 195 | 21.0% |
| 65 to 74 Years | 139 | 15.0% |
| 75 to 84 Years | 63 | 6.8% |
| 85 Years and Over | 0 | 0.0% |
| Total | 928 | 100.0% |
Housing Finances in Timberline-Fernwood
Median Income by Occupancy in Timberline-Fernwood
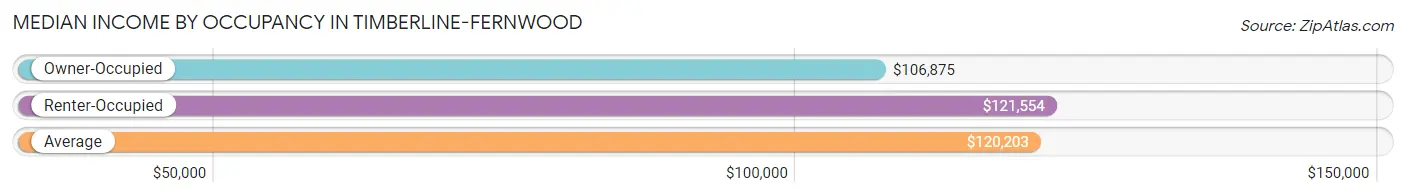
| Occupancy Type | # Households | Median Income |
| Owner-Occupied | 800 (86.2%) | $106,875 |
| Renter-Occupied | 128 (13.8%) | $121,554 |
| Average | 928 (100.0%) | $120,203 |
Occupancy by Householder Income Bracket in Timberline-Fernwood
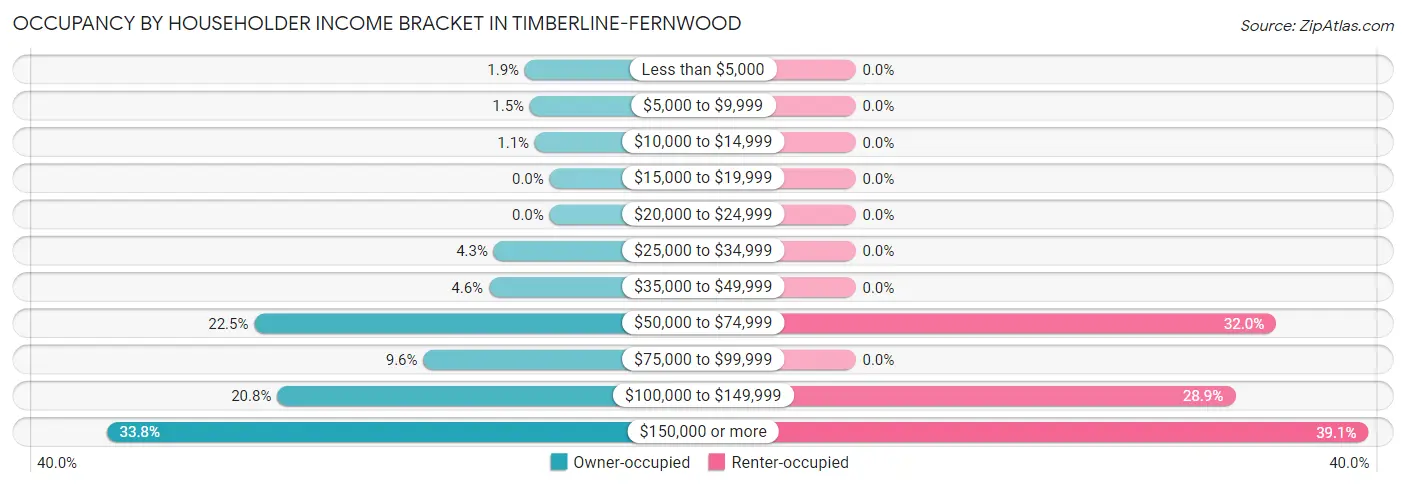
| Income Bracket | Owner-occupied | Renter-occupied |
| Less than $5,000 | 15 (1.9%) | 0 (0.0%) |
| $5,000 to $9,999 | 12 (1.5%) | 0 (0.0%) |
| $10,000 to $14,999 | 9 (1.1%) | 0 (0.0%) |
| $15,000 to $19,999 | 0 (0.0%) | 0 (0.0%) |
| $20,000 to $24,999 | 0 (0.0%) | 0 (0.0%) |
| $25,000 to $34,999 | 34 (4.3%) | 0 (0.0%) |
| $35,000 to $49,999 | 37 (4.6%) | 0 (0.0%) |
| $50,000 to $74,999 | 180 (22.5%) | 41 (32.0%) |
| $75,000 to $99,999 | 77 (9.6%) | 0 (0.0%) |
| $100,000 to $149,999 | 166 (20.7%) | 37 (28.9%) |
| $150,000 or more | 270 (33.8%) | 50 (39.1%) |
| Total | 800 (100.0%) | 128 (100.0%) |
Monthly Housing Cost Tiers in Timberline-Fernwood
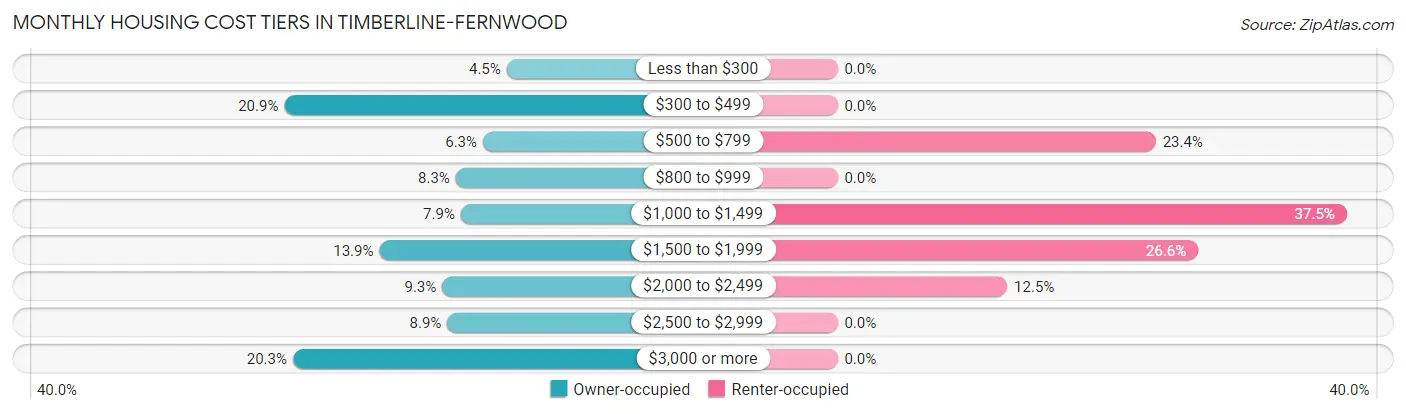
| Monthly Cost | Owner-occupied | Renter-occupied |
| Less than $300 | 36 (4.5%) | 0 (0.0%) |
| $300 to $499 | 167 (20.9%) | 0 (0.0%) |
| $500 to $799 | 50 (6.2%) | 30 (23.4%) |
| $800 to $999 | 66 (8.3%) | 0 (0.0%) |
| $1,000 to $1,499 | 63 (7.9%) | 48 (37.5%) |
| $1,500 to $1,999 | 111 (13.9%) | 34 (26.6%) |
| $2,000 to $2,499 | 74 (9.2%) | 16 (12.5%) |
| $2,500 to $2,999 | 71 (8.9%) | 0 (0.0%) |
| $3,000 or more | 162 (20.3%) | 0 (0.0%) |
| Total | 800 (100.0%) | 128 (100.0%) |
Physical Housing Characteristics in Timberline-Fernwood
Housing Structures in Timberline-Fernwood
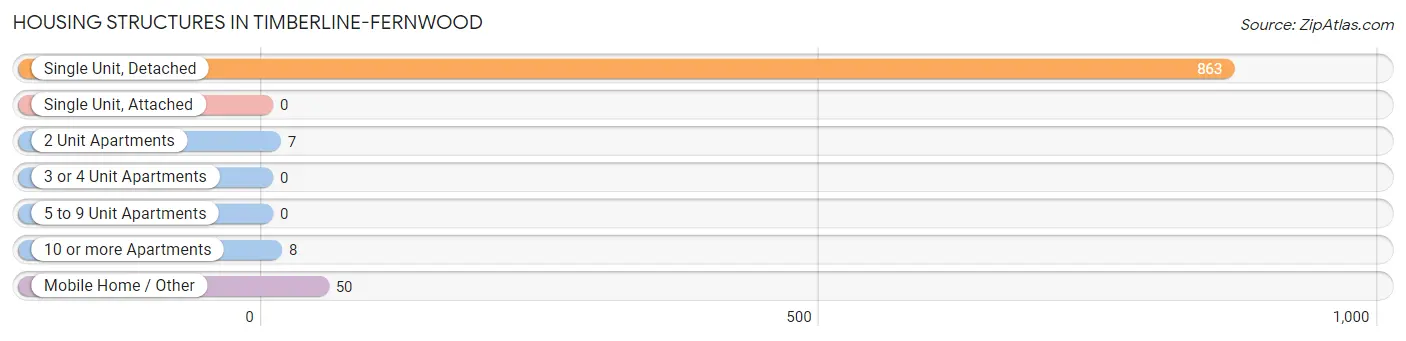
| Structure Type | # Housing Units | % Housing Units |
| Single Unit, Detached | 863 | 93.0% |
| Single Unit, Attached | 0 | 0.0% |
| 2 Unit Apartments | 7 | 0.7% |
| 3 or 4 Unit Apartments | 0 | 0.0% |
| 5 to 9 Unit Apartments | 0 | 0.0% |
| 10 or more Apartments | 8 | 0.9% |
| Mobile Home / Other | 50 | 5.4% |
| Total | 928 | 100.0% |
Housing Structures by Occupancy in Timberline-Fernwood
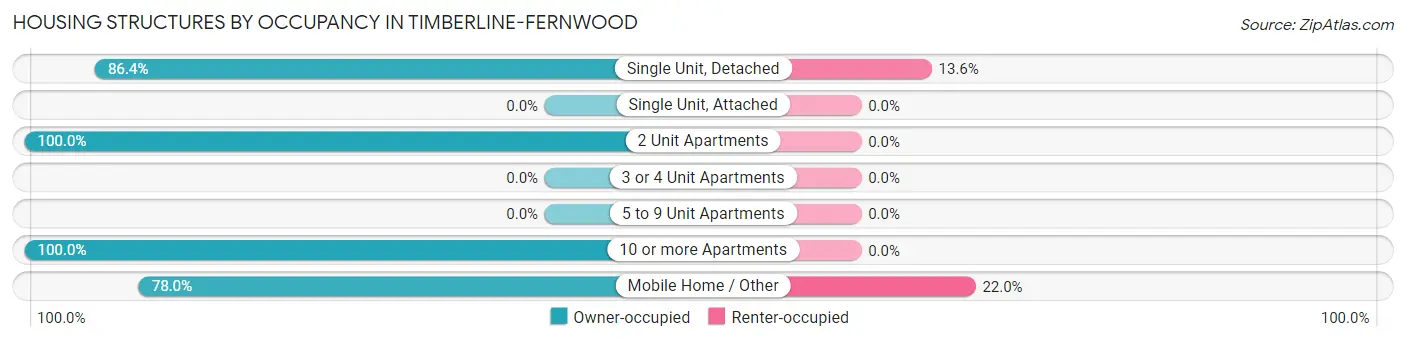
| Structure Type | Owner-occupied | Renter-occupied |
| Single Unit, Detached | 746 (86.4%) | 117 (13.6%) |
| Single Unit, Attached | 0 (0.0%) | 0 (0.0%) |
| 2 Unit Apartments | 7 (100.0%) | 0 (0.0%) |
| 3 or 4 Unit Apartments | 0 (0.0%) | 0 (0.0%) |
| 5 to 9 Unit Apartments | 0 (0.0%) | 0 (0.0%) |
| 10 or more Apartments | 8 (100.0%) | 0 (0.0%) |
| Mobile Home / Other | 39 (78.0%) | 11 (22.0%) |
| Total | 800 (86.2%) | 128 (13.8%) |
Housing Structures by Number of Rooms in Timberline-Fernwood
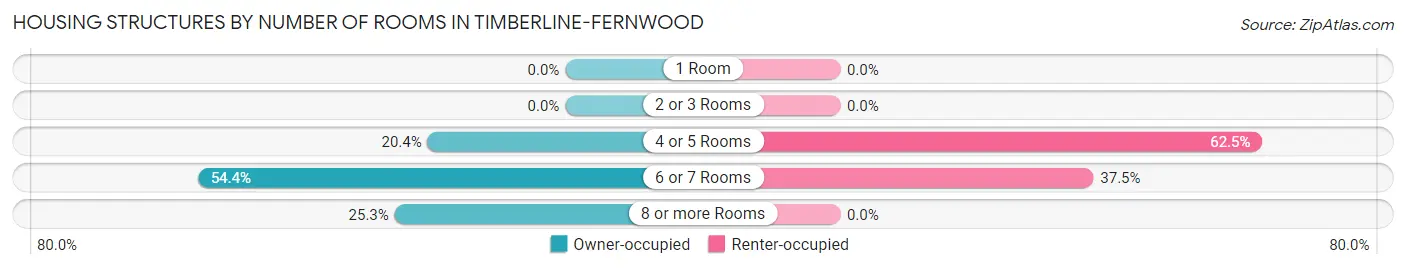
| Number of Rooms | Owner-occupied | Renter-occupied |
| 1 Room | 0 (0.0%) | 0 (0.0%) |
| 2 or 3 Rooms | 0 (0.0%) | 0 (0.0%) |
| 4 or 5 Rooms | 163 (20.4%) | 80 (62.5%) |
| 6 or 7 Rooms | 435 (54.4%) | 48 (37.5%) |
| 8 or more Rooms | 202 (25.3%) | 0 (0.0%) |
| Total | 800 (100.0%) | 128 (100.0%) |
Housing Structure by Heating Type in Timberline-Fernwood
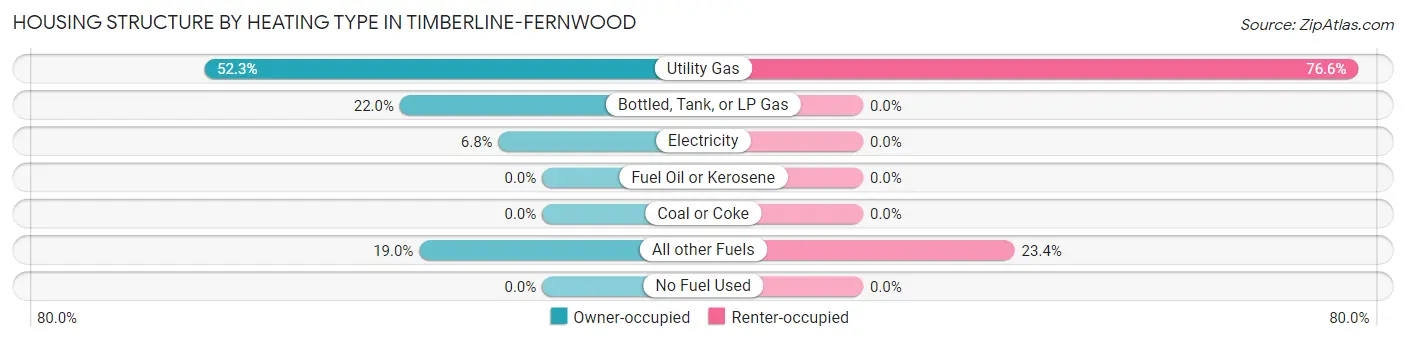
| Heating Type | Owner-occupied | Renter-occupied |
| Utility Gas | 418 (52.2%) | 98 (76.6%) |
| Bottled, Tank, or LP Gas | 176 (22.0%) | 0 (0.0%) |
| Electricity | 54 (6.8%) | 0 (0.0%) |
| Fuel Oil or Kerosene | 0 (0.0%) | 0 (0.0%) |
| Coal or Coke | 0 (0.0%) | 0 (0.0%) |
| All other Fuels | 152 (19.0%) | 30 (23.4%) |
| No Fuel Used | 0 (0.0%) | 0 (0.0%) |
| Total | 800 (100.0%) | 128 (100.0%) |
Household Vehicle Usage in Timberline-Fernwood
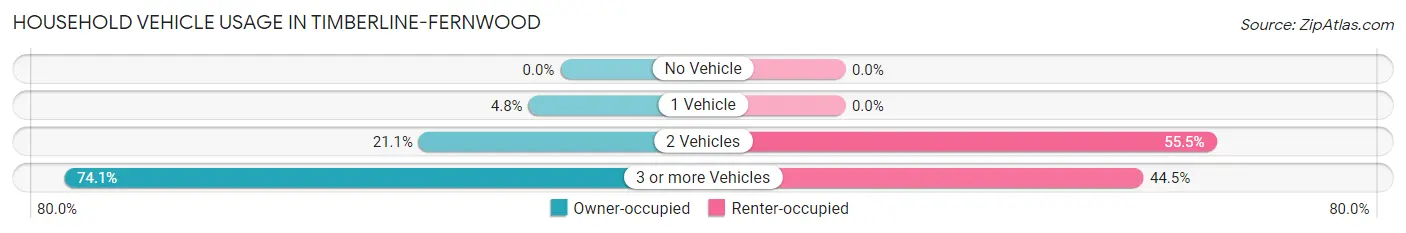
| Vehicles per Household | Owner-occupied | Renter-occupied |
| No Vehicle | 0 (0.0%) | 0 (0.0%) |
| 1 Vehicle | 38 (4.8%) | 0 (0.0%) |
| 2 Vehicles | 169 (21.1%) | 71 (55.5%) |
| 3 or more Vehicles | 593 (74.1%) | 57 (44.5%) |
| Total | 800 (100.0%) | 128 (100.0%) |
Real Estate & Mortgages in Timberline-Fernwood
Real Estate and Mortgage Overview in Timberline-Fernwood
| Characteristic | Without Mortgage | With Mortgage |
| Housing Units | 307 | 493 |
| Median Property Value | $372,000 | $560,200 |
| Median Household Income | $82,426 | $163 |
| Monthly Housing Costs | $448 | $162 |
| Real Estate Taxes | $1,792 | $8 |
Property Value by Mortgage Status in Timberline-Fernwood
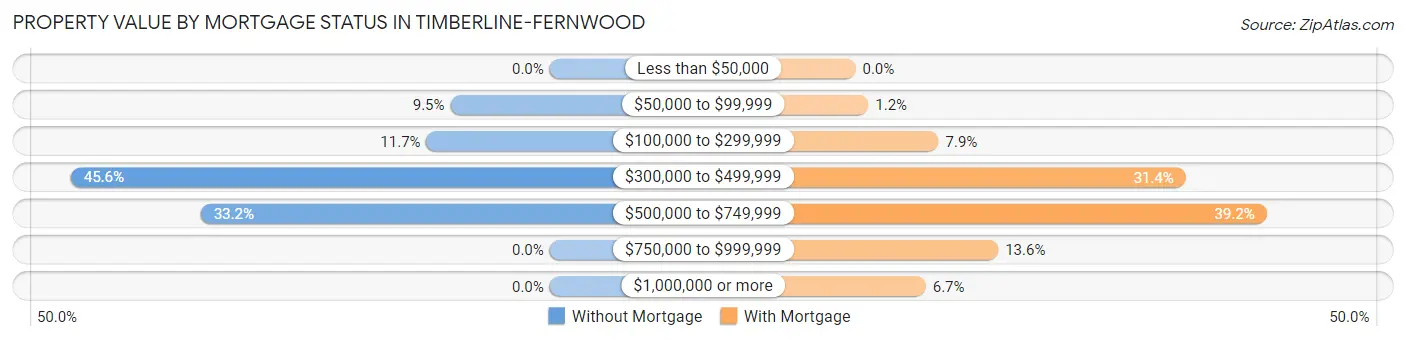
| Property Value | Without Mortgage | With Mortgage |
| Less than $50,000 | 0 (0.0%) | 0 (0.0%) |
| $50,000 to $99,999 | 29 (9.5%) | 6 (1.2%) |
| $100,000 to $299,999 | 36 (11.7%) | 39 (7.9%) |
| $300,000 to $499,999 | 140 (45.6%) | 155 (31.4%) |
| $500,000 to $749,999 | 102 (33.2%) | 193 (39.2%) |
| $750,000 to $999,999 | 0 (0.0%) | 67 (13.6%) |
| $1,000,000 or more | 0 (0.0%) | 33 (6.7%) |
| Total | 307 (100.0%) | 493 (100.0%) |
Household Income by Mortgage Status in Timberline-Fernwood
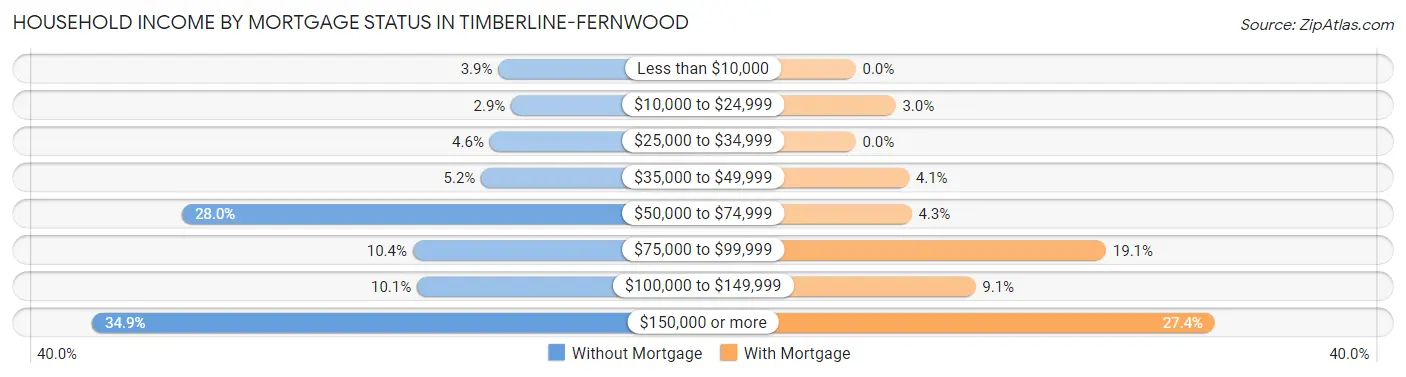
| Household Income | Without Mortgage | With Mortgage |
| Less than $10,000 | 12 (3.9%) | 0 (0.0%) |
| $10,000 to $24,999 | 9 (2.9%) | 15 (3.0%) |
| $25,000 to $34,999 | 14 (4.6%) | 0 (0.0%) |
| $35,000 to $49,999 | 16 (5.2%) | 20 (4.1%) |
| $50,000 to $74,999 | 86 (28.0%) | 21 (4.3%) |
| $75,000 to $99,999 | 32 (10.4%) | 94 (19.1%) |
| $100,000 to $149,999 | 31 (10.1%) | 45 (9.1%) |
| $150,000 or more | 107 (34.8%) | 135 (27.4%) |
| Total | 307 (100.0%) | 493 (100.0%) |
Property Value to Household Income Ratio in Timberline-Fernwood
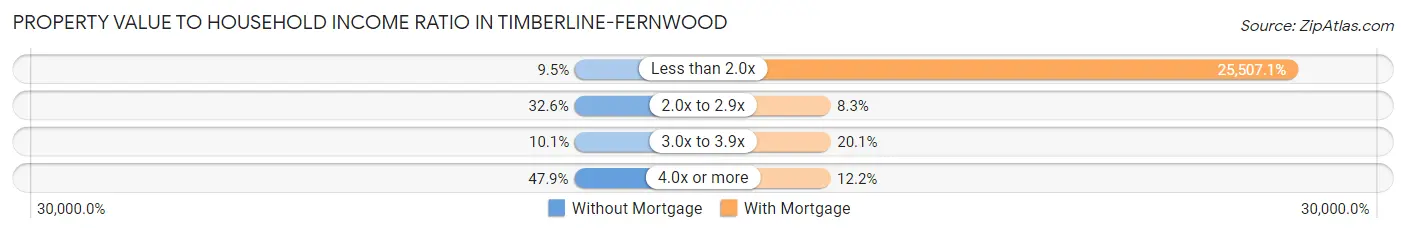
| Value-to-Income Ratio | Without Mortgage | With Mortgage |
| Less than 2.0x | 29 (9.5%) | 125,750 (25,507.1%) |
| 2.0x to 2.9x | 100 (32.6%) | 41 (8.3%) |
| 3.0x to 3.9x | 31 (10.1%) | 99 (20.1%) |
| 4.0x or more | 147 (47.9%) | 60 (12.2%) |
| Total | 307 (100.0%) | 493 (100.0%) |
Real Estate Taxes by Mortgage Status in Timberline-Fernwood
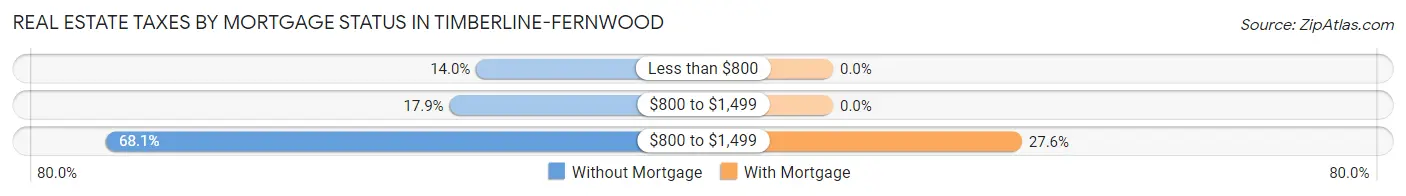
| Property Taxes | Without Mortgage | With Mortgage |
| Less than $800 | 43 (14.0%) | 0 (0.0%) |
| $800 to $1,499 | 55 (17.9%) | 0 (0.0%) |
| $800 to $1,499 | 209 (68.1%) | 136 (27.6%) |
| Total | 307 (100.0%) | 493 (100.0%) |
Health & Disability in Timberline-Fernwood
Health Insurance Coverage by Age in Timberline-Fernwood
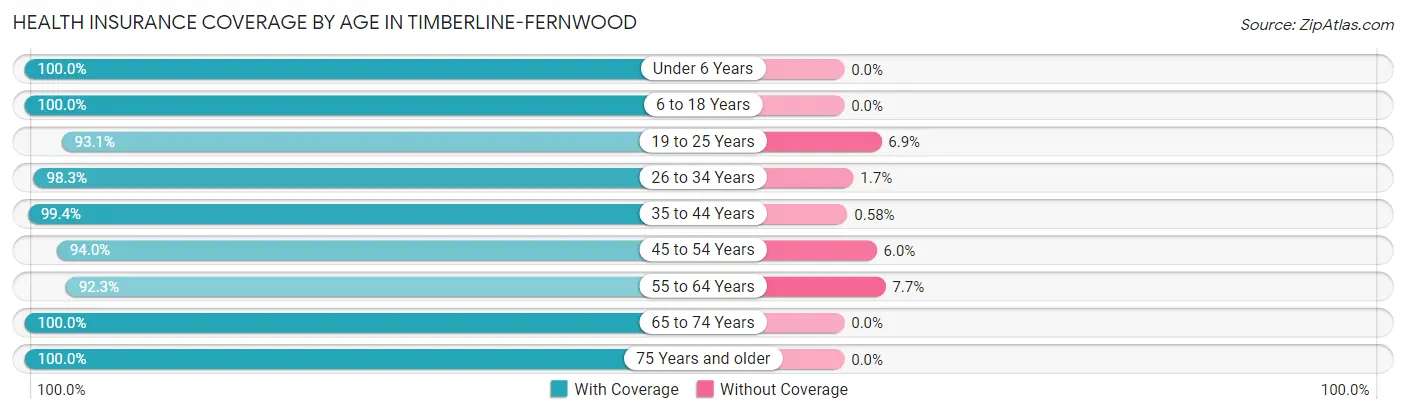
| Age Bracket | With Coverage | Without Coverage |
| Under 6 Years | 205 (100.0%) | 0 (0.0%) |
| 6 to 18 Years | 346 (100.0%) | 0 (0.0%) |
| 19 to 25 Years | 310 (93.1%) | 23 (6.9%) |
| 26 to 34 Years | 289 (98.3%) | 5 (1.7%) |
| 35 to 44 Years | 341 (99.4%) | 2 (0.6%) |
| 45 to 54 Years | 374 (94.0%) | 24 (6.0%) |
| 55 to 64 Years | 433 (92.3%) | 36 (7.7%) |
| 65 to 74 Years | 206 (100.0%) | 0 (0.0%) |
| 75 Years and older | 88 (100.0%) | 0 (0.0%) |
| Total | 2,592 (96.6%) | 90 (3.4%) |
Health Insurance Coverage by Citizenship Status in Timberline-Fernwood
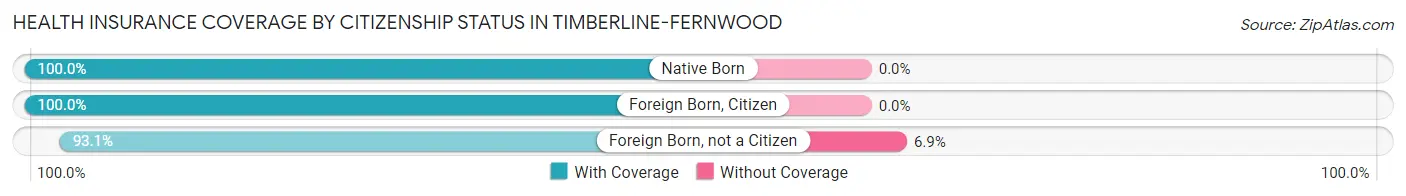
| Citizenship Status | With Coverage | Without Coverage |
| Native Born | 205 (100.0%) | 0 (0.0%) |
| Foreign Born, Citizen | 346 (100.0%) | 0 (0.0%) |
| Foreign Born, not a Citizen | 310 (93.1%) | 23 (6.9%) |
Health Insurance Coverage by Household Income in Timberline-Fernwood
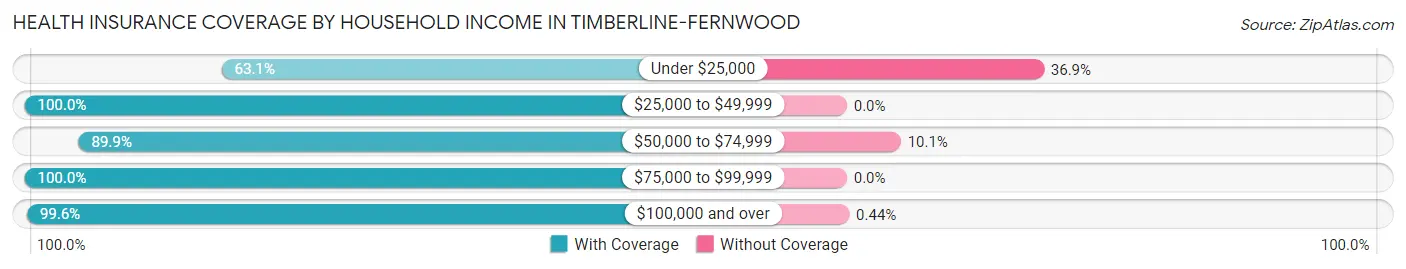
| Household Income | With Coverage | Without Coverage |
| Under $25,000 | 41 (63.1%) | 24 (36.9%) |
| $25,000 to $49,999 | 215 (100.0%) | 0 (0.0%) |
| $50,000 to $74,999 | 525 (89.9%) | 59 (10.1%) |
| $75,000 to $99,999 | 232 (100.0%) | 0 (0.0%) |
| $100,000 and over | 1,568 (99.6%) | 7 (0.4%) |
Public vs Private Health Insurance Coverage by Age in Timberline-Fernwood
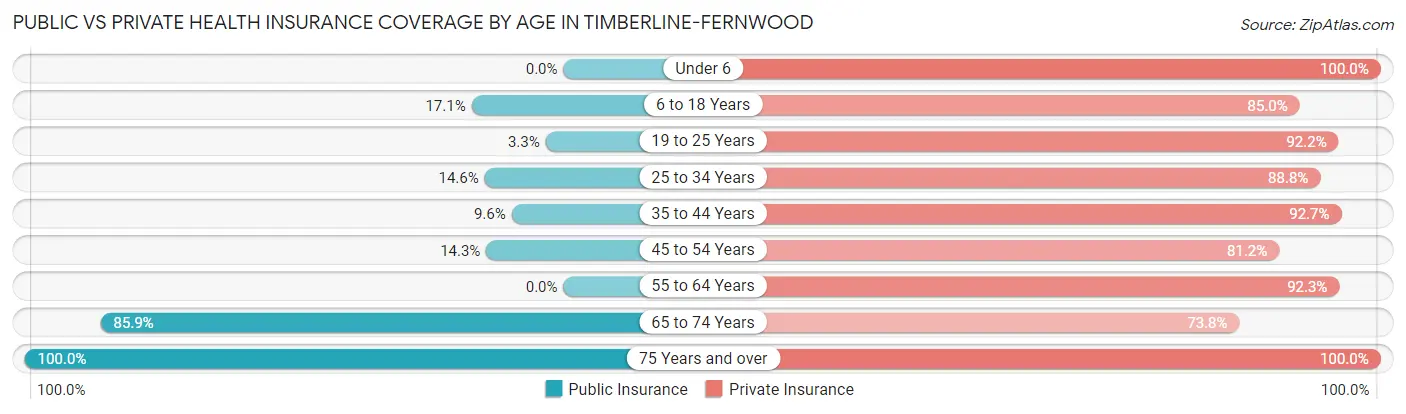
| Age Bracket | Public Insurance | Private Insurance |
| Under 6 | 0 (0.0%) | 205 (100.0%) |
| 6 to 18 Years | 59 (17.1%) | 294 (85.0%) |
| 19 to 25 Years | 11 (3.3%) | 307 (92.2%) |
| 25 to 34 Years | 43 (14.6%) | 261 (88.8%) |
| 35 to 44 Years | 33 (9.6%) | 318 (92.7%) |
| 45 to 54 Years | 57 (14.3%) | 323 (81.2%) |
| 55 to 64 Years | 0 (0.0%) | 433 (92.3%) |
| 65 to 74 Years | 177 (85.9%) | 152 (73.8%) |
| 75 Years and over | 88 (100.0%) | 88 (100.0%) |
| Total | 468 (17.4%) | 2,381 (88.8%) |
Disability Status by Sex by Age in Timberline-Fernwood
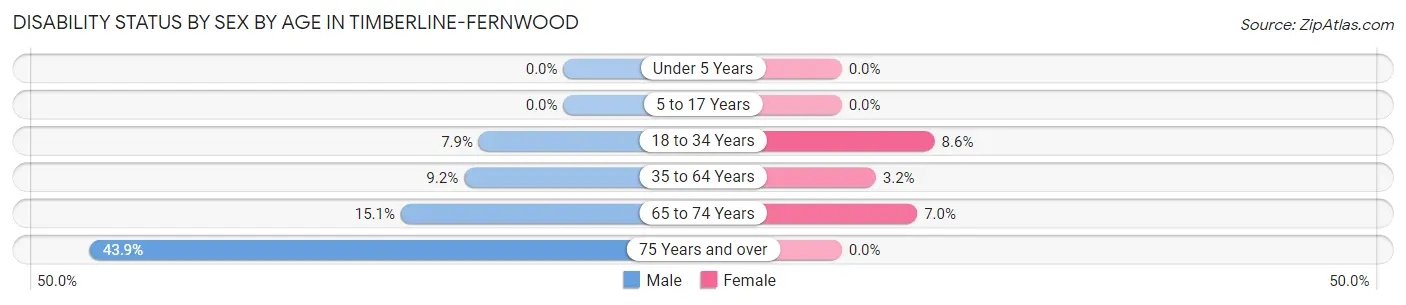
| Age Bracket | Male | Female |
| Under 5 Years | 0 (0.0%) | 0 (0.0%) |
| 5 to 17 Years | 0 (0.0%) | 0 (0.0%) |
| 18 to 34 Years | 31 (7.9%) | 20 (8.6%) |
| 35 to 64 Years | 59 (9.2%) | 18 (3.2%) |
| 65 to 74 Years | 16 (15.1%) | 7 (7.0%) |
| 75 Years and over | 29 (43.9%) | 0 (0.0%) |
Disability Class by Sex by Age in Timberline-Fernwood
Disability Class: Hearing Difficulty
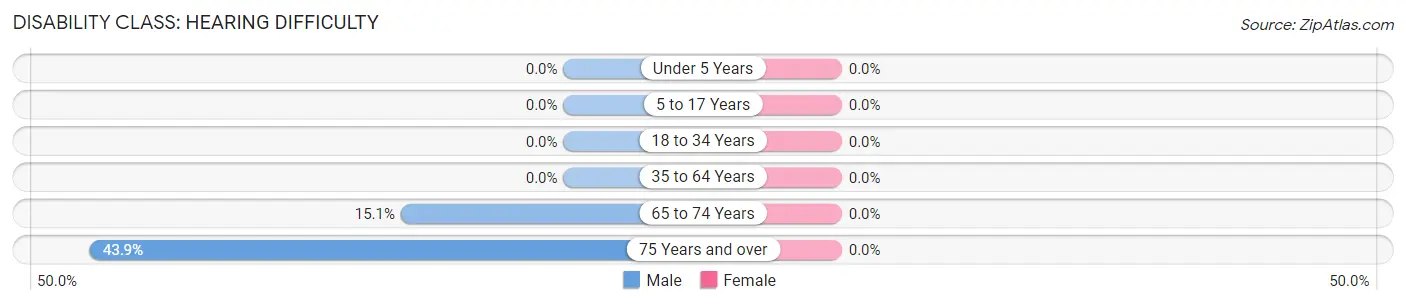
| Age Bracket | Male | Female |
| Under 5 Years | 0 (0.0%) | 0 (0.0%) |
| 5 to 17 Years | 0 (0.0%) | 0 (0.0%) |
| 18 to 34 Years | 0 (0.0%) | 0 (0.0%) |
| 35 to 64 Years | 0 (0.0%) | 0 (0.0%) |
| 65 to 74 Years | 16 (15.1%) | 0 (0.0%) |
| 75 Years and over | 29 (43.9%) | 0 (0.0%) |
Disability Class: Vision Difficulty
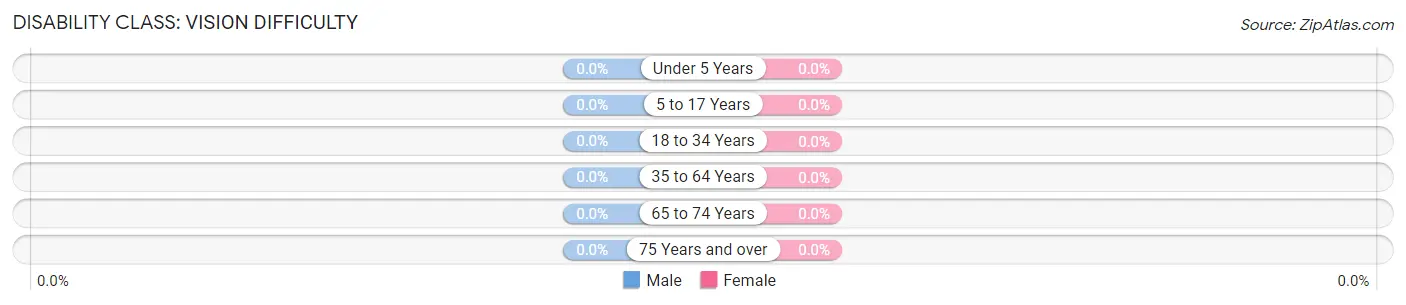
| Age Bracket | Male | Female |
| Under 5 Years | 0 (0.0%) | 0 (0.0%) |
| 5 to 17 Years | 0 (0.0%) | 0 (0.0%) |
| 18 to 34 Years | 0 (0.0%) | 0 (0.0%) |
| 35 to 64 Years | 0 (0.0%) | 0 (0.0%) |
| 65 to 74 Years | 0 (0.0%) | 0 (0.0%) |
| 75 Years and over | 0 (0.0%) | 0 (0.0%) |
Disability Class: Cognitive Difficulty
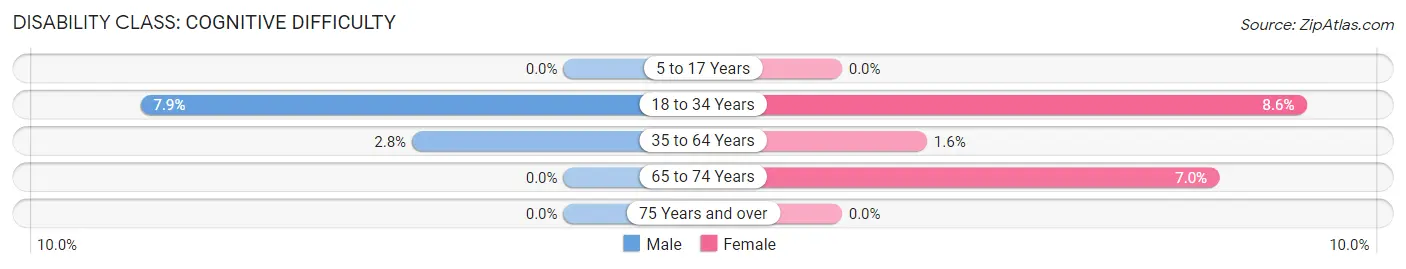
| Age Bracket | Male | Female |
| 5 to 17 Years | 0 (0.0%) | 0 (0.0%) |
| 18 to 34 Years | 31 (7.9%) | 20 (8.6%) |
| 35 to 64 Years | 18 (2.8%) | 9 (1.6%) |
| 65 to 74 Years | 0 (0.0%) | 7 (7.0%) |
| 75 Years and over | 0 (0.0%) | 0 (0.0%) |
Disability Class: Ambulatory Difficulty
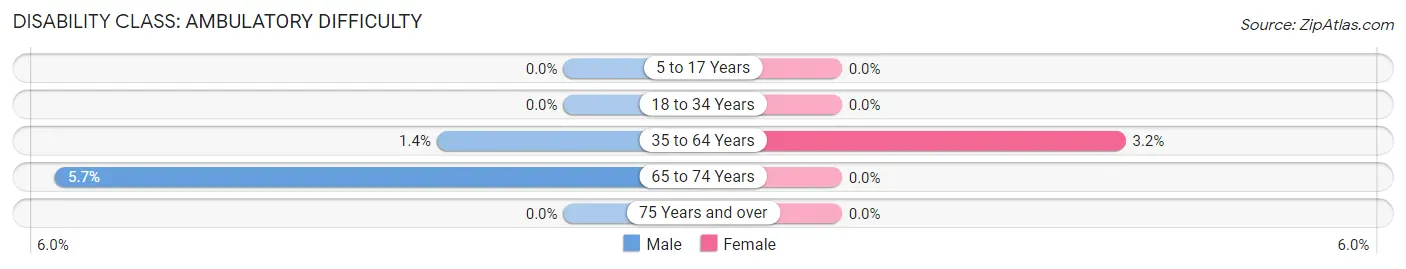
| Age Bracket | Male | Female |
| 5 to 17 Years | 0 (0.0%) | 0 (0.0%) |
| 18 to 34 Years | 0 (0.0%) | 0 (0.0%) |
| 35 to 64 Years | 9 (1.4%) | 18 (3.2%) |
| 65 to 74 Years | 6 (5.7%) | 0 (0.0%) |
| 75 Years and over | 0 (0.0%) | 0 (0.0%) |
Disability Class: Self-Care Difficulty
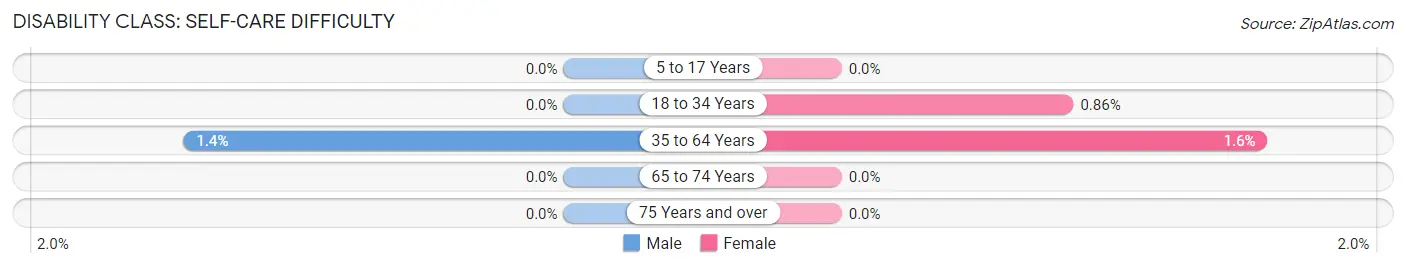
| Age Bracket | Male | Female |
| 5 to 17 Years | 0 (0.0%) | 0 (0.0%) |
| 18 to 34 Years | 0 (0.0%) | 2 (0.9%) |
| 35 to 64 Years | 9 (1.4%) | 9 (1.6%) |
| 65 to 74 Years | 0 (0.0%) | 0 (0.0%) |
| 75 Years and over | 0 (0.0%) | 0 (0.0%) |
Technology Access in Timberline-Fernwood
Computing Device Access in Timberline-Fernwood
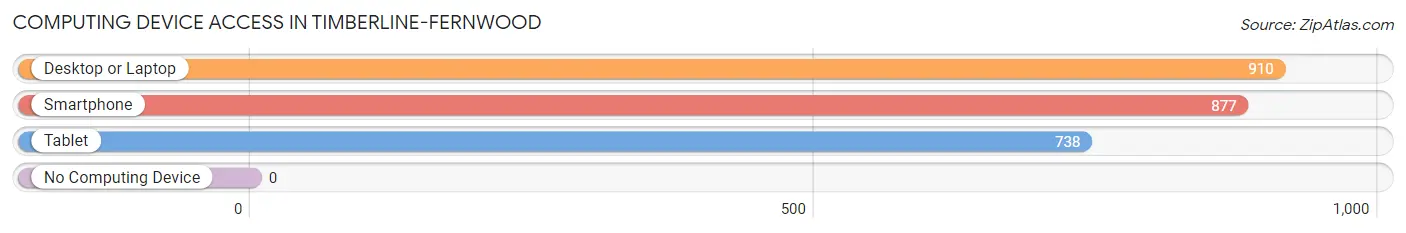
| Device Type | # Households | % Households |
| Desktop or Laptop | 910 | 98.1% |
| Smartphone | 877 | 94.5% |
| Tablet | 738 | 79.5% |
| No Computing Device | 0 | 0.0% |
| Total | 928 | 100.0% |
Internet Access in Timberline-Fernwood
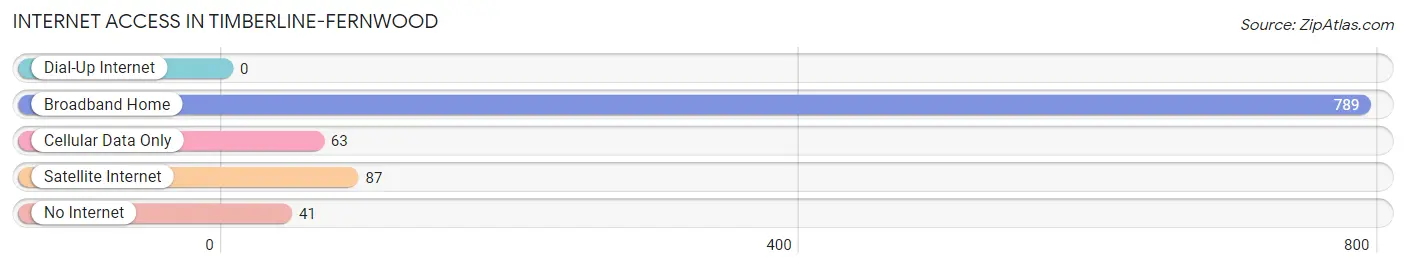
| Internet Type | # Households | % Households |
| Dial-Up Internet | 0 | 0.0% |
| Broadband Home | 789 | 85.0% |
| Cellular Data Only | 63 | 6.8% |
| Satellite Internet | 87 | 9.4% |
| No Internet | 41 | 4.4% |
| Total | 928 | 100.0% |
Common Questions
What is Per Capita Income in Timberline-Fernwood?
Per Capita income in Timberline-Fernwood is $46,210.
What is the Median Family Income in Timberline-Fernwood?
Median Family Income in Timberline-Fernwood is $117,955.
What is the Median Household income in Timberline-Fernwood?
Median Household Income in Timberline-Fernwood is $120,203.
What is Income or Wage Gap in Timberline-Fernwood?
Income or Wage Gap in Timberline-Fernwood is 8.5%.
Women in Timberline-Fernwood earn 91.5 cents for every dollar earned by a man.
What is Inequality or Gini Index in Timberline-Fernwood?
Inequality or Gini Index in Timberline-Fernwood is 0.35.
What is the Total Population of Timberline-Fernwood?
Total Population of Timberline-Fernwood is 2,685.
What is the Total Male Population of Timberline-Fernwood?
Total Male Population of Timberline-Fernwood is 1,526.
What is the Total Female Population of Timberline-Fernwood?
Total Female Population of Timberline-Fernwood is 1,159.
What is the Ratio of Males per 100 Females in Timberline-Fernwood?
There are 131.67 Males per 100 Females in Timberline-Fernwood.
What is the Ratio of Females per 100 Males in Timberline-Fernwood?
There are 75.95 Females per 100 Males in Timberline-Fernwood.
What is the Median Population Age in Timberline-Fernwood?
Median Population Age in Timberline-Fernwood is 40.5 Years.
What is the Average Family Size in Timberline-Fernwood
Average Family Size in Timberline-Fernwood is 3.1 People.
What is the Average Household Size in Timberline-Fernwood
Average Household Size in Timberline-Fernwood is 2.9 People.
How Large is the Labor Force in Timberline-Fernwood?
There are 1,529 People in the Labor Forcein in Timberline-Fernwood.
What is the Percentage of People in the Labor Force in Timberline-Fernwood?
69.3% of People are in the Labor Force in Timberline-Fernwood.
What is the Unemployment Rate in Timberline-Fernwood?
Unemployment Rate in Timberline-Fernwood is 4.2%.