Hackberry, AZ Map & Demographics
Hackberry Map
Hackberry Overview
$45,250
PER CAPITA INCOME
37.0%
WAGE / INCOME GAP [ % ]
63.0¢/ $1
WAGE / INCOME GAP [ $ ]
0.40
INEQUALITY / GINI INDEX
319
TOTAL POPULATION
152
MALE POPULATION
167
FEMALE POPULATION
91.02
MALES / 100 FEMALES
109.87
FEMALES / 100 MALES
40.9
MEDIAN AGE
2.4
AVG FAMILY SIZE
2.2
AVG HOUSEHOLD SIZE
169
LABOR FORCE [ PEOPLE ]
56.5%
PERCENT IN LABOR FORCE
Hackberry Zip Codes
Hackberry Area Codes
Income in Hackberry
Income Overview in Hackberry
| Characteristic | Number | Measure |
| Per Capita Income | 319 | $45,250 |
| Median Family Income | 114 | $0 |
| Mean Family Income | 114 | $107,646 |
| Median Household Income | 146 | $0 |
| Mean Household Income | 146 | $91,199 |
| Income Deficit | 114 | $0 |
| Wage / Income Gap (%) | 319 | 37.02% |
| Wage / Income Gap ($) | 319 | 62.98¢ per $1 |
| Gini / Inequality Index | 319 | 0.40 |
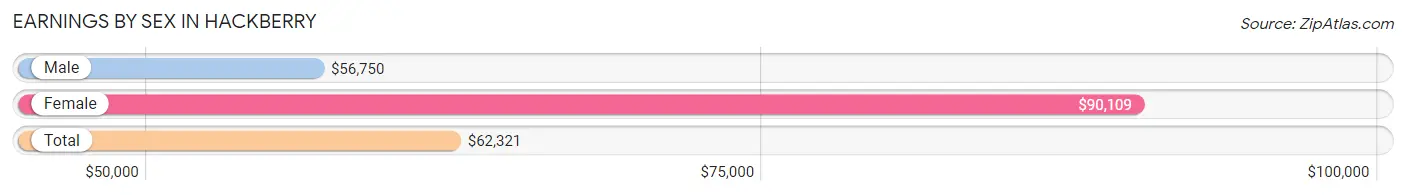
Earnings by Sex in Hackberry
Average Earnings in Hackberry are $62,321, $56,750 for men and $90,109 for women, a difference of 37.0%.
| Sex | Number | Average Earnings |
| Male | 125 (74.0%) | $56,750 |
| Female | 44 (26.0%) | $90,109 |
| Total | 169 (100.0%) | $62,321 |
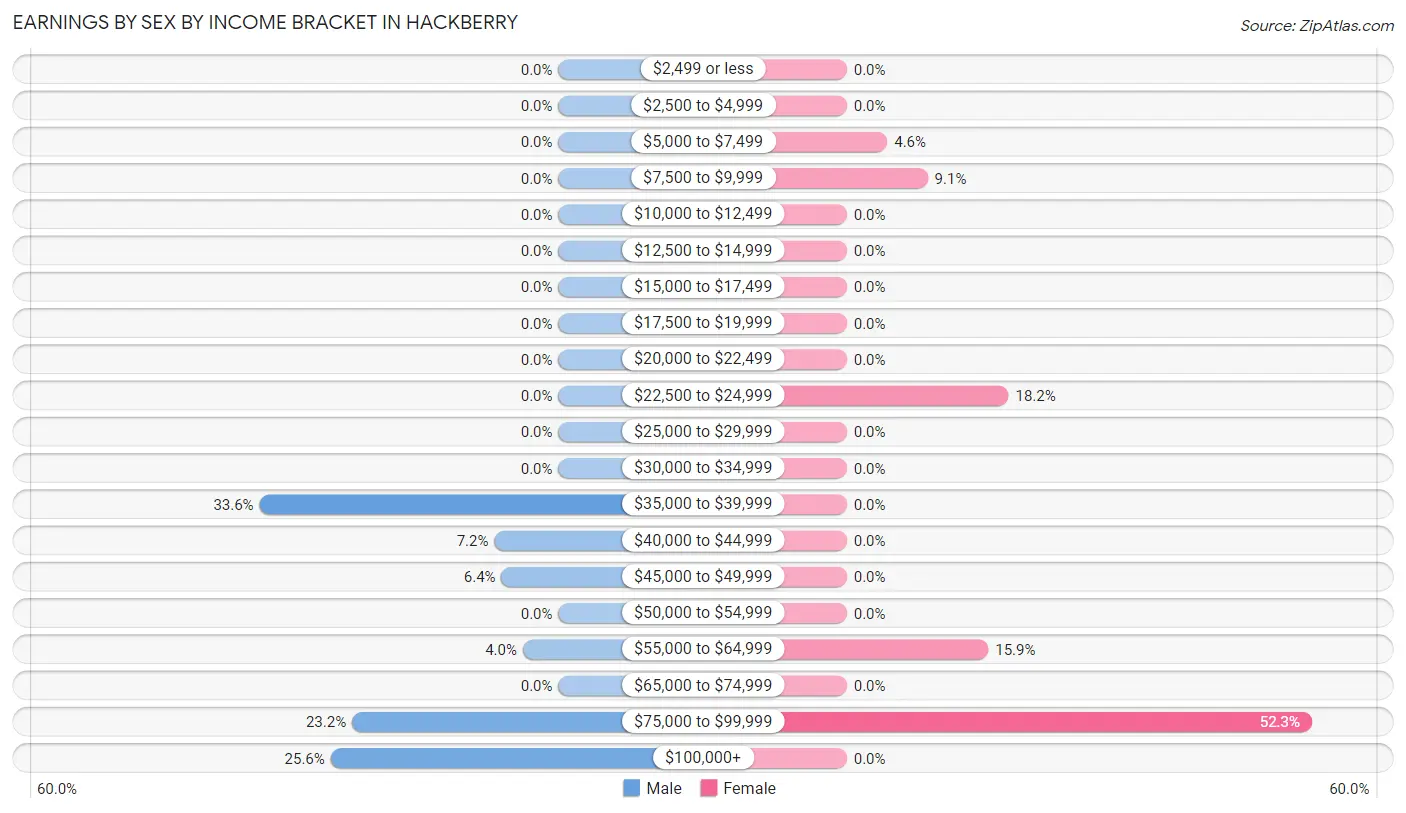
Earnings by Sex by Income Bracket in Hackberry
The most common earnings brackets in Hackberry are $35,000 to $39,999 for men (42 | 33.6%) and $75,000 to $99,999 for women (23 | 52.3%).
| Income | Male | Female |
| $2,499 or less | 0 (0.0%) | 0 (0.0%) |
| $2,500 to $4,999 | 0 (0.0%) | 0 (0.0%) |
| $5,000 to $7,499 | 0 (0.0%) | 2 (4.5%) |
| $7,500 to $9,999 | 0 (0.0%) | 4 (9.1%) |
| $10,000 to $12,499 | 0 (0.0%) | 0 (0.0%) |
| $12,500 to $14,999 | 0 (0.0%) | 0 (0.0%) |
| $15,000 to $17,499 | 0 (0.0%) | 0 (0.0%) |
| $17,500 to $19,999 | 0 (0.0%) | 0 (0.0%) |
| $20,000 to $22,499 | 0 (0.0%) | 0 (0.0%) |
| $22,500 to $24,999 | 0 (0.0%) | 8 (18.2%) |
| $25,000 to $29,999 | 0 (0.0%) | 0 (0.0%) |
| $30,000 to $34,999 | 0 (0.0%) | 0 (0.0%) |
| $35,000 to $39,999 | 42 (33.6%) | 0 (0.0%) |
| $40,000 to $44,999 | 9 (7.2%) | 0 (0.0%) |
| $45,000 to $49,999 | 8 (6.4%) | 0 (0.0%) |
| $50,000 to $54,999 | 0 (0.0%) | 0 (0.0%) |
| $55,000 to $64,999 | 5 (4.0%) | 7 (15.9%) |
| $65,000 to $74,999 | 0 (0.0%) | 0 (0.0%) |
| $75,000 to $99,999 | 29 (23.2%) | 23 (52.3%) |
| $100,000+ | 32 (25.6%) | 0 (0.0%) |
| Total | 125 (100.0%) | 44 (100.0%) |
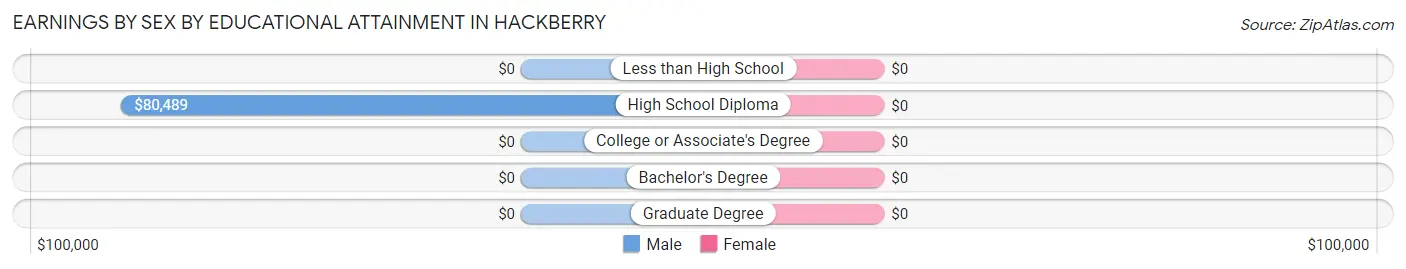
Earnings by Sex by Educational Attainment in Hackberry
| Educational Attainment | Male Income | Female Income |
| Less than High School | - | - |
| High School Diploma | $80,489 | $0 |
| College or Associate's Degree | - | - |
| Bachelor's Degree | - | - |
| Graduate Degree | - | - |
| Total | $56,750 | $90,109 |
Family Income in Hackberry
Family Income Brackets in Hackberry
According to the Hackberry family income data, there are 43 families falling into the $35,000 to $49,999 income range, which is the most common income bracket and makes up 37.7% of all families.
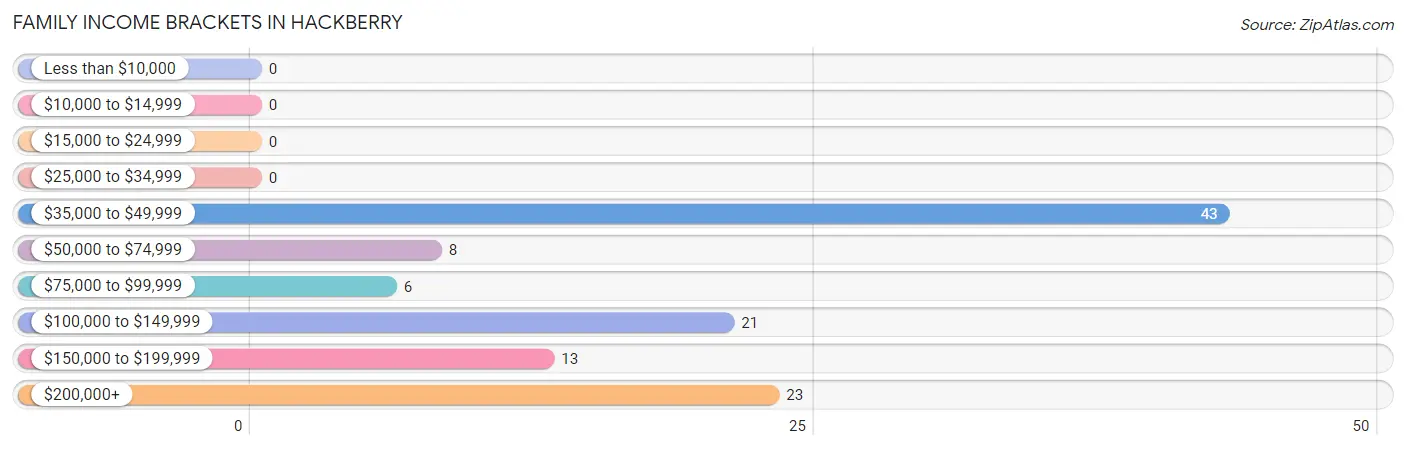
| Income Bracket | # Families | % Families |
| Less than $10,000 | 0 | 0.0% |
| $10,000 to $14,999 | 0 | 0.0% |
| $15,000 to $24,999 | 0 | 0.0% |
| $25,000 to $34,999 | 0 | 0.0% |
| $35,000 to $49,999 | 43 | 37.7% |
| $50,000 to $74,999 | 8 | 7.0% |
| $75,000 to $99,999 | 6 | 5.3% |
| $100,000 to $149,999 | 21 | 18.4% |
| $150,000 to $199,999 | 13 | 11.4% |
| $200,000+ | 23 | 20.2% |
Family Income by Famaliy Size in Hackberry
| Income Bracket | # Families | Median Income |
| 2-Person Families | 87 (76.3%) | $0 |
| 3-Person Families | 21 (18.4%) | $0 |
| 4-Person Families | 6 (5.3%) | $0 |
| 5-Person Families | 0 (0.0%) | $0 |
| 6-Person Families | 0 (0.0%) | $0 |
| 7+ Person Families | 0 (0.0%) | $0 |
| Total | 114 (100.0%) | $0 |
Family Income by Number of Earners in Hackberry
| Number of Earners | # Families | Median Income |
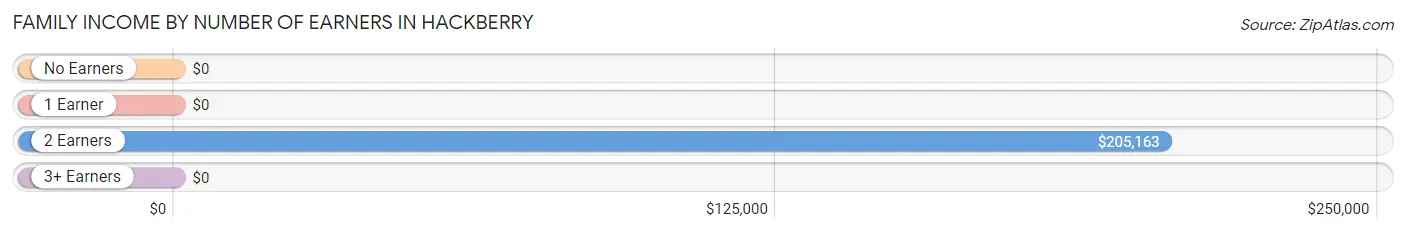
| No Earners | 7 (6.1%) | $0 |
| 1 Earner | 64 (56.1%) | $0 |
| 2 Earners | 43 (37.7%) | $205,163 |
| 3+ Earners | 0 (0.0%) | $0 |
| Total | 114 (100.0%) | $0 |
Household Income in Hackberry
Household Income Brackets in Hackberry
With 64 households falling in the category, the $35,000 to $49,999 income range is the most frequent in Hackberry, accounting for 43.8% of all households.
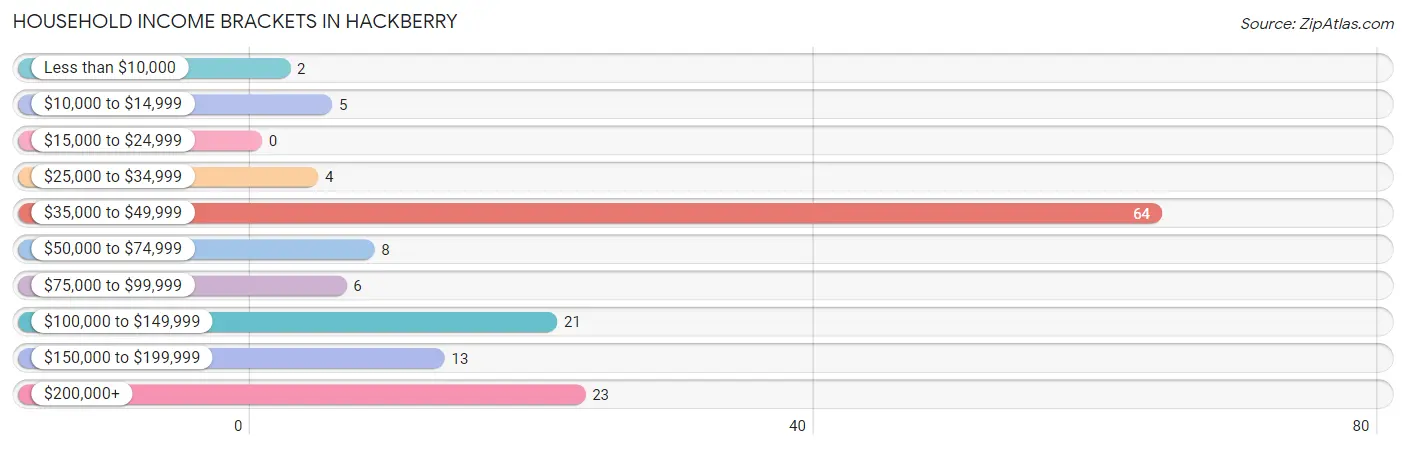
| Income Bracket | # Households | % Households |
| Less than $10,000 | 2 | 1.4% |
| $10,000 to $14,999 | 5 | 3.4% |
| $15,000 to $24,999 | 0 | 0.0% |
| $25,000 to $34,999 | 4 | 2.7% |
| $35,000 to $49,999 | 64 | 43.8% |
| $50,000 to $74,999 | 8 | 5.5% |
| $75,000 to $99,999 | 6 | 4.1% |
| $100,000 to $149,999 | 21 | 14.4% |
| $150,000 to $199,999 | 13 | 8.9% |
| $200,000+ | 23 | 15.8% |
Household Income by Householder Age in Hackberry
| Income Bracket | # Households | Median Income |
| 15 to 24 Years | 0 (0.0%) | $0 |
| 25 to 44 Years | 64 (43.8%) | $0 |
| 45 to 64 Years | 62 (42.5%) | $0 |
| 65+ Years | 20 (13.7%) | $0 |
| Total | 146 (100.0%) | $0 |
Poverty in Hackberry
Income Below Poverty by Sex and Age in Hackberry
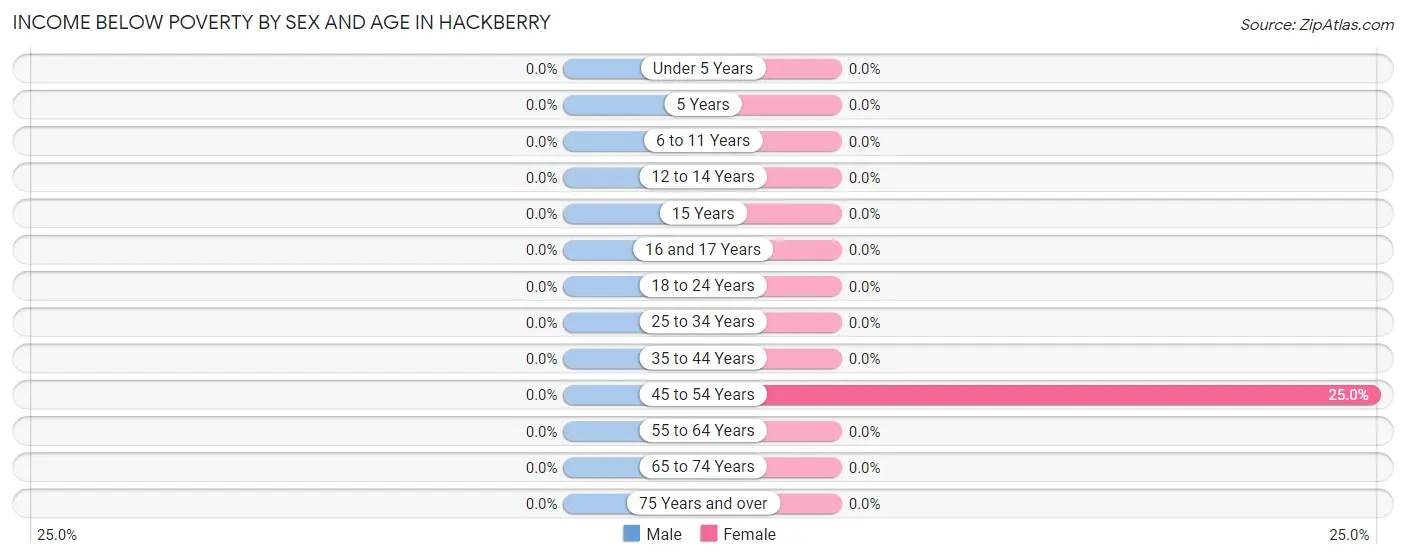
| Age Bracket | Male | Female |
| Under 5 Years | 0 (0.0%) | 0 (0.0%) |
| 5 Years | 0 (0.0%) | 0 (0.0%) |
| 6 to 11 Years | 0 (0.0%) | 0 (0.0%) |
| 12 to 14 Years | 0 (0.0%) | 0 (0.0%) |
| 15 Years | 0 (0.0%) | 0 (0.0%) |
| 16 and 17 Years | 0 (0.0%) | 0 (0.0%) |
| 18 to 24 Years | 0 (0.0%) | 0 (0.0%) |
| 25 to 34 Years | 0 (0.0%) | 0 (0.0%) |
| 35 to 44 Years | 0 (0.0%) | 0 (0.0%) |
| 45 to 54 Years | 0 (0.0%) | 2 (25.0%) |
| 55 to 64 Years | 0 (0.0%) | 0 (0.0%) |
| 65 to 74 Years | 0 (0.0%) | 0 (0.0%) |
| 75 Years and over | 0 (0.0%) | 0 (0.0%) |
| Total | 0 (0.0%) | 2 (1.2%) |
Income Above Poverty by Sex and Age in Hackberry
According to the poverty statistics in Hackberry, males aged 25 to 34 years and females aged under 5 years are the age groups that are most secure financially, with 100.0% of males and 100.0% of females in these age groups living above the poverty line.
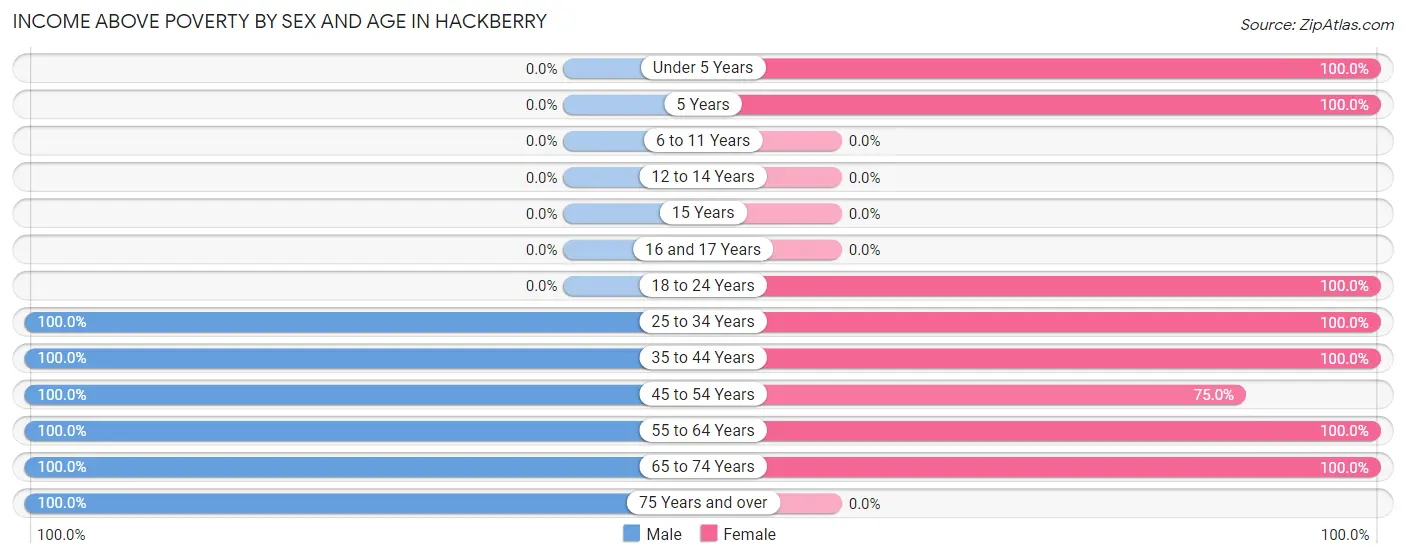
| Age Bracket | Male | Female |
| Under 5 Years | 0 (0.0%) | 15 (100.0%) |
| 5 Years | 0 (0.0%) | 5 (100.0%) |
| 6 to 11 Years | 0 (0.0%) | 0 (0.0%) |
| 12 to 14 Years | 0 (0.0%) | 0 (0.0%) |
| 15 Years | 0 (0.0%) | 0 (0.0%) |
| 16 and 17 Years | 0 (0.0%) | 0 (0.0%) |
| 18 to 24 Years | 0 (0.0%) | 5 (100.0%) |
| 25 to 34 Years | 38 (100.0%) | 21 (100.0%) |
| 35 to 44 Years | 42 (100.0%) | 43 (100.0%) |
| 45 to 54 Years | 11 (100.0%) | 6 (75.0%) |
| 55 to 64 Years | 51 (100.0%) | 55 (100.0%) |
| 65 to 74 Years | 5 (100.0%) | 15 (100.0%) |
| 75 Years and over | 5 (100.0%) | 0 (0.0%) |
| Total | 152 (100.0%) | 165 (98.8%) |
Income Below Poverty Among Married-Couple Families in Hackberry
| Children | Above Poverty | Below Poverty |
| No Children | 93 (100.0%) | 0 (0.0%) |
| 1 or 2 Children | 21 (100.0%) | 0 (0.0%) |
| 3 or 4 Children | 0 (0.0%) | 0 (0.0%) |
| 5 or more Children | 0 (0.0%) | 0 (0.0%) |
| Total | 114 (100.0%) | 0 (0.0%) |
Income Below Poverty Among Single-Parent Households in Hackberry
| Children | Single Father | Single Mother |
| No Children | 0 (0.0%) | 0 (0.0%) |
| 1 or 2 Children | 0 (0.0%) | 0 (0.0%) |
| 3 or 4 Children | 0 (0.0%) | 0 (0.0%) |
| 5 or more Children | 0 (0.0%) | 0 (0.0%) |
| Total | 0 (0.0%) | 0 (0.0%) |
Income Below Poverty Among Married-Couple vs Single-Parent Households in Hackberry
| Children | Married-Couple Families | Single-Parent Households |
| No Children | 0 (0.0%) | 0 (0.0%) |
| 1 or 2 Children | 0 (0.0%) | 0 (0.0%) |
| 3 or 4 Children | 0 (0.0%) | 0 (0.0%) |
| 5 or more Children | 0 (0.0%) | 0 (0.0%) |
| Total | 0 (0.0%) | 0 (0.0%) |
Race in Hackberry
The most populous races in Hackberry are , and White / Caucasian (319 | 100.0%).
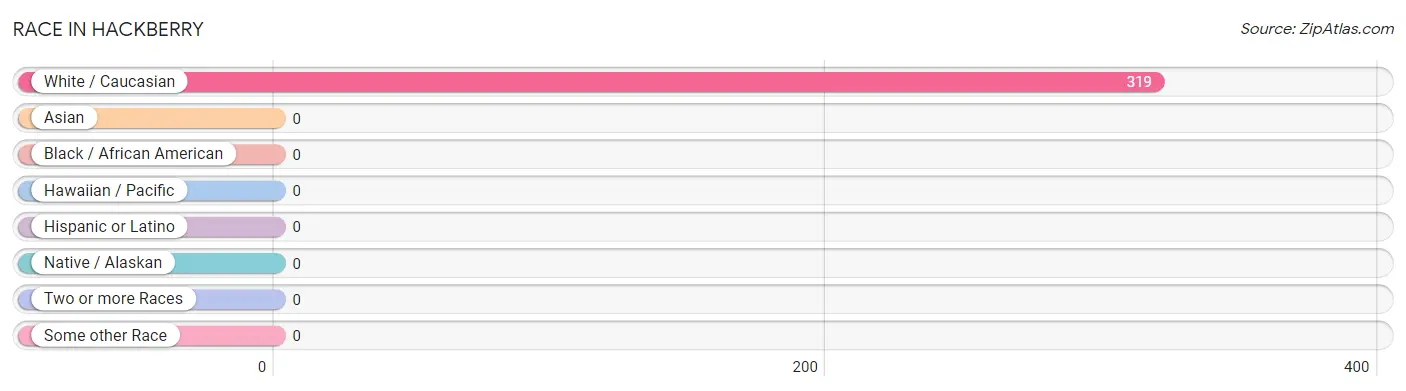
| Race | # Population | % Population |
| Asian | 0 | 0.0% |
| Black / African American | 0 | 0.0% |
| Hawaiian / Pacific | 0 | 0.0% |
| Hispanic or Latino | 0 | 0.0% |
| Native / Alaskan | 0 | 0.0% |
| White / Caucasian | 319 | 100.0% |
| Two or more Races | 0 | 0.0% |
| Some other Race | 0 | 0.0% |
| Total | 319 | 100.0% |
Ancestry in Hackberry
The most populous ancestries reported in Hackberry are German (97 | 30.4%), English (71 | 22.3%), Irish (34 | 10.7%), Israeli (26 | 8.2%), and Scotch-Irish (22 | 6.9%), together accounting for 78.4% of all Hackberry residents.
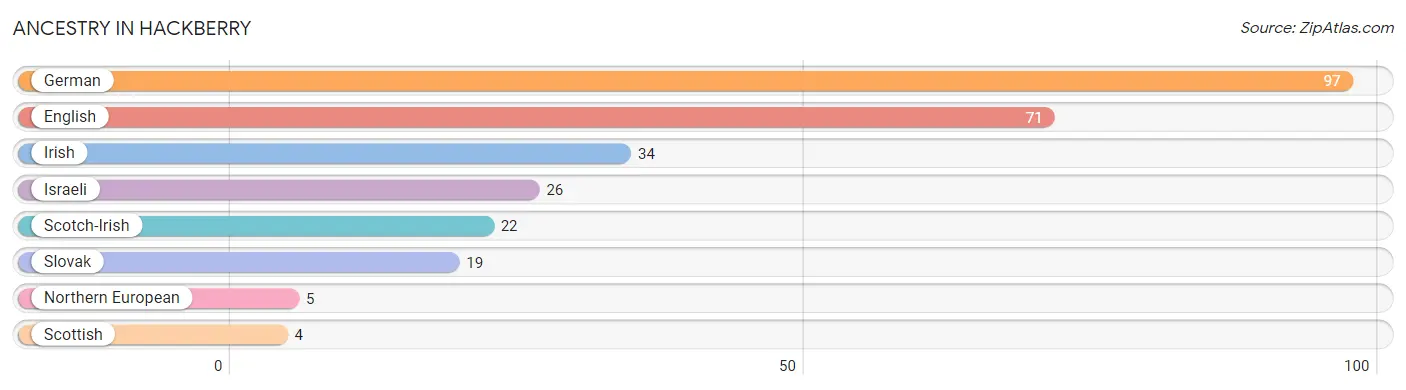
| Ancestry | # Population | % Population |
| English | 71 | 22.3% |
| German | 97 | 30.4% |
| Irish | 34 | 10.7% |
| Israeli | 26 | 8.2% |
| Northern European | 5 | 1.6% |
| Scotch-Irish | 22 | 6.9% |
| Scottish | 4 | 1.3% |
| Slovak | 19 | 6.0% | View All 8 Rows |
Immigrants in Hackberry

| Immigration Origin | # Population | % Population | View All 0 Rows |
Sex and Age in Hackberry
Sex and Age in Hackberry
The most populous age groups in Hackberry are 40 to 44 Years (42 | 27.6%) for men and 40 to 44 Years (43 | 25.8%) for women.
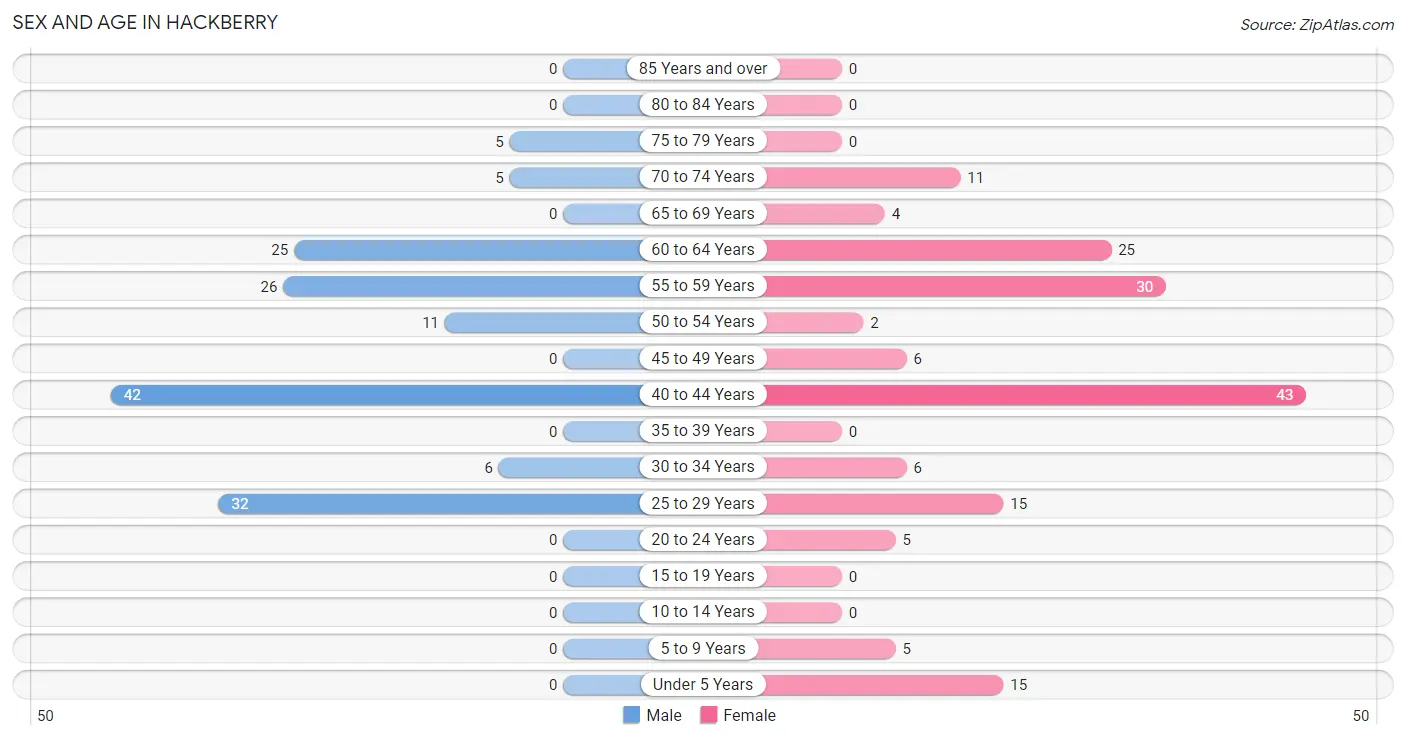
| Age Bracket | Male | Female |
| Under 5 Years | 0 (0.0%) | 15 (9.0%) |
| 5 to 9 Years | 0 (0.0%) | 5 (3.0%) |
| 10 to 14 Years | 0 (0.0%) | 0 (0.0%) |
| 15 to 19 Years | 0 (0.0%) | 0 (0.0%) |
| 20 to 24 Years | 0 (0.0%) | 5 (3.0%) |
| 25 to 29 Years | 32 (21.0%) | 15 (9.0%) |
| 30 to 34 Years | 6 (4.0%) | 6 (3.6%) |
| 35 to 39 Years | 0 (0.0%) | 0 (0.0%) |
| 40 to 44 Years | 42 (27.6%) | 43 (25.8%) |
| 45 to 49 Years | 0 (0.0%) | 6 (3.6%) |
| 50 to 54 Years | 11 (7.2%) | 2 (1.2%) |
| 55 to 59 Years | 26 (17.1%) | 30 (18.0%) |
| 60 to 64 Years | 25 (16.5%) | 25 (15.0%) |
| 65 to 69 Years | 0 (0.0%) | 4 (2.4%) |
| 70 to 74 Years | 5 (3.3%) | 11 (6.6%) |
| 75 to 79 Years | 5 (3.3%) | 0 (0.0%) |
| 80 to 84 Years | 0 (0.0%) | 0 (0.0%) |
| 85 Years and over | 0 (0.0%) | 0 (0.0%) |
| Total | 152 (100.0%) | 167 (100.0%) |
Families and Households in Hackberry
Median Family Size in Hackberry
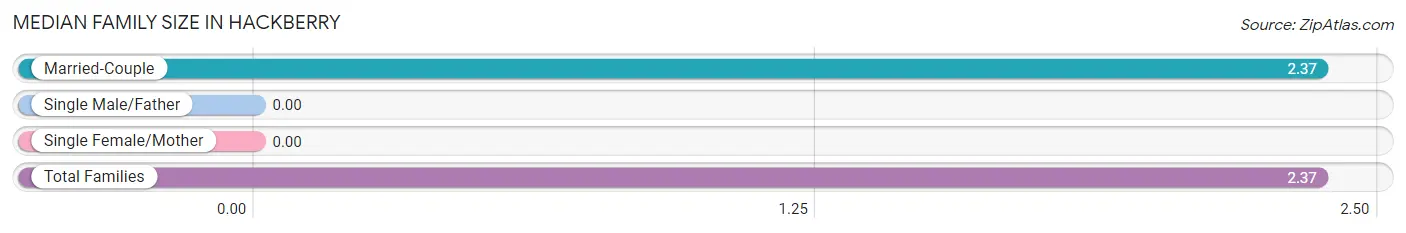
| Family Type | # Families | Family Size |
| Married-Couple | 114 (100.0%) | 2.37 |
| Single Male/Father | 0 (0.0%) | - |
| Single Female/Mother | 0 (0.0%) | - |
| Total Families | 114 (100.0%) | 2.37 |
Median Household Size in Hackberry
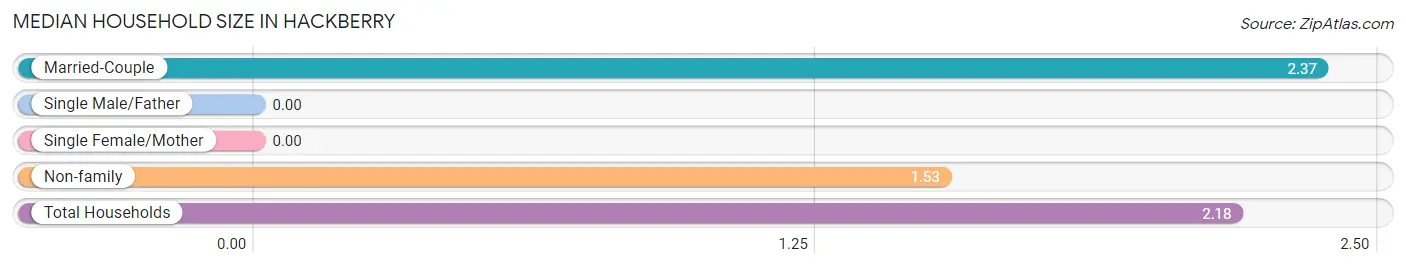
| Household Type | # Households | Household Size |
| Married-Couple | 114 (78.1%) | 2.37 |
| Single Male/Father | 0 (0.0%) | - |
| Single Female/Mother | 0 (0.0%) | - |
| Non-family | 32 (21.9%) | 1.53 |
| Total Households | 146 (100.0%) | 2.18 |
Household Size by Marriage Status in Hackberry
Out of a total of 146 households in Hackberry, 114 (78.1%) are family households, while 32 (21.9%) are nonfamily households. The most numerous type of family households are 2-person households, comprising 87, and the most common type of nonfamily households are 2-person households, comprising 17.
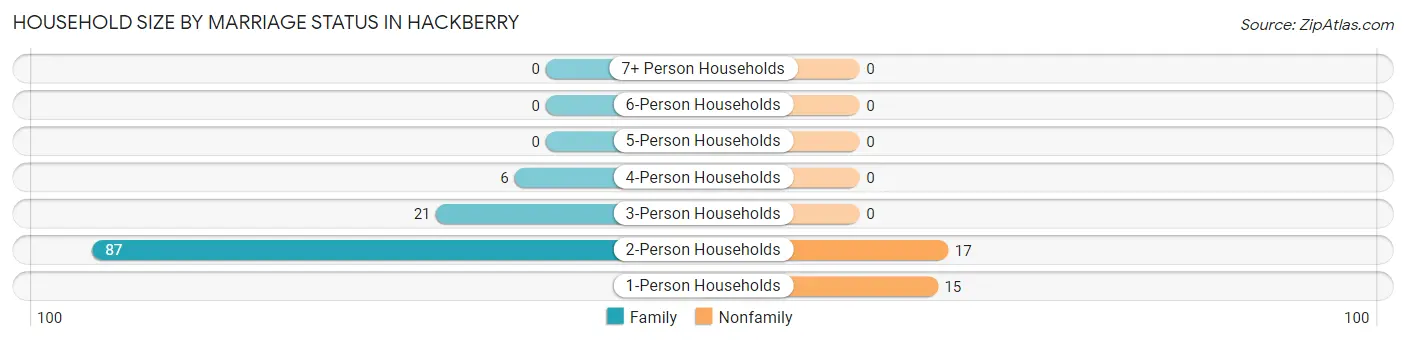
| Household Size | Family Households | Nonfamily Households |
| 1-Person Households | - | 15 (10.3%) |
| 2-Person Households | 87 (59.6%) | 17 (11.6%) |
| 3-Person Households | 21 (14.4%) | 0 (0.0%) |
| 4-Person Households | 6 (4.1%) | 0 (0.0%) |
| 5-Person Households | 0 (0.0%) | 0 (0.0%) |
| 6-Person Households | 0 (0.0%) | 0 (0.0%) |
| 7+ Person Households | 0 (0.0%) | 0 (0.0%) |
| Total | 114 (78.1%) | 32 (21.9%) |
Female Fertility in Hackberry
Fertility by Age in Hackberry
| Age Bracket | Women with Births | Births / 1,000 Women |
| 15 to 19 years | 0 (0.0%) | 0.0 |
| 20 to 34 years | 0 (0.0%) | 0.0 |
| 35 to 50 years | 0 (0.0%) | 0.0 |
| Total | 0 (0.0%) | 0.0 |
Fertility by Age by Marriage Status in Hackberry
| Age Bracket | Married | Unmarried |
| 15 to 19 years | 0 (0.0%) | 0 (0.0%) |
| 20 to 34 years | 0 (0.0%) | 0 (0.0%) |
| 35 to 50 years | 0 (0.0%) | 0 (0.0%) |
| Total | 0 (0.0%) | 0 (0.0%) |
Fertility by Education in Hackberry
| Educational Attainment | Women with Births | Births / 1,000 Women |
| Less than High School | 0 (0.0%) | 0.0 |
| High School Diploma | 0 (0.0%) | 0.0 |
| College or Associate's Degree | 0 (0.0%) | 0.0 |
| Bachelor's Degree | 0 (0.0%) | 0.0 |
| Graduate Degree | 0 (0.0%) | 0.0 |
| Total | 0 (0.0%) | 0.0 |
Fertility by Education by Marriage Status in Hackberry
| Educational Attainment | Married | Unmarried |
| Less than High School | 0 (0.0%) | 0 (0.0%) |
| High School Diploma | 0 (0.0%) | 0 (0.0%) |
| College or Associate's Degree | 0 (0.0%) | 0 (0.0%) |
| Bachelor's Degree | 0 (0.0%) | 0 (0.0%) |
| Graduate Degree | 0 (0.0%) | 0 (0.0%) |
| Total | 0 (0.0%) | 0 (0.0%) |
Employment Characteristics in Hackberry
Employment by Class of Employer in Hackberry
Among the 169 employed individuals in Hackberry, private company employees (117 | 69.2%), self-employed (not incorporated) (28 | 16.6%), and local government employees (9 | 5.3%) make up the most common classes of employment.
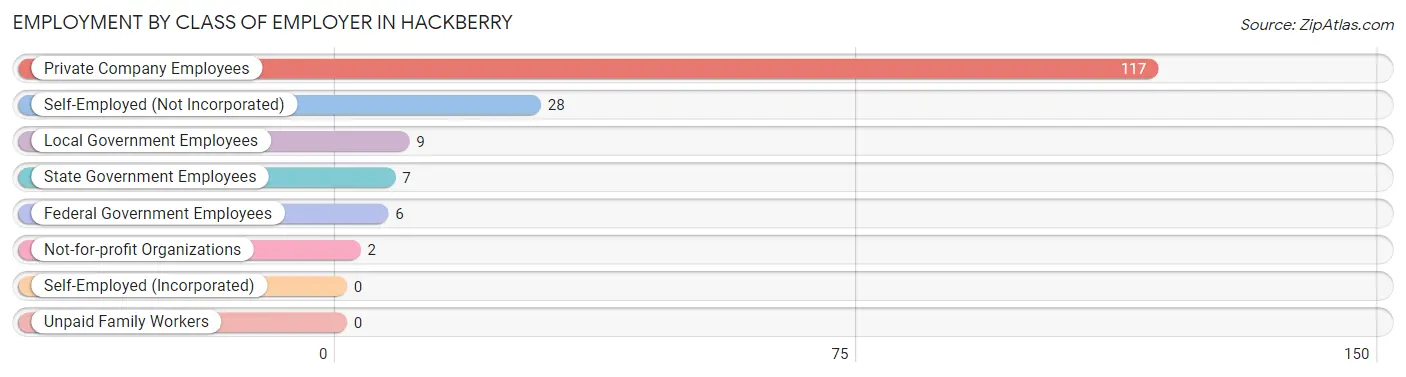
| Employer Class | # Employees | % Employees |
| Private Company Employees | 117 | 69.2% |
| Self-Employed (Incorporated) | 0 | 0.0% |
| Self-Employed (Not Incorporated) | 28 | 16.6% |
| Not-for-profit Organizations | 2 | 1.2% |
| Local Government Employees | 9 | 5.3% |
| State Government Employees | 7 | 4.1% |
| Federal Government Employees | 6 | 3.5% |
| Unpaid Family Workers | 0 | 0.0% |
| Total | 169 | 100.0% |
Employment Status by Age in Hackberry
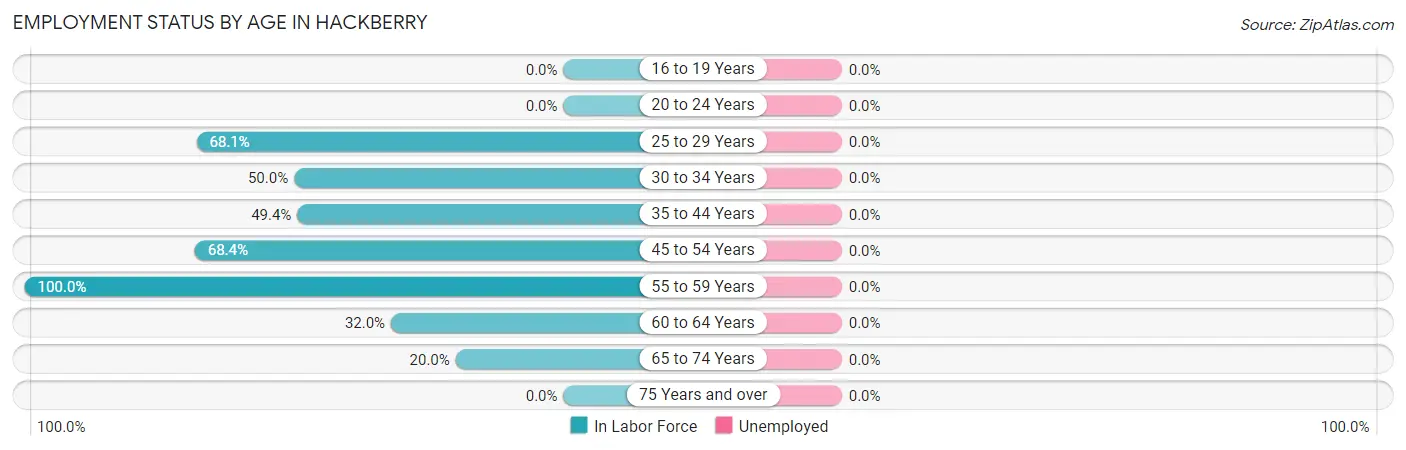
| Age Bracket | In Labor Force | Unemployed |
| 16 to 19 Years | 0 (0.0%) | 0 (0.0%) |
| 20 to 24 Years | 0 (0.0%) | 0 (0.0%) |
| 25 to 29 Years | 32 (68.1%) | 0 (0.0%) |
| 30 to 34 Years | 6 (50.0%) | 0 (0.0%) |
| 35 to 44 Years | 42 (49.4%) | 0 (0.0%) |
| 45 to 54 Years | 13 (68.4%) | 0 (0.0%) |
| 55 to 59 Years | 56 (100.0%) | 0 (0.0%) |
| 60 to 64 Years | 16 (32.0%) | 0 (0.0%) |
| 65 to 74 Years | 4 (20.0%) | 0 (0.0%) |
| 75 Years and over | 0 (0.0%) | 0 (0.0%) |
| Total | 169 (56.5%) | 0 (0.0%) |
Employment Status by Educational Attainment in Hackberry
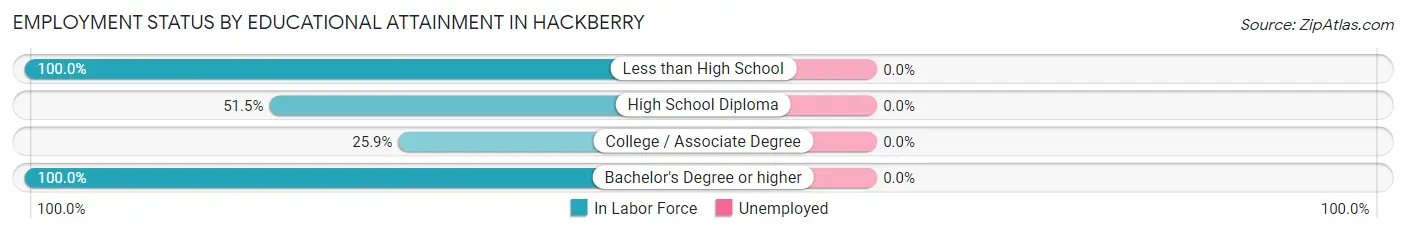
| Educational Attainment | In Labor Force | Unemployed |
| Less than High School | 68 (100.0%) | 0 (0.0%) |
| High School Diploma | 68 (51.5%) | 0 (0.0%) |
| College / Associate Degree | 14 (25.9%) | 0 (0.0%) |
| Bachelor's Degree or higher | 15 (100.0%) | 0 (0.0%) |
| Total | 165 (61.3%) | 0 (0.0%) |
Employment Occupations by Sex in Hackberry
Management, Business, Science and Arts Occupations
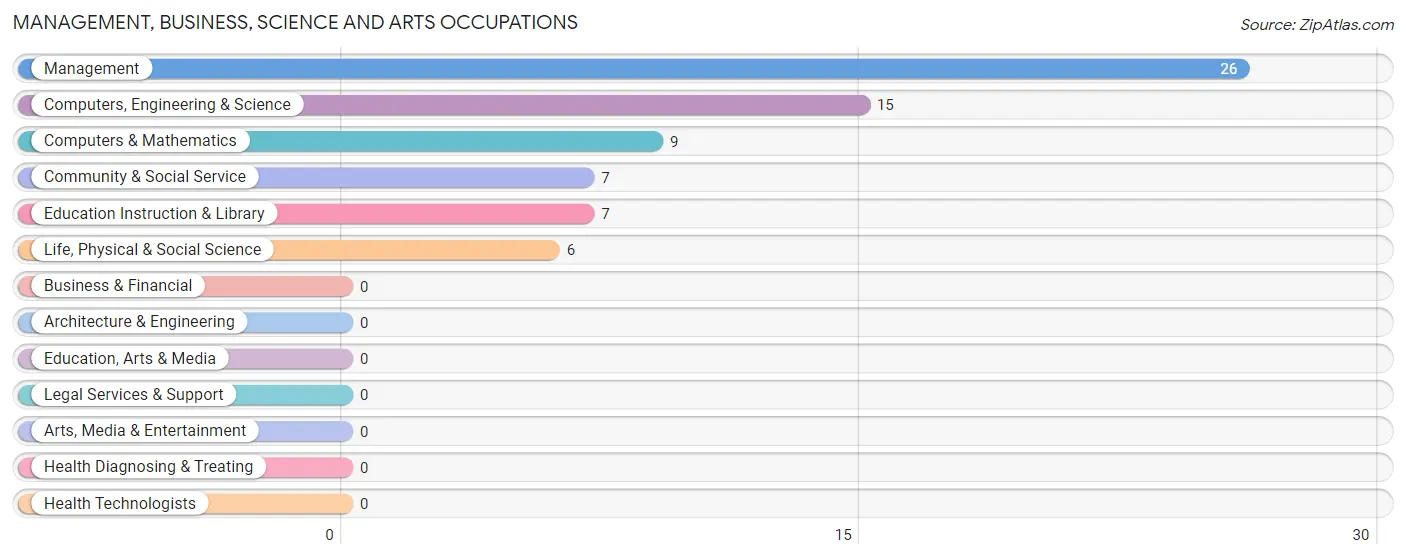
The most common Management, Business, Science and Arts occupations in Hackberry are Management (26 | 15.4%), Computers, Engineering & Science (15 | 8.9%), Computers & Mathematics (9 | 5.3%), Community & Social Service (7 | 4.1%), and Education Instruction & Library (7 | 4.1%).
Management, Business, Science and Arts Occupations by Sex
Within the Management, Business, Science and Arts occupations in Hackberry, the most male-oriented occupations are Management (100.0%), Computers, Engineering & Science (100.0%), and Computers & Mathematics (100.0%), while the most female-oriented occupations are Community & Social Service (100.0%), and Education Instruction & Library (100.0%).
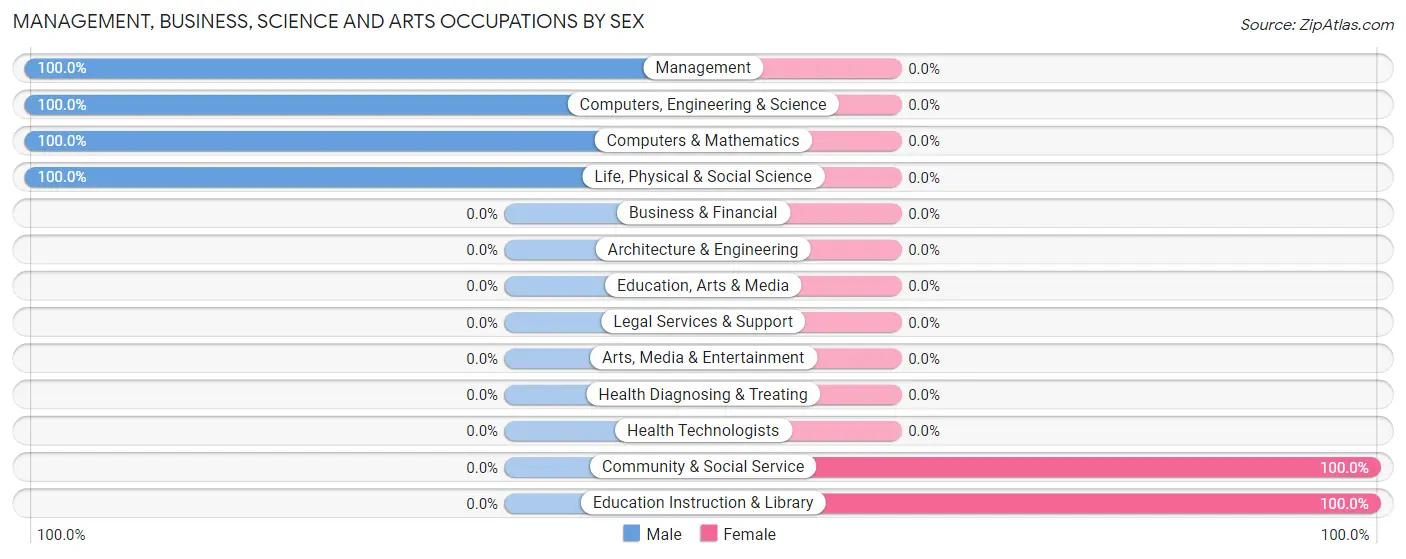
| Occupation | Male | Female |
| Management | 26 (100.0%) | 0 (0.0%) |
| Business & Financial | 0 (0.0%) | 0 (0.0%) |
| Computers, Engineering & Science | 15 (100.0%) | 0 (0.0%) |
| Computers & Mathematics | 9 (100.0%) | 0 (0.0%) |
| Architecture & Engineering | 0 (0.0%) | 0 (0.0%) |
| Life, Physical & Social Science | 6 (100.0%) | 0 (0.0%) |
| Community & Social Service | 0 (0.0%) | 7 (100.0%) |
| Education, Arts & Media | 0 (0.0%) | 0 (0.0%) |
| Legal Services & Support | 0 (0.0%) | 0 (0.0%) |
| Education Instruction & Library | 0 (0.0%) | 7 (100.0%) |
| Arts, Media & Entertainment | 0 (0.0%) | 0 (0.0%) |
| Health Diagnosing & Treating | 0 (0.0%) | 0 (0.0%) |
| Health Technologists | 0 (0.0%) | 0 (0.0%) |
| Total (Category) | 41 (85.4%) | 7 (14.6%) |
| Total (Overall) | 125 (74.0%) | 44 (26.0%) |
Services Occupations
Services Occupations by Sex
| Occupation | Male | Female |
| Healthcare Support | 0 (0.0%) | 0 (0.0%) |
| Security & Protection | 0 (0.0%) | 0 (0.0%) |
| Firefighting & Prevention | 0 (0.0%) | 0 (0.0%) |
| Law Enforcement | 0 (0.0%) | 0 (0.0%) |
| Food Preparation & Serving | 0 (0.0%) | 0 (0.0%) |
| Cleaning & Maintenance | 0 (0.0%) | 0 (0.0%) |
| Personal Care & Service | 0 (0.0%) | 0 (0.0%) |
| Total (Category) | 0 (0.0%) | 0 (0.0%) |
| Total (Overall) | 125 (74.0%) | 44 (26.0%) |
Sales and Office Occupations
The most common Sales and Office occupations in Hackberry are Sales & Related (31 | 18.3%), and Office & Administration (6 | 3.5%).
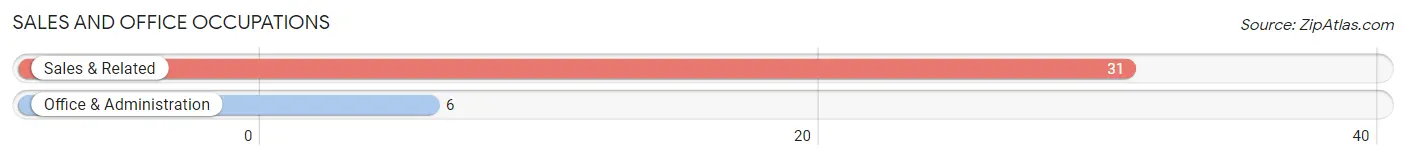
Sales and Office Occupations by Sex
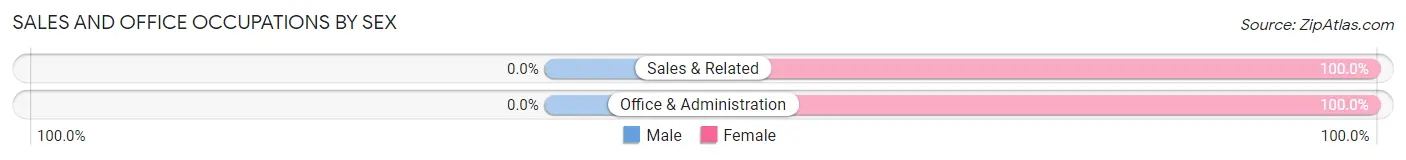
| Occupation | Male | Female |
| Sales & Related | 0 (0.0%) | 31 (100.0%) |
| Office & Administration | 0 (0.0%) | 6 (100.0%) |
| Total (Category) | 0 (0.0%) | 37 (100.0%) |
| Total (Overall) | 125 (74.0%) | 44 (26.0%) |
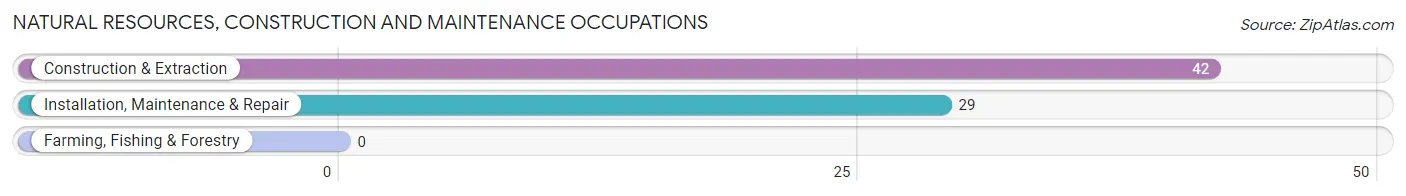
Natural Resources, Construction and Maintenance Occupations
The most common Natural Resources, Construction and Maintenance occupations in Hackberry are Construction & Extraction (42 | 24.8%), and Installation, Maintenance & Repair (29 | 17.2%).
Natural Resources, Construction and Maintenance Occupations by Sex
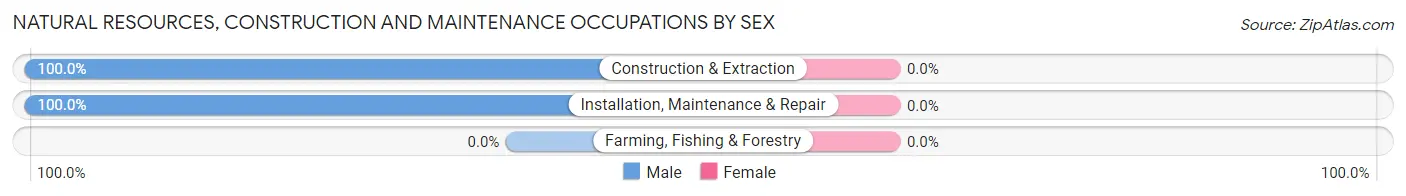
| Occupation | Male | Female |
| Farming, Fishing & Forestry | 0 (0.0%) | 0 (0.0%) |
| Construction & Extraction | 42 (100.0%) | 0 (0.0%) |
| Installation, Maintenance & Repair | 29 (100.0%) | 0 (0.0%) |
| Total (Category) | 71 (100.0%) | 0 (0.0%) |
| Total (Overall) | 125 (74.0%) | 44 (26.0%) |
Production, Transportation and Moving Occupations
The most common Production, Transportation and Moving occupations in Hackberry are Production (8 | 4.7%), and Transportation (5 | 3.0%).
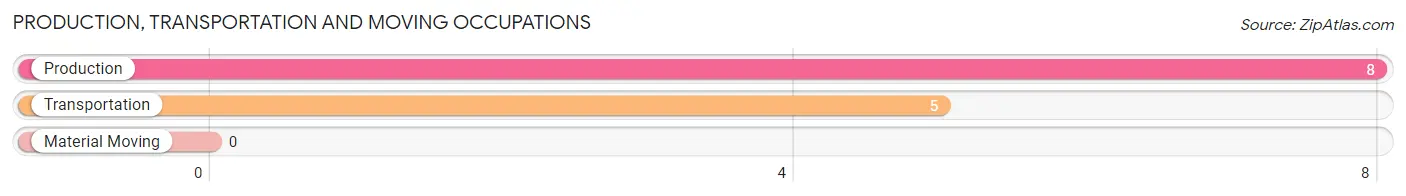
Production, Transportation and Moving Occupations by Sex
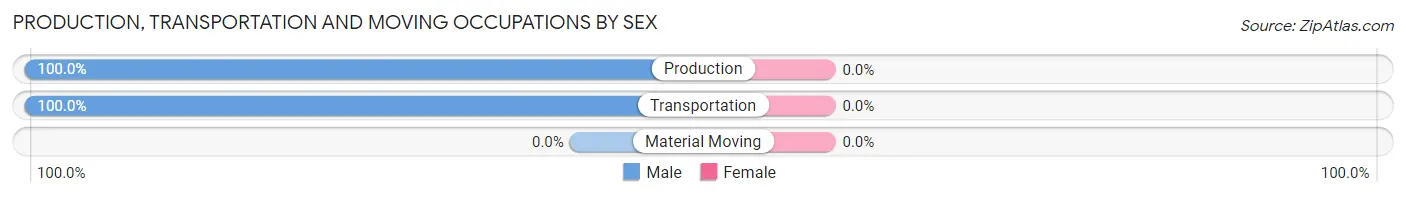
| Occupation | Male | Female |
| Production | 8 (100.0%) | 0 (0.0%) |
| Transportation | 5 (100.0%) | 0 (0.0%) |
| Material Moving | 0 (0.0%) | 0 (0.0%) |
| Total (Category) | 13 (100.0%) | 0 (0.0%) |
| Total (Overall) | 125 (74.0%) | 44 (26.0%) |
Employment Industries by Sex in Hackberry
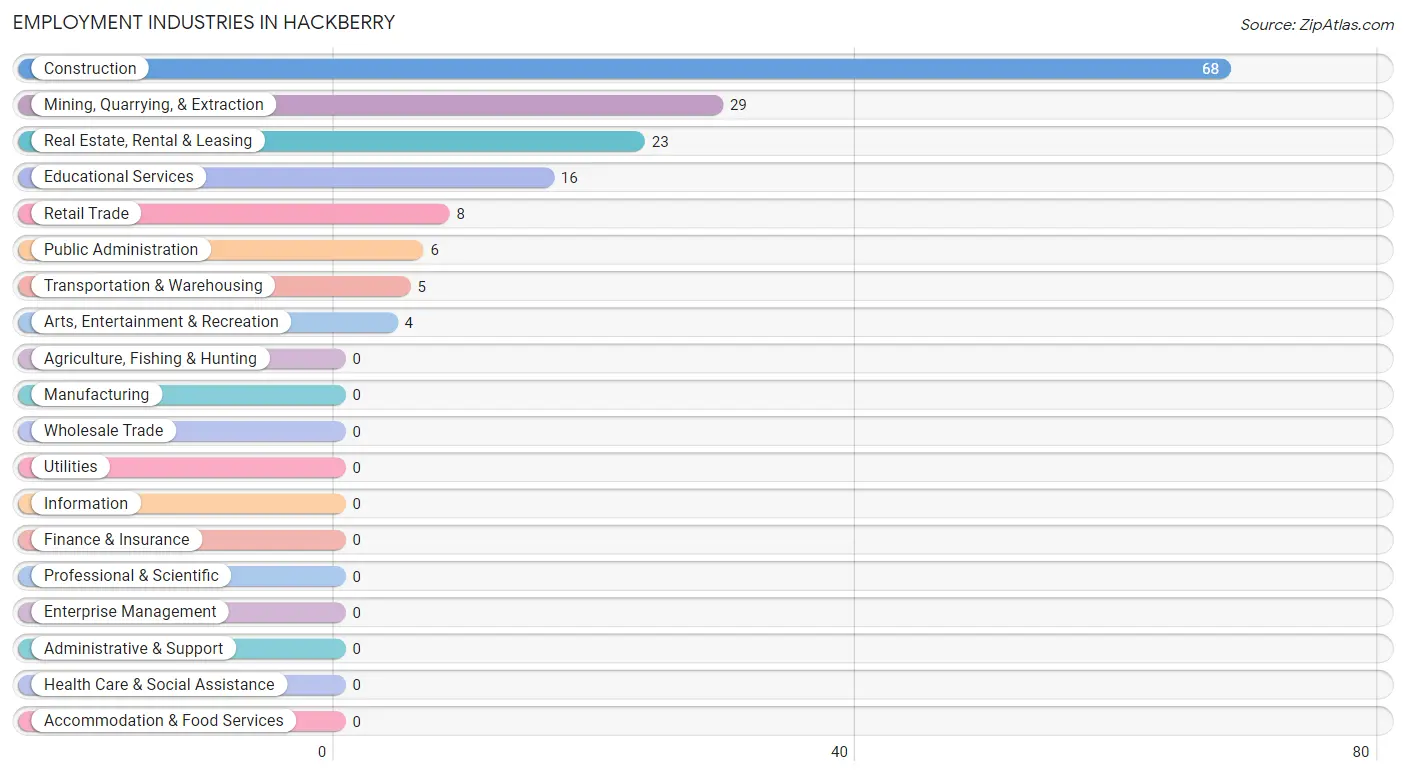
Employment Industries in Hackberry
The major employment industries in Hackberry include Construction (68 | 40.2%), Mining, Quarrying, & Extraction (29 | 17.2%), Real Estate, Rental & Leasing (23 | 13.6%), Educational Services (16 | 9.5%), and Retail Trade (8 | 4.7%).
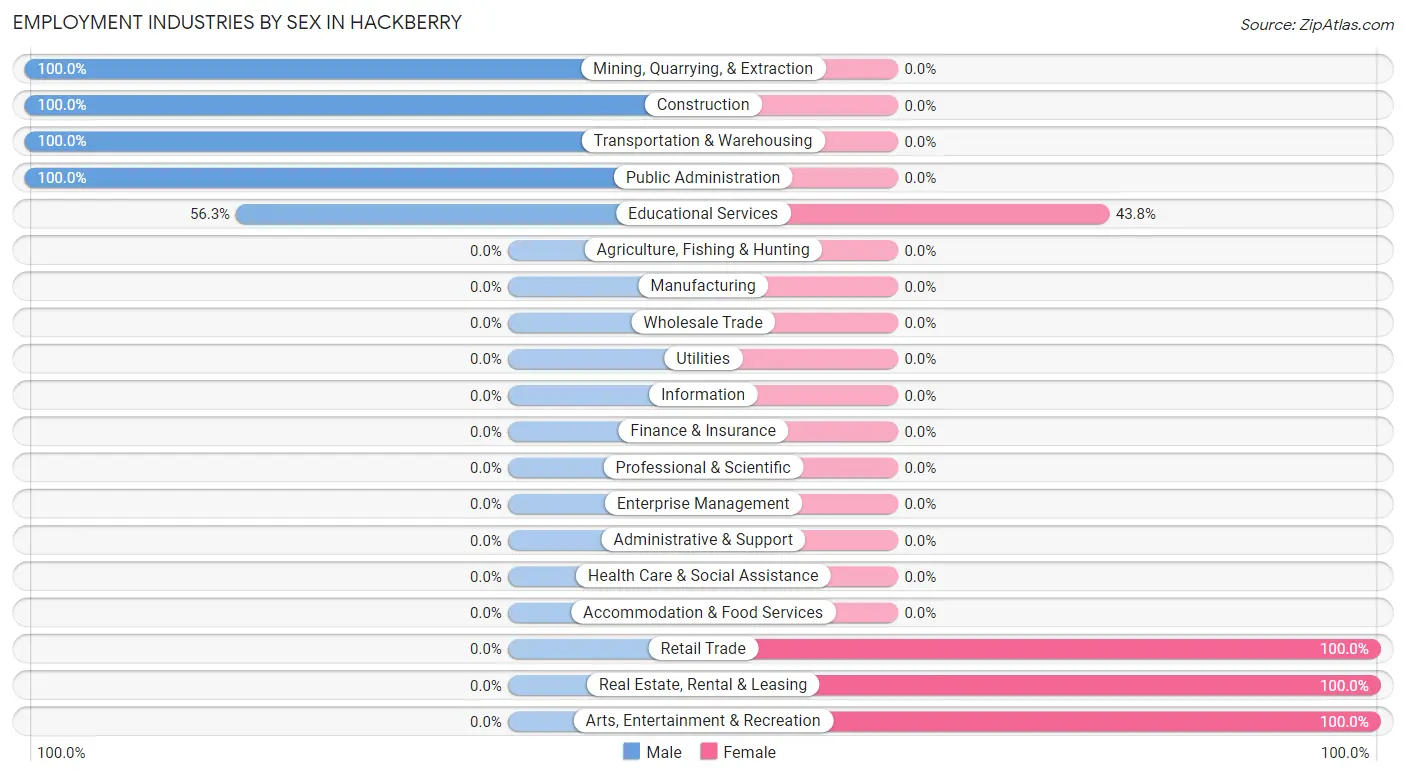
Employment Industries by Sex in Hackberry
The Hackberry industries that see more men than women are Mining, Quarrying, & Extraction (100.0%), Construction (100.0%), and Transportation & Warehousing (100.0%), whereas the industries that tend to have a higher number of women are Retail Trade (100.0%), Real Estate, Rental & Leasing (100.0%), and Arts, Entertainment & Recreation (100.0%).
| Industry | Male | Female |
| Agriculture, Fishing & Hunting | 0 (0.0%) | 0 (0.0%) |
| Mining, Quarrying, & Extraction | 29 (100.0%) | 0 (0.0%) |
| Construction | 68 (100.0%) | 0 (0.0%) |
| Manufacturing | 0 (0.0%) | 0 (0.0%) |
| Wholesale Trade | 0 (0.0%) | 0 (0.0%) |
| Retail Trade | 0 (0.0%) | 8 (100.0%) |
| Transportation & Warehousing | 5 (100.0%) | 0 (0.0%) |
| Utilities | 0 (0.0%) | 0 (0.0%) |
| Information | 0 (0.0%) | 0 (0.0%) |
| Finance & Insurance | 0 (0.0%) | 0 (0.0%) |
| Real Estate, Rental & Leasing | 0 (0.0%) | 23 (100.0%) |
| Professional & Scientific | 0 (0.0%) | 0 (0.0%) |
| Enterprise Management | 0 (0.0%) | 0 (0.0%) |
| Administrative & Support | 0 (0.0%) | 0 (0.0%) |
| Educational Services | 9 (56.2%) | 7 (43.8%) |
| Health Care & Social Assistance | 0 (0.0%) | 0 (0.0%) |
| Arts, Entertainment & Recreation | 0 (0.0%) | 4 (100.0%) |
| Accommodation & Food Services | 0 (0.0%) | 0 (0.0%) |
| Public Administration | 6 (100.0%) | 0 (0.0%) |
| Total | 125 (74.0%) | 44 (26.0%) |
Education in Hackberry
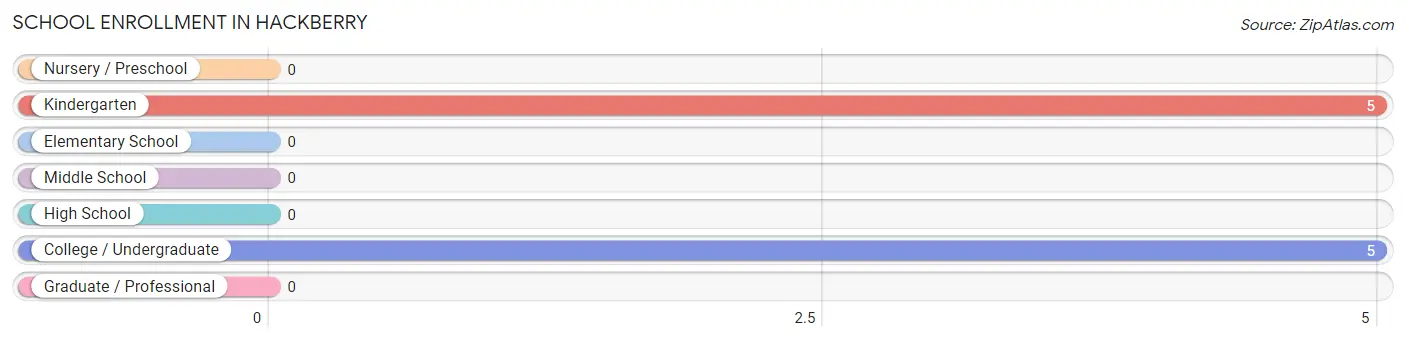
School Enrollment in Hackberry
The most common levels of schooling among the 10 students in Hackberry are kindergarten (5 | 50.0%), and college / undergraduate (5 | 50.0%).
| School Level | # Students | % Students |
| Nursery / Preschool | 0 | 0.0% |
| Kindergarten | 5 | 50.0% |
| Elementary School | 0 | 0.0% |
| Middle School | 0 | 0.0% |
| High School | 0 | 0.0% |
| College / Undergraduate | 5 | 50.0% |
| Graduate / Professional | 0 | 0.0% |
| Total | 10 | 100.0% |
School Enrollment by Age by Funding Source in Hackberry
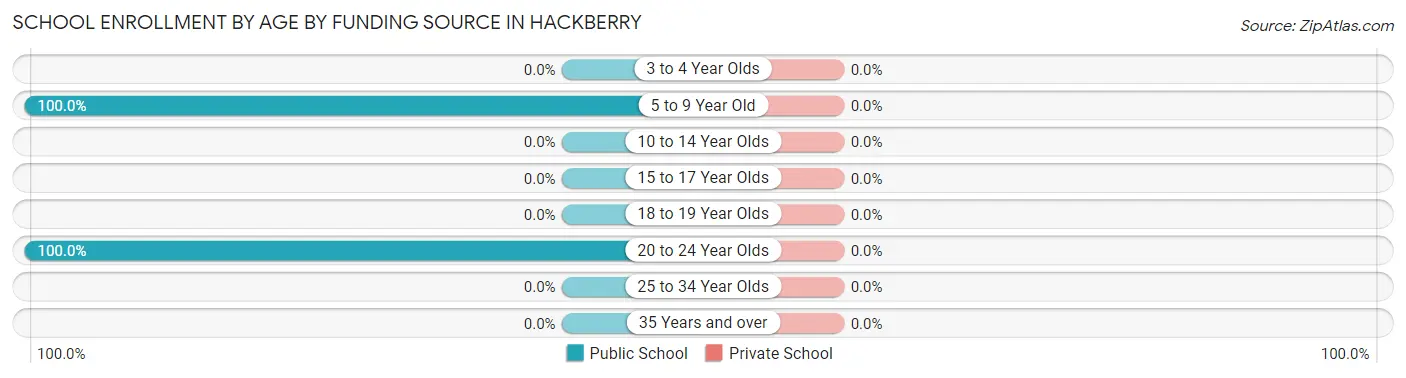
| Age Bracket | Public School | Private School |
| 3 to 4 Year Olds | 0 (0.0%) | 0 (0.0%) |
| 5 to 9 Year Old | 5 (100.0%) | 0 (0.0%) |
| 10 to 14 Year Olds | 0 (0.0%) | 0 (0.0%) |
| 15 to 17 Year Olds | 0 (0.0%) | 0 (0.0%) |
| 18 to 19 Year Olds | 0 (0.0%) | 0 (0.0%) |
| 20 to 24 Year Olds | 5 (100.0%) | 0 (0.0%) |
| 25 to 34 Year Olds | 0 (0.0%) | 0 (0.0%) |
| 35 Years and over | 0 (0.0%) | 0 (0.0%) |
| Total | 10 (100.0%) | 0 (0.0%) |
Educational Attainment by Field of Study in Hackberry
Education (7 | 29.2%), engineering (6 | 25.0%), liberal arts & history (5 | 20.8%), business (4 | 16.7%), and multidisciplinary studies (2 | 8.3%) are the most common fields of study among 24 individuals in Hackberry who have obtained a bachelor's degree or higher.
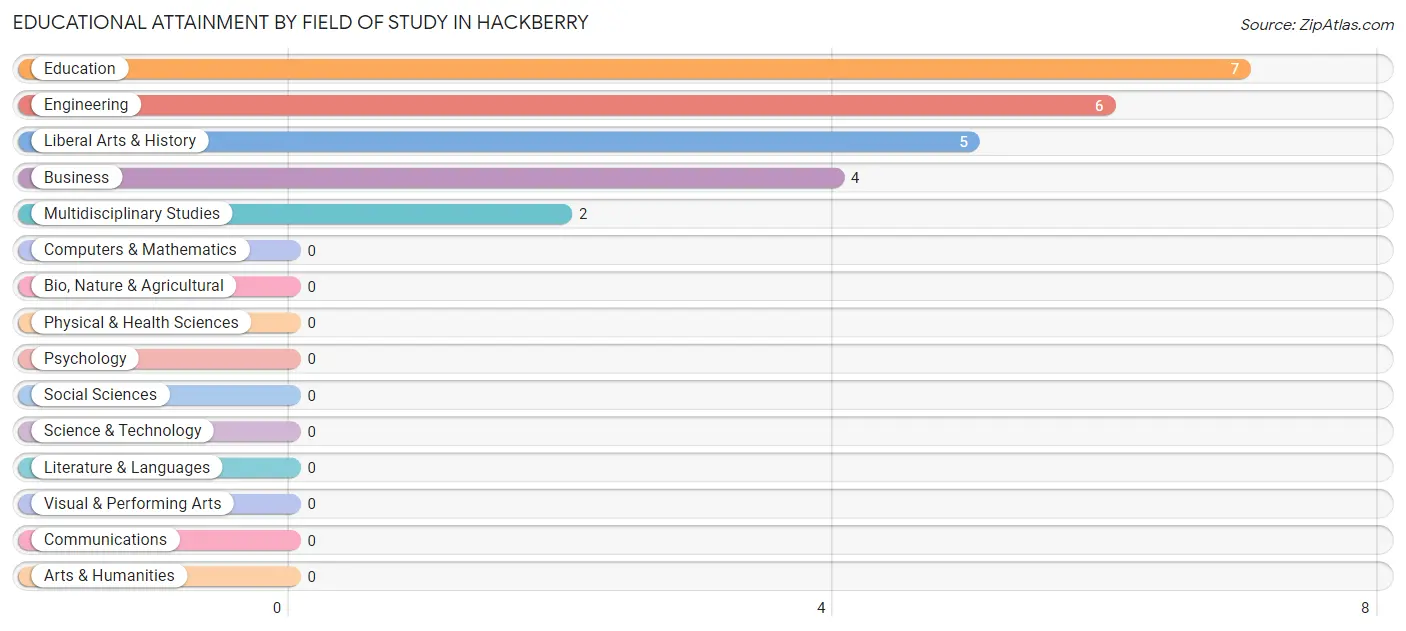
| Field of Study | # Graduates | % Graduates |
| Computers & Mathematics | 0 | 0.0% |
| Bio, Nature & Agricultural | 0 | 0.0% |
| Physical & Health Sciences | 0 | 0.0% |
| Psychology | 0 | 0.0% |
| Social Sciences | 0 | 0.0% |
| Engineering | 6 | 25.0% |
| Multidisciplinary Studies | 2 | 8.3% |
| Science & Technology | 0 | 0.0% |
| Business | 4 | 16.7% |
| Education | 7 | 29.2% |
| Literature & Languages | 0 | 0.0% |
| Liberal Arts & History | 5 | 20.8% |
| Visual & Performing Arts | 0 | 0.0% |
| Communications | 0 | 0.0% |
| Arts & Humanities | 0 | 0.0% |
| Total | 24 | 100.0% |
Transportation & Commute in Hackberry
Vehicle Availability by Sex in Hackberry
The most prevalent vehicle ownership categories in Hackberry are males with 2 vehicles (48, accounting for 38.4%) and females with 2 vehicles (9, making up 109.1%).

| Vehicles Available | Male | Female |
| No Vehicle | 0 (0.0%) | 0 (0.0%) |
| 1 Vehicle | 0 (0.0%) | 4 (9.1%) |
| 2 Vehicles | 48 (38.4%) | 9 (20.4%) |
| 3 Vehicles | 37 (29.6%) | 0 (0.0%) |
| 4 Vehicles | 40 (32.0%) | 31 (70.5%) |
| 5 or more Vehicles | 0 (0.0%) | 0 (0.0%) |
| Total | 125 (100.0%) | 44 (100.0%) |
Commute Time in Hackberry
The most frequently occuring commute durations in Hackberry are 30 to 34 minutes (111 commuters, 75.5%), 90 or more minutes (28 commuters, 19.1%), and 60 to 89 minutes (6 commuters, 4.1%).
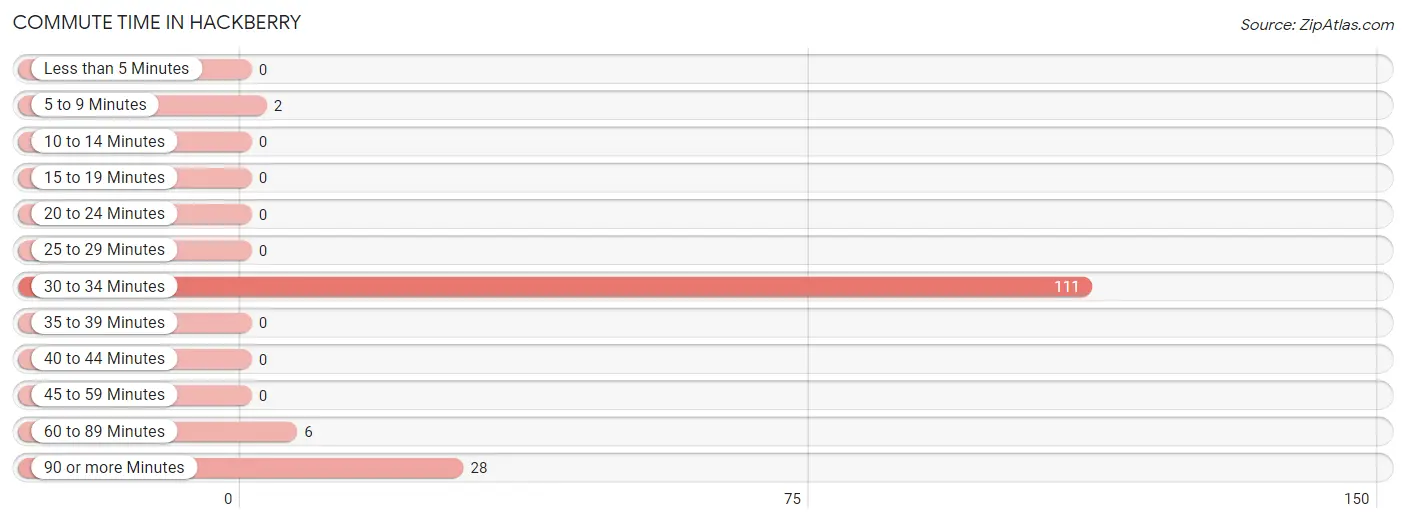
| Commute Time | # Commuters | % Commuters |
| Less than 5 Minutes | 0 | 0.0% |
| 5 to 9 Minutes | 2 | 1.4% |
| 10 to 14 Minutes | 0 | 0.0% |
| 15 to 19 Minutes | 0 | 0.0% |
| 20 to 24 Minutes | 0 | 0.0% |
| 25 to 29 Minutes | 0 | 0.0% |
| 30 to 34 Minutes | 111 | 75.5% |
| 35 to 39 Minutes | 0 | 0.0% |
| 40 to 44 Minutes | 0 | 0.0% |
| 45 to 59 Minutes | 0 | 0.0% |
| 60 to 89 Minutes | 6 | 4.1% |
| 90 or more Minutes | 28 | 19.1% |
Commute Time by Sex in Hackberry
The most common commute times in Hackberry are 30 to 34 minutes (77 commuters, 69.4%) for males and 30 to 34 minutes (34 commuters, 94.4%) for females.
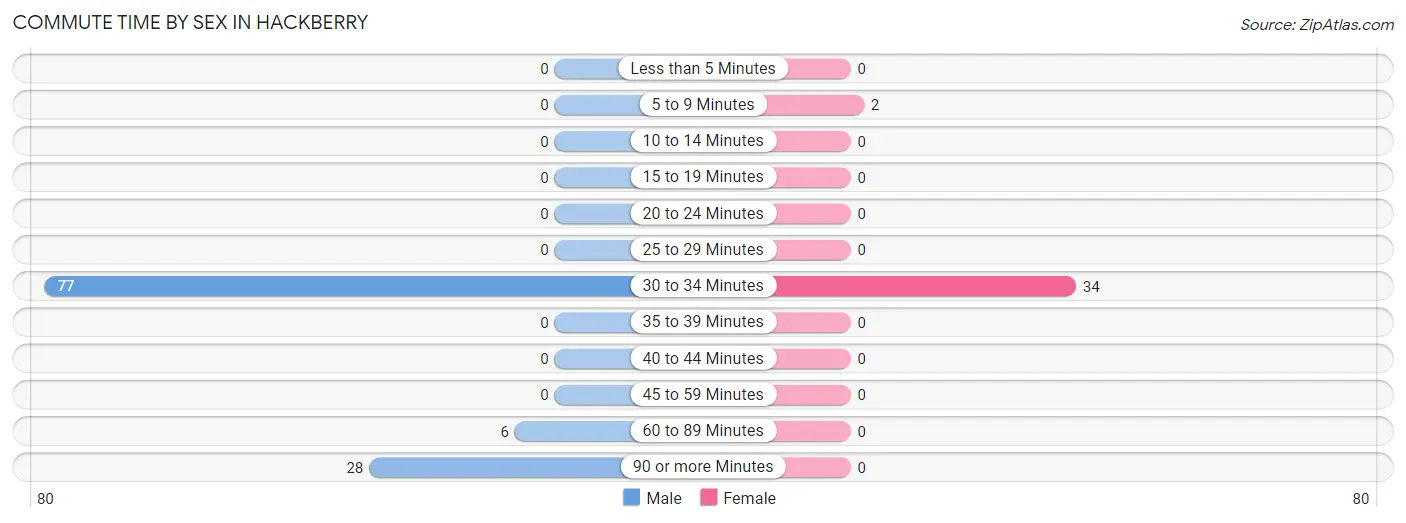
| Commute Time | Male | Female |
| Less than 5 Minutes | 0 (0.0%) | 0 (0.0%) |
| 5 to 9 Minutes | 0 (0.0%) | 2 (5.6%) |
| 10 to 14 Minutes | 0 (0.0%) | 0 (0.0%) |
| 15 to 19 Minutes | 0 (0.0%) | 0 (0.0%) |
| 20 to 24 Minutes | 0 (0.0%) | 0 (0.0%) |
| 25 to 29 Minutes | 0 (0.0%) | 0 (0.0%) |
| 30 to 34 Minutes | 77 (69.4%) | 34 (94.4%) |
| 35 to 39 Minutes | 0 (0.0%) | 0 (0.0%) |
| 40 to 44 Minutes | 0 (0.0%) | 0 (0.0%) |
| 45 to 59 Minutes | 0 (0.0%) | 0 (0.0%) |
| 60 to 89 Minutes | 6 (5.4%) | 0 (0.0%) |
| 90 or more Minutes | 28 (25.2%) | 0 (0.0%) |
Time of Departure to Work by Sex in Hackberry
The most frequent times of departure to work in Hackberry are 6:30 AM to 6:59 AM (51, 46.0%) for males and 8:00 AM to 8:29 AM (27, 75.0%) for females.
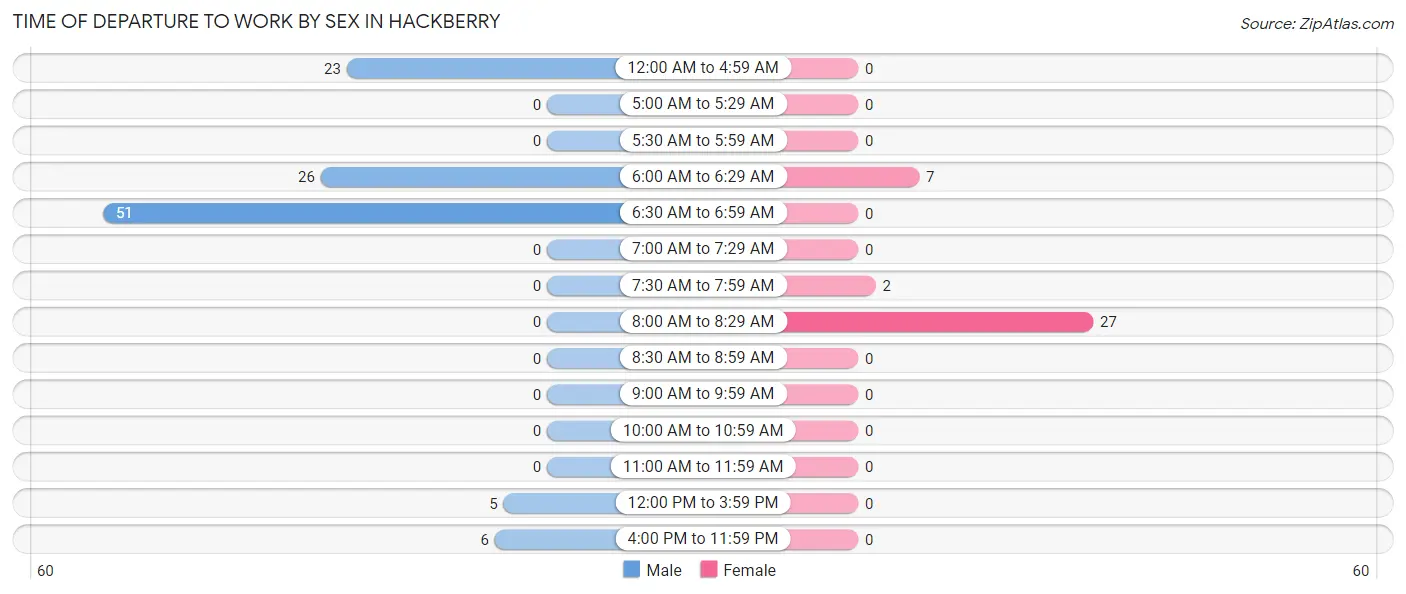
| Time of Departure | Male | Female |
| 12:00 AM to 4:59 AM | 23 (20.7%) | 0 (0.0%) |
| 5:00 AM to 5:29 AM | 0 (0.0%) | 0 (0.0%) |
| 5:30 AM to 5:59 AM | 0 (0.0%) | 0 (0.0%) |
| 6:00 AM to 6:29 AM | 26 (23.4%) | 7 (19.4%) |
| 6:30 AM to 6:59 AM | 51 (46.0%) | 0 (0.0%) |
| 7:00 AM to 7:29 AM | 0 (0.0%) | 0 (0.0%) |
| 7:30 AM to 7:59 AM | 0 (0.0%) | 2 (5.6%) |
| 8:00 AM to 8:29 AM | 0 (0.0%) | 27 (75.0%) |
| 8:30 AM to 8:59 AM | 0 (0.0%) | 0 (0.0%) |
| 9:00 AM to 9:59 AM | 0 (0.0%) | 0 (0.0%) |
| 10:00 AM to 10:59 AM | 0 (0.0%) | 0 (0.0%) |
| 11:00 AM to 11:59 AM | 0 (0.0%) | 0 (0.0%) |
| 12:00 PM to 3:59 PM | 5 (4.5%) | 0 (0.0%) |
| 4:00 PM to 11:59 PM | 6 (5.4%) | 0 (0.0%) |
| Total | 111 (100.0%) | 36 (100.0%) |
Housing Occupancy in Hackberry
Occupancy by Ownership in Hackberry
Of the total 146 dwellings in Hackberry, owner-occupied units account for 125 (85.6%), while renter-occupied units make up 21 (14.4%).
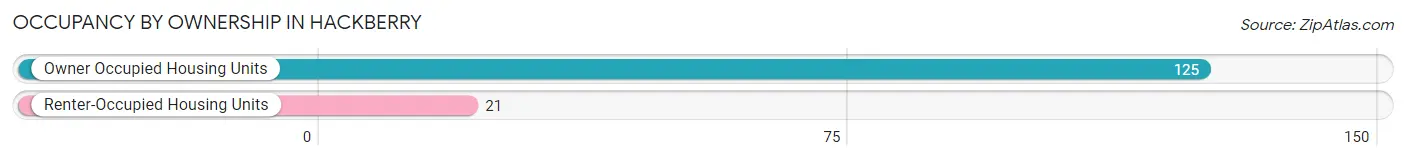
| Occupancy | # Housing Units | % Housing Units |
| Owner Occupied Housing Units | 125 | 85.6% |
| Renter-Occupied Housing Units | 21 | 14.4% |
| Total Occupied Housing Units | 146 | 100.0% |
Occupancy by Household Size in Hackberry
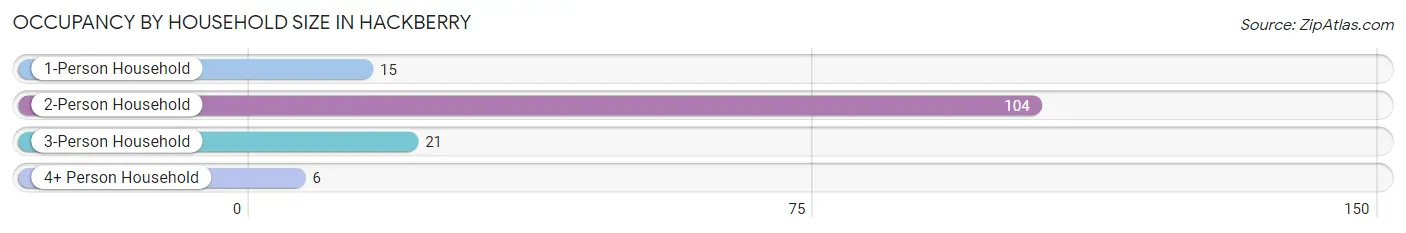
| Household Size | # Housing Units | % Housing Units |
| 1-Person Household | 15 | 10.3% |
| 2-Person Household | 104 | 71.2% |
| 3-Person Household | 21 | 14.4% |
| 4+ Person Household | 6 | 4.1% |
| Total Housing Units | 146 | 100.0% |
Occupancy by Ownership by Household Size in Hackberry
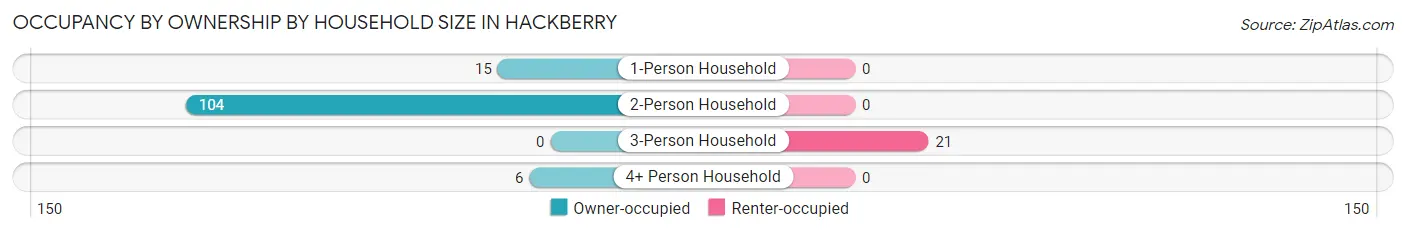
| Household Size | Owner-occupied | Renter-occupied |
| 1-Person Household | 15 (100.0%) | 0 (0.0%) |
| 2-Person Household | 104 (100.0%) | 0 (0.0%) |
| 3-Person Household | 0 (0.0%) | 21 (100.0%) |
| 4+ Person Household | 6 (100.0%) | 0 (0.0%) |
| Total Housing Units | 125 (85.6%) | 21 (14.4%) |
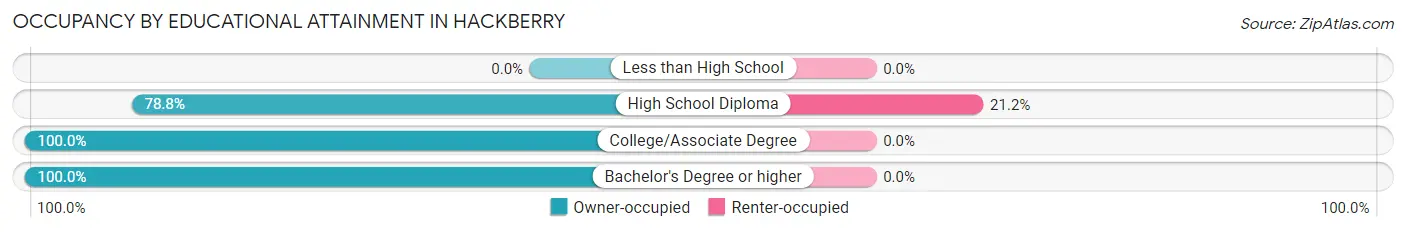
Occupancy by Educational Attainment in Hackberry
| Household Size | Owner-occupied | Renter-occupied |
| Less than High School | 0 (0.0%) | 0 (0.0%) |
| High School Diploma | 78 (78.8%) | 21 (21.2%) |
| College/Associate Degree | 30 (100.0%) | 0 (0.0%) |
| Bachelor's Degree or higher | 17 (100.0%) | 0 (0.0%) |
Occupancy by Age of Householder in Hackberry
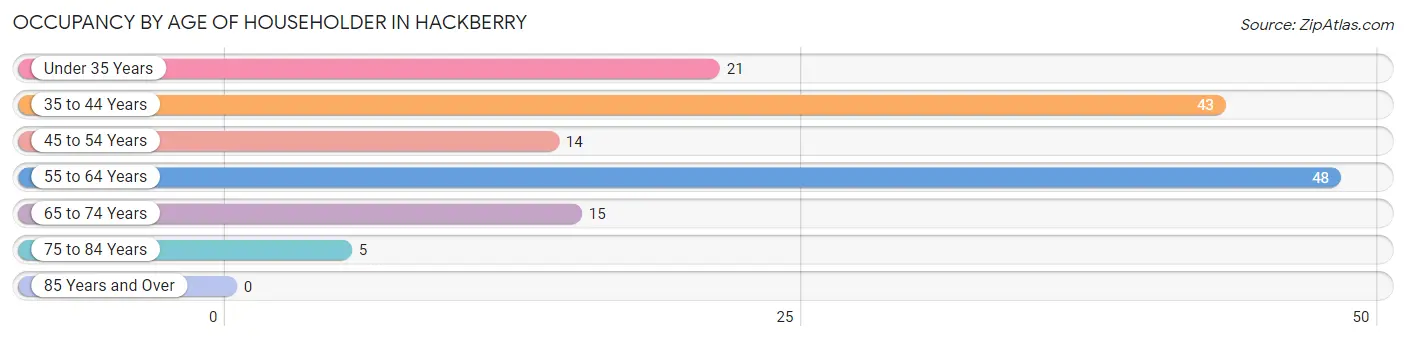
| Age Bracket | # Households | % Households |
| Under 35 Years | 21 | 14.4% |
| 35 to 44 Years | 43 | 29.4% |
| 45 to 54 Years | 14 | 9.6% |
| 55 to 64 Years | 48 | 32.9% |
| 65 to 74 Years | 15 | 10.3% |
| 75 to 84 Years | 5 | 3.4% |
| 85 Years and Over | 0 | 0.0% |
| Total | 146 | 100.0% |
Housing Finances in Hackberry
Median Income by Occupancy in Hackberry
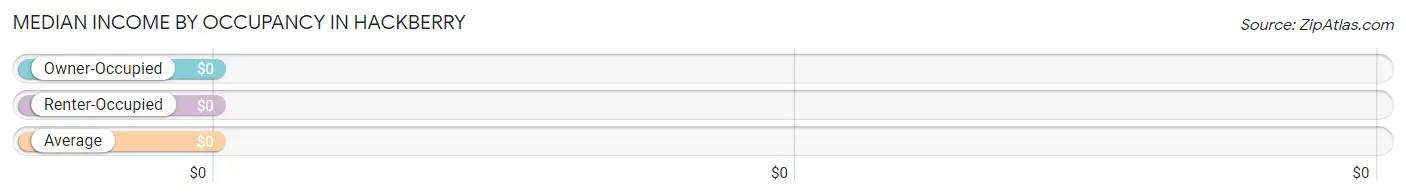
| Occupancy Type | # Households | Median Income |
| Owner-Occupied | 125 (85.6%) | $0 |
| Renter-Occupied | 21 (14.4%) | $0 |
| Average | 146 (100.0%) | $0 |
Occupancy by Householder Income Bracket in Hackberry
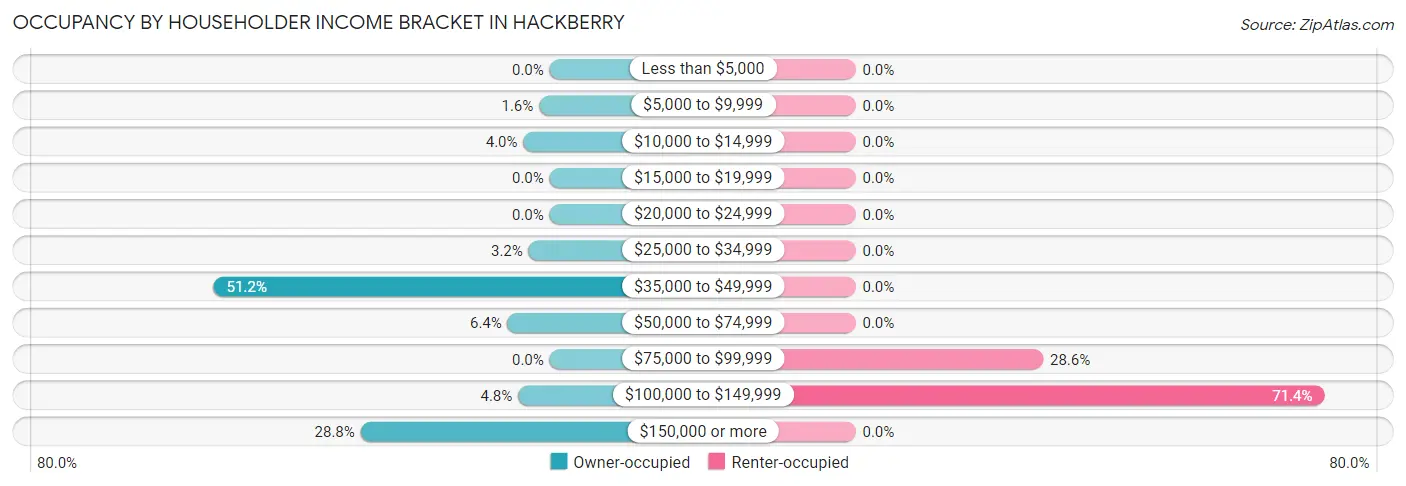
| Income Bracket | Owner-occupied | Renter-occupied |
| Less than $5,000 | 0 (0.0%) | 0 (0.0%) |
| $5,000 to $9,999 | 2 (1.6%) | 0 (0.0%) |
| $10,000 to $14,999 | 5 (4.0%) | 0 (0.0%) |
| $15,000 to $19,999 | 0 (0.0%) | 0 (0.0%) |
| $20,000 to $24,999 | 0 (0.0%) | 0 (0.0%) |
| $25,000 to $34,999 | 4 (3.2%) | 0 (0.0%) |
| $35,000 to $49,999 | 64 (51.2%) | 0 (0.0%) |
| $50,000 to $74,999 | 8 (6.4%) | 0 (0.0%) |
| $75,000 to $99,999 | 0 (0.0%) | 6 (28.6%) |
| $100,000 to $149,999 | 6 (4.8%) | 15 (71.4%) |
| $150,000 or more | 36 (28.8%) | 0 (0.0%) |
| Total | 125 (100.0%) | 21 (100.0%) |
Monthly Housing Cost Tiers in Hackberry
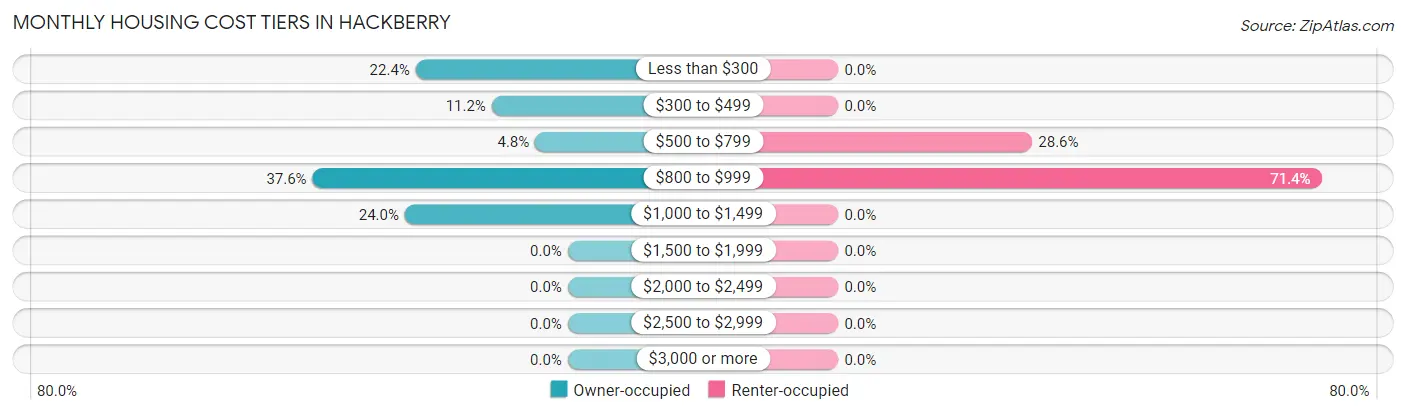
| Monthly Cost | Owner-occupied | Renter-occupied |
| Less than $300 | 28 (22.4%) | 0 (0.0%) |
| $300 to $499 | 14 (11.2%) | 0 (0.0%) |
| $500 to $799 | 6 (4.8%) | 6 (28.6%) |
| $800 to $999 | 47 (37.6%) | 15 (71.4%) |
| $1,000 to $1,499 | 30 (24.0%) | 0 (0.0%) |
| $1,500 to $1,999 | 0 (0.0%) | 0 (0.0%) |
| $2,000 to $2,499 | 0 (0.0%) | 0 (0.0%) |
| $2,500 to $2,999 | 0 (0.0%) | 0 (0.0%) |
| $3,000 or more | 0 (0.0%) | 0 (0.0%) |
| Total | 125 (100.0%) | 21 (100.0%) |
Physical Housing Characteristics in Hackberry
Housing Structures in Hackberry
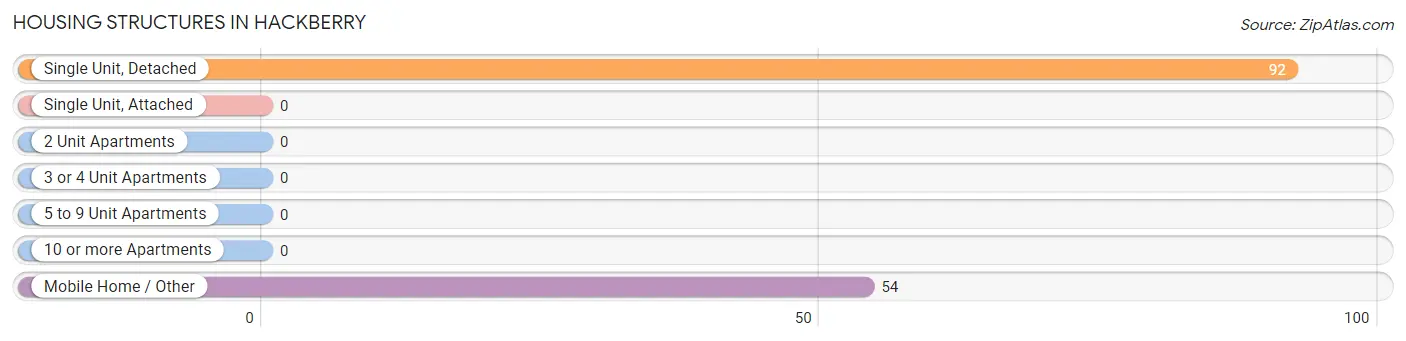
| Structure Type | # Housing Units | % Housing Units |
| Single Unit, Detached | 92 | 63.0% |
| Single Unit, Attached | 0 | 0.0% |
| 2 Unit Apartments | 0 | 0.0% |
| 3 or 4 Unit Apartments | 0 | 0.0% |
| 5 to 9 Unit Apartments | 0 | 0.0% |
| 10 or more Apartments | 0 | 0.0% |
| Mobile Home / Other | 54 | 37.0% |
| Total | 146 | 100.0% |
Housing Structures by Occupancy in Hackberry
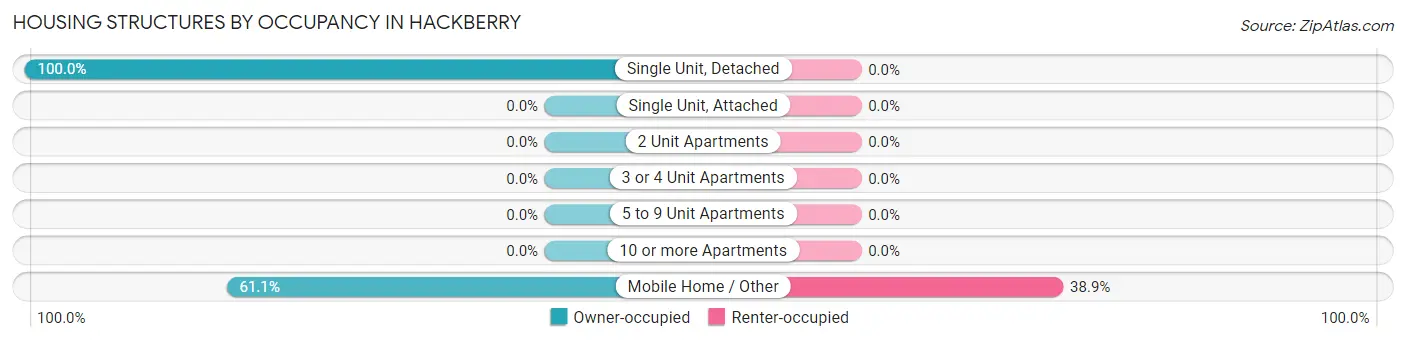
| Structure Type | Owner-occupied | Renter-occupied |
| Single Unit, Detached | 92 (100.0%) | 0 (0.0%) |
| Single Unit, Attached | 0 (0.0%) | 0 (0.0%) |
| 2 Unit Apartments | 0 (0.0%) | 0 (0.0%) |
| 3 or 4 Unit Apartments | 0 (0.0%) | 0 (0.0%) |
| 5 to 9 Unit Apartments | 0 (0.0%) | 0 (0.0%) |
| 10 or more Apartments | 0 (0.0%) | 0 (0.0%) |
| Mobile Home / Other | 33 (61.1%) | 21 (38.9%) |
| Total | 125 (85.6%) | 21 (14.4%) |
Housing Structures by Number of Rooms in Hackberry
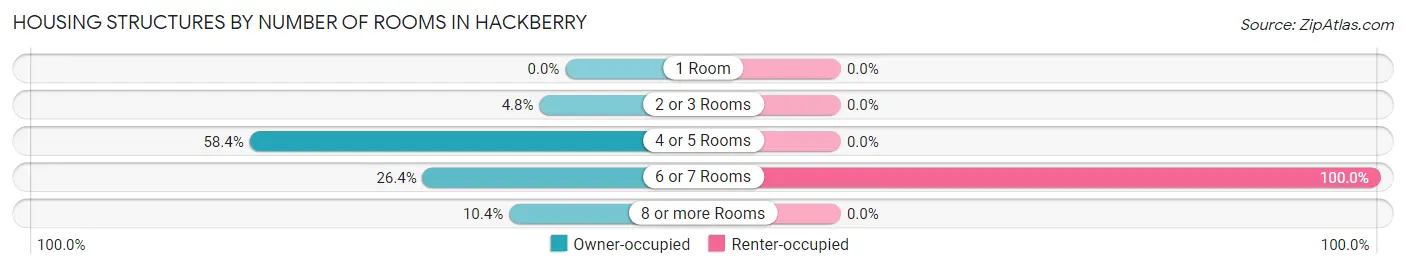
| Number of Rooms | Owner-occupied | Renter-occupied |
| 1 Room | 0 (0.0%) | 0 (0.0%) |
| 2 or 3 Rooms | 6 (4.8%) | 0 (0.0%) |
| 4 or 5 Rooms | 73 (58.4%) | 0 (0.0%) |
| 6 or 7 Rooms | 33 (26.4%) | 21 (100.0%) |
| 8 or more Rooms | 13 (10.4%) | 0 (0.0%) |
| Total | 125 (100.0%) | 21 (100.0%) |
Housing Structure by Heating Type in Hackberry
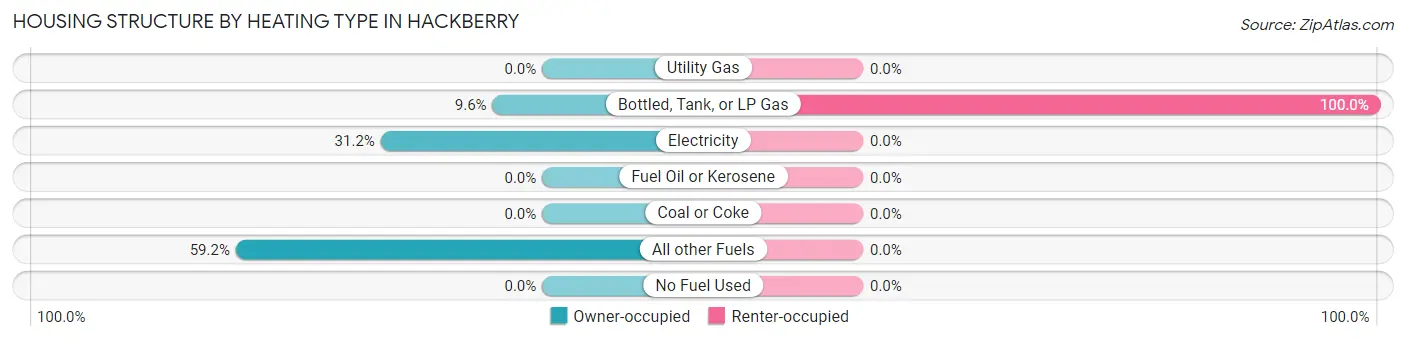
| Heating Type | Owner-occupied | Renter-occupied |
| Utility Gas | 0 (0.0%) | 0 (0.0%) |
| Bottled, Tank, or LP Gas | 12 (9.6%) | 21 (100.0%) |
| Electricity | 39 (31.2%) | 0 (0.0%) |
| Fuel Oil or Kerosene | 0 (0.0%) | 0 (0.0%) |
| Coal or Coke | 0 (0.0%) | 0 (0.0%) |
| All other Fuels | 74 (59.2%) | 0 (0.0%) |
| No Fuel Used | 0 (0.0%) | 0 (0.0%) |
| Total | 125 (100.0%) | 21 (100.0%) |
Household Vehicle Usage in Hackberry
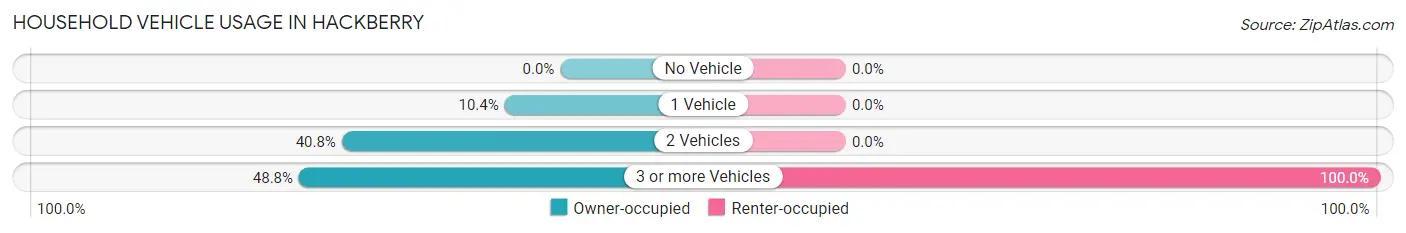
| Vehicles per Household | Owner-occupied | Renter-occupied |
| No Vehicle | 0 (0.0%) | 0 (0.0%) |
| 1 Vehicle | 13 (10.4%) | 0 (0.0%) |
| 2 Vehicles | 51 (40.8%) | 0 (0.0%) |
| 3 or more Vehicles | 61 (48.8%) | 21 (100.0%) |
| Total | 125 (100.0%) | 21 (100.0%) |
Real Estate & Mortgages in Hackberry
Real Estate and Mortgage Overview in Hackberry
| Characteristic | Without Mortgage | With Mortgage |
| Housing Units | 49 | 76 |
| Median Property Value | $163,800 | $0 |
| Median Household Income | - | - |
| Monthly Housing Costs | $265 | $0 |
| Real Estate Taxes | $788 | $0 |
Property Value by Mortgage Status in Hackberry
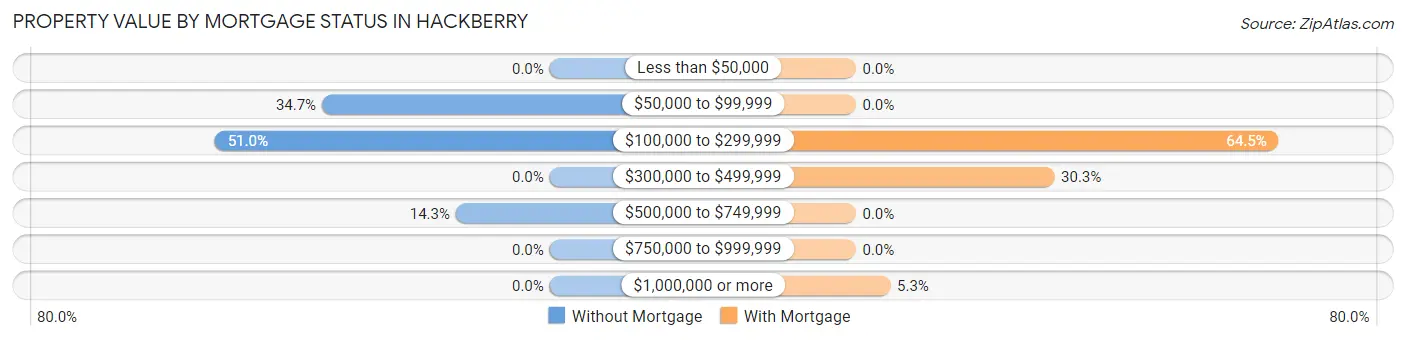
| Property Value | Without Mortgage | With Mortgage |
| Less than $50,000 | 0 (0.0%) | 0 (0.0%) |
| $50,000 to $99,999 | 17 (34.7%) | 0 (0.0%) |
| $100,000 to $299,999 | 25 (51.0%) | 49 (64.5%) |
| $300,000 to $499,999 | 0 (0.0%) | 23 (30.3%) |
| $500,000 to $749,999 | 7 (14.3%) | 0 (0.0%) |
| $750,000 to $999,999 | 0 (0.0%) | 0 (0.0%) |
| $1,000,000 or more | 0 (0.0%) | 4 (5.3%) |
| Total | 49 (100.0%) | 76 (100.0%) |
Household Income by Mortgage Status in Hackberry
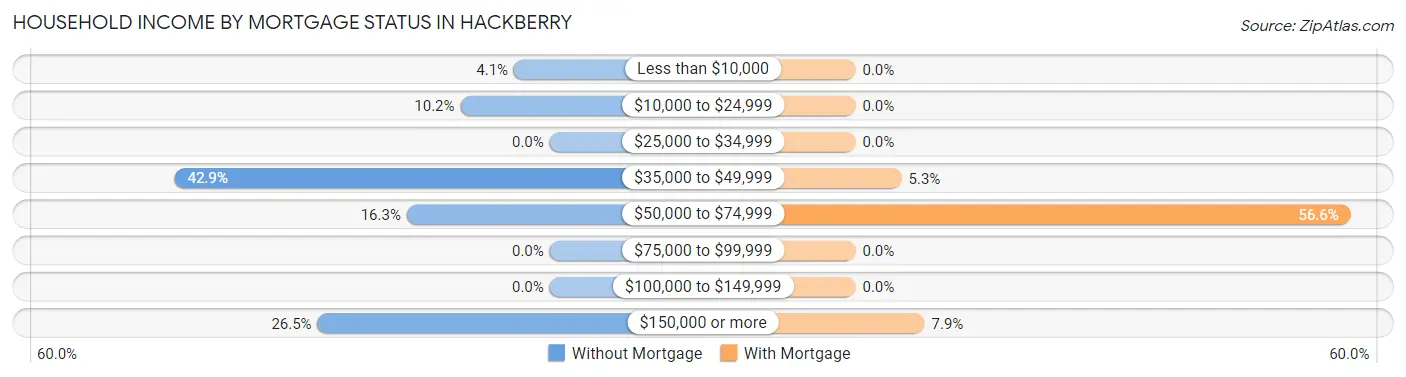
| Household Income | Without Mortgage | With Mortgage |
| Less than $10,000 | 2 (4.1%) | 0 (0.0%) |
| $10,000 to $24,999 | 5 (10.2%) | 0 (0.0%) |
| $25,000 to $34,999 | 0 (0.0%) | 0 (0.0%) |
| $35,000 to $49,999 | 21 (42.9%) | 4 (5.3%) |
| $50,000 to $74,999 | 8 (16.3%) | 43 (56.6%) |
| $75,000 to $99,999 | 0 (0.0%) | 0 (0.0%) |
| $100,000 to $149,999 | 0 (0.0%) | 0 (0.0%) |
| $150,000 or more | 13 (26.5%) | 6 (7.9%) |
| Total | 49 (100.0%) | 76 (100.0%) |
Property Value to Household Income Ratio in Hackberry
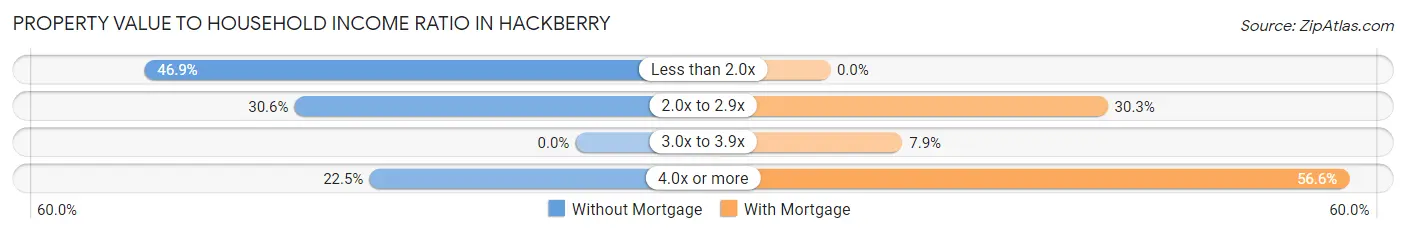
| Value-to-Income Ratio | Without Mortgage | With Mortgage |
| Less than 2.0x | 23 (46.9%) | 0 (0.0%) |
| 2.0x to 2.9x | 15 (30.6%) | 23 (30.3%) |
| 3.0x to 3.9x | 0 (0.0%) | 6 (7.9%) |
| 4.0x or more | 11 (22.5%) | 43 (56.6%) |
| Total | 49 (100.0%) | 76 (100.0%) |
Real Estate Taxes by Mortgage Status in Hackberry
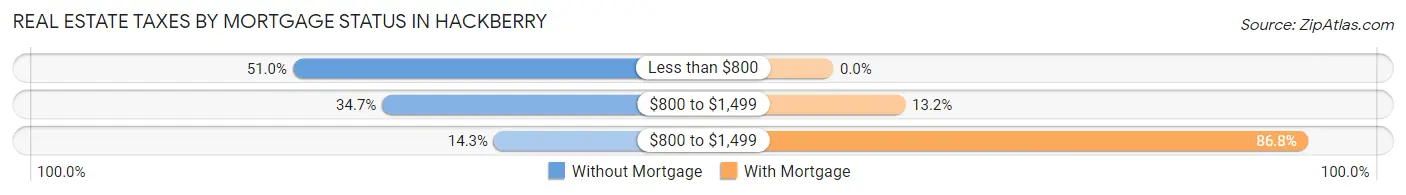
| Property Taxes | Without Mortgage | With Mortgage |
| Less than $800 | 25 (51.0%) | 0 (0.0%) |
| $800 to $1,499 | 17 (34.7%) | 10 (13.2%) |
| $800 to $1,499 | 7 (14.3%) | 66 (86.8%) |
| Total | 49 (100.0%) | 76 (100.0%) |
Health & Disability in Hackberry
Health Insurance Coverage by Age in Hackberry
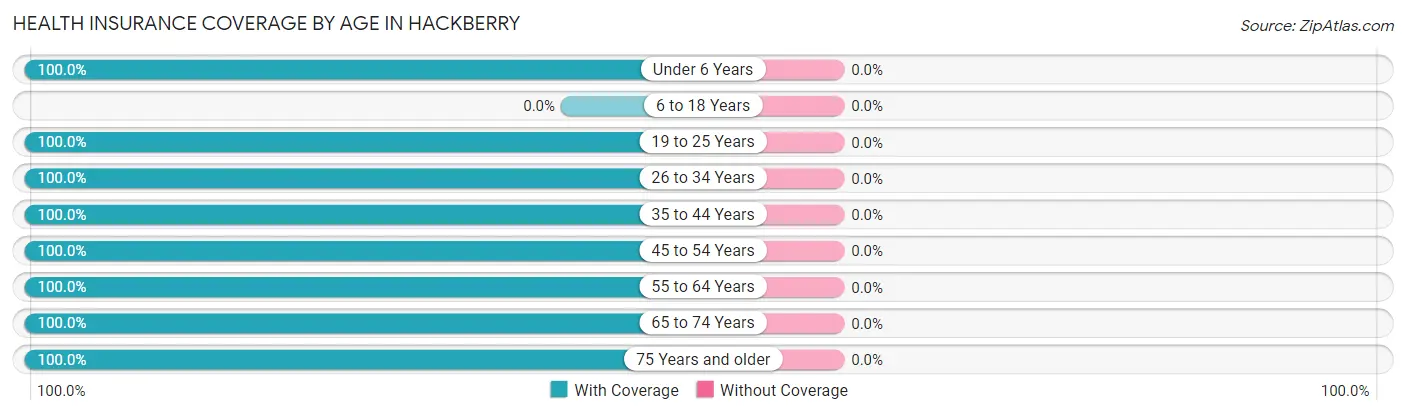
| Age Bracket | With Coverage | Without Coverage |
| Under 6 Years | 20 (100.0%) | 0 (0.0%) |
| 6 to 18 Years | 0 (0.0%) | 0 (0.0%) |
| 19 to 25 Years | 14 (100.0%) | 0 (0.0%) |
| 26 to 34 Years | 50 (100.0%) | 0 (0.0%) |
| 35 to 44 Years | 85 (100.0%) | 0 (0.0%) |
| 45 to 54 Years | 19 (100.0%) | 0 (0.0%) |
| 55 to 64 Years | 106 (100.0%) | 0 (0.0%) |
| 65 to 74 Years | 20 (100.0%) | 0 (0.0%) |
| 75 Years and older | 5 (100.0%) | 0 (0.0%) |
| Total | 319 (100.0%) | 0 (0.0%) |
Health Insurance Coverage by Citizenship Status in Hackberry
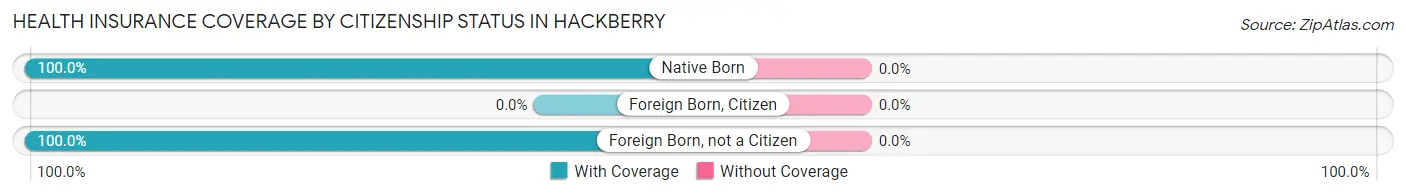
| Citizenship Status | With Coverage | Without Coverage |
| Native Born | 20 (100.0%) | 0 (0.0%) |
| Foreign Born, Citizen | 0 (0.0%) | 0 (0.0%) |
| Foreign Born, not a Citizen | 14 (100.0%) | 0 (0.0%) |
Health Insurance Coverage by Household Income in Hackberry
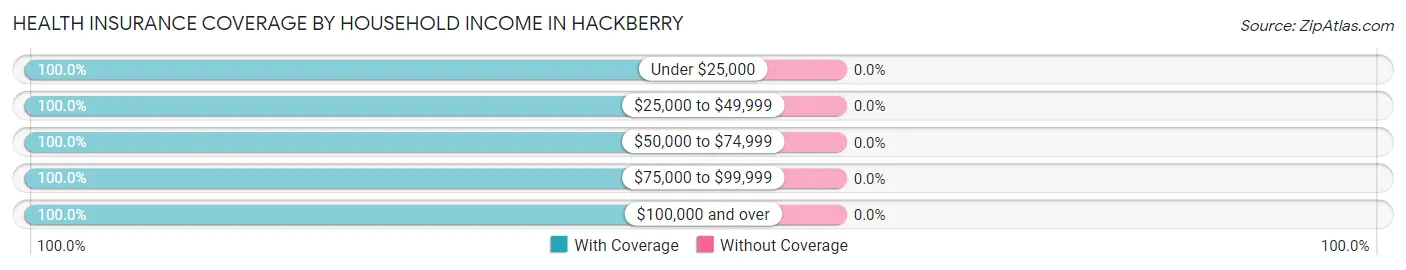
| Household Income | With Coverage | Without Coverage |
| Under $25,000 | 7 (100.0%) | 0 (0.0%) |
| $25,000 to $49,999 | 127 (100.0%) | 0 (0.0%) |
| $50,000 to $74,999 | 16 (100.0%) | 0 (0.0%) |
| $75,000 to $99,999 | 17 (100.0%) | 0 (0.0%) |
| $100,000 and over | 152 (100.0%) | 0 (0.0%) |
Public vs Private Health Insurance Coverage by Age in Hackberry
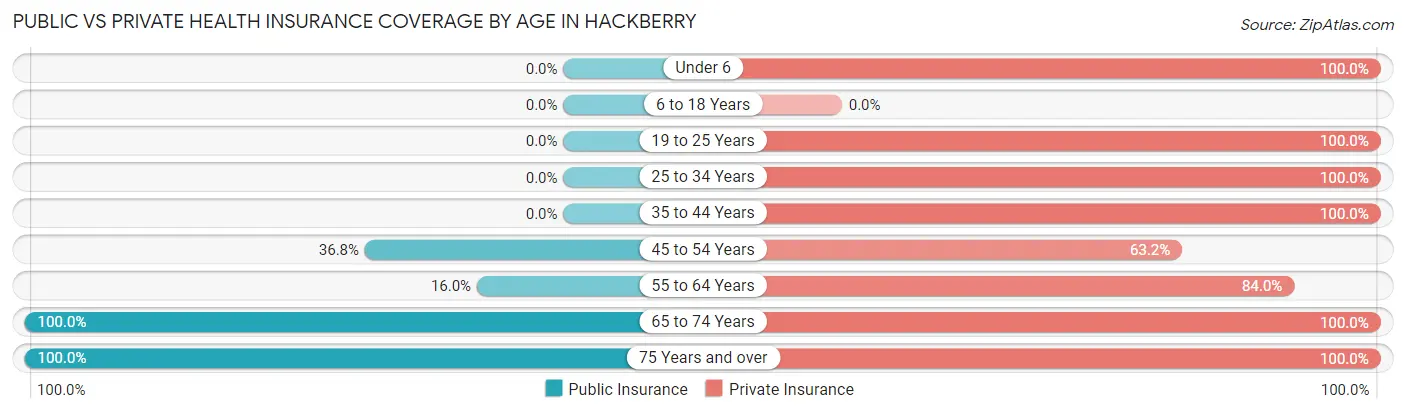
| Age Bracket | Public Insurance | Private Insurance |
| Under 6 | 0 (0.0%) | 20 (100.0%) |
| 6 to 18 Years | 0 (0.0%) | 0 (0.0%) |
| 19 to 25 Years | 0 (0.0%) | 14 (100.0%) |
| 25 to 34 Years | 0 (0.0%) | 50 (100.0%) |
| 35 to 44 Years | 0 (0.0%) | 85 (100.0%) |
| 45 to 54 Years | 7 (36.8%) | 12 (63.2%) |
| 55 to 64 Years | 17 (16.0%) | 89 (84.0%) |
| 65 to 74 Years | 20 (100.0%) | 20 (100.0%) |
| 75 Years and over | 5 (100.0%) | 5 (100.0%) |
| Total | 49 (15.4%) | 295 (92.5%) |
Disability Status by Sex by Age in Hackberry
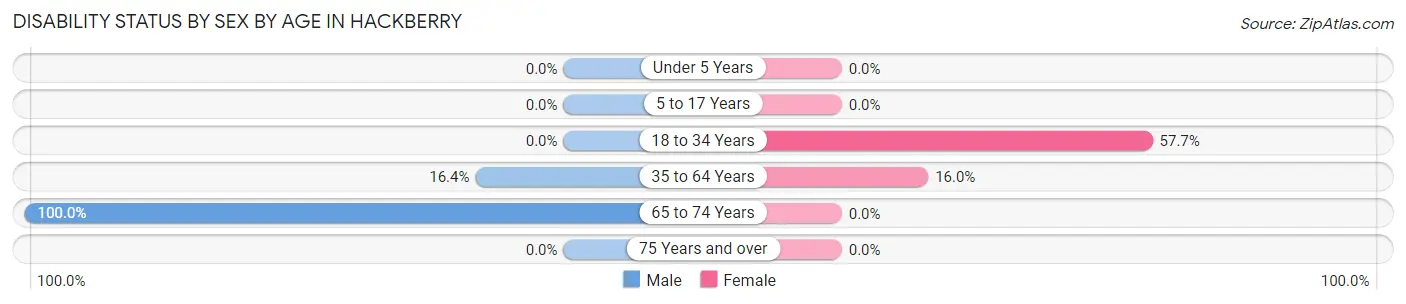
| Age Bracket | Male | Female |
| Under 5 Years | 0 (0.0%) | 0 (0.0%) |
| 5 to 17 Years | 0 (0.0%) | 0 (0.0%) |
| 18 to 34 Years | 0 (0.0%) | 15 (57.7%) |
| 35 to 64 Years | 17 (16.4%) | 17 (16.0%) |
| 65 to 74 Years | 5 (100.0%) | 0 (0.0%) |
| 75 Years and over | 0 (0.0%) | 0 (0.0%) |
Disability Class by Sex by Age in Hackberry
Disability Class: Hearing Difficulty
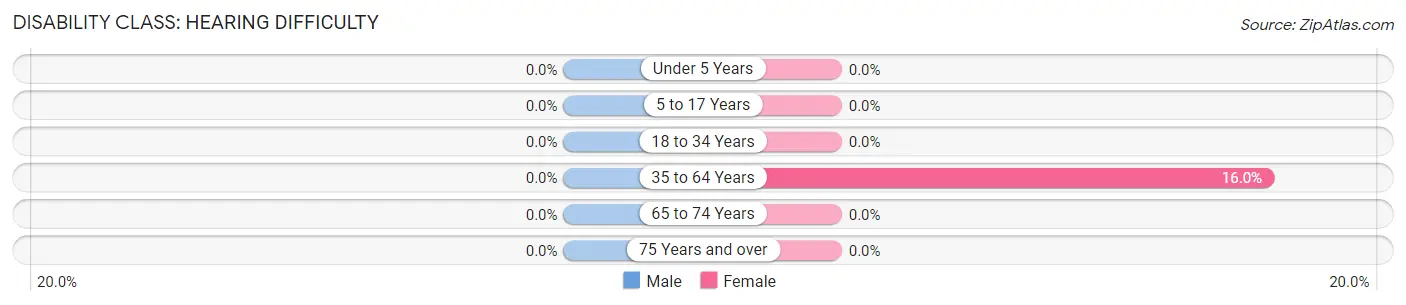
| Age Bracket | Male | Female |
| Under 5 Years | 0 (0.0%) | 0 (0.0%) |
| 5 to 17 Years | 0 (0.0%) | 0 (0.0%) |
| 18 to 34 Years | 0 (0.0%) | 0 (0.0%) |
| 35 to 64 Years | 0 (0.0%) | 17 (16.0%) |
| 65 to 74 Years | 0 (0.0%) | 0 (0.0%) |
| 75 Years and over | 0 (0.0%) | 0 (0.0%) |
Disability Class: Vision Difficulty
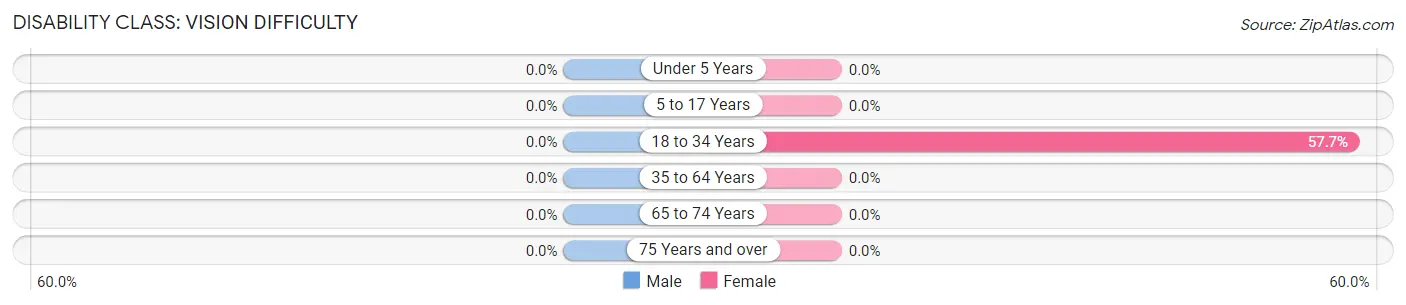
| Age Bracket | Male | Female |
| Under 5 Years | 0 (0.0%) | 0 (0.0%) |
| 5 to 17 Years | 0 (0.0%) | 0 (0.0%) |
| 18 to 34 Years | 0 (0.0%) | 15 (57.7%) |
| 35 to 64 Years | 0 (0.0%) | 0 (0.0%) |
| 65 to 74 Years | 0 (0.0%) | 0 (0.0%) |
| 75 Years and over | 0 (0.0%) | 0 (0.0%) |
Disability Class: Cognitive Difficulty
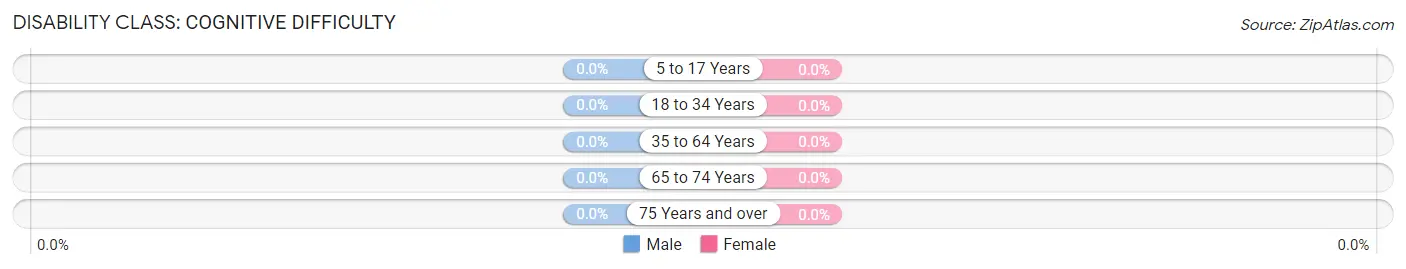
| Age Bracket | Male | Female |
| 5 to 17 Years | 0 (0.0%) | 0 (0.0%) |
| 18 to 34 Years | 0 (0.0%) | 0 (0.0%) |
| 35 to 64 Years | 0 (0.0%) | 0 (0.0%) |
| 65 to 74 Years | 0 (0.0%) | 0 (0.0%) |
| 75 Years and over | 0 (0.0%) | 0 (0.0%) |
Disability Class: Ambulatory Difficulty
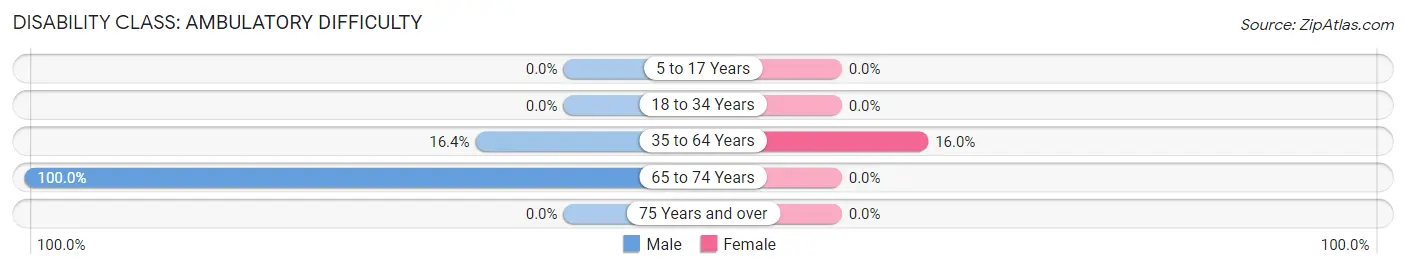
| Age Bracket | Male | Female |
| 5 to 17 Years | 0 (0.0%) | 0 (0.0%) |
| 18 to 34 Years | 0 (0.0%) | 0 (0.0%) |
| 35 to 64 Years | 17 (16.4%) | 17 (16.0%) |
| 65 to 74 Years | 5 (100.0%) | 0 (0.0%) |
| 75 Years and over | 0 (0.0%) | 0 (0.0%) |
Disability Class: Self-Care Difficulty
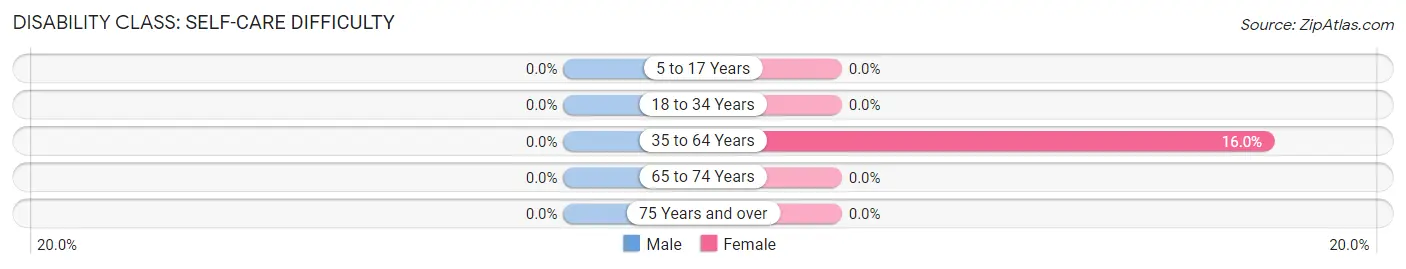
| Age Bracket | Male | Female |
| 5 to 17 Years | 0 (0.0%) | 0 (0.0%) |
| 18 to 34 Years | 0 (0.0%) | 0 (0.0%) |
| 35 to 64 Years | 0 (0.0%) | 17 (16.0%) |
| 65 to 74 Years | 0 (0.0%) | 0 (0.0%) |
| 75 Years and over | 0 (0.0%) | 0 (0.0%) |
Technology Access in Hackberry
Computing Device Access in Hackberry
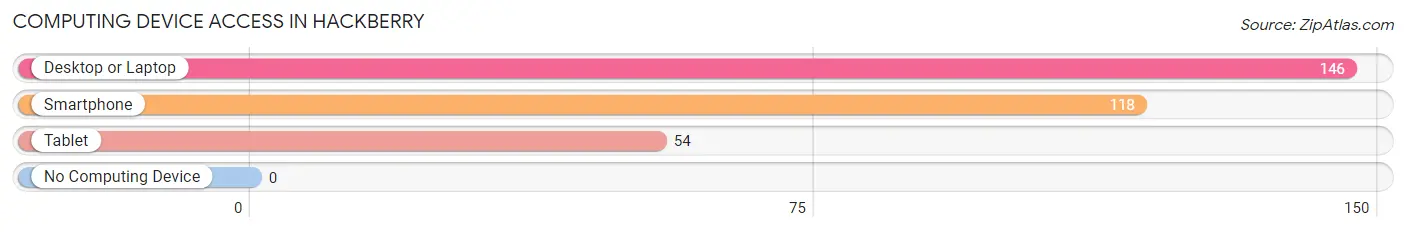
| Device Type | # Households | % Households |
| Desktop or Laptop | 146 | 100.0% |
| Smartphone | 118 | 80.8% |
| Tablet | 54 | 37.0% |
| No Computing Device | 0 | 0.0% |
| Total | 146 | 100.0% |
Internet Access in Hackberry
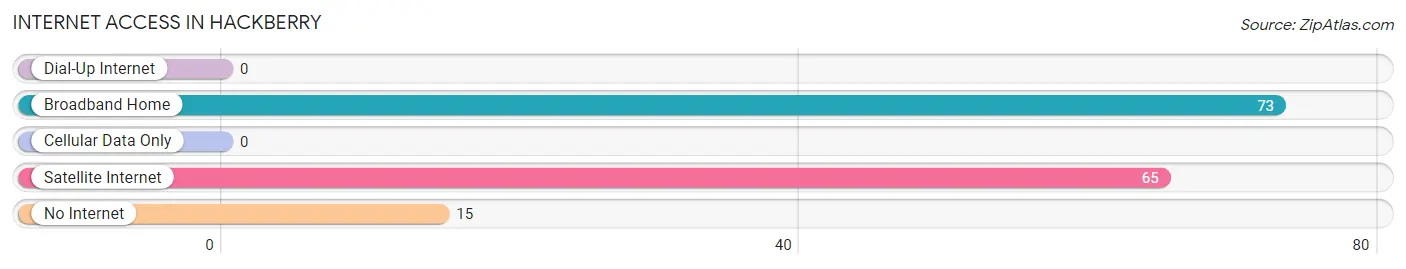
| Internet Type | # Households | % Households |
| Dial-Up Internet | 0 | 0.0% |
| Broadband Home | 73 | 50.0% |
| Cellular Data Only | 0 | 0.0% |
| Satellite Internet | 65 | 44.5% |
| No Internet | 15 | 10.3% |
| Total | 146 | 100.0% |
Hackberry Summary
Introduction
Located in the heart of the Arizona desert, the small town of Hackberry is a unique and vibrant community. With a population of just over 200 people, Hackberry is a small but thriving town that has a rich history, diverse geography, and a vibrant economy. This paper will explore the history, geography, economy, and demographics of Hackberry, Arizona in 2000 words.
History
The town of Hackberry was founded in 1883 by a group of settlers from the nearby town of Prescott. The settlers were looking for a place to settle and start a new life, and Hackberry seemed to fit the bill. The town was named after the hackberry tree, which was abundant in the area. The town quickly grew and by the early 1900s, it had become a bustling community with a population of over 500 people.
The town was home to a variety of businesses, including a general store, a blacksmith, a saloon, and a post office. The town also had a school, a church, and a cemetery. The town was a popular stop for travelers, as it was located on the main road between Prescott and Phoenix.
In the early 1900s, the town began to decline as the railroad bypassed it and the population began to dwindle. By the 1950s, the population had dropped to just over 200 people. Despite this, the town has managed to remain a vibrant and thriving community.
Geography
Hackberry is located in the heart of the Arizona desert, approximately 40 miles south of Prescott and 60 miles north of Phoenix. The town is situated in the foothills of the Bradshaw Mountains, which provide a stunning backdrop to the town. The town is surrounded by desert, with the closest major city being Phoenix.
The town is located at an elevation of 2,400 feet, and the climate is arid and hot. The average temperature in the summer is around 100 degrees Fahrenheit, and the average temperature in the winter is around 50 degrees Fahrenheit.
Economy
The economy of Hackberry is largely based on tourism and agriculture. The town is home to a variety of tourist attractions, including the Hackberry Historic District, which is listed on the National Register of Historic Places. The town is also home to a variety of farms, which produce a variety of crops, including alfalfa, cotton, and hay.
The town is also home to a variety of small businesses, including a general store, a gas station, a restaurant, and a bar. The town is also home to a variety of art galleries, which showcase the work of local artists.
Demographics
As of the 2010 census, the population of Hackberry was 203 people. The racial makeup of the town was 95.6% White, 0.5% African American, 0.5% Native American, 0.5% Asian, and 2.9% from other races. The median household income was $31,250, and the median age was 44.
Conclusion
Hackberry, Arizona is a small but vibrant town with a rich history, diverse geography, and a vibrant economy. The town is home to a variety of tourist attractions, farms, and small businesses, and the population is diverse and welcoming. Hackberry is a great place to visit or live, and it is sure to provide a unique and memorable experience.
Common Questions
What is Per Capita Income in Hackberry?
Per Capita income in Hackberry is $45,250.
What is Income or Wage Gap in Hackberry?
Income or Wage Gap in Hackberry is 37.0%.
Women in Hackberry earn 63.0 cents for every dollar earned by a man.
What is Inequality or Gini Index in Hackberry?
Inequality or Gini Index in Hackberry is 0.40.
What is the Total Population of Hackberry?
Total Population of Hackberry is 319.
What is the Total Male Population of Hackberry?
Total Male Population of Hackberry is 152.
What is the Total Female Population of Hackberry?
Total Female Population of Hackberry is 167.
What is the Ratio of Males per 100 Females in Hackberry?
There are 91.02 Males per 100 Females in Hackberry.
What is the Ratio of Females per 100 Males in Hackberry?
There are 109.87 Females per 100 Males in Hackberry.
What is the Median Population Age in Hackberry?
Median Population Age in Hackberry is 40.9 Years.
What is the Average Family Size in Hackberry
Average Family Size in Hackberry is 2.4 People.
What is the Average Household Size in Hackberry
Average Household Size in Hackberry is 2.2 People.
How Large is the Labor Force in Hackberry?
There are 169 People in the Labor Forcein in Hackberry.
What is the Percentage of People in the Labor Force in Hackberry?
56.5% of People are in the Labor Force in Hackberry.