Cave Creek, AZ Map & Demographics
Cave Creek Map
Cave Creek Overview
$58,217
PER CAPITA INCOME
$108,316
AVG FAMILY INCOME
$90,824
AVG HOUSEHOLD INCOME
40.4%
WAGE / INCOME GAP [ % ]
59.6¢/ $1
WAGE / INCOME GAP [ $ ]
$11,759
FAMILY INCOME DEFICIT
0.47
INEQUALITY / GINI INDEX
4,966
TOTAL POPULATION
2,359
MALE POPULATION
2,607
FEMALE POPULATION
90.49
MALES / 100 FEMALES
110.51
FEMALES / 100 MALES
58.1
MEDIAN AGE
2.7
AVG FAMILY SIZE
2.2
AVG HOUSEHOLD SIZE
2,299
LABOR FORCE [ PEOPLE ]
52.4%
PERCENT IN LABOR FORCE
4.5%
UNEMPLOYMENT RATE
Cave Creek Zip Codes
Income in Cave Creek
Income Overview in Cave Creek
Per Capita Income in Cave Creek is $58,217, while median incomes of families and households are $108,316 and $90,824 respectively.
| Characteristic | Number | Measure |
| Per Capita Income | 4,966 | $58,217 |
| Median Family Income | 1,512 | $108,316 |
| Mean Family Income | 1,512 | $135,680 |
| Median Household Income | 2,275 | $90,824 |
| Mean Household Income | 2,275 | $124,462 |
| Income Deficit | 1,512 | $11,759 |
| Wage / Income Gap (%) | 4,966 | 40.39% |
| Wage / Income Gap ($) | 4,966 | 59.61¢ per $1 |
| Gini / Inequality Index | 4,966 | 0.47 |
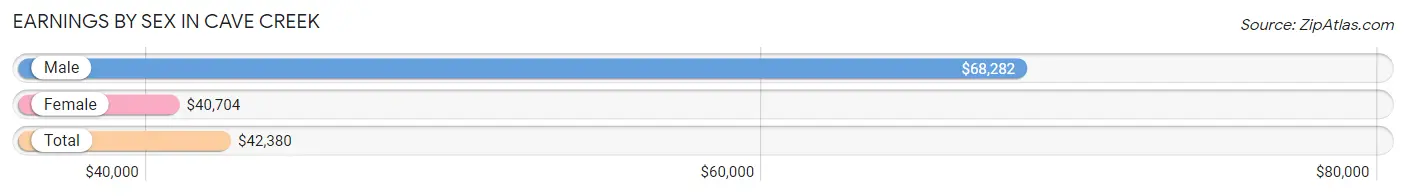
Earnings by Sex in Cave Creek
Average Earnings in Cave Creek are $42,380, $68,282 for men and $40,704 for women, a difference of 40.4%.
| Sex | Number | Average Earnings |
| Male | 1,352 (54.8%) | $68,282 |
| Female | 1,114 (45.2%) | $40,704 |
| Total | 2,466 (100.0%) | $42,380 |
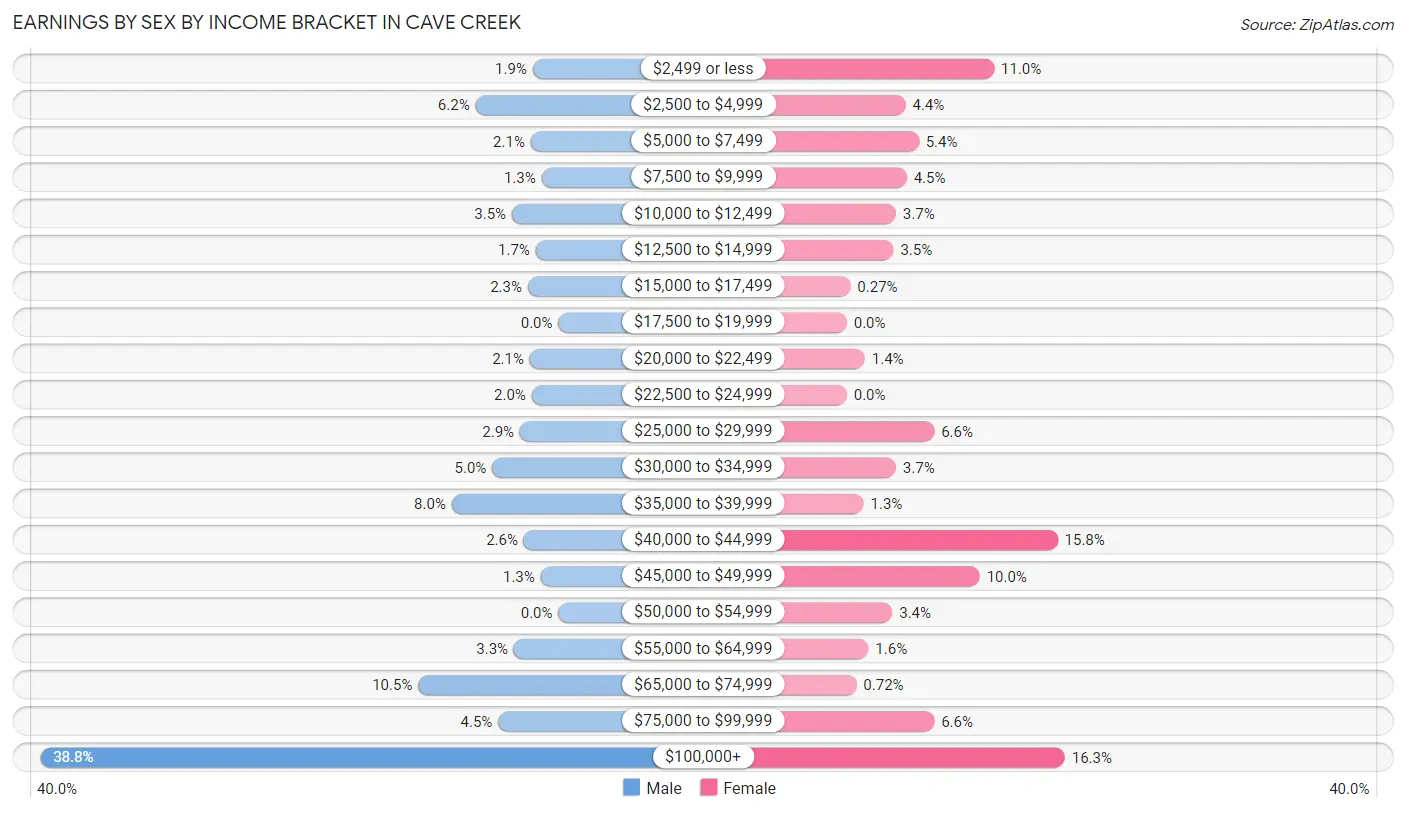
Earnings by Sex by Income Bracket in Cave Creek
The most common earnings brackets in Cave Creek are $100,000+ for men (525 | 38.8%) and $100,000+ for women (182 | 16.3%).
| Income | Male | Female |
| $2,499 or less | 26 (1.9%) | 123 (11.0%) |
| $2,500 to $4,999 | 84 (6.2%) | 49 (4.4%) |
| $5,000 to $7,499 | 28 (2.1%) | 60 (5.4%) |
| $7,500 to $9,999 | 17 (1.3%) | 50 (4.5%) |
| $10,000 to $12,499 | 47 (3.5%) | 41 (3.7%) |
| $12,500 to $14,999 | 23 (1.7%) | 39 (3.5%) |
| $15,000 to $17,499 | 31 (2.3%) | 3 (0.3%) |
| $17,500 to $19,999 | 0 (0.0%) | 0 (0.0%) |
| $20,000 to $22,499 | 29 (2.1%) | 15 (1.3%) |
| $22,500 to $24,999 | 27 (2.0%) | 0 (0.0%) |
| $25,000 to $29,999 | 39 (2.9%) | 73 (6.6%) |
| $30,000 to $34,999 | 67 (5.0%) | 41 (3.7%) |
| $35,000 to $39,999 | 108 (8.0%) | 14 (1.3%) |
| $40,000 to $44,999 | 35 (2.6%) | 176 (15.8%) |
| $45,000 to $49,999 | 18 (1.3%) | 111 (10.0%) |
| $50,000 to $54,999 | 0 (0.0%) | 38 (3.4%) |
| $55,000 to $64,999 | 45 (3.3%) | 18 (1.6%) |
| $65,000 to $74,999 | 142 (10.5%) | 8 (0.7%) |
| $75,000 to $99,999 | 61 (4.5%) | 73 (6.6%) |
| $100,000+ | 525 (38.8%) | 182 (16.3%) |
| Total | 1,352 (100.0%) | 1,114 (100.0%) |
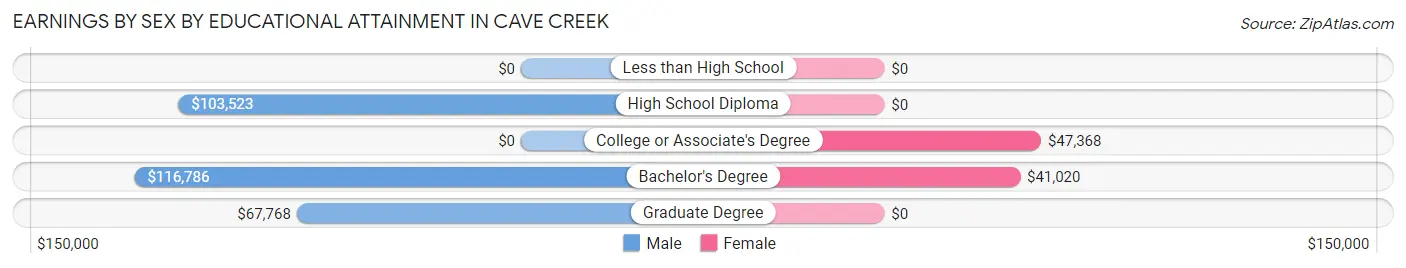
Earnings by Sex by Educational Attainment in Cave Creek
Average earnings in Cave Creek are $69,227 for men and $41,063 for women, a difference of 40.7%. Men with an educational attainment of bachelor's degree enjoy the highest average annual earnings of $116,786, while those with graduate degree education earn the least with $67,768. Women with an educational attainment of college or associate's degree earn the most with the average annual earnings of $47,368, while those with bachelor's degree education have the smallest earnings of $41,020.
| Educational Attainment | Male Income | Female Income |
| Less than High School | - | - |
| High School Diploma | $103,523 | $0 |
| College or Associate's Degree | - | - |
| Bachelor's Degree | $116,786 | $41,020 |
| Graduate Degree | $67,768 | $0 |
| Total | $69,227 | $41,063 |
Family Income in Cave Creek
Family Income Brackets in Cave Creek
According to the Cave Creek family income data, there are 339 families falling into the $200,000+ income range, which is the most common income bracket and makes up 22.4% of all families. Conversely, the $15,000 to $24,999 income bracket is the least frequent group with only 8 families (0.5%) belonging to this category.
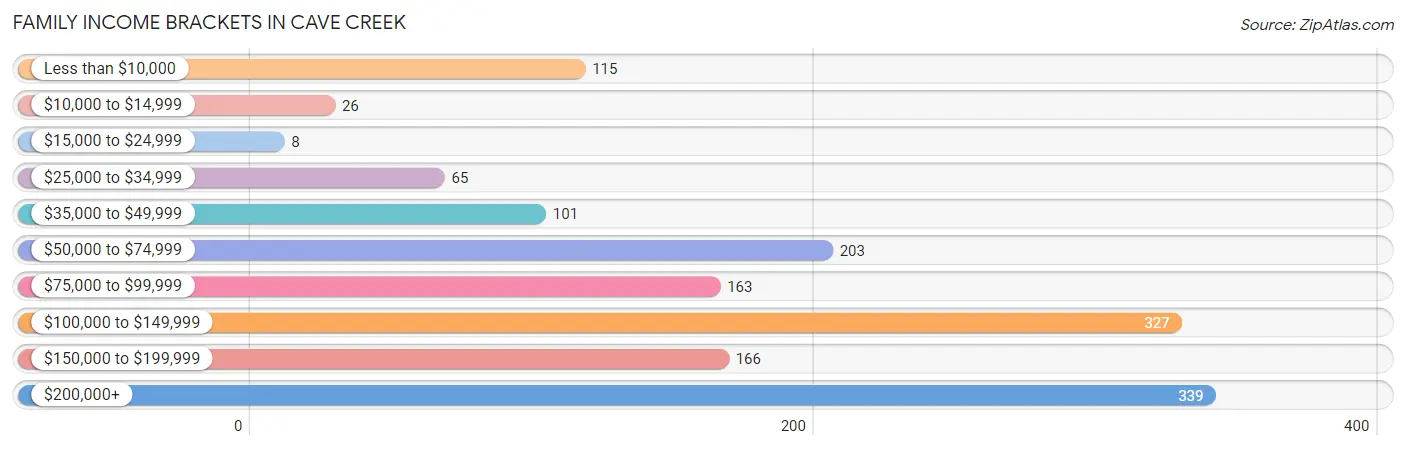
| Income Bracket | # Families | % Families |
| Less than $10,000 | 115 | 7.6% |
| $10,000 to $14,999 | 26 | 1.7% |
| $15,000 to $24,999 | 8 | 0.5% |
| $25,000 to $34,999 | 65 | 4.3% |
| $35,000 to $49,999 | 101 | 6.7% |
| $50,000 to $74,999 | 203 | 13.4% |
| $75,000 to $99,999 | 163 | 10.8% |
| $100,000 to $149,999 | 327 | 21.6% |
| $150,000 to $199,999 | 166 | 11.0% |
| $200,000+ | 339 | 22.4% |
Family Income by Famaliy Size in Cave Creek
2-person families (972 | 64.3%) account for the highest median family income in Cave Creek with $87,656 per family, while 2-person families (972 | 64.3%) have the highest median income of $43,828 per family member.
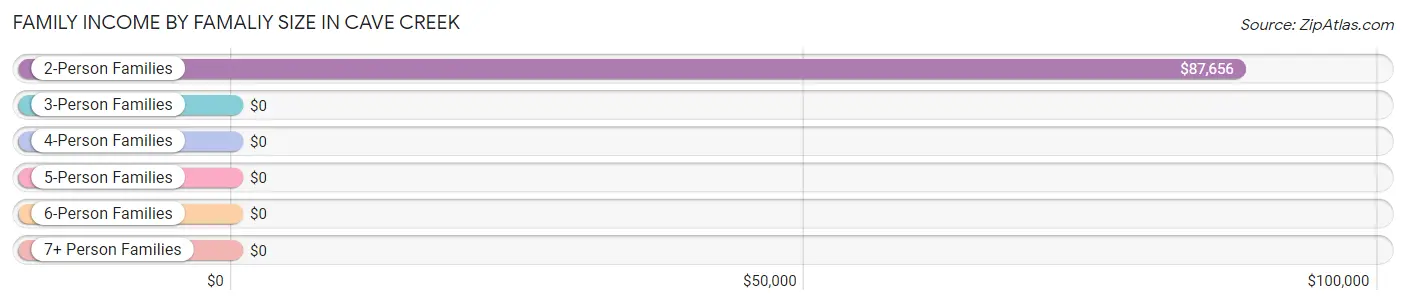
| Income Bracket | # Families | Median Income |
| 2-Person Families | 972 (64.3%) | $87,656 |
| 3-Person Families | 304 (20.1%) | $0 |
| 4-Person Families | 140 (9.3%) | $0 |
| 5-Person Families | 89 (5.9%) | $0 |
| 6-Person Families | 7 (0.5%) | $0 |
| 7+ Person Families | 0 (0.0%) | $0 |
| Total | 1,512 (100.0%) | $108,316 |
Family Income by Number of Earners in Cave Creek
The median family income in Cave Creek is $108,316, with families comprising 3+ earners (67) having the highest median family income of $234,732, while families with no earners (479) have the lowest median family income of $69,563, accounting for 4.4% and 31.7% of families, respectively.
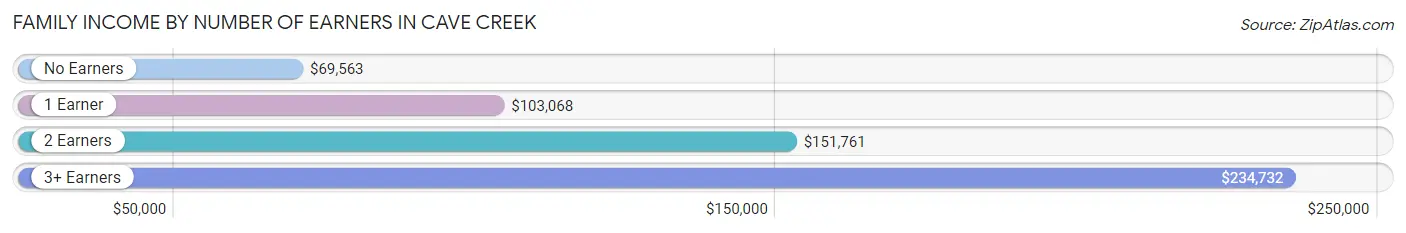
| Number of Earners | # Families | Median Income |
| No Earners | 479 (31.7%) | $69,563 |
| 1 Earner | 293 (19.4%) | $103,068 |
| 2 Earners | 673 (44.5%) | $151,761 |
| 3+ Earners | 67 (4.4%) | $234,732 |
| Total | 1,512 (100.0%) | $108,316 |
Household Income in Cave Creek
Household Income Brackets in Cave Creek
With 435 households falling in the category, the $200,000+ income range is the most frequent in Cave Creek, accounting for 19.1% of all households. In contrast, only 43 households (1.9%) fall into the $10,000 to $14,999 income bracket, making it the least populous group.
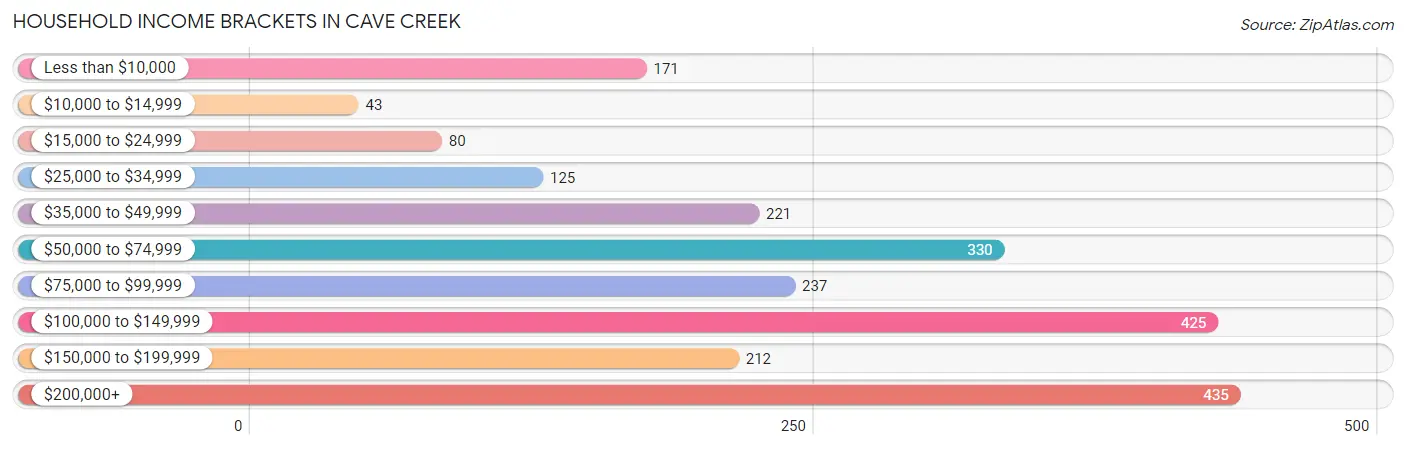
| Income Bracket | # Households | % Households |
| Less than $10,000 | 171 | 7.5% |
| $10,000 to $14,999 | 43 | 1.9% |
| $15,000 to $24,999 | 80 | 3.5% |
| $25,000 to $34,999 | 125 | 5.5% |
| $35,000 to $49,999 | 221 | 9.7% |
| $50,000 to $74,999 | 330 | 14.5% |
| $75,000 to $99,999 | 237 | 10.4% |
| $100,000 to $149,999 | 425 | 18.7% |
| $150,000 to $199,999 | 212 | 9.3% |
| $200,000+ | 435 | 19.1% |
Household Income by Householder Age in Cave Creek
The median household income in Cave Creek is $90,824, with the highest median household income of $133,250 found in the 45 to 64 years age bracket for the primary householder. A total of 810 households (35.6%) fall into this category. Meanwhile, the 15 to 24 years age bracket for the primary householder has the lowest median household income of $0, with 33 households (1.5%) in this group.
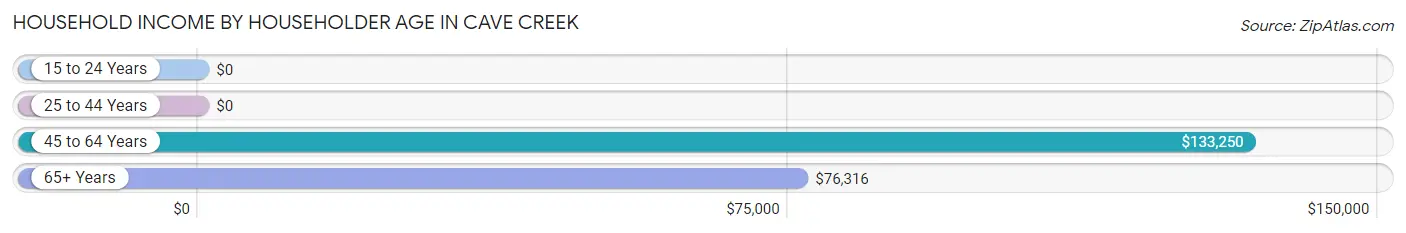
| Income Bracket | # Households | Median Income |
| 15 to 24 Years | 33 (1.5%) | $0 |
| 25 to 44 Years | 184 (8.1%) | $0 |
| 45 to 64 Years | 810 (35.6%) | $133,250 |
| 65+ Years | 1,248 (54.9%) | $76,316 |
| Total | 2,275 (100.0%) | $90,824 |
Poverty in Cave Creek
Income Below Poverty by Sex and Age in Cave Creek
With 10.6% poverty level for males and 15.2% for females among the residents of Cave Creek, 6 to 11 year old males and 6 to 11 year old females are the most vulnerable to poverty, with 47 males (46.5%) and 69 females (86.3%) in their respective age groups living below the poverty level.
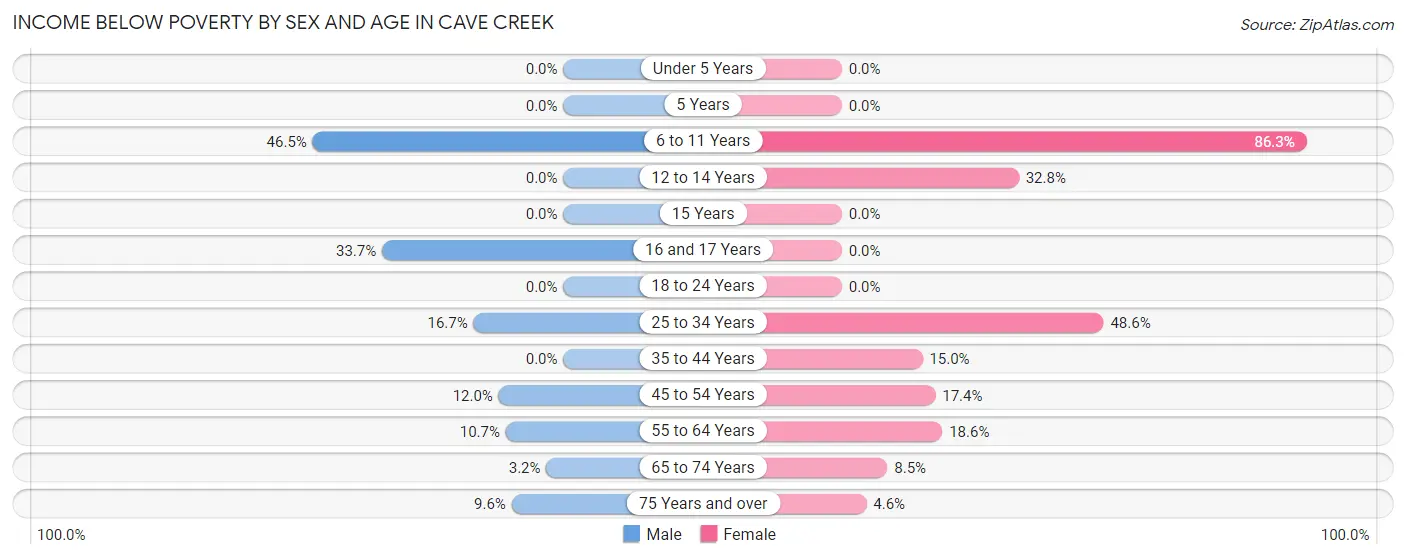
| Age Bracket | Male | Female |
| Under 5 Years | 0 (0.0%) | 0 (0.0%) |
| 5 Years | 0 (0.0%) | 0 (0.0%) |
| 6 to 11 Years | 47 (46.5%) | 69 (86.3%) |
| 12 to 14 Years | 0 (0.0%) | 22 (32.8%) |
| 15 Years | 0 (0.0%) | 0 (0.0%) |
| 16 and 17 Years | 35 (33.7%) | 0 (0.0%) |
| 18 to 24 Years | 0 (0.0%) | 0 (0.0%) |
| 25 to 34 Years | 28 (16.7%) | 51 (48.6%) |
| 35 to 44 Years | 0 (0.0%) | 22 (15.0%) |
| 45 to 54 Years | 33 (12.0%) | 88 (17.4%) |
| 55 to 64 Years | 52 (10.7%) | 77 (18.6%) |
| 65 to 74 Years | 17 (3.2%) | 46 (8.5%) |
| 75 Years and over | 37 (9.6%) | 22 (4.6%) |
| Total | 249 (10.6%) | 397 (15.2%) |
Income Above Poverty by Sex and Age in Cave Creek
According to the poverty statistics in Cave Creek, males aged under 5 years and females aged under 5 years are the age groups that are most secure financially, with 100.0% of males and 100.0% of females in these age groups living above the poverty line.
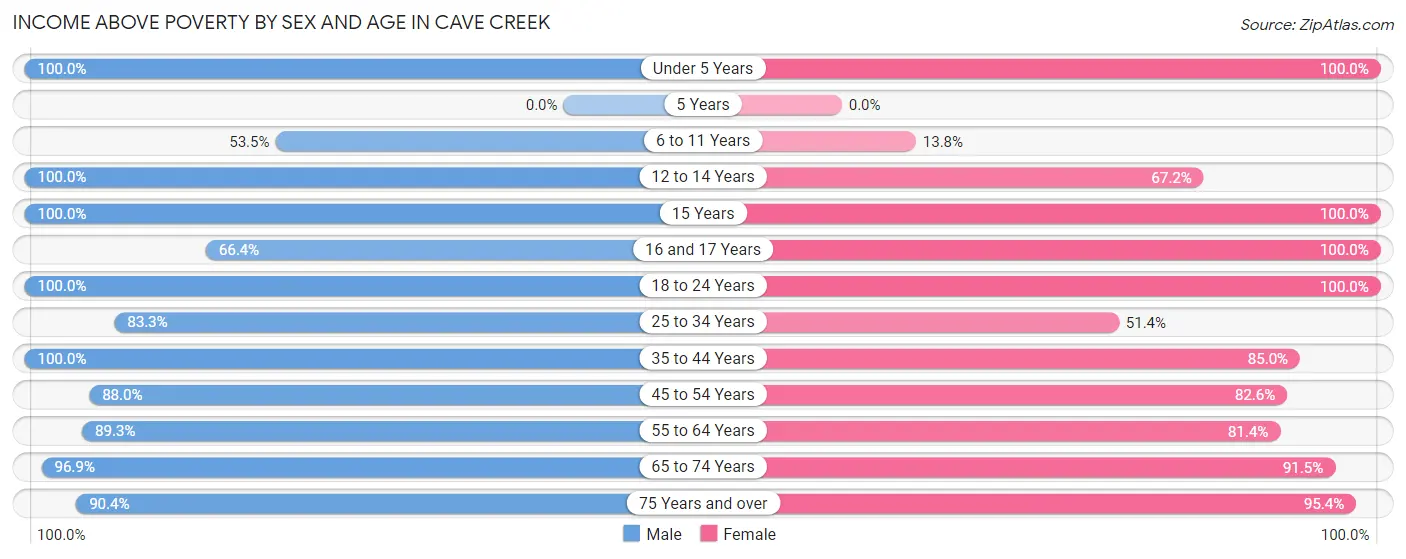
| Age Bracket | Male | Female |
| Under 5 Years | 118 (100.0%) | 19 (100.0%) |
| 5 Years | 0 (0.0%) | 0 (0.0%) |
| 6 to 11 Years | 54 (53.5%) | 11 (13.8%) |
| 12 to 14 Years | 49 (100.0%) | 45 (67.2%) |
| 15 Years | 5 (100.0%) | 139 (100.0%) |
| 16 and 17 Years | 69 (66.3%) | 32 (100.0%) |
| 18 to 24 Years | 49 (100.0%) | 72 (100.0%) |
| 25 to 34 Years | 140 (83.3%) | 54 (51.4%) |
| 35 to 44 Years | 78 (100.0%) | 125 (85.0%) |
| 45 to 54 Years | 242 (88.0%) | 419 (82.6%) |
| 55 to 64 Years | 435 (89.3%) | 336 (81.4%) |
| 65 to 74 Years | 522 (96.9%) | 498 (91.5%) |
| 75 Years and over | 349 (90.4%) | 460 (95.4%) |
| Total | 2,110 (89.4%) | 2,210 (84.8%) |
Income Below Poverty Among Married-Couple Families in Cave Creek
The poverty statistics for married-couple families in Cave Creek show that 6.8% or 89 of the total 1,317 families live below the poverty line. Families with 1 or 2 children have the highest poverty rate of 11.0%, comprising of 25 families. On the other hand, families with 3 or 4 children have the lowest poverty rate of 0.0%, which includes 0 families.
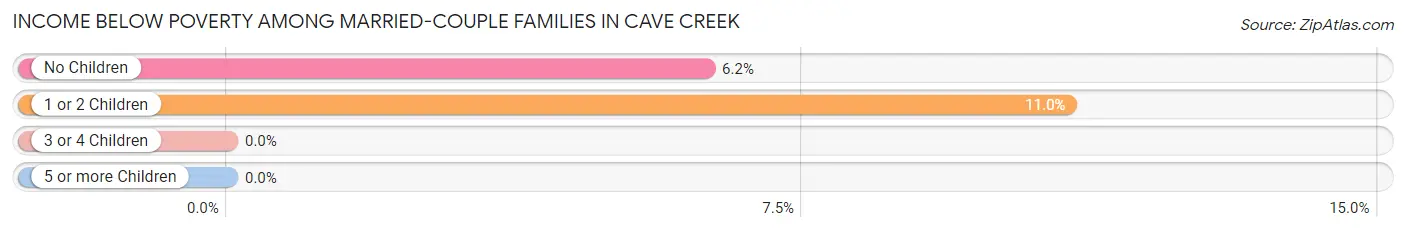
| Children | Above Poverty | Below Poverty |
| No Children | 964 (93.8%) | 64 (6.2%) |
| 1 or 2 Children | 203 (89.0%) | 25 (11.0%) |
| 3 or 4 Children | 61 (100.0%) | 0 (0.0%) |
| 5 or more Children | 0 (0.0%) | 0 (0.0%) |
| Total | 1,228 (93.2%) | 89 (6.8%) |
Income Below Poverty Among Single-Parent Households in Cave Creek
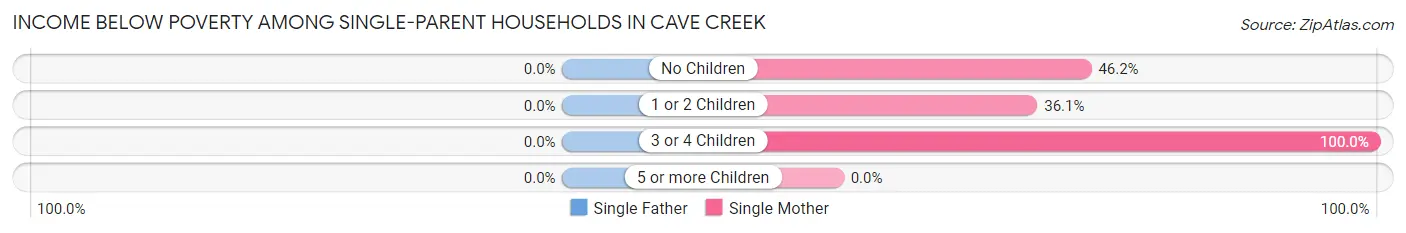
| Children | Single Father | Single Mother |
| No Children | 0 (0.0%) | 36 (46.2%) |
| 1 or 2 Children | 0 (0.0%) | 22 (36.1%) |
| 3 or 4 Children | 0 (0.0%) | 22 (100.0%) |
| 5 or more Children | 0 (0.0%) | 0 (0.0%) |
| Total | 0 (0.0%) | 80 (49.7%) |
Income Below Poverty Among Married-Couple vs Single-Parent Households in Cave Creek
The poverty data for Cave Creek shows that 89 of the married-couple family households (6.8%) and 80 of the single-parent households (41.0%) are living below the poverty level. Within the married-couple family households, those with 1 or 2 children have the highest poverty rate, with 25 households (11.0%) falling below the poverty line. Among the single-parent households, those with 3 or 4 children have the highest poverty rate, with 22 household (100.0%) living below poverty.
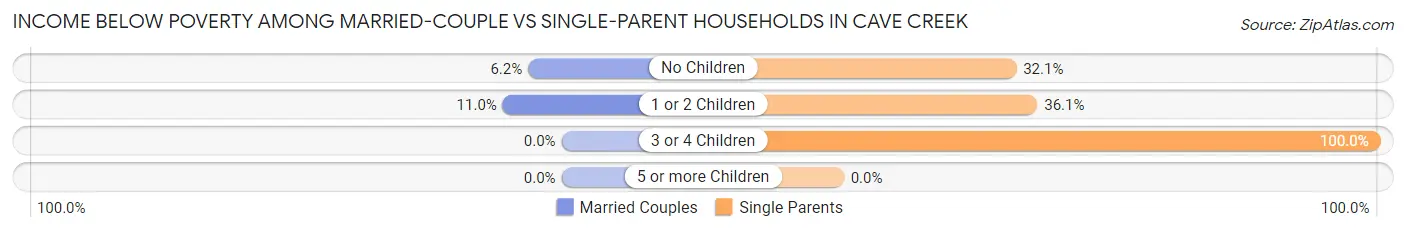
| Children | Married-Couple Families | Single-Parent Households |
| No Children | 64 (6.2%) | 36 (32.1%) |
| 1 or 2 Children | 25 (11.0%) | 22 (36.1%) |
| 3 or 4 Children | 0 (0.0%) | 22 (100.0%) |
| 5 or more Children | 0 (0.0%) | 0 (0.0%) |
| Total | 89 (6.8%) | 80 (41.0%) |
Race in Cave Creek
The most populous races in Cave Creek are White / Caucasian (4,437 | 89.3%), Hispanic or Latino (238 | 4.8%), and Two or more Races (228 | 4.6%).
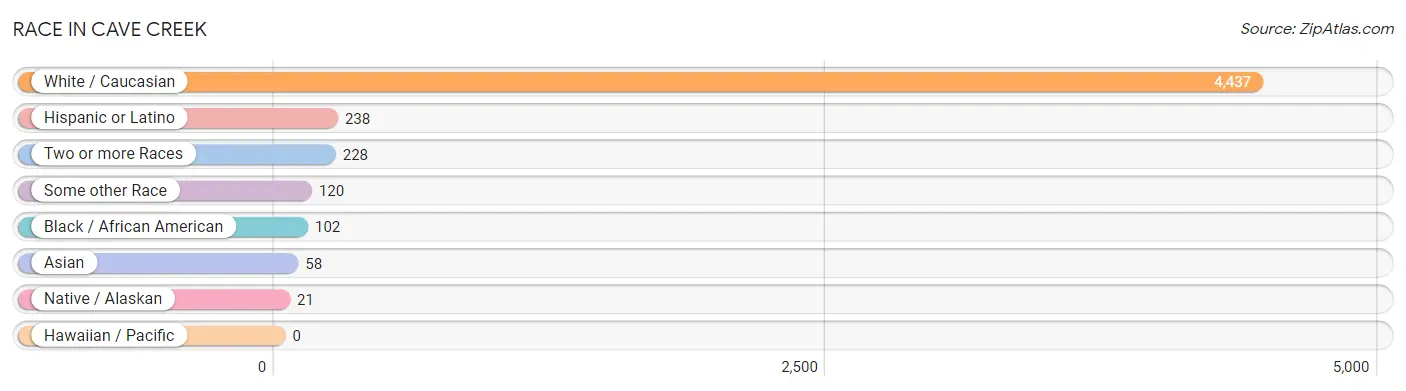
| Race | # Population | % Population |
| Asian | 58 | 1.2% |
| Black / African American | 102 | 2.1% |
| Hawaiian / Pacific | 0 | 0.0% |
| Hispanic or Latino | 238 | 4.8% |
| Native / Alaskan | 21 | 0.4% |
| White / Caucasian | 4,437 | 89.3% |
| Two or more Races | 228 | 4.6% |
| Some other Race | 120 | 2.4% |
| Total | 4,966 | 100.0% |
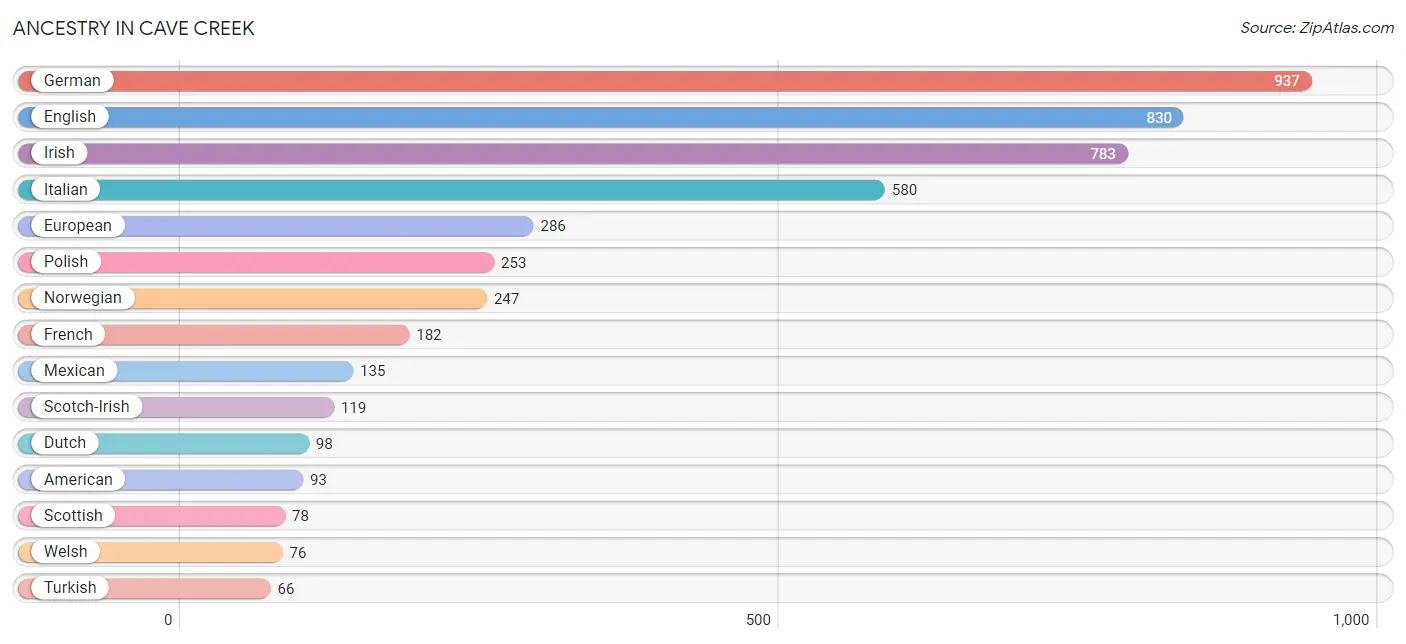
Ancestry in Cave Creek
The most populous ancestries reported in Cave Creek are German (937 | 18.9%), English (830 | 16.7%), Irish (783 | 15.8%), Italian (580 | 11.7%), and European (286 | 5.8%), together accounting for 68.8% of all Cave Creek residents.
| Ancestry | # Population | % Population |
| American | 93 | 1.9% |
| Arab | 11 | 0.2% |
| Armenian | 18 | 0.4% |
| Australian | 21 | 0.4% |
| British | 53 | 1.1% |
| Canadian | 19 | 0.4% |
| Choctaw | 6 | 0.1% |
| Colombian | 11 | 0.2% |
| Croatian | 20 | 0.4% |
| Czech | 51 | 1.0% |
| Czechoslovakian | 18 | 0.4% |
| Danish | 32 | 0.6% |
| Dutch | 98 | 2.0% |
| Eastern European | 19 | 0.4% |
| English | 830 | 16.7% |
| European | 286 | 5.8% |
| Finnish | 12 | 0.2% |
| French | 182 | 3.7% |
| French Canadian | 9 | 0.2% |
| German | 937 | 18.9% |
| Greek | 18 | 0.4% |
| Hungarian | 38 | 0.8% |
| Indian (Asian) | 58 | 1.2% |
| Irish | 783 | 15.8% |
| Italian | 580 | 11.7% |
| Korean | 8 | 0.2% |
| Lithuanian | 6 | 0.1% |
| Mexican | 135 | 2.7% |
| Norwegian | 247 | 5.0% |
| Peruvian | 38 | 0.8% |
| Polish | 253 | 5.1% |
| Romanian | 12 | 0.2% |
| Russian | 35 | 0.7% |
| Scandinavian | 60 | 1.2% |
| Scotch-Irish | 119 | 2.4% |
| Scottish | 78 | 1.6% |
| Slavic | 5 | 0.1% |
| Slovak | 11 | 0.2% |
| Slovene | 8 | 0.2% |
| South American | 49 | 1.0% |
| Spaniard | 8 | 0.2% |
| Swedish | 50 | 1.0% |
| Swiss | 11 | 0.2% |
| Thai | 29 | 0.6% |
| Turkish | 66 | 1.3% |
| Ukrainian | 7 | 0.1% |
| Welsh | 76 | 1.5% | View All 47 Rows |
Immigrants in Cave Creek
The most numerous immigrant groups reported in Cave Creek came from Europe (124 | 2.5%), Canada (94 | 1.9%), Latin America (66 | 1.3%), Northern Europe (47 | 0.9%), and Peru (38 | 0.8%), together accounting for 7.4% of all Cave Creek residents.
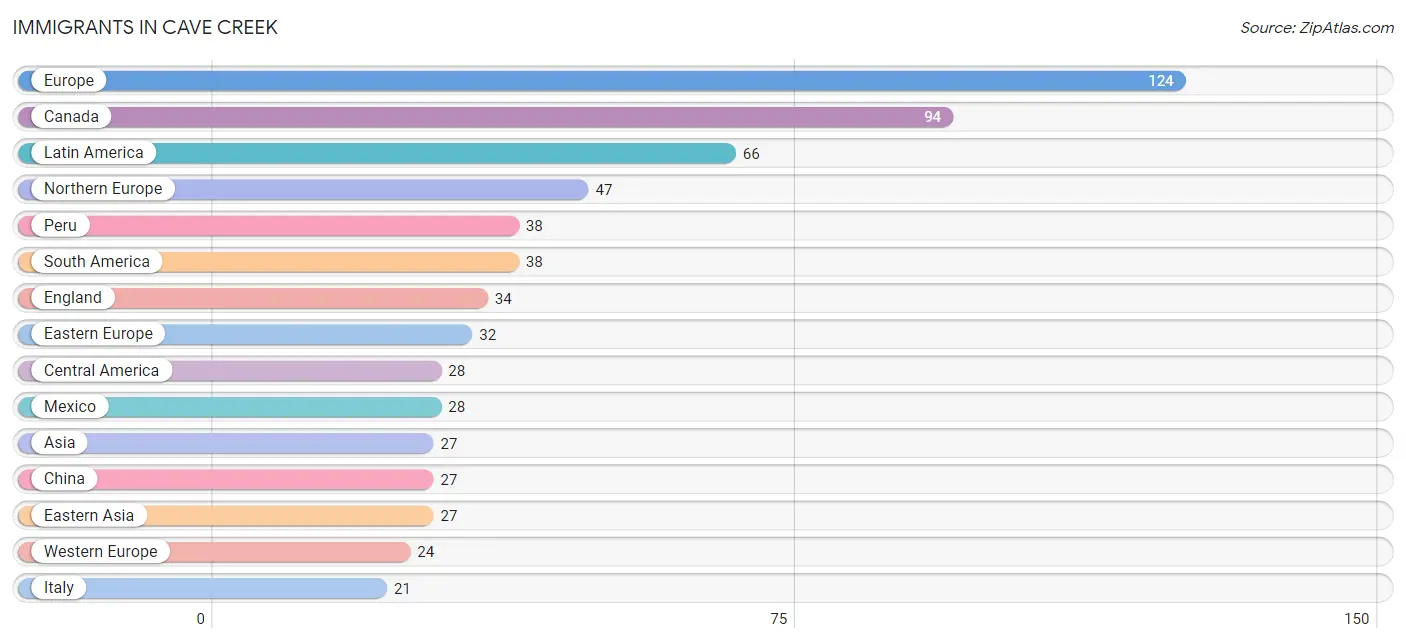
| Immigration Origin | # Population | % Population |
| Asia | 27 | 0.5% |
| Canada | 94 | 1.9% |
| Central America | 28 | 0.6% |
| China | 27 | 0.5% |
| Eastern Asia | 27 | 0.5% |
| Eastern Europe | 32 | 0.6% |
| England | 34 | 0.7% |
| Europe | 124 | 2.5% |
| Germany | 12 | 0.2% |
| Italy | 21 | 0.4% |
| Latin America | 66 | 1.3% |
| Mexico | 28 | 0.6% |
| Netherlands | 12 | 0.2% |
| Northern Europe | 47 | 0.9% |
| Peru | 38 | 0.8% |
| Romania | 12 | 0.2% |
| South America | 38 | 0.8% |
| Southern Europe | 21 | 0.4% |
| Western Europe | 24 | 0.5% | View All 19 Rows |
Sex and Age in Cave Creek
Sex and Age in Cave Creek
The most populous age groups in Cave Creek are 55 to 59 Years (340 | 14.4%) for men and 50 to 54 Years (434 | 16.7%) for women.
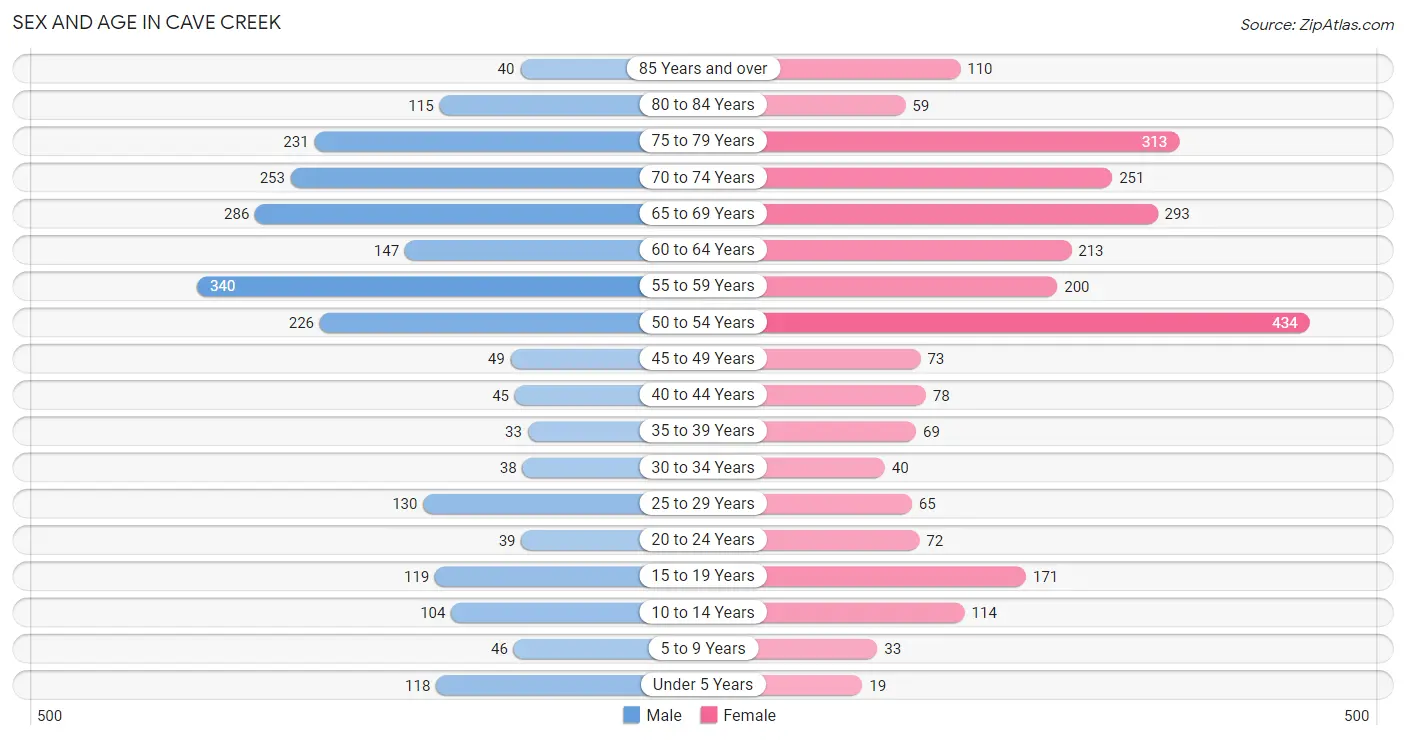
| Age Bracket | Male | Female |
| Under 5 Years | 118 (5.0%) | 19 (0.7%) |
| 5 to 9 Years | 46 (1.9%) | 33 (1.3%) |
| 10 to 14 Years | 104 (4.4%) | 114 (4.4%) |
| 15 to 19 Years | 119 (5.0%) | 171 (6.6%) |
| 20 to 24 Years | 39 (1.7%) | 72 (2.8%) |
| 25 to 29 Years | 130 (5.5%) | 65 (2.5%) |
| 30 to 34 Years | 38 (1.6%) | 40 (1.5%) |
| 35 to 39 Years | 33 (1.4%) | 69 (2.6%) |
| 40 to 44 Years | 45 (1.9%) | 78 (3.0%) |
| 45 to 49 Years | 49 (2.1%) | 73 (2.8%) |
| 50 to 54 Years | 226 (9.6%) | 434 (16.7%) |
| 55 to 59 Years | 340 (14.4%) | 200 (7.7%) |
| 60 to 64 Years | 147 (6.2%) | 213 (8.2%) |
| 65 to 69 Years | 286 (12.1%) | 293 (11.2%) |
| 70 to 74 Years | 253 (10.7%) | 251 (9.6%) |
| 75 to 79 Years | 231 (9.8%) | 313 (12.0%) |
| 80 to 84 Years | 115 (4.9%) | 59 (2.3%) |
| 85 Years and over | 40 (1.7%) | 110 (4.2%) |
| Total | 2,359 (100.0%) | 2,607 (100.0%) |
Families and Households in Cave Creek
Median Family Size in Cave Creek
The median family size in Cave Creek is 2.66 persons per family, with single female/mother families (161 | 10.6%) accounting for the largest median family size of 2.82 persons per family. On the other hand, single male/father families (34 | 2.2%) represent the smallest median family size with 2.41 persons per family.
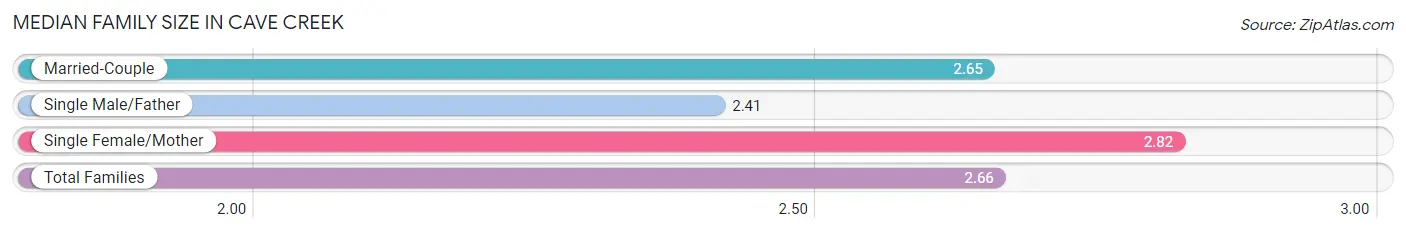
| Family Type | # Families | Family Size |
| Married-Couple | 1,317 (87.1%) | 2.65 |
| Single Male/Father | 34 (2.2%) | 2.41 |
| Single Female/Mother | 161 (10.6%) | 2.82 |
| Total Families | 1,512 (100.0%) | 2.66 |
Median Household Size in Cave Creek
The median household size in Cave Creek is 2.18 persons per household, with single female/mother households (161 | 7.1%) accounting for the largest median household size of 2.82 persons per household. non-family households (763 | 33.5%) represent the smallest median household size with 1.21 persons per household.
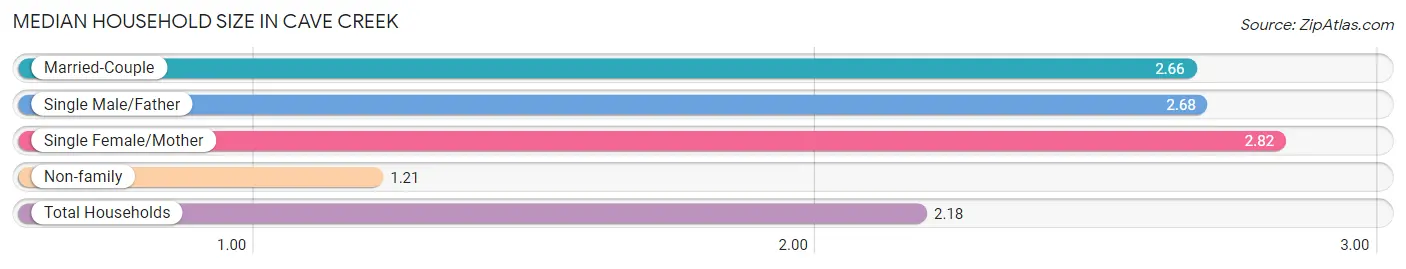
| Household Type | # Households | Household Size |
| Married-Couple | 1,317 (57.9%) | 2.66 |
| Single Male/Father | 34 (1.5%) | 2.68 |
| Single Female/Mother | 161 (7.1%) | 2.82 |
| Non-family | 763 (33.5%) | 1.21 |
| Total Households | 2,275 (100.0%) | 2.18 |
Household Size by Marriage Status in Cave Creek
Out of a total of 2,275 households in Cave Creek, 1,512 (66.5%) are family households, while 763 (33.5%) are nonfamily households. The most numerous type of family households are 2-person households, comprising 964, and the most common type of nonfamily households are 1-person households, comprising 629.
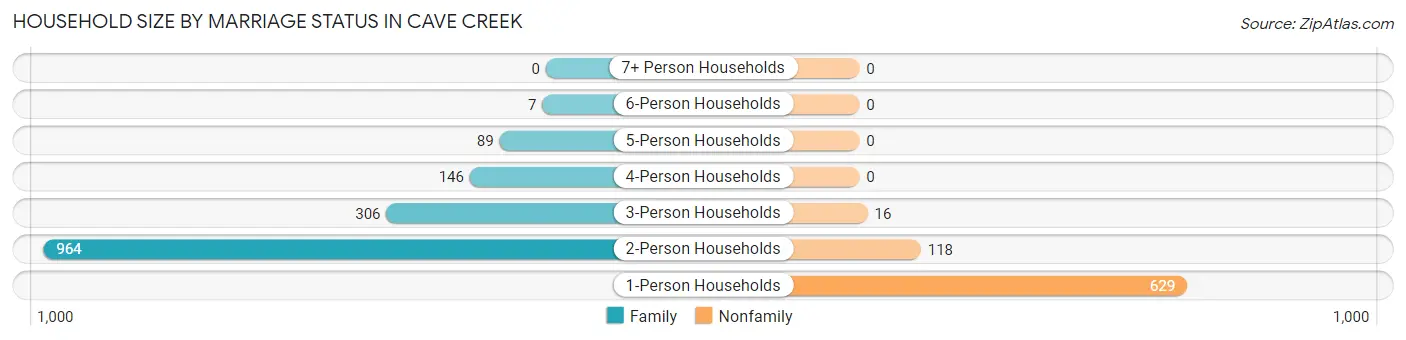
| Household Size | Family Households | Nonfamily Households |
| 1-Person Households | - | 629 (27.7%) |
| 2-Person Households | 964 (42.4%) | 118 (5.2%) |
| 3-Person Households | 306 (13.5%) | 16 (0.7%) |
| 4-Person Households | 146 (6.4%) | 0 (0.0%) |
| 5-Person Households | 89 (3.9%) | 0 (0.0%) |
| 6-Person Households | 7 (0.3%) | 0 (0.0%) |
| 7+ Person Households | 0 (0.0%) | 0 (0.0%) |
| Total | 1,512 (66.5%) | 763 (33.5%) |
Female Fertility in Cave Creek
Fertility by Age in Cave Creek
| Age Bracket | Women with Births | Births / 1,000 Women |
| 15 to 19 years | 0 (0.0%) | 0.0 |
| 20 to 34 years | 0 (0.0%) | 0.0 |
| 35 to 50 years | 0 (0.0%) | 0.0 |
| Total | 0 (0.0%) | 0.0 |
Fertility by Age by Marriage Status in Cave Creek
| Age Bracket | Married | Unmarried |
| 15 to 19 years | 0 (0.0%) | 0 (0.0%) |
| 20 to 34 years | 0 (0.0%) | 0 (0.0%) |
| 35 to 50 years | 0 (0.0%) | 0 (0.0%) |
| Total | 0 (0.0%) | 0 (0.0%) |
Fertility by Education in Cave Creek
| Educational Attainment | Women with Births | Births / 1,000 Women |
| Less than High School | 0 (0.0%) | 0.0 |
| High School Diploma | 0 (0.0%) | 0.0 |
| College or Associate's Degree | 0 (0.0%) | 0.0 |
| Bachelor's Degree | 0 (0.0%) | 0.0 |
| Graduate Degree | 0 (0.0%) | 0.0 |
| Total | 0 (0.0%) | 0.0 |
Fertility by Education by Marriage Status in Cave Creek
| Educational Attainment | Married | Unmarried |
| Less than High School | 0 (0.0%) | 0 (0.0%) |
| High School Diploma | 0 (0.0%) | 0 (0.0%) |
| College or Associate's Degree | 0 (0.0%) | 0 (0.0%) |
| Bachelor's Degree | 0 (0.0%) | 0 (0.0%) |
| Graduate Degree | 0 (0.0%) | 0 (0.0%) |
| Total | 0 (0.0%) | 0 (0.0%) |
Employment Characteristics in Cave Creek
Employment by Class of Employer in Cave Creek
Among the 2,198 employed individuals in Cave Creek, private company employees (1,376 | 62.6%), self-employed (not incorporated) (332 | 15.1%), and self-employed (incorporated) (209 | 9.5%) make up the most common classes of employment.
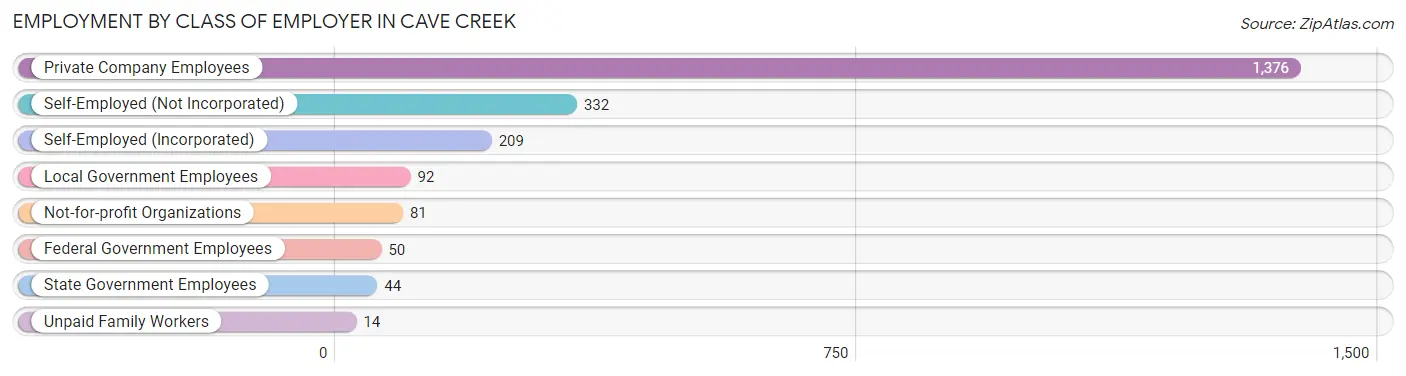
| Employer Class | # Employees | % Employees |
| Private Company Employees | 1,376 | 62.6% |
| Self-Employed (Incorporated) | 209 | 9.5% |
| Self-Employed (Not Incorporated) | 332 | 15.1% |
| Not-for-profit Organizations | 81 | 3.7% |
| Local Government Employees | 92 | 4.2% |
| State Government Employees | 44 | 2.0% |
| Federal Government Employees | 50 | 2.3% |
| Unpaid Family Workers | 14 | 0.6% |
| Total | 2,198 | 100.0% |
Employment Status by Age in Cave Creek
According to the labor force statistics for Cave Creek, out of the total population over 16 years of age (4,388), 52.4% or 2,299 individuals are in the labor force, with 4.5% or 103 of them unemployed. The age group with the highest labor force participation rate is 25 to 29 years, with 83.6% or 163 individuals in the labor force. Within the labor force, the 16 to 19 years age range has the highest percentage of unemployed individuals, with 50.6% or 41 of them being unemployed.
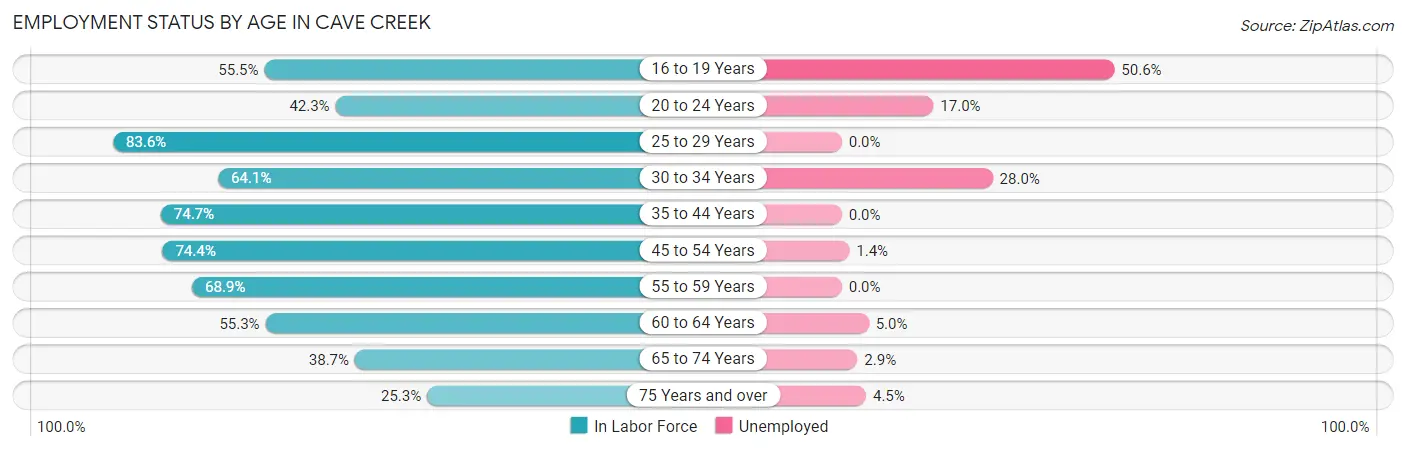
| Age Bracket | In Labor Force | Unemployed |
| 16 to 19 Years | 81 (55.5%) | 41 (50.6%) |
| 20 to 24 Years | 47 (42.3%) | 8 (17.0%) |
| 25 to 29 Years | 163 (83.6%) | 0 (0.0%) |
| 30 to 34 Years | 50 (64.1%) | 14 (28.0%) |
| 35 to 44 Years | 168 (74.7%) | 0 (0.0%) |
| 45 to 54 Years | 582 (74.4%) | 8 (1.4%) |
| 55 to 59 Years | 372 (68.9%) | 0 (0.0%) |
| 60 to 64 Years | 199 (55.3%) | 10 (5.0%) |
| 65 to 74 Years | 419 (38.7%) | 12 (2.9%) |
| 75 Years and over | 220 (25.3%) | 10 (4.5%) |
| Total | 2,299 (52.4%) | 103 (4.5%) |
Employment Status by Educational Attainment in Cave Creek
According to labor force statistics for Cave Creek, 70.4% of individuals (1,535) out of the total population between 25 and 64 years of age (2,180) are in the labor force, with 2.1% or 32 of them being unemployed. The group with the highest labor force participation rate are those with the educational attainment of bachelor's degree or higher, with 82.4% or 843 individuals in the labor force. Within the labor force, individuals with college / associate degree education have the highest percentage of unemployment, with 2.6% or 10 of them being unemployed.
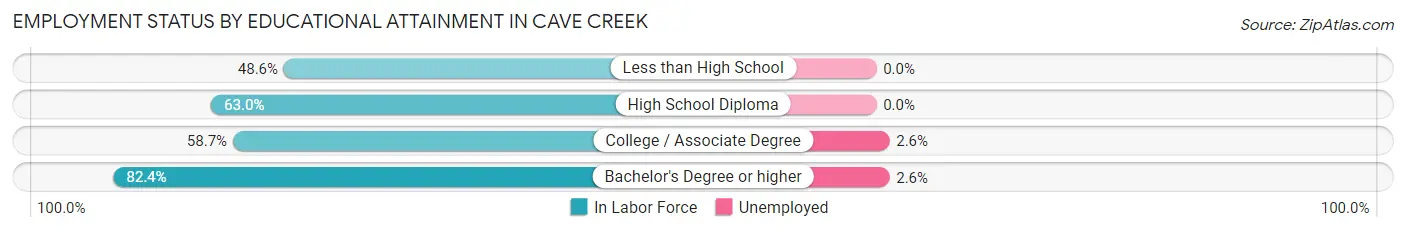
| Educational Attainment | In Labor Force | Unemployed |
| Less than High School | 35 (48.6%) | 0 (0.0%) |
| High School Diploma | 276 (63.0%) | 0 (0.0%) |
| College / Associate Degree | 380 (58.7%) | 17 (2.6%) |
| Bachelor's Degree or higher | 843 (82.4%) | 27 (2.6%) |
| Total | 1,535 (70.4%) | 46 (2.1%) |
Employment Occupations by Sex in Cave Creek
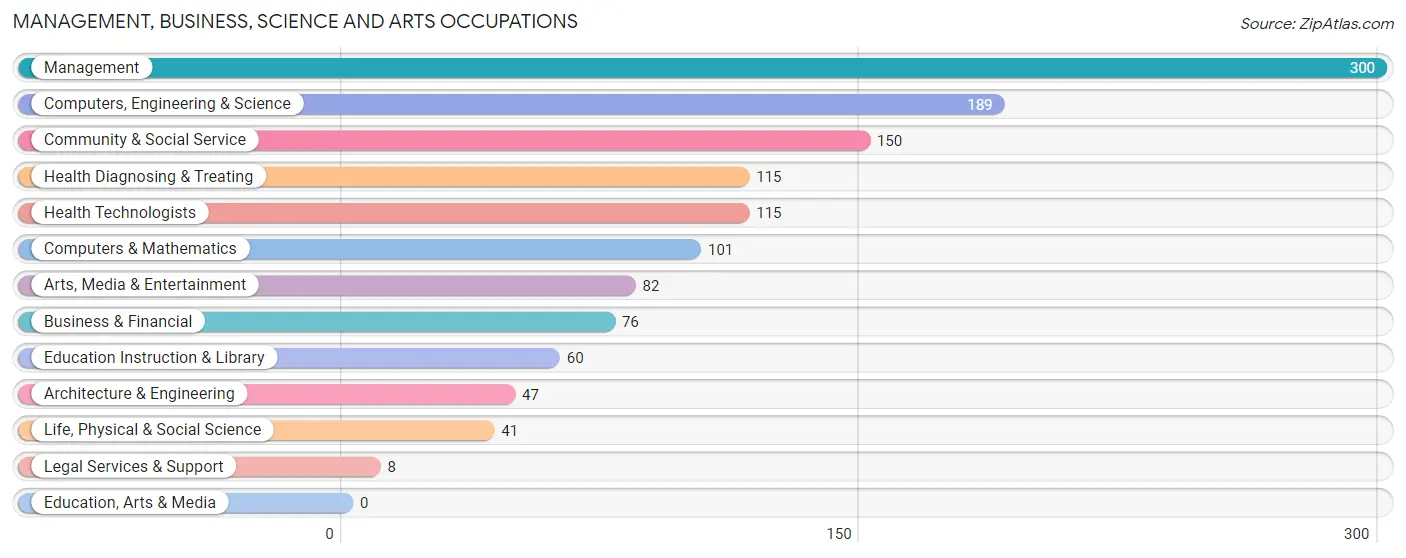
Management, Business, Science and Arts Occupations
The most common Management, Business, Science and Arts occupations in Cave Creek are Management (300 | 13.7%), Computers, Engineering & Science (189 | 8.6%), Community & Social Service (150 | 6.8%), Health Diagnosing & Treating (115 | 5.2%), and Health Technologists (115 | 5.2%).
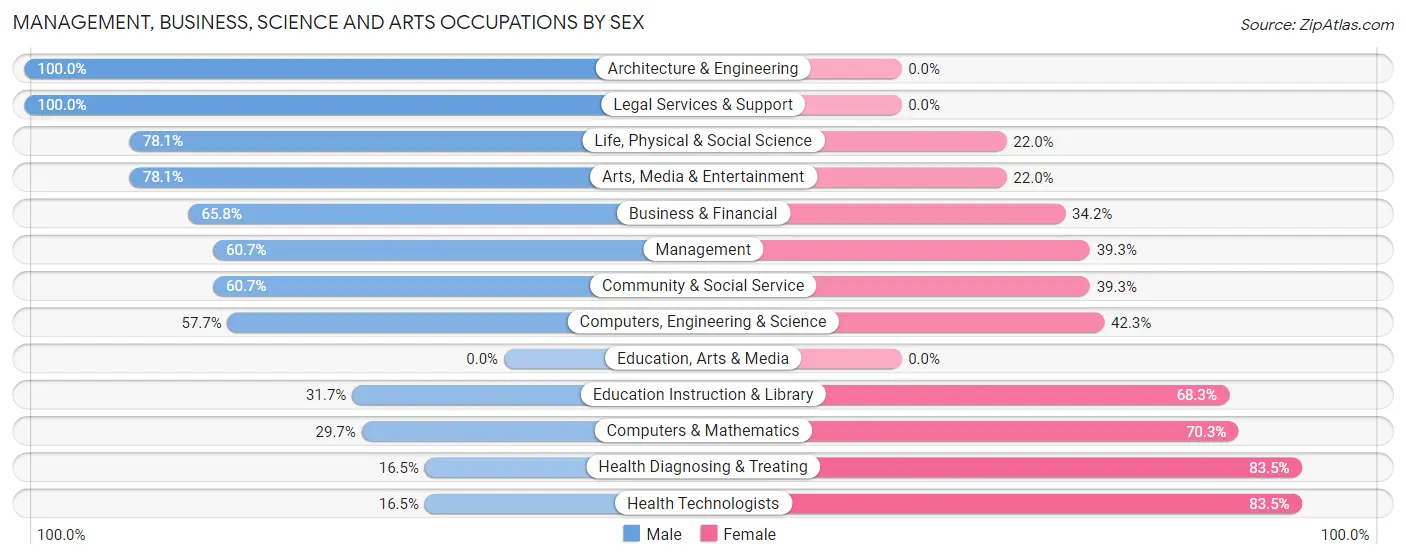
Management, Business, Science and Arts Occupations by Sex
Within the Management, Business, Science and Arts occupations in Cave Creek, the most male-oriented occupations are Architecture & Engineering (100.0%), Legal Services & Support (100.0%), and Life, Physical & Social Science (78.0%), while the most female-oriented occupations are Health Diagnosing & Treating (83.5%), Health Technologists (83.5%), and Computers & Mathematics (70.3%).
| Occupation | Male | Female |
| Management | 182 (60.7%) | 118 (39.3%) |
| Business & Financial | 50 (65.8%) | 26 (34.2%) |
| Computers, Engineering & Science | 109 (57.7%) | 80 (42.3%) |
| Computers & Mathematics | 30 (29.7%) | 71 (70.3%) |
| Architecture & Engineering | 47 (100.0%) | 0 (0.0%) |
| Life, Physical & Social Science | 32 (78.0%) | 9 (22.0%) |
| Community & Social Service | 91 (60.7%) | 59 (39.3%) |
| Education, Arts & Media | 0 (0.0%) | 0 (0.0%) |
| Legal Services & Support | 8 (100.0%) | 0 (0.0%) |
| Education Instruction & Library | 19 (31.7%) | 41 (68.3%) |
| Arts, Media & Entertainment | 64 (78.0%) | 18 (22.0%) |
| Health Diagnosing & Treating | 19 (16.5%) | 96 (83.5%) |
| Health Technologists | 19 (16.5%) | 96 (83.5%) |
| Total (Category) | 451 (54.3%) | 379 (45.7%) |
| Total (Overall) | 1,201 (54.6%) | 997 (45.4%) |
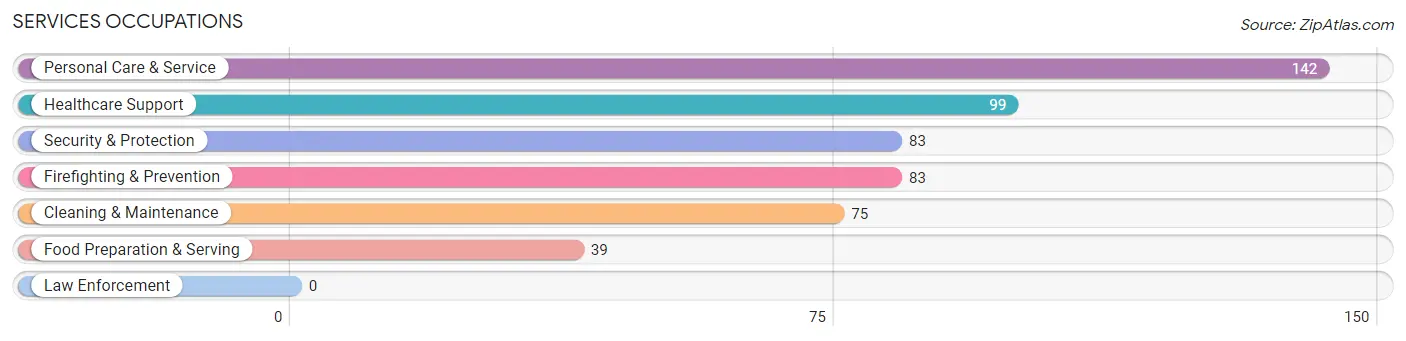
Services Occupations
The most common Services occupations in Cave Creek are Personal Care & Service (142 | 6.5%), Healthcare Support (99 | 4.5%), Security & Protection (83 | 3.8%), Firefighting & Prevention (83 | 3.8%), and Cleaning & Maintenance (75 | 3.4%).
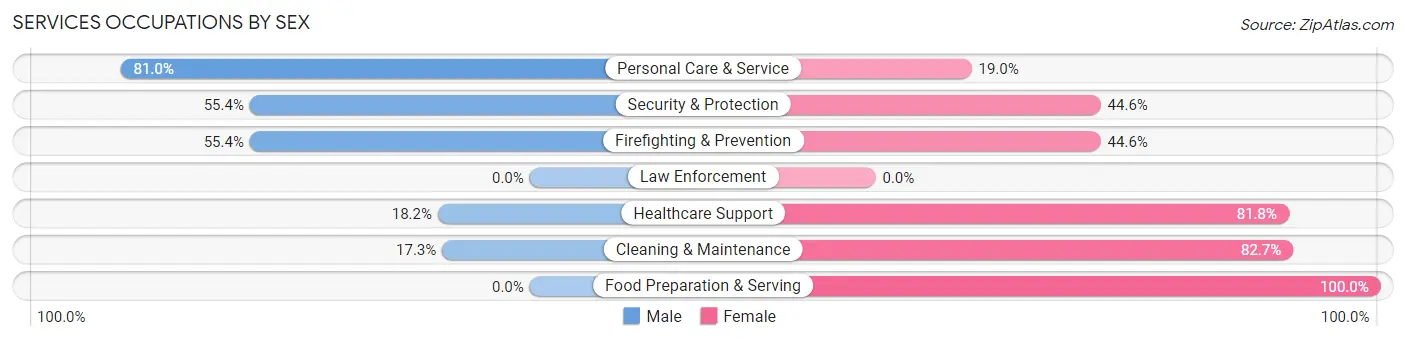
Services Occupations by Sex
Within the Services occupations in Cave Creek, the most male-oriented occupations are Personal Care & Service (81.0%), Security & Protection (55.4%), and Firefighting & Prevention (55.4%), while the most female-oriented occupations are Food Preparation & Serving (100.0%), Cleaning & Maintenance (82.7%), and Healthcare Support (81.8%).
| Occupation | Male | Female |
| Healthcare Support | 18 (18.2%) | 81 (81.8%) |
| Security & Protection | 46 (55.4%) | 37 (44.6%) |
| Firefighting & Prevention | 46 (55.4%) | 37 (44.6%) |
| Law Enforcement | 0 (0.0%) | 0 (0.0%) |
| Food Preparation & Serving | 0 (0.0%) | 39 (100.0%) |
| Cleaning & Maintenance | 13 (17.3%) | 62 (82.7%) |
| Personal Care & Service | 115 (81.0%) | 27 (19.0%) |
| Total (Category) | 192 (43.8%) | 246 (56.2%) |
| Total (Overall) | 1,201 (54.6%) | 997 (45.4%) |
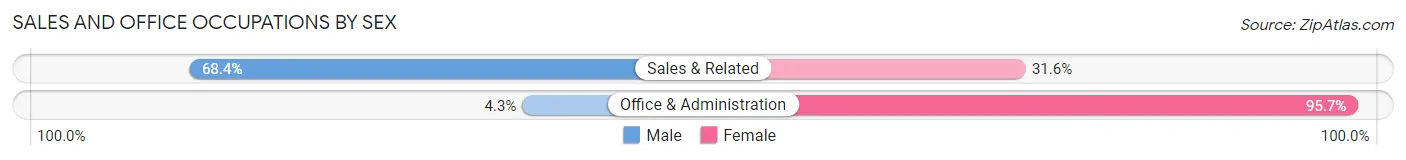
Sales and Office Occupations
The most common Sales and Office occupations in Cave Creek are Sales & Related (370 | 16.8%), and Office & Administration (209 | 9.5%).

Sales and Office Occupations by Sex
| Occupation | Male | Female |
| Sales & Related | 253 (68.4%) | 117 (31.6%) |
| Office & Administration | 9 (4.3%) | 200 (95.7%) |
| Total (Category) | 262 (45.3%) | 317 (54.7%) |
| Total (Overall) | 1,201 (54.6%) | 997 (45.4%) |
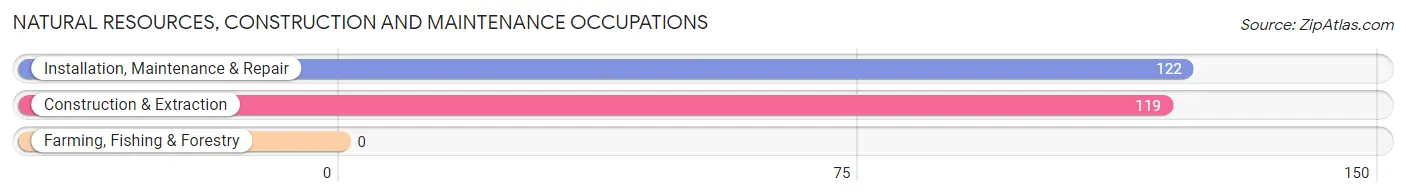
Natural Resources, Construction and Maintenance Occupations
The most common Natural Resources, Construction and Maintenance occupations in Cave Creek are Installation, Maintenance & Repair (122 | 5.6%), and Construction & Extraction (119 | 5.4%).
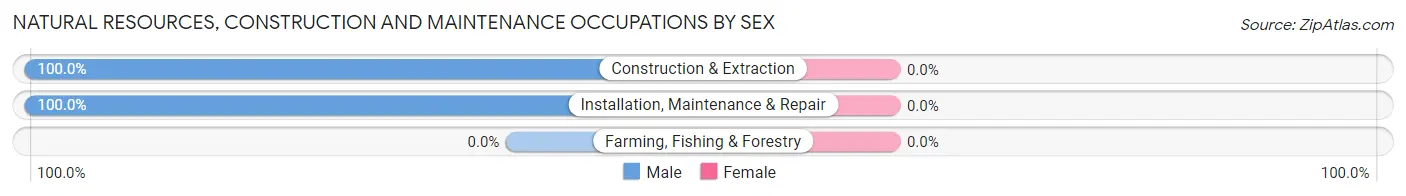
Natural Resources, Construction and Maintenance Occupations by Sex
| Occupation | Male | Female |
| Farming, Fishing & Forestry | 0 (0.0%) | 0 (0.0%) |
| Construction & Extraction | 119 (100.0%) | 0 (0.0%) |
| Installation, Maintenance & Repair | 122 (100.0%) | 0 (0.0%) |
| Total (Category) | 241 (100.0%) | 0 (0.0%) |
| Total (Overall) | 1,201 (54.6%) | 997 (45.4%) |
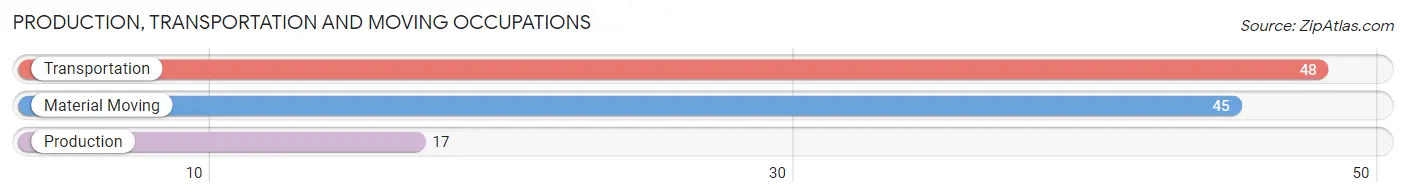
Production, Transportation and Moving Occupations
The most common Production, Transportation and Moving occupations in Cave Creek are Transportation (48 | 2.2%), Material Moving (45 | 2.1%), and Production (17 | 0.8%).
Production, Transportation and Moving Occupations by Sex
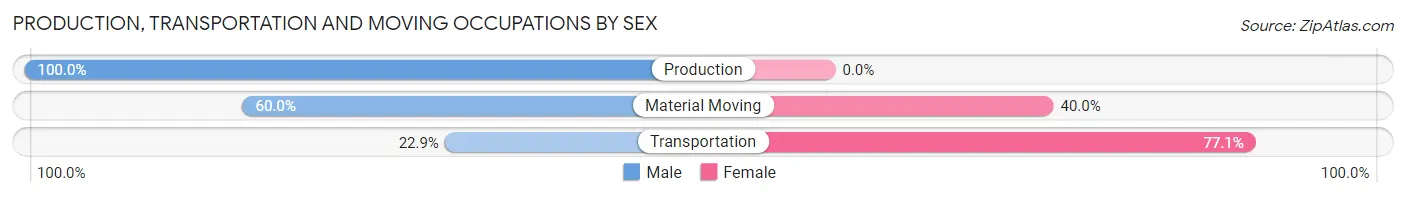
| Occupation | Male | Female |
| Production | 17 (100.0%) | 0 (0.0%) |
| Transportation | 11 (22.9%) | 37 (77.1%) |
| Material Moving | 27 (60.0%) | 18 (40.0%) |
| Total (Category) | 55 (50.0%) | 55 (50.0%) |
| Total (Overall) | 1,201 (54.6%) | 997 (45.4%) |
Employment Industries by Sex in Cave Creek
Employment Industries in Cave Creek
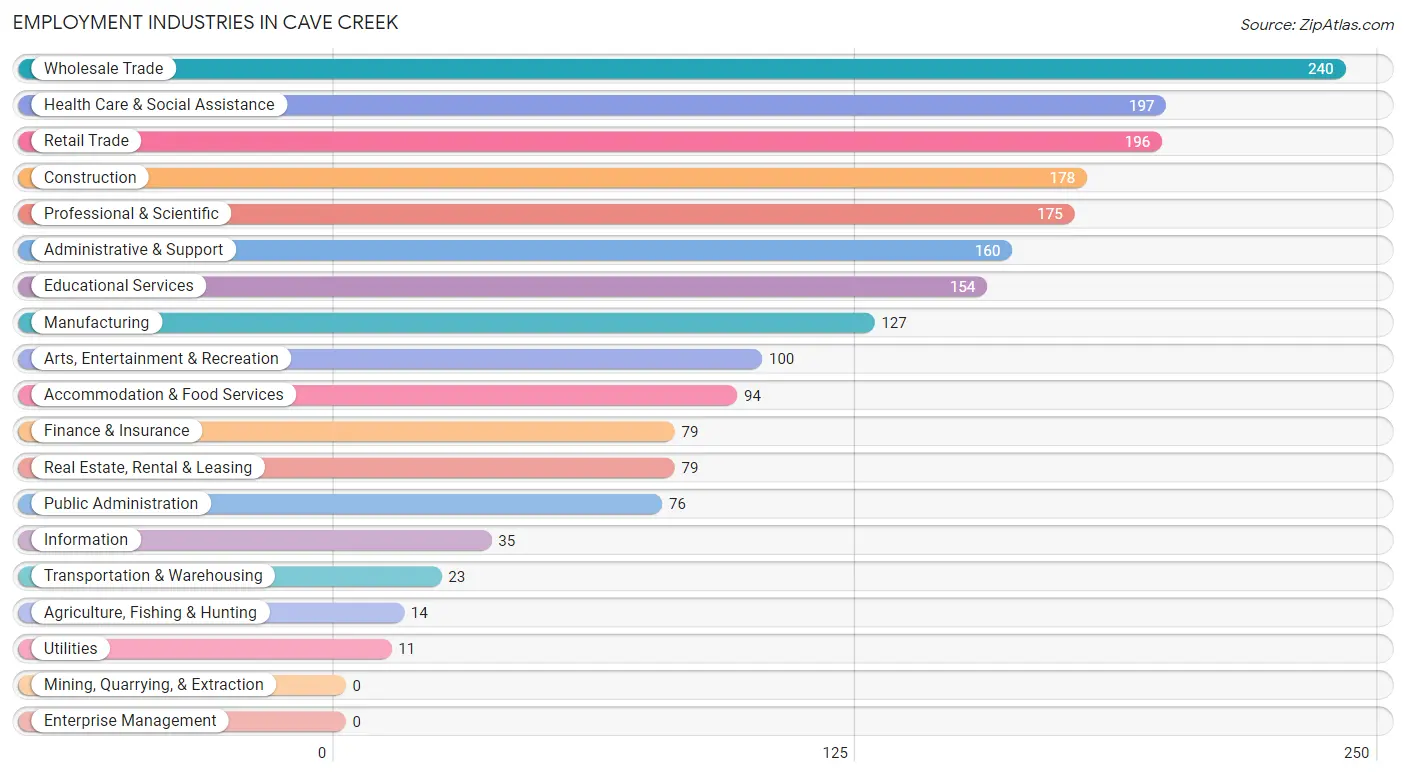
The major employment industries in Cave Creek include Wholesale Trade (240 | 10.9%), Health Care & Social Assistance (197 | 9.0%), Retail Trade (196 | 8.9%), Construction (178 | 8.1%), and Professional & Scientific (175 | 8.0%).
Employment Industries by Sex in Cave Creek
The Cave Creek industries that see more men than women are Agriculture, Fishing & Hunting (100.0%), Wholesale Trade (100.0%), and Utilities (100.0%), whereas the industries that tend to have a higher number of women are Real Estate, Rental & Leasing (100.0%), Accommodation & Food Services (100.0%), and Health Care & Social Assistance (81.2%).
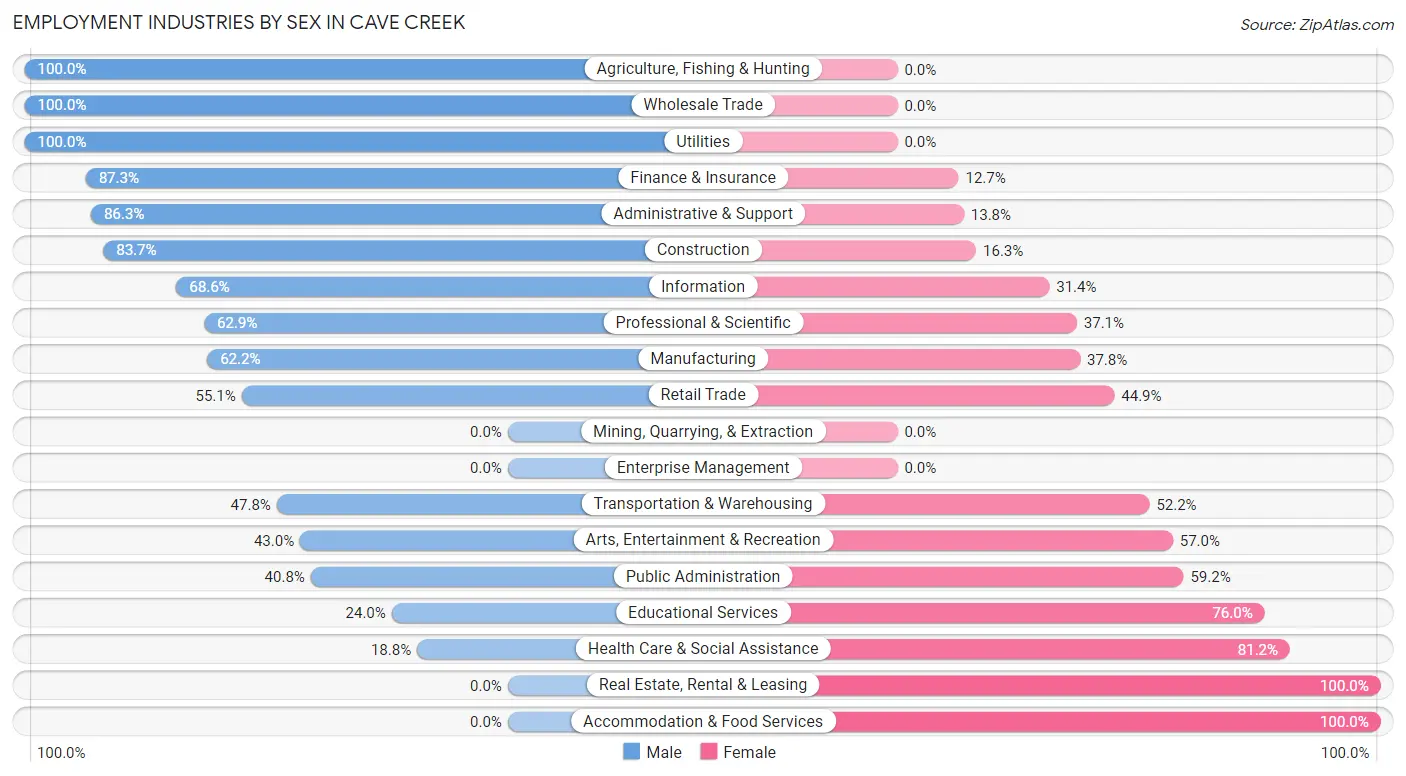
| Industry | Male | Female |
| Agriculture, Fishing & Hunting | 14 (100.0%) | 0 (0.0%) |
| Mining, Quarrying, & Extraction | 0 (0.0%) | 0 (0.0%) |
| Construction | 149 (83.7%) | 29 (16.3%) |
| Manufacturing | 79 (62.2%) | 48 (37.8%) |
| Wholesale Trade | 240 (100.0%) | 0 (0.0%) |
| Retail Trade | 108 (55.1%) | 88 (44.9%) |
| Transportation & Warehousing | 11 (47.8%) | 12 (52.2%) |
| Utilities | 11 (100.0%) | 0 (0.0%) |
| Information | 24 (68.6%) | 11 (31.4%) |
| Finance & Insurance | 69 (87.3%) | 10 (12.7%) |
| Real Estate, Rental & Leasing | 0 (0.0%) | 79 (100.0%) |
| Professional & Scientific | 110 (62.9%) | 65 (37.1%) |
| Enterprise Management | 0 (0.0%) | 0 (0.0%) |
| Administrative & Support | 138 (86.3%) | 22 (13.8%) |
| Educational Services | 37 (24.0%) | 117 (76.0%) |
| Health Care & Social Assistance | 37 (18.8%) | 160 (81.2%) |
| Arts, Entertainment & Recreation | 43 (43.0%) | 57 (57.0%) |
| Accommodation & Food Services | 0 (0.0%) | 94 (100.0%) |
| Public Administration | 31 (40.8%) | 45 (59.2%) |
| Total | 1,201 (54.6%) | 997 (45.4%) |
Education in Cave Creek
School Enrollment in Cave Creek
The most common levels of schooling among the 586 students in Cave Creek are high school (178 | 30.4%), middle school (136 | 23.2%), and college / undergraduate (120 | 20.5%).
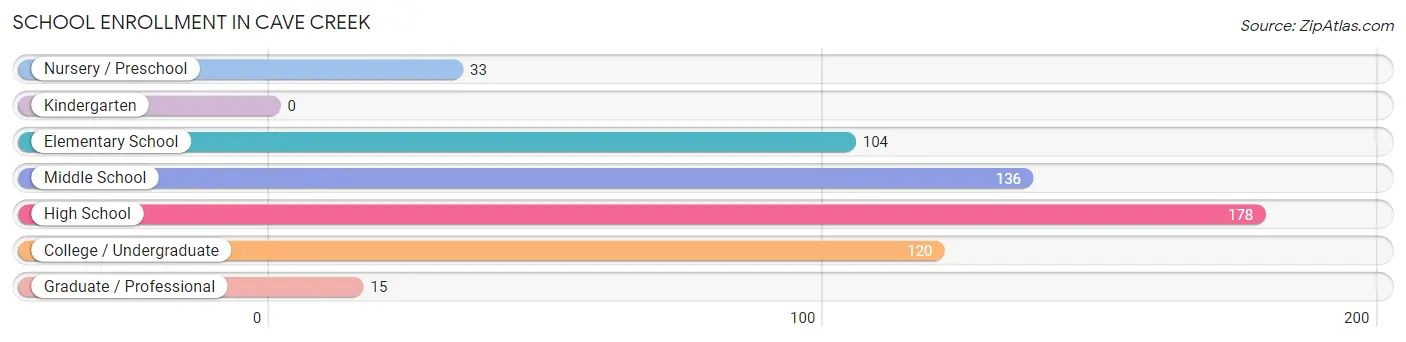
| School Level | # Students | % Students |
| Nursery / Preschool | 33 | 5.6% |
| Kindergarten | 0 | 0.0% |
| Elementary School | 104 | 17.7% |
| Middle School | 136 | 23.2% |
| High School | 178 | 30.4% |
| College / Undergraduate | 120 | 20.5% |
| Graduate / Professional | 15 | 2.6% |
| Total | 586 | 100.0% |
School Enrollment by Age by Funding Source in Cave Creek
Out of a total of 586 students who are enrolled in schools in Cave Creek, 104 (17.7%) attend a private institution, while the remaining 482 (82.3%) are enrolled in public schools. The age group of 35 years and over has the highest likelihood of being enrolled in private schools, with 15 (33.3% in the age bracket) enrolled. Conversely, the age group of 3 to 4 year olds has the lowest likelihood of being enrolled in a private school, with 33 (100.0% in the age bracket) attending a public institution.
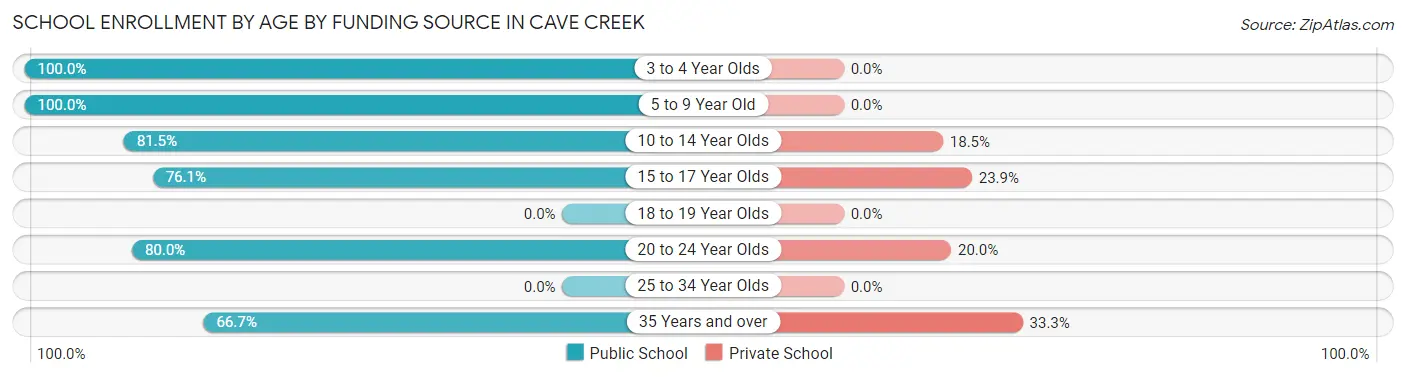
| Age Bracket | Public School | Private School |
| 3 to 4 Year Olds | 33 (100.0%) | 0 (0.0%) |
| 5 to 9 Year Old | 79 (100.0%) | 0 (0.0%) |
| 10 to 14 Year Olds | 150 (81.5%) | 34 (18.5%) |
| 15 to 17 Year Olds | 118 (76.1%) | 37 (23.9%) |
| 18 to 19 Year Olds | 0 (0.0%) | 0 (0.0%) |
| 20 to 24 Year Olds | 72 (80.0%) | 18 (20.0%) |
| 25 to 34 Year Olds | 0 (0.0%) | 0 (0.0%) |
| 35 Years and over | 30 (66.7%) | 15 (33.3%) |
| Total | 482 (82.3%) | 104 (17.7%) |
Educational Attainment by Field of Study in Cave Creek
Business (450 | 19.5%), science & technology (250 | 10.8%), communications (244 | 10.6%), psychology (218 | 9.5%), and education (205 | 8.9%) are the most common fields of study among 2,308 individuals in Cave Creek who have obtained a bachelor's degree or higher.
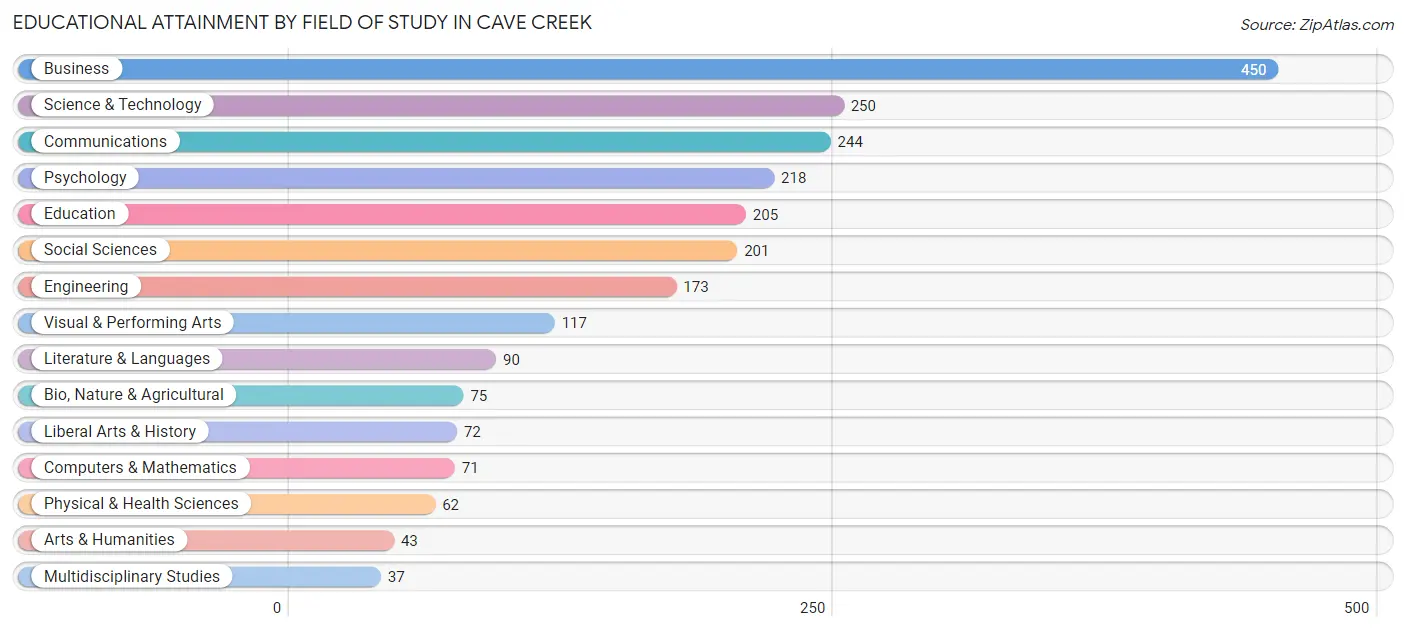
| Field of Study | # Graduates | % Graduates |
| Computers & Mathematics | 71 | 3.1% |
| Bio, Nature & Agricultural | 75 | 3.3% |
| Physical & Health Sciences | 62 | 2.7% |
| Psychology | 218 | 9.5% |
| Social Sciences | 201 | 8.7% |
| Engineering | 173 | 7.5% |
| Multidisciplinary Studies | 37 | 1.6% |
| Science & Technology | 250 | 10.8% |
| Business | 450 | 19.5% |
| Education | 205 | 8.9% |
| Literature & Languages | 90 | 3.9% |
| Liberal Arts & History | 72 | 3.1% |
| Visual & Performing Arts | 117 | 5.1% |
| Communications | 244 | 10.6% |
| Arts & Humanities | 43 | 1.9% |
| Total | 2,308 | 100.0% |
Transportation & Commute in Cave Creek
Vehicle Availability by Sex in Cave Creek
The most prevalent vehicle ownership categories in Cave Creek are males with 3 vehicles (404, accounting for 33.6%) and females with 3 vehicles (361, making up 40.5%).
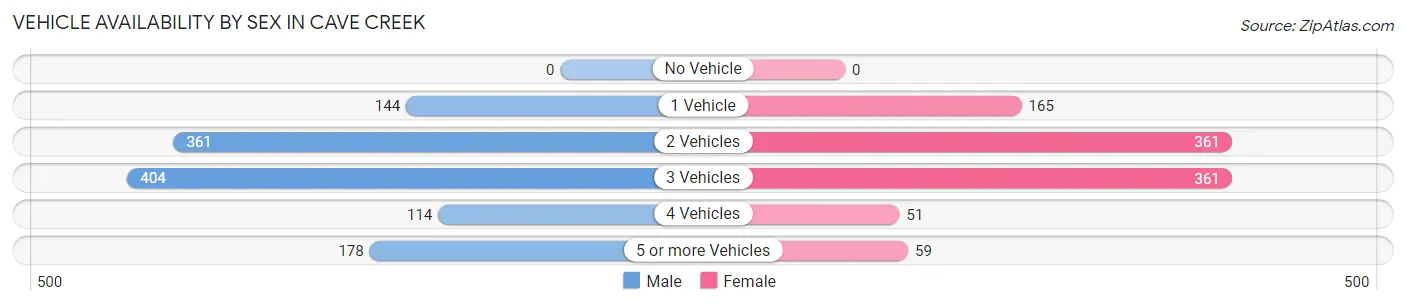
| Vehicles Available | Male | Female |
| No Vehicle | 0 (0.0%) | 0 (0.0%) |
| 1 Vehicle | 144 (12.0%) | 165 (16.6%) |
| 2 Vehicles | 361 (30.1%) | 361 (36.2%) |
| 3 Vehicles | 404 (33.6%) | 361 (36.2%) |
| 4 Vehicles | 114 (9.5%) | 51 (5.1%) |
| 5 or more Vehicles | 178 (14.8%) | 59 (5.9%) |
| Total | 1,201 (100.0%) | 997 (100.0%) |
Commute Time in Cave Creek
The most frequently occuring commute durations in Cave Creek are 10 to 14 minutes (263 commuters, 18.2%), 45 to 59 minutes (164 commuters, 11.4%), and 30 to 34 minutes (154 commuters, 10.7%).
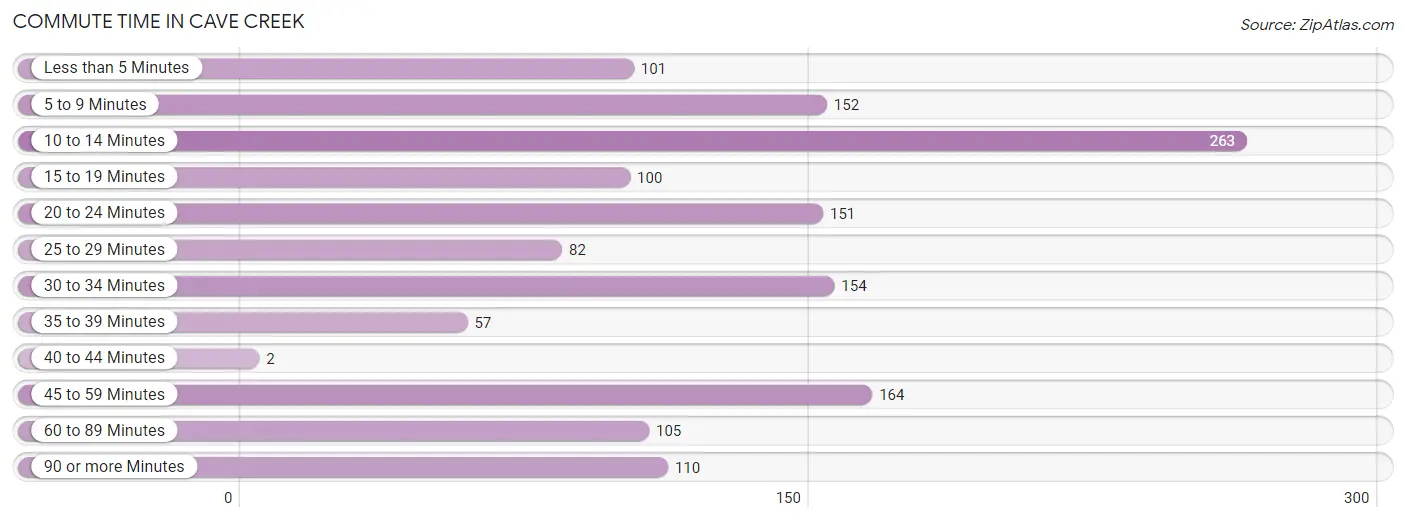
| Commute Time | # Commuters | % Commuters |
| Less than 5 Minutes | 101 | 7.0% |
| 5 to 9 Minutes | 152 | 10.5% |
| 10 to 14 Minutes | 263 | 18.2% |
| 15 to 19 Minutes | 100 | 6.9% |
| 20 to 24 Minutes | 151 | 10.5% |
| 25 to 29 Minutes | 82 | 5.7% |
| 30 to 34 Minutes | 154 | 10.7% |
| 35 to 39 Minutes | 57 | 4.0% |
| 40 to 44 Minutes | 2 | 0.1% |
| 45 to 59 Minutes | 164 | 11.4% |
| 60 to 89 Minutes | 105 | 7.3% |
| 90 or more Minutes | 110 | 7.6% |
Commute Time by Sex in Cave Creek
The most common commute times in Cave Creek are 10 to 14 minutes (133 commuters, 16.5%) for males and 5 to 9 minutes (146 commuters, 22.9%) for females.
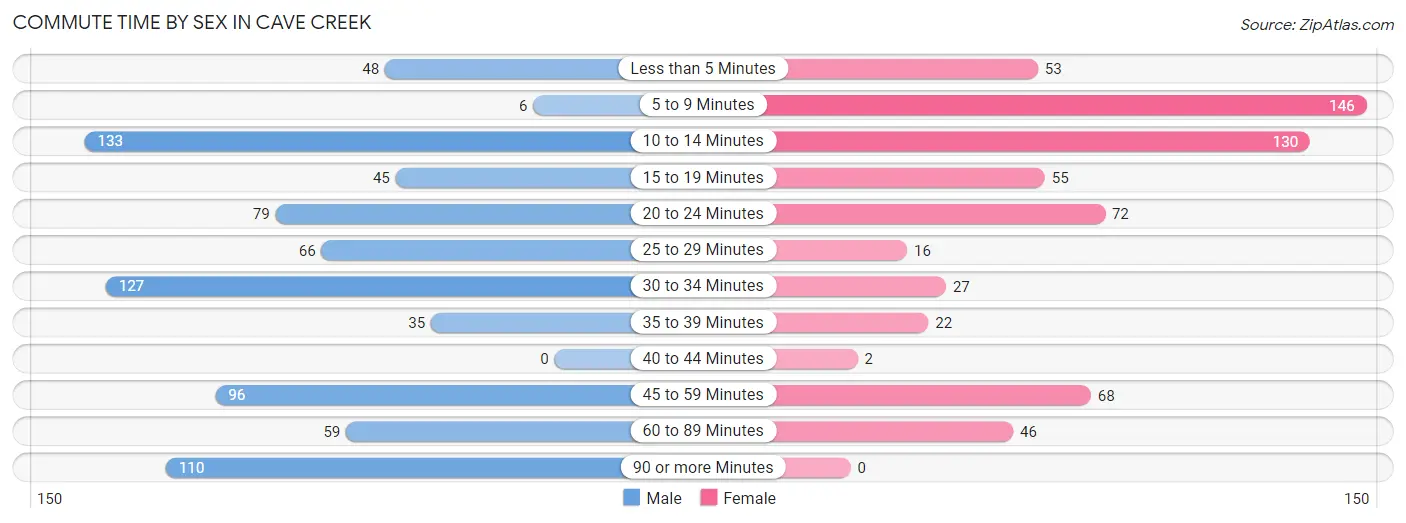
| Commute Time | Male | Female |
| Less than 5 Minutes | 48 (6.0%) | 53 (8.3%) |
| 5 to 9 Minutes | 6 (0.7%) | 146 (22.9%) |
| 10 to 14 Minutes | 133 (16.5%) | 130 (20.4%) |
| 15 to 19 Minutes | 45 (5.6%) | 55 (8.6%) |
| 20 to 24 Minutes | 79 (9.8%) | 72 (11.3%) |
| 25 to 29 Minutes | 66 (8.2%) | 16 (2.5%) |
| 30 to 34 Minutes | 127 (15.8%) | 27 (4.2%) |
| 35 to 39 Minutes | 35 (4.3%) | 22 (3.5%) |
| 40 to 44 Minutes | 0 (0.0%) | 2 (0.3%) |
| 45 to 59 Minutes | 96 (11.9%) | 68 (10.7%) |
| 60 to 89 Minutes | 59 (7.3%) | 46 (7.2%) |
| 90 or more Minutes | 110 (13.7%) | 0 (0.0%) |
Time of Departure to Work by Sex in Cave Creek
The most frequent times of departure to work in Cave Creek are 12:00 AM to 4:59 AM (160, 19.9%) for males and 9:00 AM to 9:59 AM (159, 25.0%) for females.
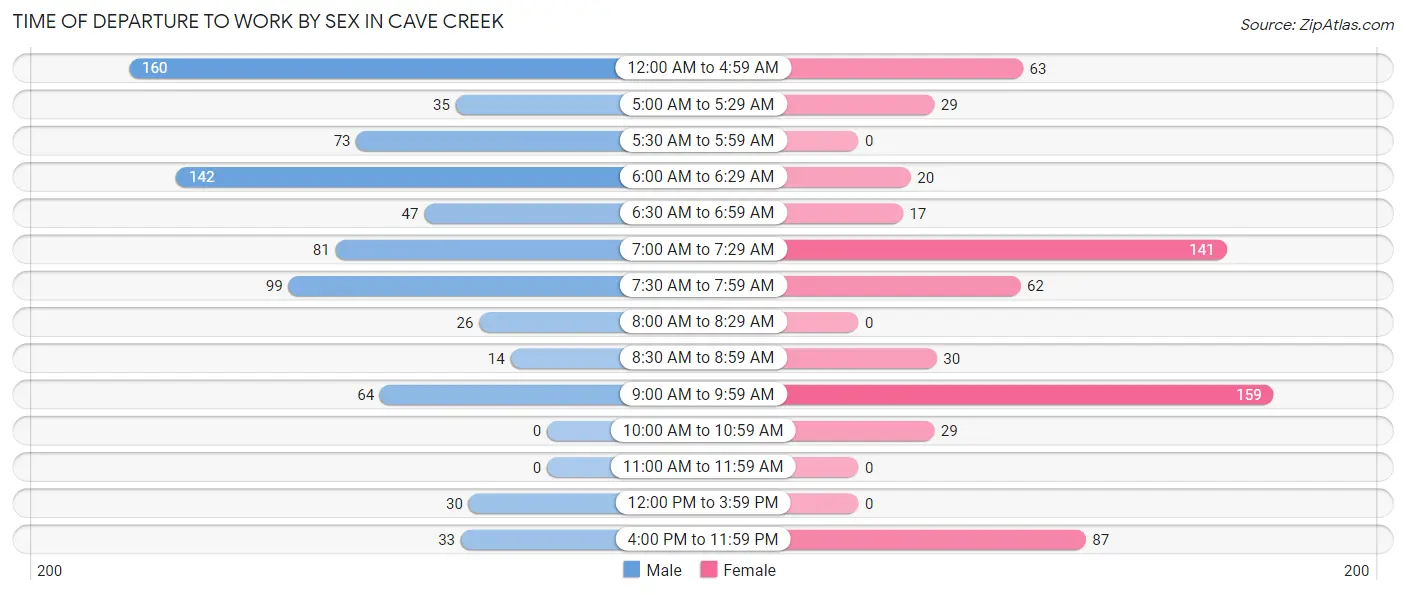
| Time of Departure | Male | Female |
| 12:00 AM to 4:59 AM | 160 (19.9%) | 63 (9.9%) |
| 5:00 AM to 5:29 AM | 35 (4.3%) | 29 (4.5%) |
| 5:30 AM to 5:59 AM | 73 (9.1%) | 0 (0.0%) |
| 6:00 AM to 6:29 AM | 142 (17.7%) | 20 (3.1%) |
| 6:30 AM to 6:59 AM | 47 (5.9%) | 17 (2.7%) |
| 7:00 AM to 7:29 AM | 81 (10.1%) | 141 (22.1%) |
| 7:30 AM to 7:59 AM | 99 (12.3%) | 62 (9.7%) |
| 8:00 AM to 8:29 AM | 26 (3.2%) | 0 (0.0%) |
| 8:30 AM to 8:59 AM | 14 (1.7%) | 30 (4.7%) |
| 9:00 AM to 9:59 AM | 64 (8.0%) | 159 (25.0%) |
| 10:00 AM to 10:59 AM | 0 (0.0%) | 29 (4.5%) |
| 11:00 AM to 11:59 AM | 0 (0.0%) | 0 (0.0%) |
| 12:00 PM to 3:59 PM | 30 (3.7%) | 0 (0.0%) |
| 4:00 PM to 11:59 PM | 33 (4.1%) | 87 (13.7%) |
| Total | 804 (100.0%) | 637 (100.0%) |
Housing Occupancy in Cave Creek
Occupancy by Ownership in Cave Creek
Of the total 2,275 dwellings in Cave Creek, owner-occupied units account for 2,088 (91.8%), while renter-occupied units make up 187 (8.2%).
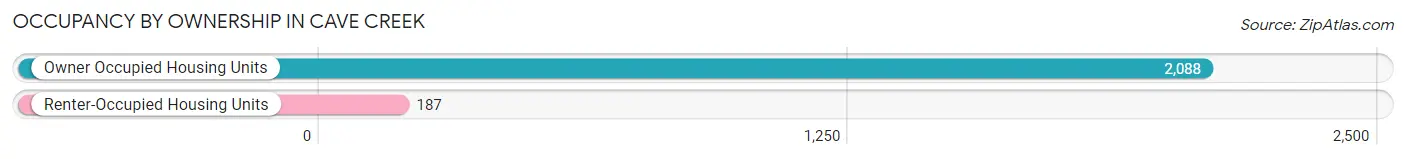
| Occupancy | # Housing Units | % Housing Units |
| Owner Occupied Housing Units | 2,088 | 91.8% |
| Renter-Occupied Housing Units | 187 | 8.2% |
| Total Occupied Housing Units | 2,275 | 100.0% |
Occupancy by Household Size in Cave Creek
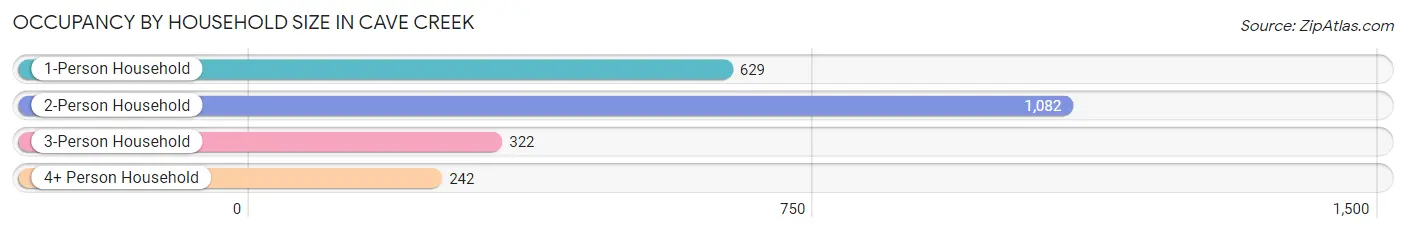
| Household Size | # Housing Units | % Housing Units |
| 1-Person Household | 629 | 27.7% |
| 2-Person Household | 1,082 | 47.6% |
| 3-Person Household | 322 | 14.1% |
| 4+ Person Household | 242 | 10.6% |
| Total Housing Units | 2,275 | 100.0% |
Occupancy by Ownership by Household Size in Cave Creek
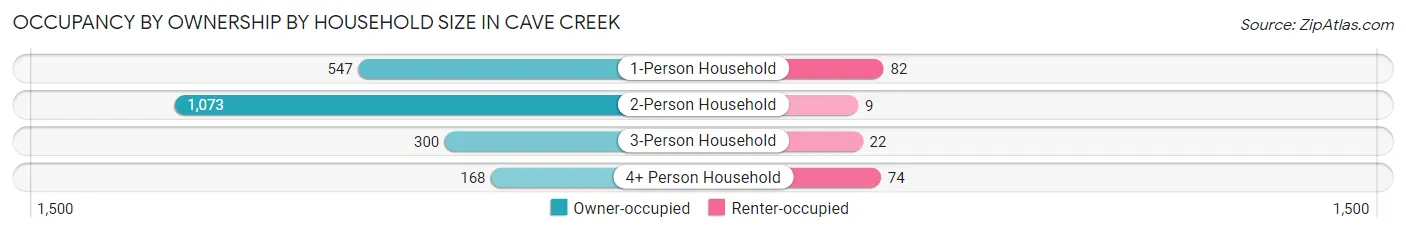
| Household Size | Owner-occupied | Renter-occupied |
| 1-Person Household | 547 (87.0%) | 82 (13.0%) |
| 2-Person Household | 1,073 (99.2%) | 9 (0.8%) |
| 3-Person Household | 300 (93.2%) | 22 (6.8%) |
| 4+ Person Household | 168 (69.4%) | 74 (30.6%) |
| Total Housing Units | 2,088 (91.8%) | 187 (8.2%) |
Occupancy by Educational Attainment in Cave Creek
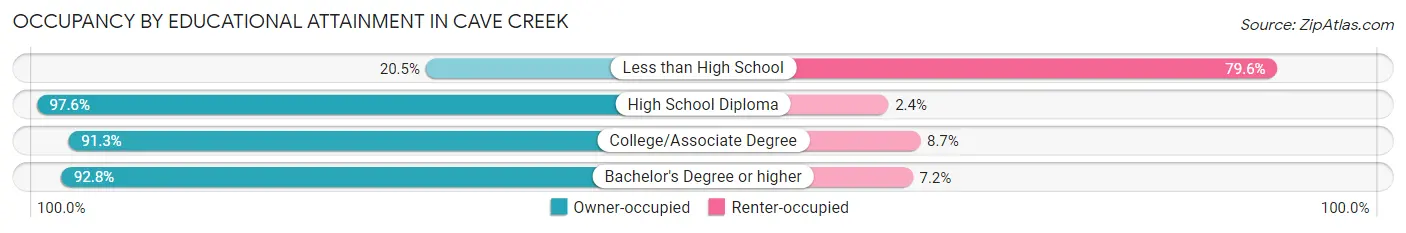
| Household Size | Owner-occupied | Renter-occupied |
| Less than High School | 9 (20.4%) | 35 (79.5%) |
| High School Diploma | 368 (97.6%) | 9 (2.4%) |
| College/Associate Degree | 578 (91.3%) | 55 (8.7%) |
| Bachelor's Degree or higher | 1,133 (92.8%) | 88 (7.2%) |
Occupancy by Age of Householder in Cave Creek
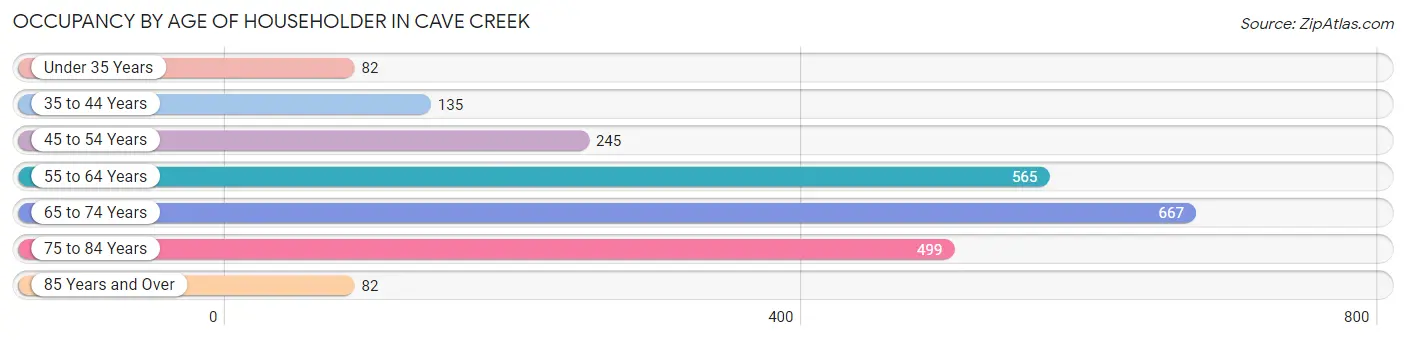
| Age Bracket | # Households | % Households |
| Under 35 Years | 82 | 3.6% |
| 35 to 44 Years | 135 | 5.9% |
| 45 to 54 Years | 245 | 10.8% |
| 55 to 64 Years | 565 | 24.8% |
| 65 to 74 Years | 667 | 29.3% |
| 75 to 84 Years | 499 | 21.9% |
| 85 Years and Over | 82 | 3.6% |
| Total | 2,275 | 100.0% |
Housing Finances in Cave Creek
Median Income by Occupancy in Cave Creek
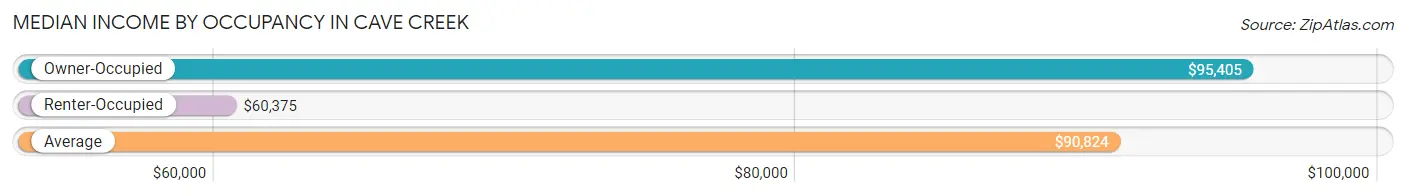
| Occupancy Type | # Households | Median Income |
| Owner-Occupied | 2,088 (91.8%) | $95,405 |
| Renter-Occupied | 187 (8.2%) | $60,375 |
| Average | 2,275 (100.0%) | $90,824 |
Occupancy by Householder Income Bracket in Cave Creek
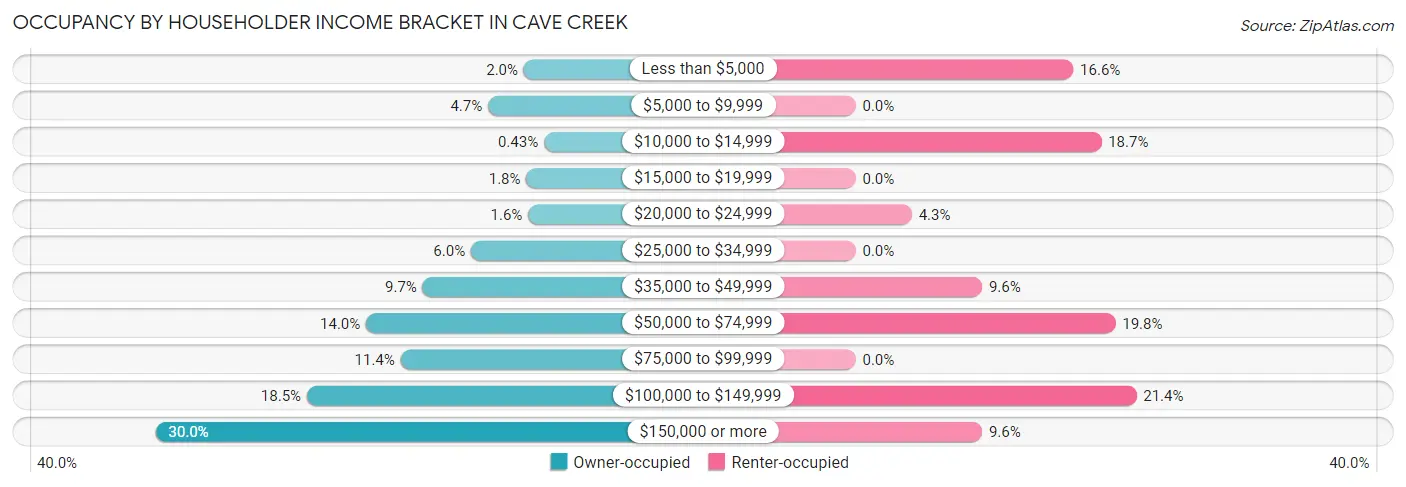
| Income Bracket | Owner-occupied | Renter-occupied |
| Less than $5,000 | 41 (2.0%) | 31 (16.6%) |
| $5,000 to $9,999 | 98 (4.7%) | 0 (0.0%) |
| $10,000 to $14,999 | 9 (0.4%) | 35 (18.7%) |
| $15,000 to $19,999 | 37 (1.8%) | 0 (0.0%) |
| $20,000 to $24,999 | 34 (1.6%) | 8 (4.3%) |
| $25,000 to $34,999 | 125 (6.0%) | 0 (0.0%) |
| $35,000 to $49,999 | 202 (9.7%) | 18 (9.6%) |
| $50,000 to $74,999 | 292 (14.0%) | 37 (19.8%) |
| $75,000 to $99,999 | 237 (11.4%) | 0 (0.0%) |
| $100,000 to $149,999 | 386 (18.5%) | 40 (21.4%) |
| $150,000 or more | 627 (30.0%) | 18 (9.6%) |
| Total | 2,088 (100.0%) | 187 (100.0%) |
Monthly Housing Cost Tiers in Cave Creek
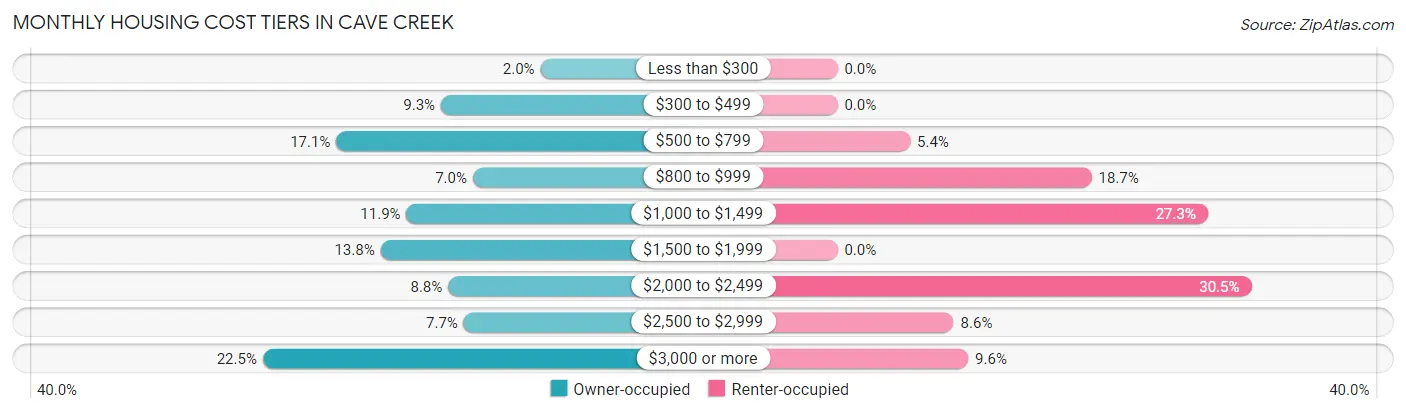
| Monthly Cost | Owner-occupied | Renter-occupied |
| Less than $300 | 42 (2.0%) | 0 (0.0%) |
| $300 to $499 | 195 (9.3%) | 0 (0.0%) |
| $500 to $799 | 356 (17.1%) | 10 (5.3%) |
| $800 to $999 | 146 (7.0%) | 35 (18.7%) |
| $1,000 to $1,499 | 248 (11.9%) | 51 (27.3%) |
| $1,500 to $1,999 | 288 (13.8%) | 0 (0.0%) |
| $2,000 to $2,499 | 184 (8.8%) | 57 (30.5%) |
| $2,500 to $2,999 | 160 (7.7%) | 16 (8.6%) |
| $3,000 or more | 469 (22.5%) | 18 (9.6%) |
| Total | 2,088 (100.0%) | 187 (100.0%) |
Physical Housing Characteristics in Cave Creek
Housing Structures in Cave Creek
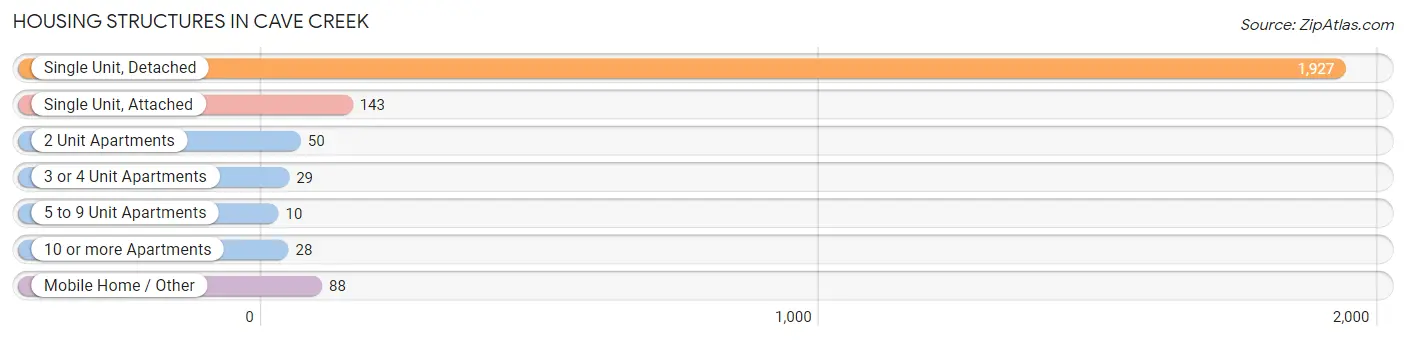
| Structure Type | # Housing Units | % Housing Units |
| Single Unit, Detached | 1,927 | 84.7% |
| Single Unit, Attached | 143 | 6.3% |
| 2 Unit Apartments | 50 | 2.2% |
| 3 or 4 Unit Apartments | 29 | 1.3% |
| 5 to 9 Unit Apartments | 10 | 0.4% |
| 10 or more Apartments | 28 | 1.2% |
| Mobile Home / Other | 88 | 3.9% |
| Total | 2,275 | 100.0% |
Housing Structures by Occupancy in Cave Creek
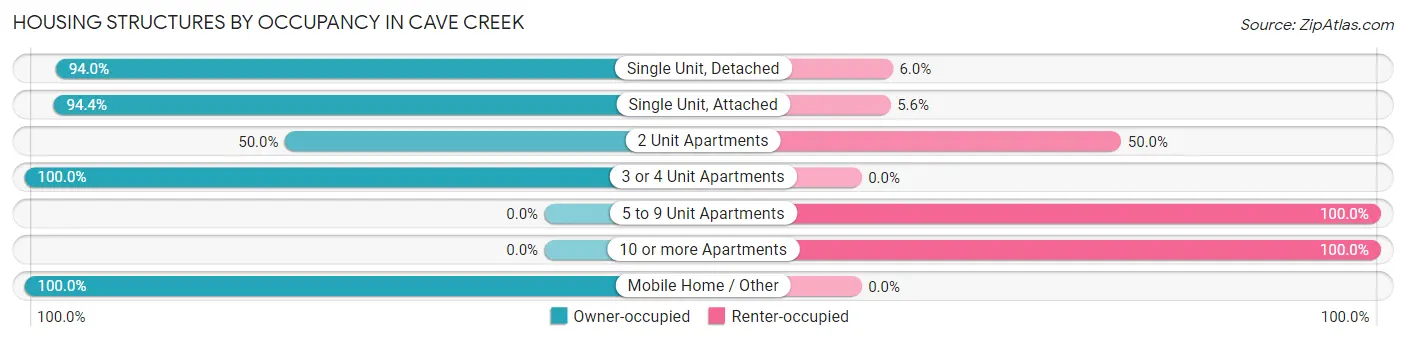
| Structure Type | Owner-occupied | Renter-occupied |
| Single Unit, Detached | 1,811 (94.0%) | 116 (6.0%) |
| Single Unit, Attached | 135 (94.4%) | 8 (5.6%) |
| 2 Unit Apartments | 25 (50.0%) | 25 (50.0%) |
| 3 or 4 Unit Apartments | 29 (100.0%) | 0 (0.0%) |
| 5 to 9 Unit Apartments | 0 (0.0%) | 10 (100.0%) |
| 10 or more Apartments | 0 (0.0%) | 28 (100.0%) |
| Mobile Home / Other | 88 (100.0%) | 0 (0.0%) |
| Total | 2,088 (91.8%) | 187 (8.2%) |
Housing Structures by Number of Rooms in Cave Creek
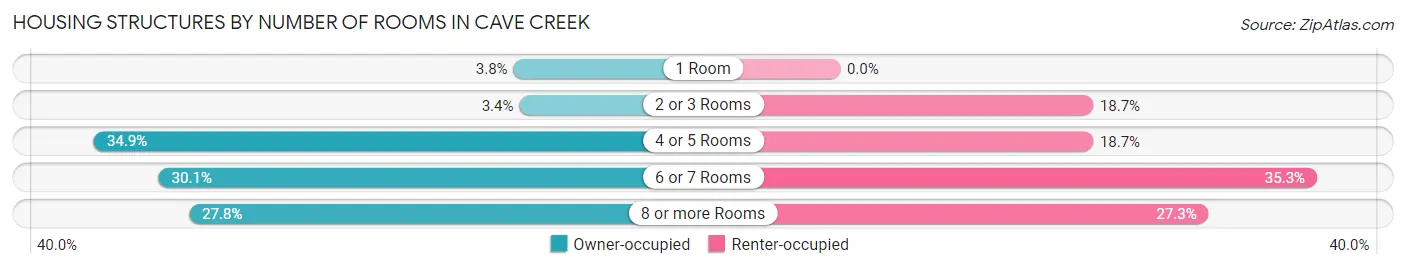
| Number of Rooms | Owner-occupied | Renter-occupied |
| 1 Room | 80 (3.8%) | 0 (0.0%) |
| 2 or 3 Rooms | 71 (3.4%) | 35 (18.7%) |
| 4 or 5 Rooms | 728 (34.9%) | 35 (18.7%) |
| 6 or 7 Rooms | 628 (30.1%) | 66 (35.3%) |
| 8 or more Rooms | 581 (27.8%) | 51 (27.3%) |
| Total | 2,088 (100.0%) | 187 (100.0%) |
Housing Structure by Heating Type in Cave Creek
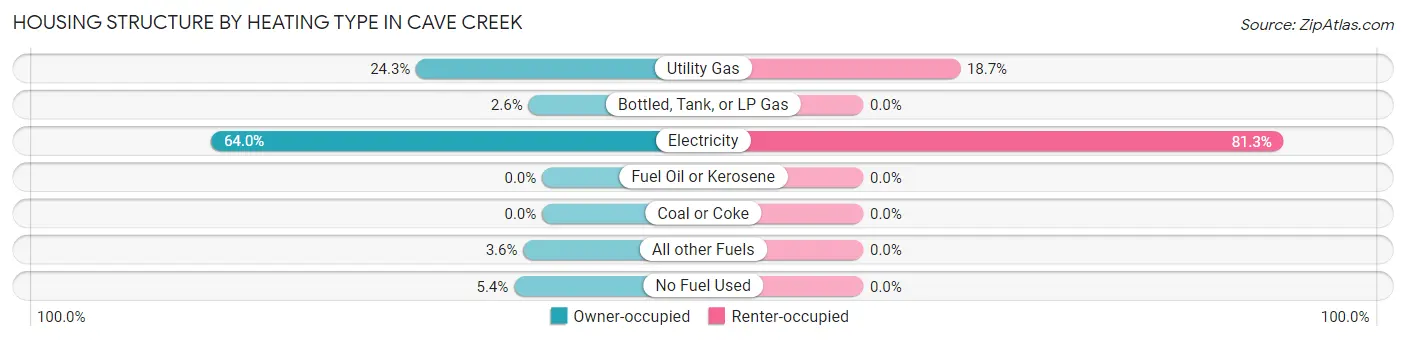
| Heating Type | Owner-occupied | Renter-occupied |
| Utility Gas | 508 (24.3%) | 35 (18.7%) |
| Bottled, Tank, or LP Gas | 55 (2.6%) | 0 (0.0%) |
| Electricity | 1,336 (64.0%) | 152 (81.3%) |
| Fuel Oil or Kerosene | 0 (0.0%) | 0 (0.0%) |
| Coal or Coke | 0 (0.0%) | 0 (0.0%) |
| All other Fuels | 76 (3.6%) | 0 (0.0%) |
| No Fuel Used | 113 (5.4%) | 0 (0.0%) |
| Total | 2,088 (100.0%) | 187 (100.0%) |
Household Vehicle Usage in Cave Creek
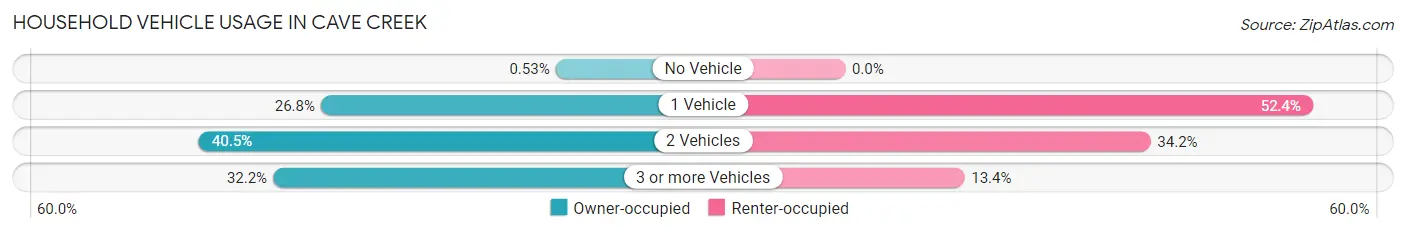
| Vehicles per Household | Owner-occupied | Renter-occupied |
| No Vehicle | 11 (0.5%) | 0 (0.0%) |
| 1 Vehicle | 560 (26.8%) | 98 (52.4%) |
| 2 Vehicles | 845 (40.5%) | 64 (34.2%) |
| 3 or more Vehicles | 672 (32.2%) | 25 (13.4%) |
| Total | 2,088 (100.0%) | 187 (100.0%) |
Real Estate & Mortgages in Cave Creek
Real Estate and Mortgage Overview in Cave Creek
| Characteristic | Without Mortgage | With Mortgage |
| Housing Units | 813 | 1,275 |
| Median Property Value | $801,500 | $682,500 |
| Median Household Income | $72,260 | $472 |
| Monthly Housing Costs | $695 | $469 |
| Real Estate Taxes | $2,763 | $0 |
Property Value by Mortgage Status in Cave Creek
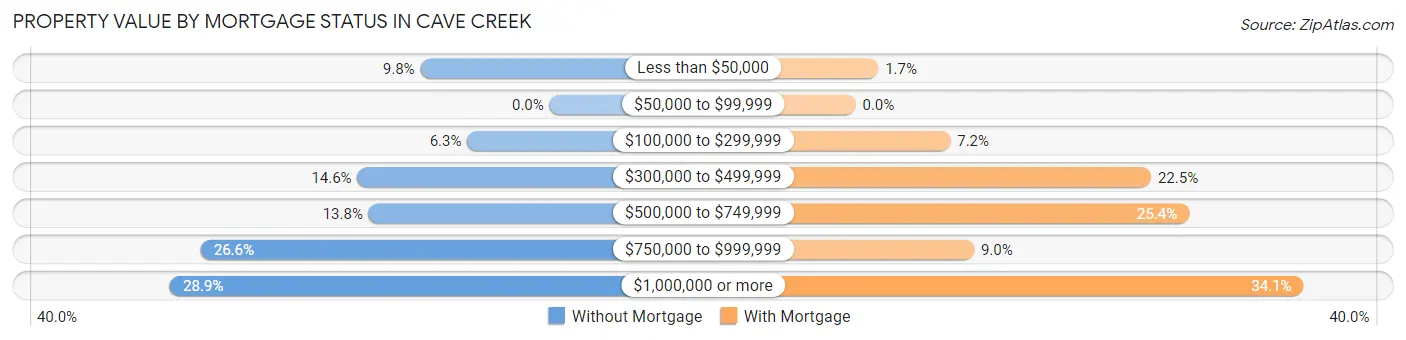
| Property Value | Without Mortgage | With Mortgage |
| Less than $50,000 | 80 (9.8%) | 22 (1.7%) |
| $50,000 to $99,999 | 0 (0.0%) | 0 (0.0%) |
| $100,000 to $299,999 | 51 (6.3%) | 92 (7.2%) |
| $300,000 to $499,999 | 119 (14.6%) | 287 (22.5%) |
| $500,000 to $749,999 | 112 (13.8%) | 324 (25.4%) |
| $750,000 to $999,999 | 216 (26.6%) | 115 (9.0%) |
| $1,000,000 or more | 235 (28.9%) | 435 (34.1%) |
| Total | 813 (100.0%) | 1,275 (100.0%) |
Household Income by Mortgage Status in Cave Creek
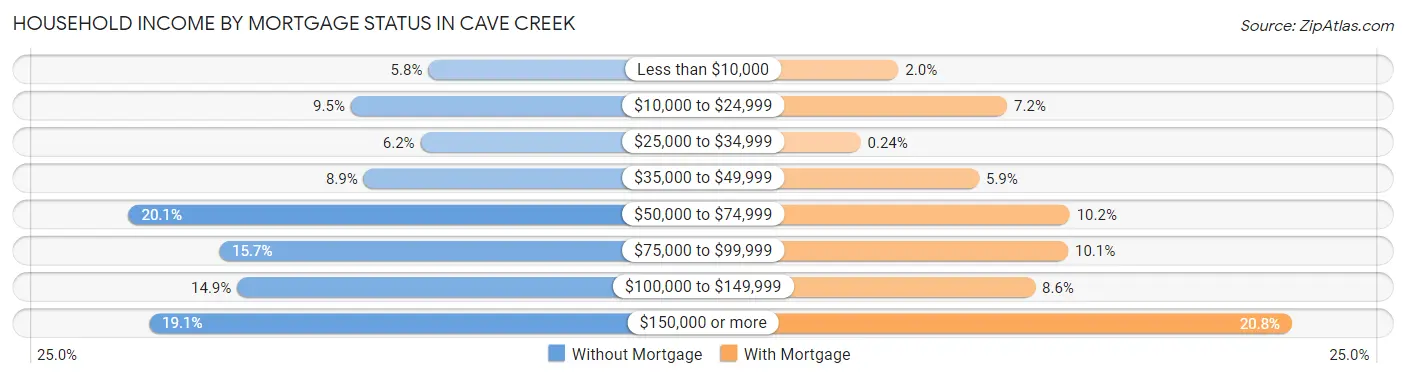
| Household Income | Without Mortgage | With Mortgage |
| Less than $10,000 | 47 (5.8%) | 26 (2.0%) |
| $10,000 to $24,999 | 77 (9.5%) | 92 (7.2%) |
| $25,000 to $34,999 | 50 (6.1%) | 3 (0.2%) |
| $35,000 to $49,999 | 72 (8.9%) | 75 (5.9%) |
| $50,000 to $74,999 | 163 (20.1%) | 130 (10.2%) |
| $75,000 to $99,999 | 128 (15.7%) | 129 (10.1%) |
| $100,000 to $149,999 | 121 (14.9%) | 109 (8.6%) |
| $150,000 or more | 155 (19.1%) | 265 (20.8%) |
| Total | 813 (100.0%) | 1,275 (100.0%) |
Property Value to Household Income Ratio in Cave Creek
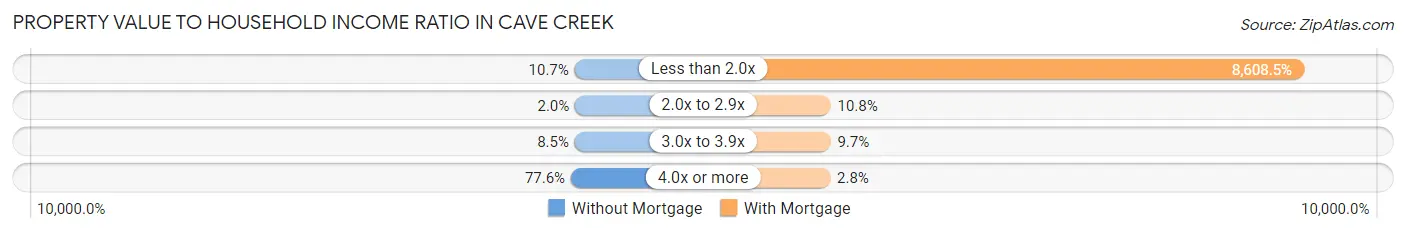
| Value-to-Income Ratio | Without Mortgage | With Mortgage |
| Less than 2.0x | 87 (10.7%) | 109,758 (8,608.5%) |
| 2.0x to 2.9x | 16 (2.0%) | 137 (10.7%) |
| 3.0x to 3.9x | 69 (8.5%) | 124 (9.7%) |
| 4.0x or more | 631 (77.6%) | 36 (2.8%) |
| Total | 813 (100.0%) | 1,275 (100.0%) |
Real Estate Taxes by Mortgage Status in Cave Creek
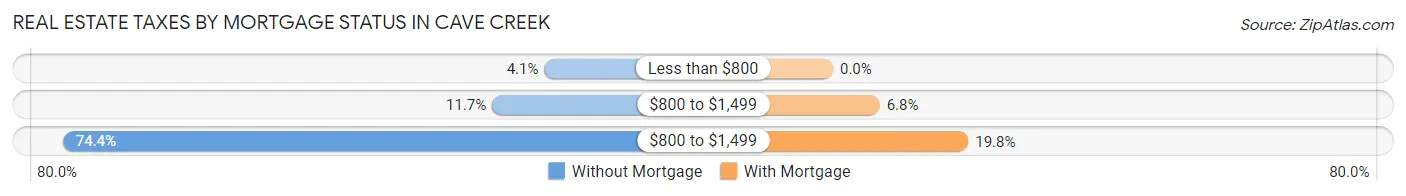
| Property Taxes | Without Mortgage | With Mortgage |
| Less than $800 | 33 (4.1%) | 0 (0.0%) |
| $800 to $1,499 | 95 (11.7%) | 87 (6.8%) |
| $800 to $1,499 | 605 (74.4%) | 252 (19.8%) |
| Total | 813 (100.0%) | 1,275 (100.0%) |
Health & Disability in Cave Creek
Health Insurance Coverage by Age in Cave Creek
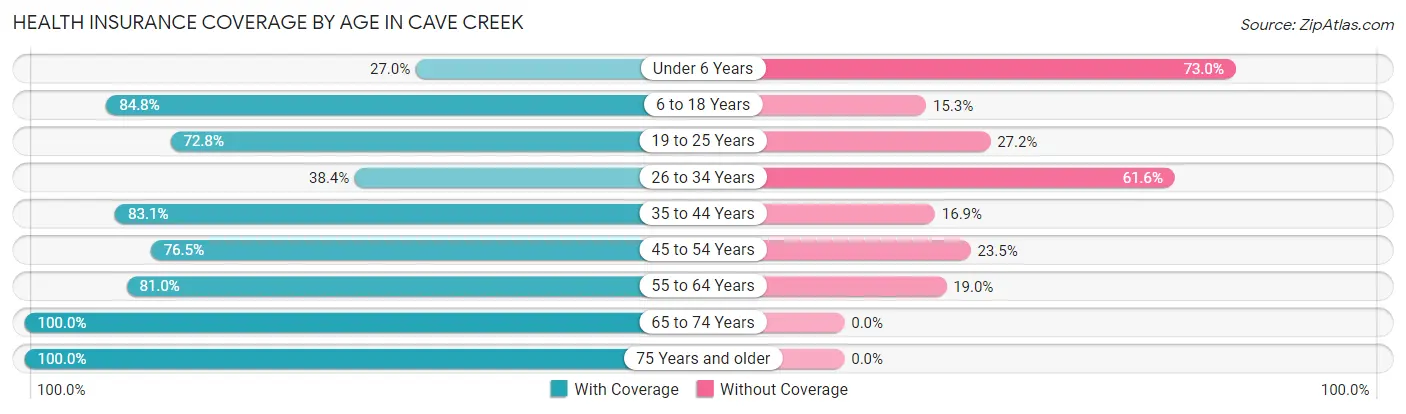
| Age Bracket | With Coverage | Without Coverage |
| Under 6 Years | 37 (27.0%) | 100 (73.0%) |
| 6 to 18 Years | 489 (84.8%) | 88 (15.2%) |
| 19 to 25 Years | 99 (72.8%) | 37 (27.2%) |
| 26 to 34 Years | 99 (38.4%) | 159 (61.6%) |
| 35 to 44 Years | 187 (83.1%) | 38 (16.9%) |
| 45 to 54 Years | 598 (76.5%) | 184 (23.5%) |
| 55 to 64 Years | 729 (81.0%) | 171 (19.0%) |
| 65 to 74 Years | 1,083 (100.0%) | 0 (0.0%) |
| 75 Years and older | 868 (100.0%) | 0 (0.0%) |
| Total | 4,189 (84.4%) | 777 (15.7%) |
Health Insurance Coverage by Citizenship Status in Cave Creek
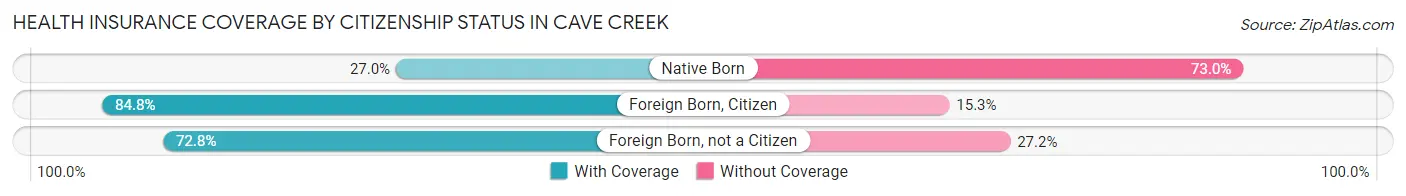
| Citizenship Status | With Coverage | Without Coverage |
| Native Born | 37 (27.0%) | 100 (73.0%) |
| Foreign Born, Citizen | 489 (84.8%) | 88 (15.2%) |
| Foreign Born, not a Citizen | 99 (72.8%) | 37 (27.2%) |
Health Insurance Coverage by Household Income in Cave Creek
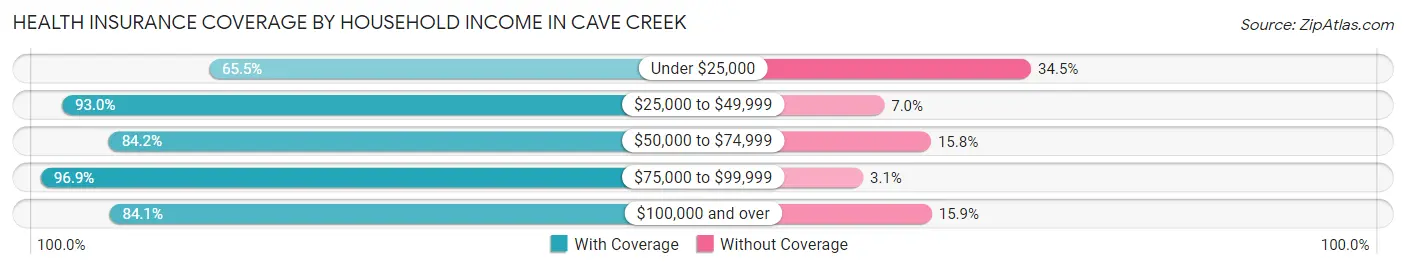
| Household Income | With Coverage | Without Coverage |
| Under $25,000 | 345 (65.5%) | 182 (34.5%) |
| $25,000 to $49,999 | 543 (93.0%) | 41 (7.0%) |
| $50,000 to $74,999 | 502 (84.2%) | 94 (15.8%) |
| $75,000 to $99,999 | 444 (96.9%) | 14 (3.1%) |
| $100,000 and over | 2,355 (84.1%) | 446 (15.9%) |
Public vs Private Health Insurance Coverage by Age in Cave Creek
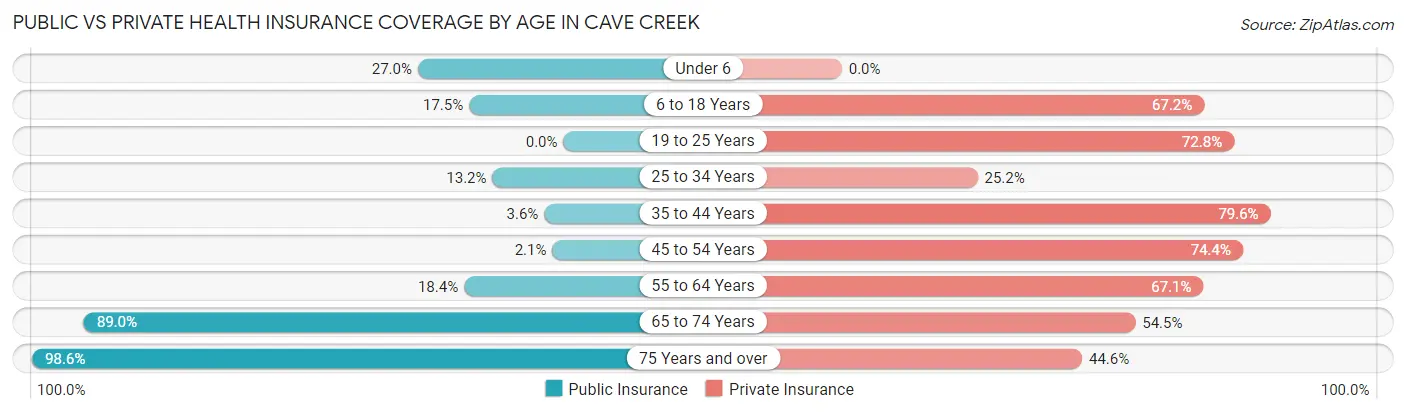
| Age Bracket | Public Insurance | Private Insurance |
| Under 6 | 37 (27.0%) | 0 (0.0%) |
| 6 to 18 Years | 101 (17.5%) | 388 (67.2%) |
| 19 to 25 Years | 0 (0.0%) | 99 (72.8%) |
| 25 to 34 Years | 34 (13.2%) | 65 (25.2%) |
| 35 to 44 Years | 8 (3.6%) | 179 (79.6%) |
| 45 to 54 Years | 16 (2.1%) | 582 (74.4%) |
| 55 to 64 Years | 166 (18.4%) | 604 (67.1%) |
| 65 to 74 Years | 964 (89.0%) | 590 (54.5%) |
| 75 Years and over | 856 (98.6%) | 387 (44.6%) |
| Total | 2,182 (43.9%) | 2,894 (58.3%) |
Disability Status by Sex by Age in Cave Creek
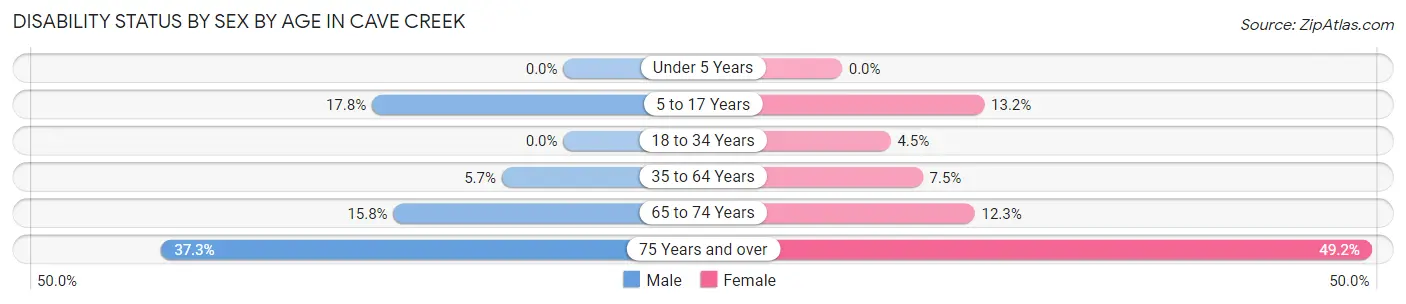
| Age Bracket | Male | Female |
| Under 5 Years | 0 (0.0%) | 0 (0.0%) |
| 5 to 17 Years | 46 (17.8%) | 42 (13.2%) |
| 18 to 34 Years | 0 (0.0%) | 8 (4.5%) |
| 35 to 64 Years | 48 (5.7%) | 80 (7.5%) |
| 65 to 74 Years | 85 (15.8%) | 67 (12.3%) |
| 75 Years and over | 144 (37.3%) | 237 (49.2%) |
Disability Class by Sex by Age in Cave Creek
Disability Class: Hearing Difficulty
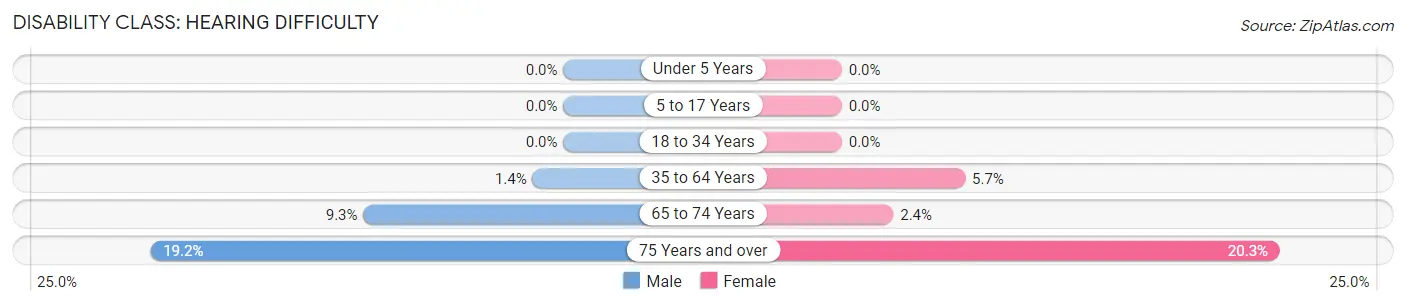
| Age Bracket | Male | Female |
| Under 5 Years | 0 (0.0%) | 0 (0.0%) |
| 5 to 17 Years | 0 (0.0%) | 0 (0.0%) |
| 18 to 34 Years | 0 (0.0%) | 0 (0.0%) |
| 35 to 64 Years | 12 (1.4%) | 61 (5.7%) |
| 65 to 74 Years | 50 (9.3%) | 13 (2.4%) |
| 75 Years and over | 74 (19.2%) | 98 (20.3%) |
Disability Class: Vision Difficulty
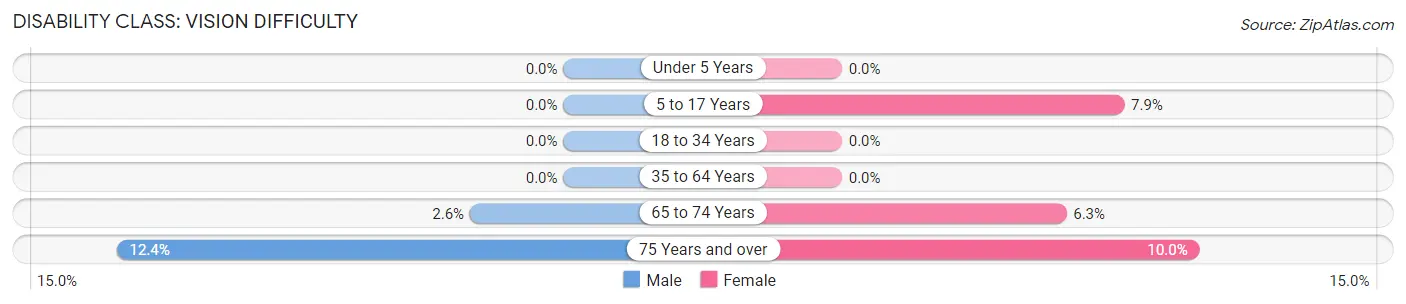
| Age Bracket | Male | Female |
| Under 5 Years | 0 (0.0%) | 0 (0.0%) |
| 5 to 17 Years | 0 (0.0%) | 25 (7.9%) |
| 18 to 34 Years | 0 (0.0%) | 0 (0.0%) |
| 35 to 64 Years | 0 (0.0%) | 0 (0.0%) |
| 65 to 74 Years | 14 (2.6%) | 34 (6.2%) |
| 75 Years and over | 48 (12.4%) | 48 (10.0%) |
Disability Class: Cognitive Difficulty
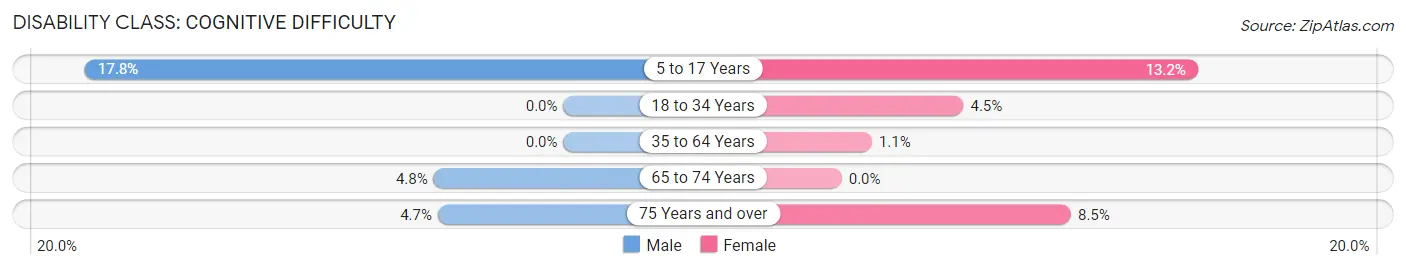
| Age Bracket | Male | Female |
| 5 to 17 Years | 46 (17.8%) | 42 (13.2%) |
| 18 to 34 Years | 0 (0.0%) | 8 (4.5%) |
| 35 to 64 Years | 0 (0.0%) | 12 (1.1%) |
| 65 to 74 Years | 26 (4.8%) | 0 (0.0%) |
| 75 Years and over | 18 (4.7%) | 41 (8.5%) |
Disability Class: Ambulatory Difficulty
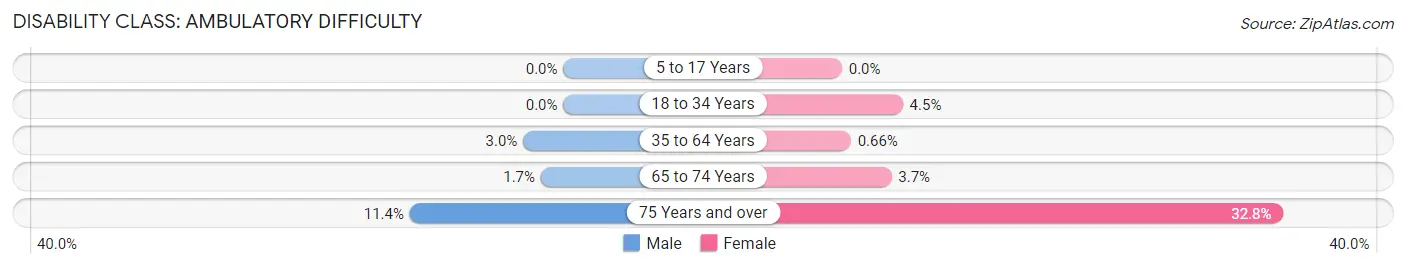
| Age Bracket | Male | Female |
| 5 to 17 Years | 0 (0.0%) | 0 (0.0%) |
| 18 to 34 Years | 0 (0.0%) | 8 (4.5%) |
| 35 to 64 Years | 25 (3.0%) | 7 (0.7%) |
| 65 to 74 Years | 9 (1.7%) | 20 (3.7%) |
| 75 Years and over | 44 (11.4%) | 158 (32.8%) |
Disability Class: Self-Care Difficulty
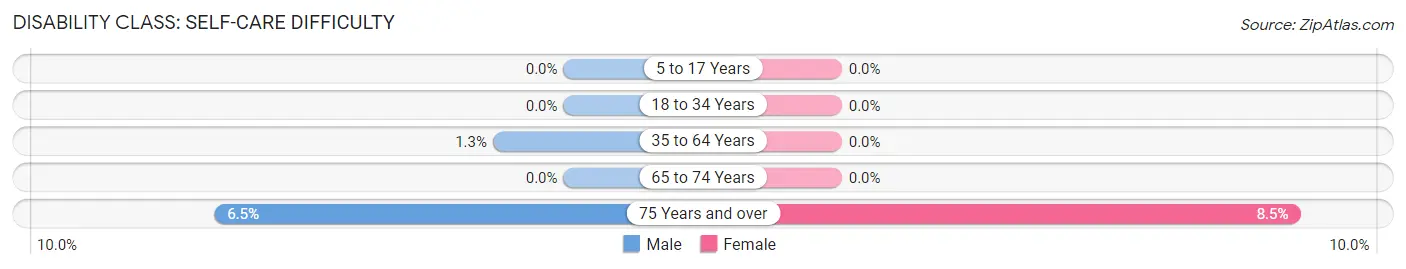
| Age Bracket | Male | Female |
| 5 to 17 Years | 0 (0.0%) | 0 (0.0%) |
| 18 to 34 Years | 0 (0.0%) | 0 (0.0%) |
| 35 to 64 Years | 11 (1.3%) | 0 (0.0%) |
| 65 to 74 Years | 0 (0.0%) | 0 (0.0%) |
| 75 Years and over | 25 (6.5%) | 41 (8.5%) |
Technology Access in Cave Creek
Computing Device Access in Cave Creek
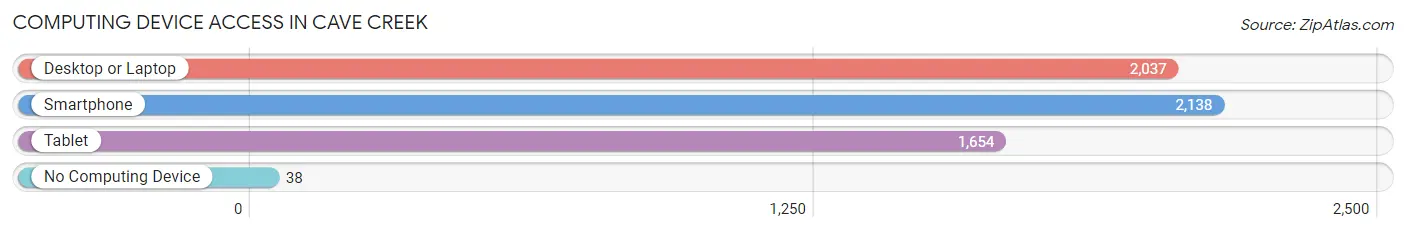
| Device Type | # Households | % Households |
| Desktop or Laptop | 2,037 | 89.5% |
| Smartphone | 2,138 | 94.0% |
| Tablet | 1,654 | 72.7% |
| No Computing Device | 38 | 1.7% |
| Total | 2,275 | 100.0% |
Internet Access in Cave Creek
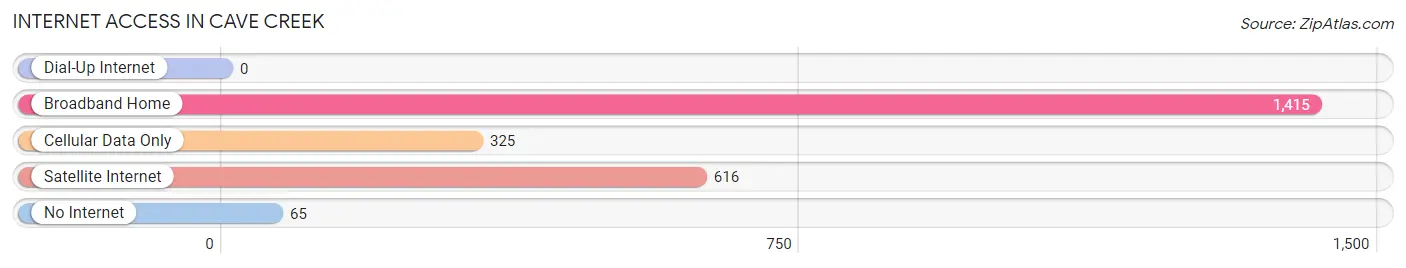
| Internet Type | # Households | % Households |
| Dial-Up Internet | 0 | 0.0% |
| Broadband Home | 1,415 | 62.2% |
| Cellular Data Only | 325 | 14.3% |
| Satellite Internet | 616 | 27.1% |
| No Internet | 65 | 2.9% |
| Total | 2,275 | 100.0% |
Cave Creek Summary
Cave Creek is a town located in Maricopa County, Arizona, United States. It is situated in the northern part of the Sonoran Desert, approximately 25 miles north of Phoenix. The town was founded in the late 19th century and has since grown to become a popular destination for tourists and outdoor enthusiasts.
Geography
Cave Creek is located in the northern part of the Sonoran Desert, approximately 25 miles north of Phoenix. The town is situated in the foothills of the Black Mountain Range, which is part of the larger Mazatzal Mountains. The town is surrounded by the Tonto National Forest, which provides a variety of recreational activities such as hiking, camping, and horseback riding. The town is also home to several creeks, including Cave Creek, which is the namesake of the town.
Climate
Cave Creek has a hot desert climate, with hot summers and mild winters. The average high temperature in the summer is around 100°F, while the average low temperature in the winter is around 40°F. The town receives an average of 8 inches of precipitation per year, with most of it falling in the summer months.
Demographics
As of the 2010 census, Cave Creek had a population of 5,015. The racial makeup of the town was 94.3% White, 0.7% African American, 0.7% Native American, 0.7% Asian, 0.2% Pacific Islander, 1.7% from other races, and 2.4% from two or more races. Hispanic or Latino of any race were 6.3% of the population.
Economy
Cave Creek is a popular tourist destination, and the town’s economy is largely based on tourism. The town is home to several restaurants, bars, and shops, as well as a variety of outdoor activities such as hiking, horseback riding, and camping. The town is also home to several wineries and breweries, which attract visitors from all over the state.
History
Cave Creek was founded in the late 19th century by settlers who were drawn to the area by the abundance of water from the nearby creeks. The town was originally known as “Cave Creek Station” and was a stop on the stagecoach line between Phoenix and Prescott. The town was officially incorporated in 1986 and has since grown to become a popular destination for tourists and outdoor enthusiasts.
Conclusion
Cave Creek is a town located in Maricopa County, Arizona, United States. It is situated in the northern part of the Sonoran Desert, approximately 25 miles north of Phoenix. The town was founded in the late 19th century and has since grown to become a popular destination for tourists and outdoor enthusiasts. The town has a hot desert climate, with hot summers and mild winters. As of the 2010 census, Cave Creek had a population of 5,015. The town’s economy is largely based on tourism, with several restaurants, bars, and shops, as well as a variety of outdoor activities.
Common Questions
What is Per Capita Income in Cave Creek?
Per Capita income in Cave Creek is $58,217.
What is the Median Family Income in Cave Creek?
Median Family Income in Cave Creek is $108,316.
What is the Median Household income in Cave Creek?
Median Household Income in Cave Creek is $90,824.
What is Income or Wage Gap in Cave Creek?
Income or Wage Gap in Cave Creek is 40.4%.
Women in Cave Creek earn 59.6 cents for every dollar earned by a man.
What is Family Income Deficit in Cave Creek?
Family Income Deficit in Cave Creek is $11,759.
Families that are below poverty line in Cave Creek earn $11,759 less on average than the poverty threshold level.
What is Inequality or Gini Index in Cave Creek?
Inequality or Gini Index in Cave Creek is 0.47.
What is the Total Population of Cave Creek?
Total Population of Cave Creek is 4,966.
What is the Total Male Population of Cave Creek?
Total Male Population of Cave Creek is 2,359.
What is the Total Female Population of Cave Creek?
Total Female Population of Cave Creek is 2,607.
What is the Ratio of Males per 100 Females in Cave Creek?
There are 90.49 Males per 100 Females in Cave Creek.
What is the Ratio of Females per 100 Males in Cave Creek?
There are 110.51 Females per 100 Males in Cave Creek.
What is the Median Population Age in Cave Creek?
Median Population Age in Cave Creek is 58.1 Years.
What is the Average Family Size in Cave Creek
Average Family Size in Cave Creek is 2.7 People.
What is the Average Household Size in Cave Creek
Average Household Size in Cave Creek is 2.2 People.
How Large is the Labor Force in Cave Creek?
There are 2,299 People in the Labor Forcein in Cave Creek.
What is the Percentage of People in the Labor Force in Cave Creek?
52.4% of People are in the Labor Force in Cave Creek.
What is the Unemployment Rate in Cave Creek?
Unemployment Rate in Cave Creek is 4.5%.