Williamson, AZ Map & Demographics
Williamson Map
Williamson Overview
$57,921
PER CAPITA INCOME
$92,069
AVG FAMILY INCOME
$84,878
AVG HOUSEHOLD INCOME
34.7%
WAGE / INCOME GAP [ % ]
65.3¢/ $1
WAGE / INCOME GAP [ $ ]
0.44
INEQUALITY / GINI INDEX
5,999
TOTAL POPULATION
2,951
MALE POPULATION
3,048
FEMALE POPULATION
96.82
MALES / 100 FEMALES
103.29
FEMALES / 100 MALES
65.4
MEDIAN AGE
2.3
AVG FAMILY SIZE
2.0
AVG HOUSEHOLD SIZE
1,888
LABOR FORCE [ PEOPLE ]
32.8%
PERCENT IN LABOR FORCE
1.9%
UNEMPLOYMENT RATE
Income in Williamson
Income Overview in Williamson
Per Capita Income in Williamson is $57,921, while median incomes of families and households are $92,069 and $84,878 respectively.
| Characteristic | Number | Measure |
| Per Capita Income | 5,999 | $57,921 |
| Median Family Income | 2,232 | $92,069 |
| Mean Family Income | 2,232 | $133,680 |
| Median Household Income | 2,958 | $84,878 |
| Mean Household Income | 2,958 | $114,315 |
| Income Deficit | 2,232 | $0 |
| Wage / Income Gap (%) | 5,999 | 34.72% |
| Wage / Income Gap ($) | 5,999 | 65.28¢ per $1 |
| Gini / Inequality Index | 5,999 | 0.44 |
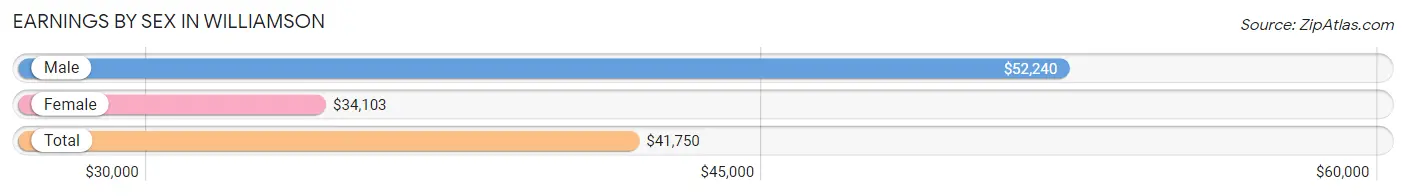
Earnings by Sex in Williamson
Average Earnings in Williamson are $41,750, $52,240 for men and $34,103 for women, a difference of 34.7%.
| Sex | Number | Average Earnings |
| Male | 1,108 (48.4%) | $52,240 |
| Female | 1,179 (51.5%) | $34,103 |
| Total | 2,287 (100.0%) | $41,750 |
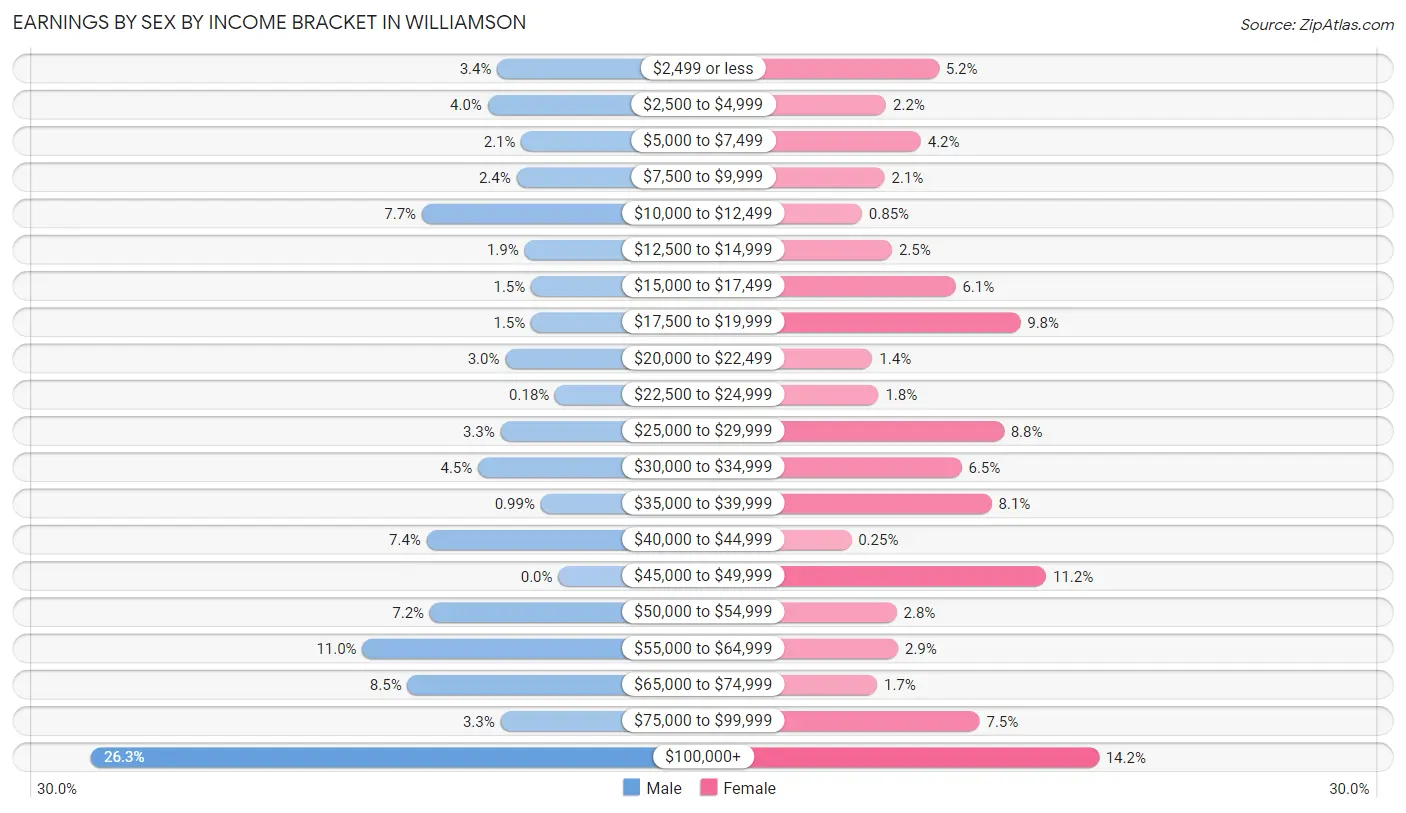
Earnings by Sex by Income Bracket in Williamson
The most common earnings brackets in Williamson are $100,000+ for men (291 | 26.3%) and $100,000+ for women (167 | 14.2%).
| Income | Male | Female |
| $2,499 or less | 38 (3.4%) | 61 (5.2%) |
| $2,500 to $4,999 | 44 (4.0%) | 26 (2.2%) |
| $5,000 to $7,499 | 23 (2.1%) | 49 (4.2%) |
| $7,500 to $9,999 | 26 (2.4%) | 25 (2.1%) |
| $10,000 to $12,499 | 85 (7.7%) | 10 (0.9%) |
| $12,500 to $14,999 | 21 (1.9%) | 30 (2.5%) |
| $15,000 to $17,499 | 17 (1.5%) | 72 (6.1%) |
| $17,500 to $19,999 | 17 (1.5%) | 115 (9.8%) |
| $20,000 to $22,499 | 33 (3.0%) | 17 (1.4%) |
| $22,500 to $24,999 | 2 (0.2%) | 21 (1.8%) |
| $25,000 to $29,999 | 36 (3.3%) | 104 (8.8%) |
| $30,000 to $34,999 | 50 (4.5%) | 76 (6.5%) |
| $35,000 to $39,999 | 11 (1.0%) | 96 (8.1%) |
| $40,000 to $44,999 | 82 (7.4%) | 3 (0.3%) |
| $45,000 to $49,999 | 0 (0.0%) | 132 (11.2%) |
| $50,000 to $54,999 | 80 (7.2%) | 33 (2.8%) |
| $55,000 to $64,999 | 122 (11.0%) | 34 (2.9%) |
| $65,000 to $74,999 | 94 (8.5%) | 20 (1.7%) |
| $75,000 to $99,999 | 36 (3.3%) | 88 (7.5%) |
| $100,000+ | 291 (26.3%) | 167 (14.2%) |
| Total | 1,108 (100.0%) | 1,179 (100.0%) |
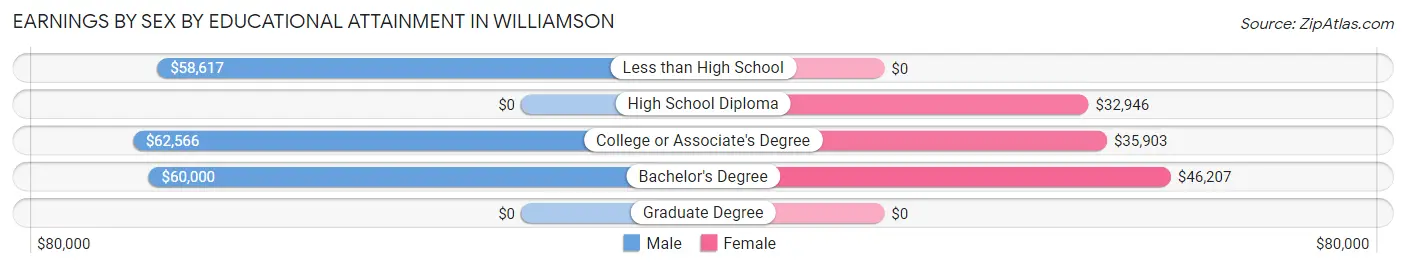
Earnings by Sex by Educational Attainment in Williamson
Average earnings in Williamson are $57,578 for men and $36,386 for women, a difference of 36.8%. Men with an educational attainment of college or associate's degree enjoy the highest average annual earnings of $62,566, while those with less than high school education earn the least with $58,617. Women with an educational attainment of bachelor's degree earn the most with the average annual earnings of $46,207, while those with high school diploma education have the smallest earnings of $32,946.
| Educational Attainment | Male Income | Female Income |
| Less than High School | $58,617 | $0 |
| High School Diploma | - | - |
| College or Associate's Degree | $62,566 | $35,903 |
| Bachelor's Degree | $60,000 | $46,207 |
| Graduate Degree | - | - |
| Total | $57,578 | $36,386 |
Family Income in Williamson
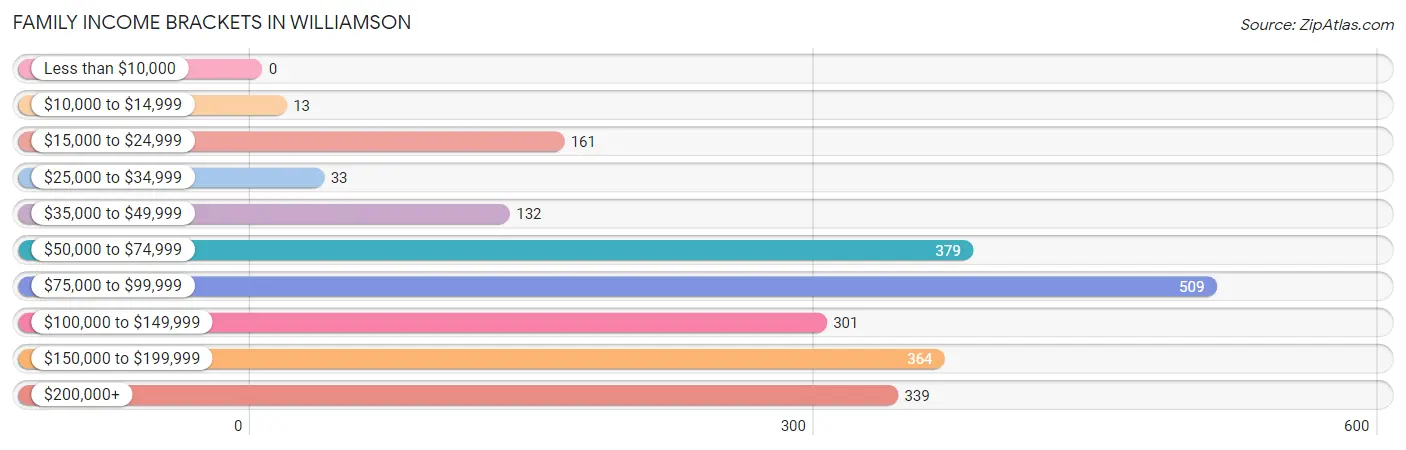
Family Income Brackets in Williamson
According to the Williamson family income data, there are 509 families falling into the $75,000 to $99,999 income range, which is the most common income bracket and makes up 22.8% of all families.
| Income Bracket | # Families | % Families |
| Less than $10,000 | 0 | 0.0% |
| $10,000 to $14,999 | 13 | 0.6% |
| $15,000 to $24,999 | 161 | 7.2% |
| $25,000 to $34,999 | 33 | 1.5% |
| $35,000 to $49,999 | 132 | 5.9% |
| $50,000 to $74,999 | 379 | 17.0% |
| $75,000 to $99,999 | 509 | 22.8% |
| $100,000 to $149,999 | 301 | 13.5% |
| $150,000 to $199,999 | 364 | 16.3% |
| $200,000+ | 339 | 15.2% |
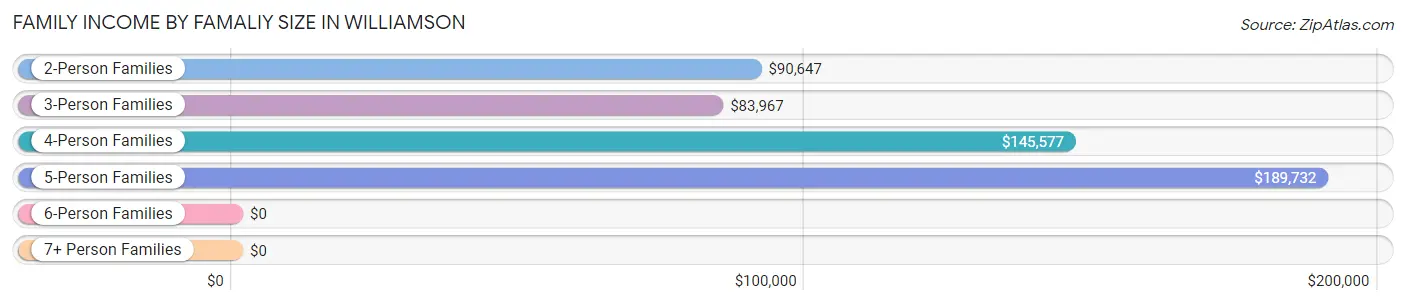
Family Income by Famaliy Size in Williamson
5-person families (27 | 1.2%) account for the highest median family income in Williamson with $189,732 per family, while 2-person families (1,860 | 83.3%) have the highest median income of $45,324 per family member.
| Income Bracket | # Families | Median Income |
| 2-Person Families | 1,860 (83.3%) | $90,647 |
| 3-Person Families | 245 (11.0%) | $83,967 |
| 4-Person Families | 100 (4.5%) | $145,577 |
| 5-Person Families | 27 (1.2%) | $189,732 |
| 6-Person Families | 0 (0.0%) | $0 |
| 7+ Person Families | 0 (0.0%) | $0 |
| Total | 2,232 (100.0%) | $92,069 |
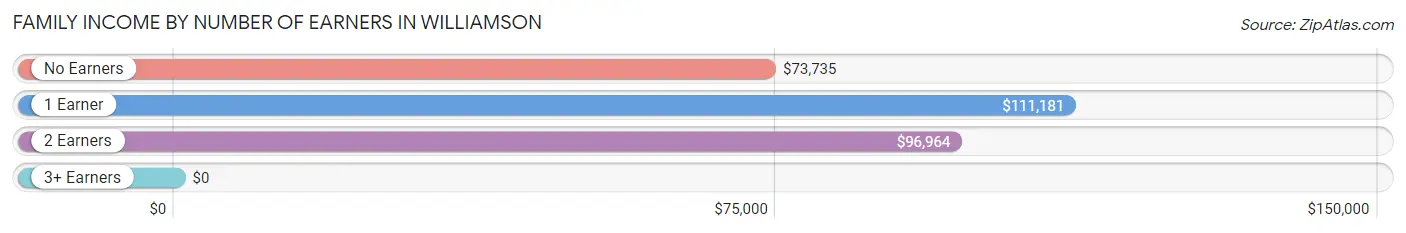
Family Income by Number of Earners in Williamson
| Number of Earners | # Families | Median Income |
| No Earners | 985 (44.1%) | $73,735 |
| 1 Earner | 679 (30.4%) | $111,181 |
| 2 Earners | 488 (21.9%) | $96,964 |
| 3+ Earners | 80 (3.6%) | $0 |
| Total | 2,232 (100.0%) | $92,069 |
Household Income in Williamson
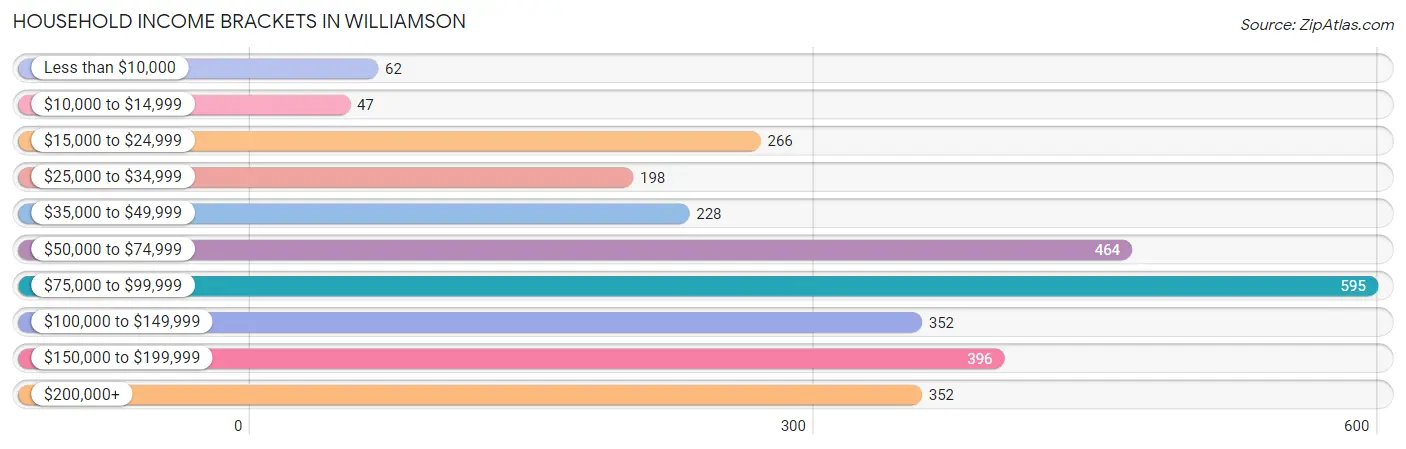
Household Income Brackets in Williamson
With 595 households falling in the category, the $75,000 to $99,999 income range is the most frequent in Williamson, accounting for 20.1% of all households. In contrast, only 47 households (1.6%) fall into the $10,000 to $14,999 income bracket, making it the least populous group.
| Income Bracket | # Households | % Households |
| Less than $10,000 | 62 | 2.1% |
| $10,000 to $14,999 | 47 | 1.6% |
| $15,000 to $24,999 | 266 | 9.0% |
| $25,000 to $34,999 | 198 | 6.7% |
| $35,000 to $49,999 | 228 | 7.7% |
| $50,000 to $74,999 | 464 | 15.7% |
| $75,000 to $99,999 | 595 | 20.1% |
| $100,000 to $149,999 | 352 | 11.9% |
| $150,000 to $199,999 | 396 | 13.4% |
| $200,000+ | 352 | 11.9% |
Household Income by Householder Age in Williamson
The median household income in Williamson is $84,878, with the highest median household income of $115,588 found in the 25 to 44 years age bracket for the primary householder. A total of 54 households (1.8%) fall into this category. Meanwhile, the 15 to 24 years age bracket for the primary householder has the lowest median household income of $0, with 9 households (0.3%) in this group.
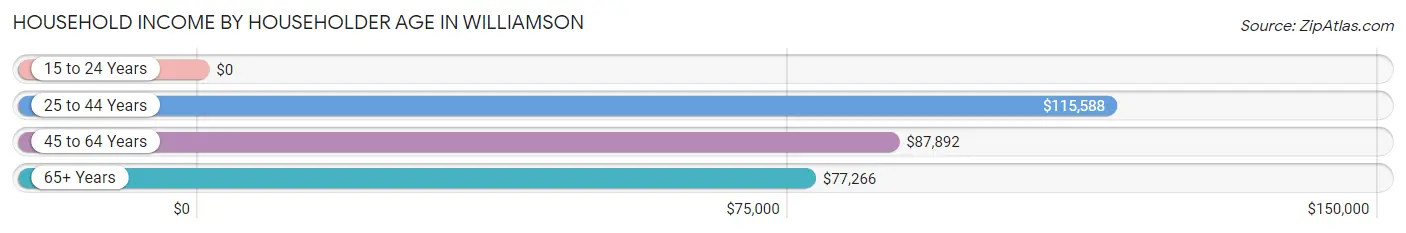
| Income Bracket | # Households | Median Income |
| 15 to 24 Years | 9 (0.3%) | $0 |
| 25 to 44 Years | 54 (1.8%) | $115,588 |
| 45 to 64 Years | 1,094 (37.0%) | $87,892 |
| 65+ Years | 1,801 (60.9%) | $77,266 |
| Total | 2,958 (100.0%) | $84,878 |
Poverty in Williamson
Income Below Poverty by Sex and Age in Williamson
With 4.7% poverty level for males and 3.8% for females among the residents of Williamson, 35 to 44 year old males and 75 year old and over females are the most vulnerable to poverty, with 14 males (20.9%) and 33 females (6.6%) in their respective age groups living below the poverty level.
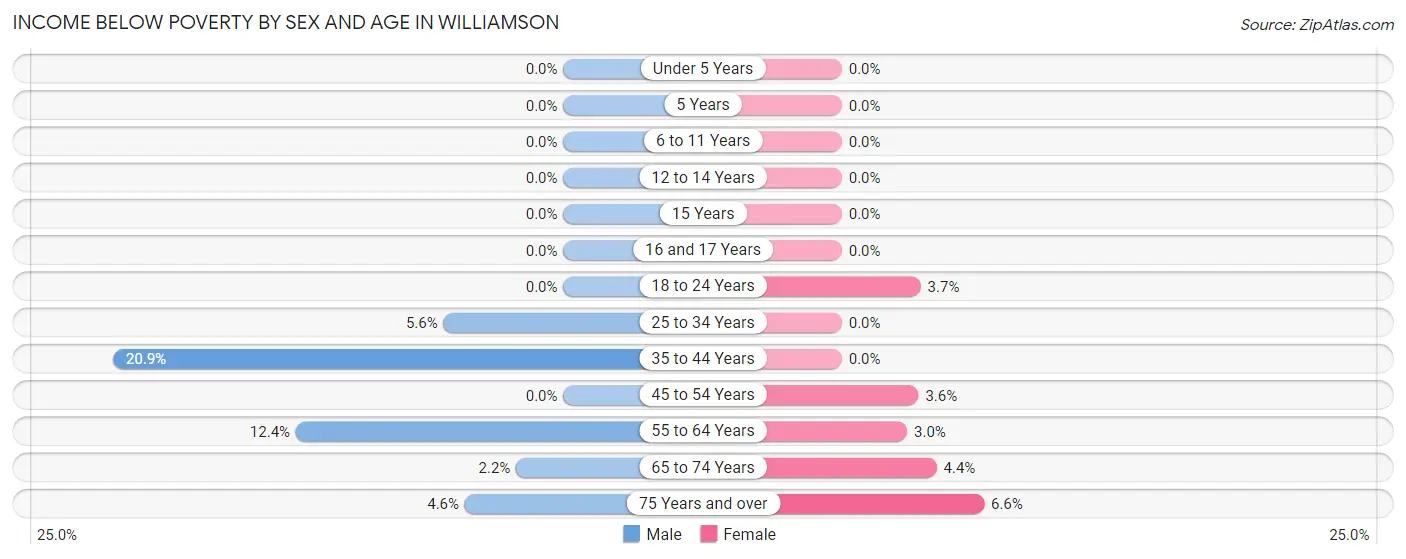
| Age Bracket | Male | Female |
| Under 5 Years | 0 (0.0%) | 0 (0.0%) |
| 5 Years | 0 (0.0%) | 0 (0.0%) |
| 6 to 11 Years | 0 (0.0%) | 0 (0.0%) |
| 12 to 14 Years | 0 (0.0%) | 0 (0.0%) |
| 15 Years | 0 (0.0%) | 0 (0.0%) |
| 16 and 17 Years | 0 (0.0%) | 0 (0.0%) |
| 18 to 24 Years | 0 (0.0%) | 3 (3.7%) |
| 25 to 34 Years | 3 (5.6%) | 0 (0.0%) |
| 35 to 44 Years | 14 (20.9%) | 0 (0.0%) |
| 45 to 54 Years | 0 (0.0%) | 14 (3.6%) |
| 55 to 64 Years | 68 (12.4%) | 28 (3.0%) |
| 65 to 74 Years | 23 (2.2%) | 39 (4.4%) |
| 75 Years and over | 32 (4.6%) | 33 (6.6%) |
| Total | 140 (4.7%) | 117 (3.8%) |
Income Above Poverty by Sex and Age in Williamson
According to the poverty statistics in Williamson, males aged under 5 years and females aged under 5 years are the age groups that are most secure financially, with 100.0% of males and 100.0% of females in these age groups living above the poverty line.
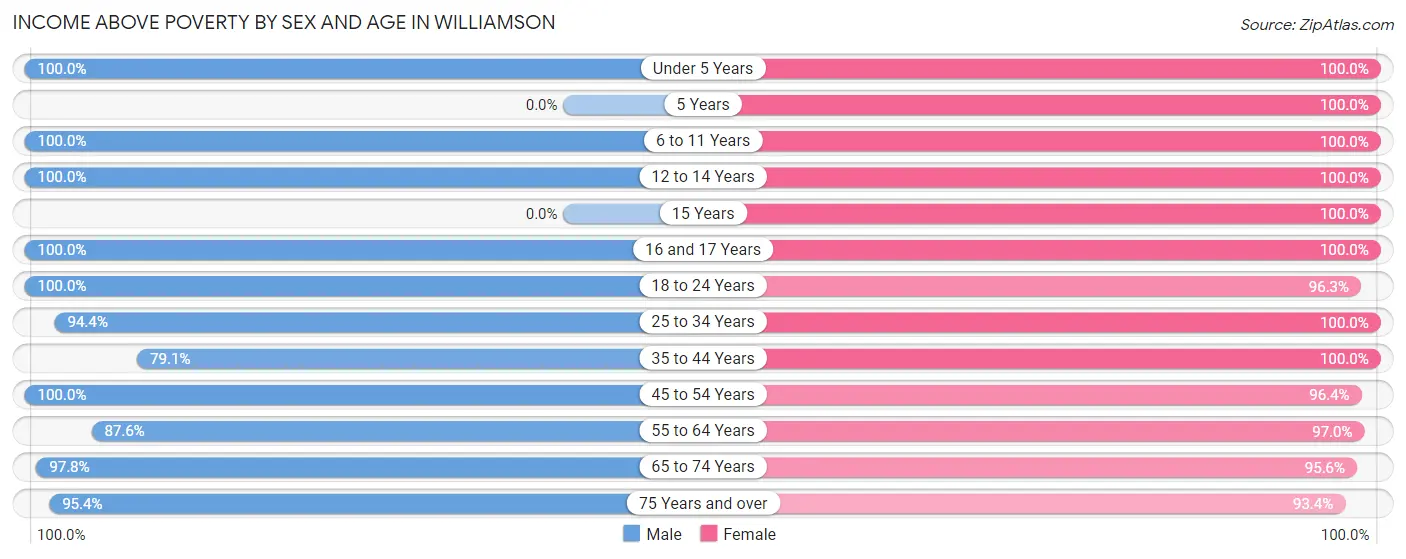
| Age Bracket | Male | Female |
| Under 5 Years | 18 (100.0%) | 3 (100.0%) |
| 5 Years | 0 (0.0%) | 2 (100.0%) |
| 6 to 11 Years | 92 (100.0%) | 38 (100.0%) |
| 12 to 14 Years | 31 (100.0%) | 55 (100.0%) |
| 15 Years | 0 (0.0%) | 2 (100.0%) |
| 16 and 17 Years | 35 (100.0%) | 21 (100.0%) |
| 18 to 24 Years | 52 (100.0%) | 79 (96.3%) |
| 25 to 34 Years | 51 (94.4%) | 57 (100.0%) |
| 35 to 44 Years | 53 (79.1%) | 81 (100.0%) |
| 45 to 54 Years | 303 (100.0%) | 379 (96.4%) |
| 55 to 64 Years | 480 (87.6%) | 897 (97.0%) |
| 65 to 74 Years | 1,028 (97.8%) | 847 (95.6%) |
| 75 Years and over | 668 (95.4%) | 467 (93.4%) |
| Total | 2,811 (95.3%) | 2,928 (96.2%) |
Income Below Poverty Among Married-Couple Families in Williamson
The poverty statistics for married-couple families in Williamson show that 0.8% or 17 of the total 2,101 families live below the poverty line. Families with no children have the highest poverty rate of 0.9%, comprising of 17 families. On the other hand, families with 1 or 2 children have the lowest poverty rate of 0.0%, which includes 0 families.
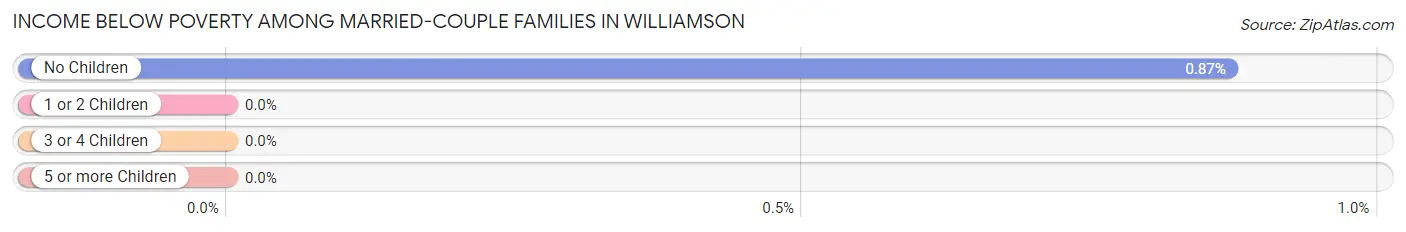
| Children | Above Poverty | Below Poverty |
| No Children | 1,934 (99.1%) | 17 (0.9%) |
| 1 or 2 Children | 136 (100.0%) | 0 (0.0%) |
| 3 or 4 Children | 14 (100.0%) | 0 (0.0%) |
| 5 or more Children | 0 (0.0%) | 0 (0.0%) |
| Total | 2,084 (99.2%) | 17 (0.8%) |
Income Below Poverty Among Single-Parent Households in Williamson
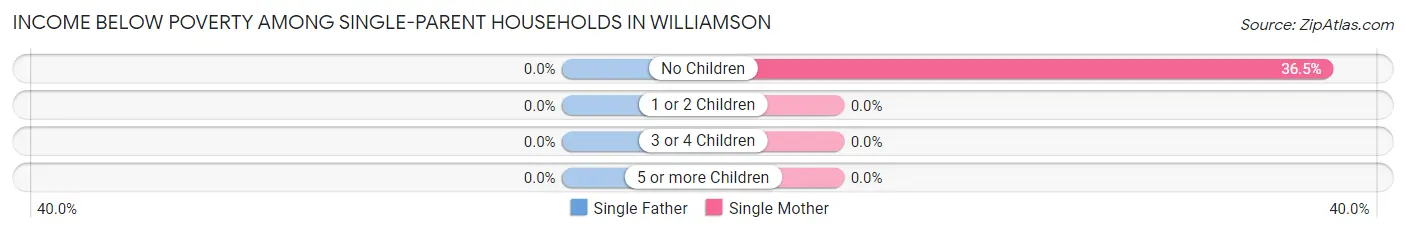
| Children | Single Father | Single Mother |
| No Children | 0 (0.0%) | 27 (36.5%) |
| 1 or 2 Children | 0 (0.0%) | 0 (0.0%) |
| 3 or 4 Children | 0 (0.0%) | 0 (0.0%) |
| 5 or more Children | 0 (0.0%) | 0 (0.0%) |
| Total | 0 (0.0%) | 27 (20.9%) |
Income Below Poverty Among Married-Couple vs Single-Parent Households in Williamson
The poverty data for Williamson shows that 17 of the married-couple family households (0.8%) and 27 of the single-parent households (20.6%) are living below the poverty level. Within the married-couple family households, those with no children have the highest poverty rate, with 17 households (0.9%) falling below the poverty line. Among the single-parent households, those with no children have the highest poverty rate, with 27 household (36.5%) living below poverty.
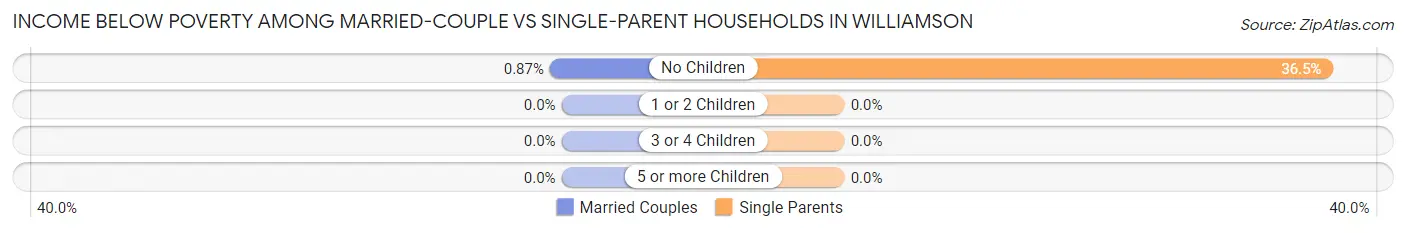
| Children | Married-Couple Families | Single-Parent Households |
| No Children | 17 (0.9%) | 27 (36.5%) |
| 1 or 2 Children | 0 (0.0%) | 0 (0.0%) |
| 3 or 4 Children | 0 (0.0%) | 0 (0.0%) |
| 5 or more Children | 0 (0.0%) | 0 (0.0%) |
| Total | 17 (0.8%) | 27 (20.6%) |
Race in Williamson
The most populous races in Williamson are White / Caucasian (5,681 | 94.7%), Two or more Races (216 | 3.6%), and Hispanic or Latino (209 | 3.5%).
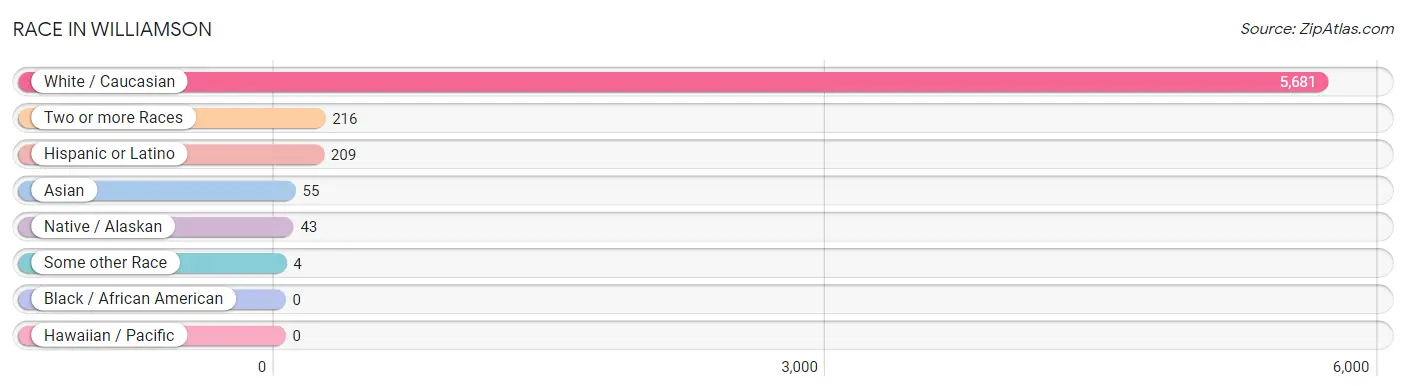
| Race | # Population | % Population |
| Asian | 55 | 0.9% |
| Black / African American | 0 | 0.0% |
| Hawaiian / Pacific | 0 | 0.0% |
| Hispanic or Latino | 209 | 3.5% |
| Native / Alaskan | 43 | 0.7% |
| White / Caucasian | 5,681 | 94.7% |
| Two or more Races | 216 | 3.6% |
| Some other Race | 4 | 0.1% |
| Total | 5,999 | 100.0% |
Ancestry in Williamson
The most populous ancestries reported in Williamson are English (1,522 | 25.4%), German (1,422 | 23.7%), Irish (882 | 14.7%), American (413 | 6.9%), and Italian (291 | 4.9%), together accounting for 75.5% of all Williamson residents.
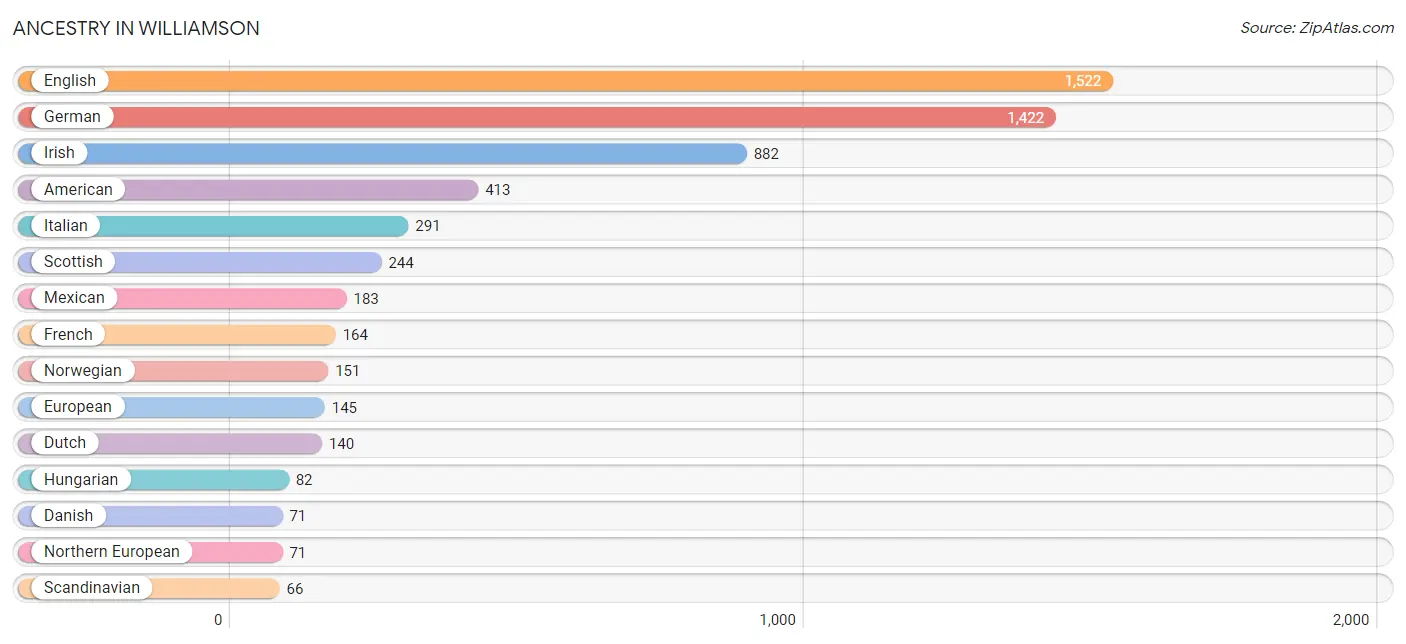
| Ancestry | # Population | % Population |
| Aleut | 8 | 0.1% |
| American | 413 | 6.9% |
| Austrian | 39 | 0.6% |
| Bhutanese | 12 | 0.2% |
| British | 52 | 0.9% |
| Burmese | 39 | 0.6% |
| Canadian | 22 | 0.4% |
| Croatian | 17 | 0.3% |
| Czech | 41 | 0.7% |
| Danish | 71 | 1.2% |
| Dutch | 140 | 2.3% |
| Eastern European | 3 | 0.1% |
| English | 1,522 | 25.4% |
| European | 145 | 2.4% |
| Finnish | 16 | 0.3% |
| French | 164 | 2.7% |
| French Canadian | 65 | 1.1% |
| German | 1,422 | 23.7% |
| Hungarian | 82 | 1.4% |
| Irish | 882 | 14.7% |
| Iroquois | 12 | 0.2% |
| Italian | 291 | 4.9% |
| Korean | 43 | 0.7% |
| Lithuanian | 12 | 0.2% |
| Mexican | 183 | 3.0% |
| Northern European | 71 | 1.2% |
| Norwegian | 151 | 2.5% |
| Polish | 65 | 1.1% |
| Portuguese | 8 | 0.1% |
| Russian | 59 | 1.0% |
| Scandinavian | 66 | 1.1% |
| Scotch-Irish | 53 | 0.9% |
| Scottish | 244 | 4.1% |
| Shoshone | 12 | 0.2% |
| Spaniard | 12 | 0.2% |
| Spanish | 14 | 0.2% |
| Swedish | 56 | 0.9% |
| Swiss | 41 | 0.7% |
| Thai | 17 | 0.3% |
| Ukrainian | 12 | 0.2% |
| Welsh | 23 | 0.4% |
| Yaqui | 23 | 0.4% | View All 42 Rows |
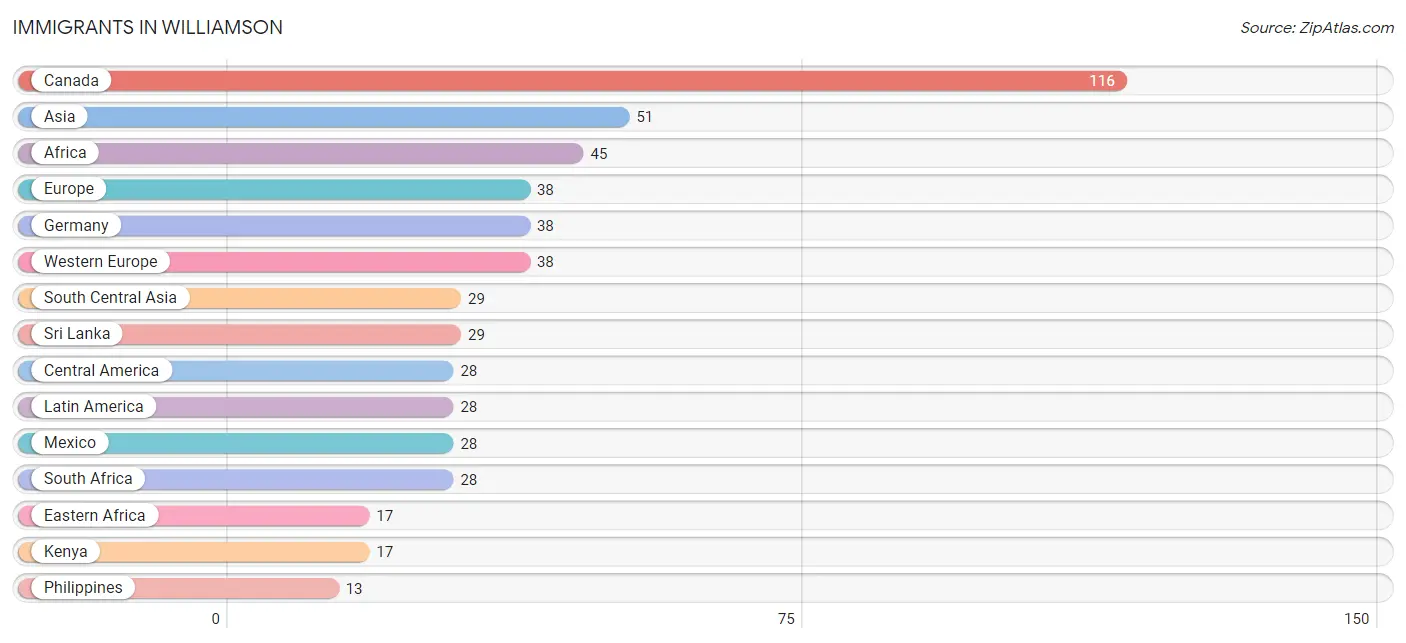
Immigrants in Williamson
The most numerous immigrant groups reported in Williamson came from Canada (116 | 1.9%), Asia (51 | 0.9%), Africa (45 | 0.7%), Europe (38 | 0.6%), and Germany (38 | 0.6%), together accounting for 4.8% of all Williamson residents.
| Immigration Origin | # Population | % Population |
| Africa | 45 | 0.7% |
| Asia | 51 | 0.9% |
| Canada | 116 | 1.9% |
| Central America | 28 | 0.5% |
| Eastern Africa | 17 | 0.3% |
| Eastern Asia | 9 | 0.2% |
| Europe | 38 | 0.6% |
| Germany | 38 | 0.6% |
| Kenya | 17 | 0.3% |
| Korea | 9 | 0.2% |
| Latin America | 28 | 0.5% |
| Mexico | 28 | 0.5% |
| Philippines | 13 | 0.2% |
| South Africa | 28 | 0.5% |
| South Central Asia | 29 | 0.5% |
| South Eastern Asia | 13 | 0.2% |
| Sri Lanka | 29 | 0.5% |
| Western Europe | 38 | 0.6% | View All 18 Rows |
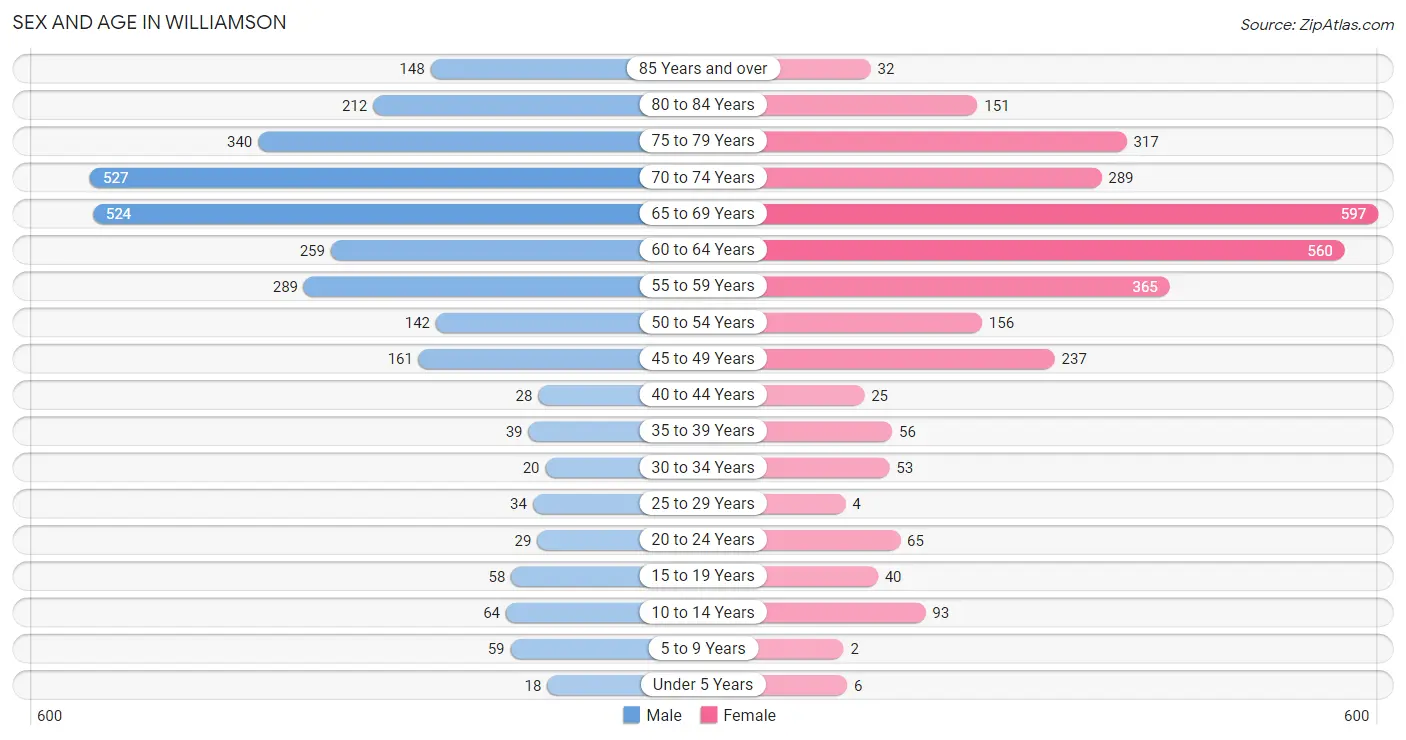
Sex and Age in Williamson
Sex and Age in Williamson
The most populous age groups in Williamson are 70 to 74 Years (527 | 17.9%) for men and 65 to 69 Years (597 | 19.6%) for women.
| Age Bracket | Male | Female |
| Under 5 Years | 18 (0.6%) | 6 (0.2%) |
| 5 to 9 Years | 59 (2.0%) | 2 (0.1%) |
| 10 to 14 Years | 64 (2.2%) | 93 (3.0%) |
| 15 to 19 Years | 58 (2.0%) | 40 (1.3%) |
| 20 to 24 Years | 29 (1.0%) | 65 (2.1%) |
| 25 to 29 Years | 34 (1.1%) | 4 (0.1%) |
| 30 to 34 Years | 20 (0.7%) | 53 (1.7%) |
| 35 to 39 Years | 39 (1.3%) | 56 (1.8%) |
| 40 to 44 Years | 28 (0.9%) | 25 (0.8%) |
| 45 to 49 Years | 161 (5.5%) | 237 (7.8%) |
| 50 to 54 Years | 142 (4.8%) | 156 (5.1%) |
| 55 to 59 Years | 289 (9.8%) | 365 (12.0%) |
| 60 to 64 Years | 259 (8.8%) | 560 (18.4%) |
| 65 to 69 Years | 524 (17.8%) | 597 (19.6%) |
| 70 to 74 Years | 527 (17.9%) | 289 (9.5%) |
| 75 to 79 Years | 340 (11.5%) | 317 (10.4%) |
| 80 to 84 Years | 212 (7.2%) | 151 (5.0%) |
| 85 Years and over | 148 (5.0%) | 32 (1.1%) |
| Total | 2,951 (100.0%) | 3,048 (100.0%) |
Families and Households in Williamson
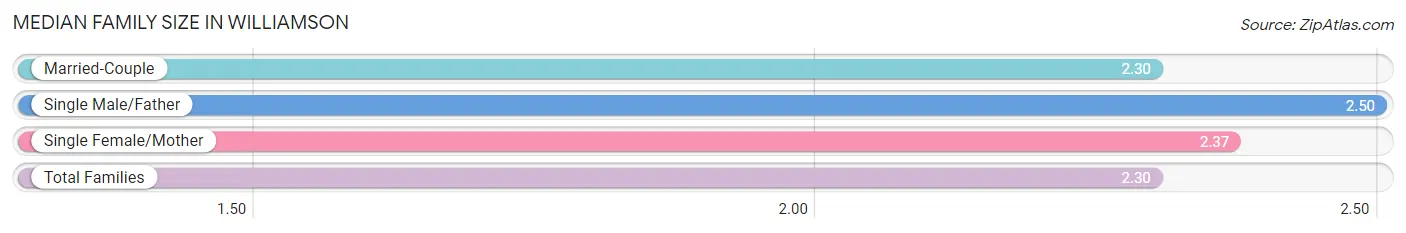
Median Family Size in Williamson
The median family size in Williamson is 2.30 persons per family, with single male/father families (2 | 0.1%) accounting for the largest median family size of 2.5 persons per family. On the other hand, married-couple families (2,101 | 94.1%) represent the smallest median family size with 2.30 persons per family.
| Family Type | # Families | Family Size |
| Married-Couple | 2,101 (94.1%) | 2.30 |
| Single Male/Father | 2 (0.1%) | 2.50 |
| Single Female/Mother | 129 (5.8%) | 2.37 |
| Total Families | 2,232 (100.0%) | 2.30 |
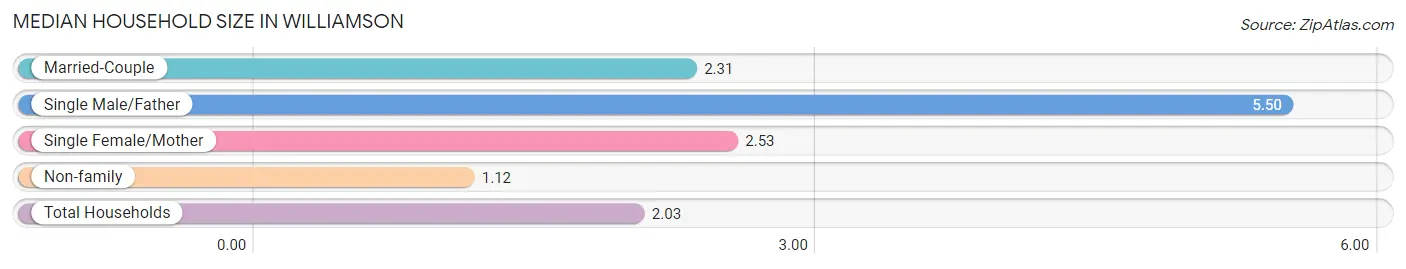
Median Household Size in Williamson
The median household size in Williamson is 2.03 persons per household, with single male/father households (2 | 0.1%) accounting for the largest median household size of 5.5 persons per household. non-family households (726 | 24.5%) represent the smallest median household size with 1.12 persons per household.
| Household Type | # Households | Household Size |
| Married-Couple | 2,101 (71.0%) | 2.31 |
| Single Male/Father | 2 (0.1%) | 5.50 |
| Single Female/Mother | 129 (4.4%) | 2.53 |
| Non-family | 726 (24.5%) | 1.12 |
| Total Households | 2,958 (100.0%) | 2.03 |
Household Size by Marriage Status in Williamson
Out of a total of 2,958 households in Williamson, 2,232 (75.5%) are family households, while 726 (24.5%) are nonfamily households. The most numerous type of family households are 2-person households, comprising 1,829, and the most common type of nonfamily households are 1-person households, comprising 641.
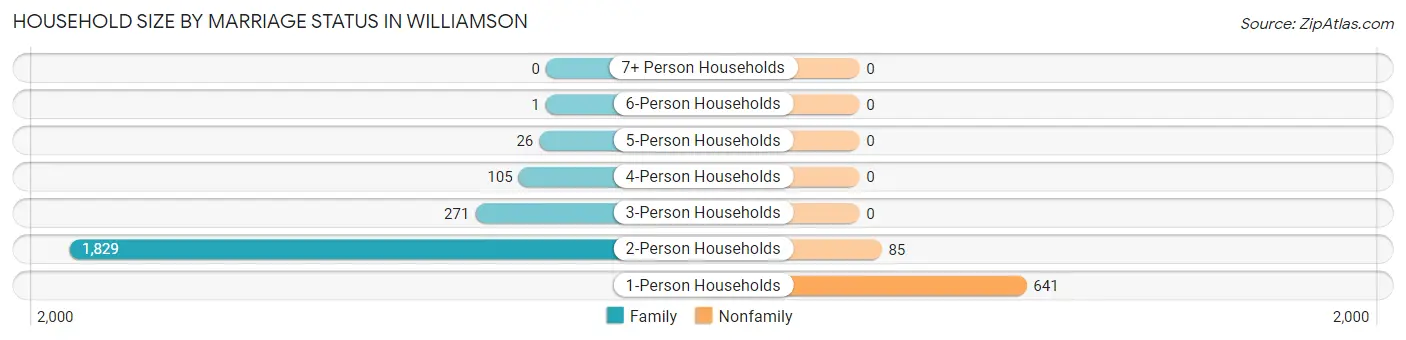
| Household Size | Family Households | Nonfamily Households |
| 1-Person Households | - | 641 (21.7%) |
| 2-Person Households | 1,829 (61.8%) | 85 (2.9%) |
| 3-Person Households | 271 (9.2%) | 0 (0.0%) |
| 4-Person Households | 105 (3.5%) | 0 (0.0%) |
| 5-Person Households | 26 (0.9%) | 0 (0.0%) |
| 6-Person Households | 1 (0.0%) | 0 (0.0%) |
| 7+ Person Households | 0 (0.0%) | 0 (0.0%) |
| Total | 2,232 (75.5%) | 726 (24.5%) |
Female Fertility in Williamson
Fertility by Age in Williamson
Average fertility rate in Williamson is 2.0 births per 1,000 women. Women in the age bracket of 35 to 50 years have the highest fertility rate with 3.0 births per 1,000 women. Women in the age bracket of 35 to 50 years acount for 100.0% of all women with births.
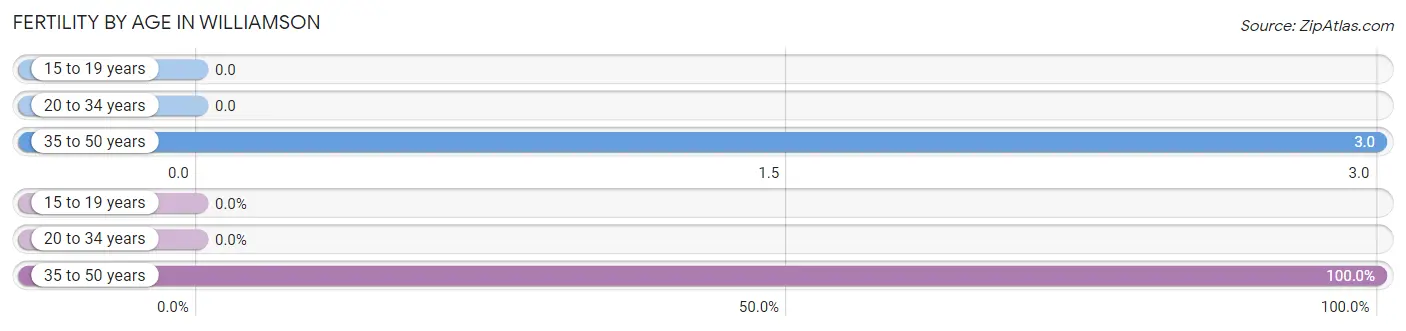
| Age Bracket | Women with Births | Births / 1,000 Women |
| 15 to 19 years | 0 (0.0%) | 0.0 |
| 20 to 34 years | 0 (0.0%) | 0.0 |
| 35 to 50 years | 1 (100.0%) | 3.0 |
| Total | 1 (100.0%) | 2.0 |
Fertility by Age by Marriage Status in Williamson
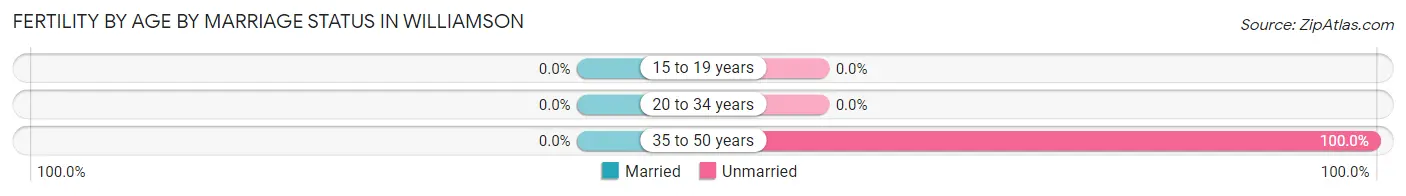
| Age Bracket | Married | Unmarried |
| 15 to 19 years | 0 (0.0%) | 0 (0.0%) |
| 20 to 34 years | 0 (0.0%) | 0 (0.0%) |
| 35 to 50 years | 0 (0.0%) | 1 (100.0%) |
| Total | 0 (0.0%) | 1 (100.0%) |
Fertility by Education in Williamson
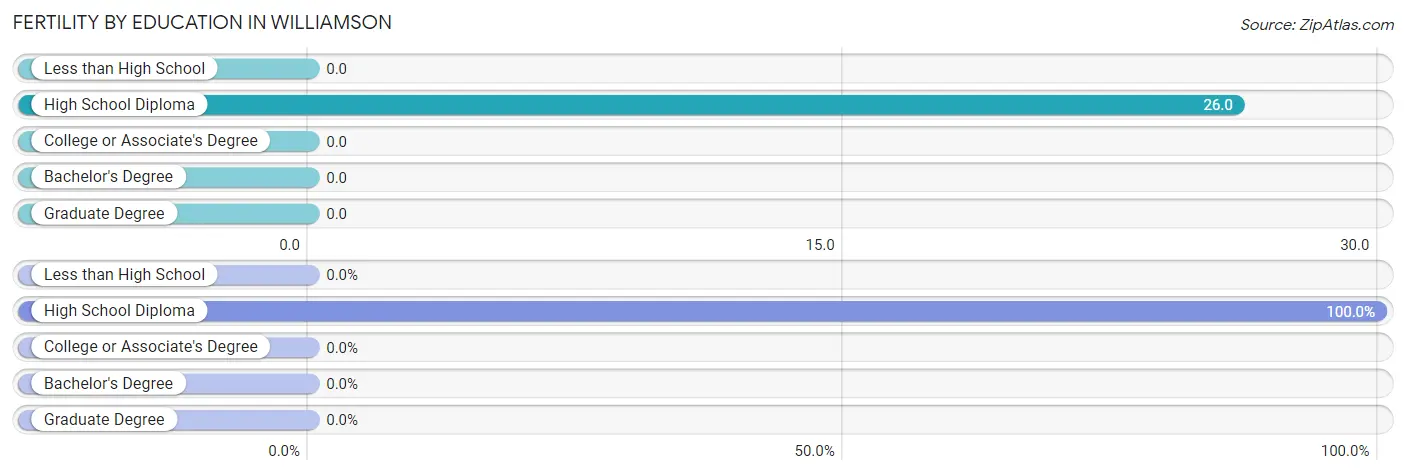
| Educational Attainment | Women with Births | Births / 1,000 Women |
| Less than High School | 0 (0.0%) | 0.0 |
| High School Diploma | 1 (100.0%) | 26.0 |
| College or Associate's Degree | 0 (0.0%) | 0.0 |
| Bachelor's Degree | 0 (0.0%) | 0.0 |
| Graduate Degree | 0 (0.0%) | 0.0 |
| Total | 1 (100.0%) | 2.0 |
Fertility by Education by Marriage Status in Williamson
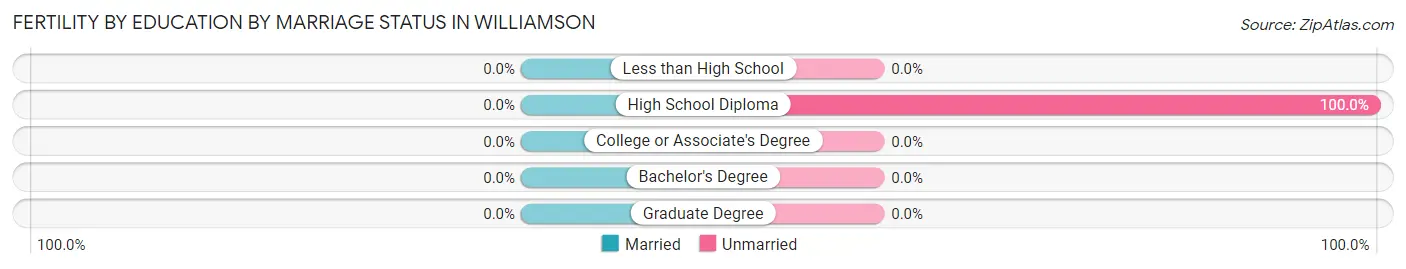
| Educational Attainment | Married | Unmarried |
| Less than High School | 0 (0.0%) | 0 (0.0%) |
| High School Diploma | 0 (0.0%) | 1 (100.0%) |
| College or Associate's Degree | 0 (0.0%) | 0 (0.0%) |
| Bachelor's Degree | 0 (0.0%) | 0 (0.0%) |
| Graduate Degree | 0 (0.0%) | 0 (0.0%) |
| Total | 0 (0.0%) | 1 (100.0%) |
Employment Characteristics in Williamson
Employment by Class of Employer in Williamson
Among the 1,790 employed individuals in Williamson, private company employees (1,033 | 57.7%), not-for-profit organizations (209 | 11.7%), and self-employed (incorporated) (125 | 7.0%) make up the most common classes of employment.
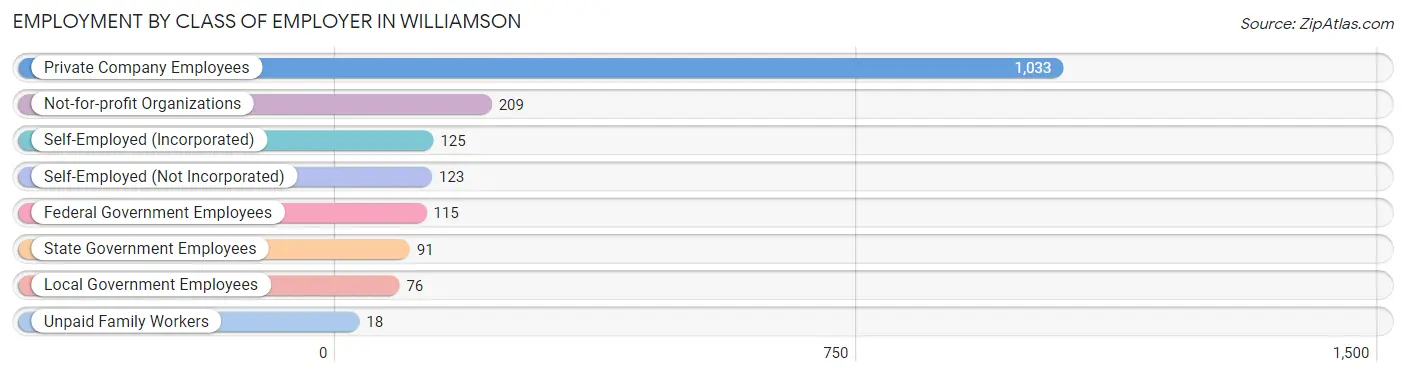
| Employer Class | # Employees | % Employees |
| Private Company Employees | 1,033 | 57.7% |
| Self-Employed (Incorporated) | 125 | 7.0% |
| Self-Employed (Not Incorporated) | 123 | 6.9% |
| Not-for-profit Organizations | 209 | 11.7% |
| Local Government Employees | 76 | 4.3% |
| State Government Employees | 91 | 5.1% |
| Federal Government Employees | 115 | 6.4% |
| Unpaid Family Workers | 18 | 1.0% |
| Total | 1,790 | 100.0% |
Employment Status by Age in Williamson
According to the labor force statistics for Williamson, out of the total population over 16 years of age (5,755), 32.8% or 1,888 individuals are in the labor force, with 1.9% or 36 of them unemployed. The age group with the highest labor force participation rate is 20 to 24 years, with 100.0% or 94 individuals in the labor force. Within the labor force, the 60 to 64 years age range has the highest percentage of unemployed individuals, with 6.7% or 14 of them being unemployed.
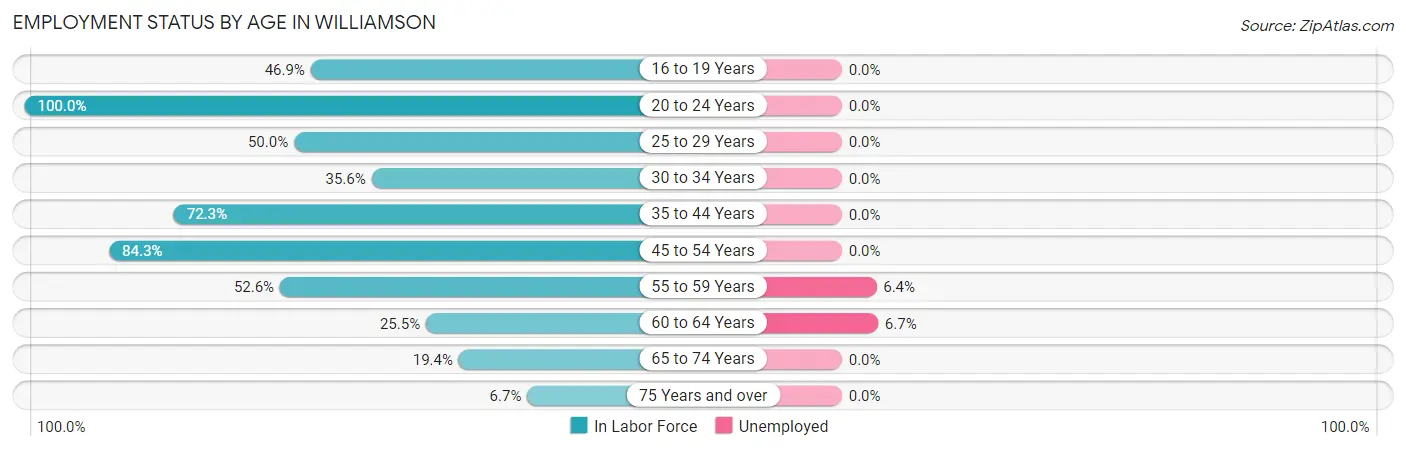
| Age Bracket | In Labor Force | Unemployed |
| 16 to 19 Years | 45 (46.9%) | 0 (0.0%) |
| 20 to 24 Years | 94 (100.0%) | 0 (0.0%) |
| 25 to 29 Years | 19 (50.0%) | 0 (0.0%) |
| 30 to 34 Years | 26 (35.6%) | 0 (0.0%) |
| 35 to 44 Years | 107 (72.3%) | 0 (0.0%) |
| 45 to 54 Years | 587 (84.3%) | 0 (0.0%) |
| 55 to 59 Years | 344 (52.6%) | 22 (6.4%) |
| 60 to 64 Years | 209 (25.5%) | 14 (6.7%) |
| 65 to 74 Years | 376 (19.4%) | 0 (0.0%) |
| 75 Years and over | 80 (6.7%) | 0 (0.0%) |
| Total | 1,888 (32.8%) | 36 (1.9%) |
Employment Status by Educational Attainment in Williamson
According to labor force statistics for Williamson, 53.2% of individuals (1,292) out of the total population between 25 and 64 years of age (2,428) are in the labor force, with 2.8% or 36 of them being unemployed. The group with the highest labor force participation rate are those with the educational attainment of college / associate degree, with 55.2% or 545 individuals in the labor force. Within the labor force, individuals with bachelor's degree or higher education have the highest percentage of unemployment, with 4.2% or 22 of them being unemployed.
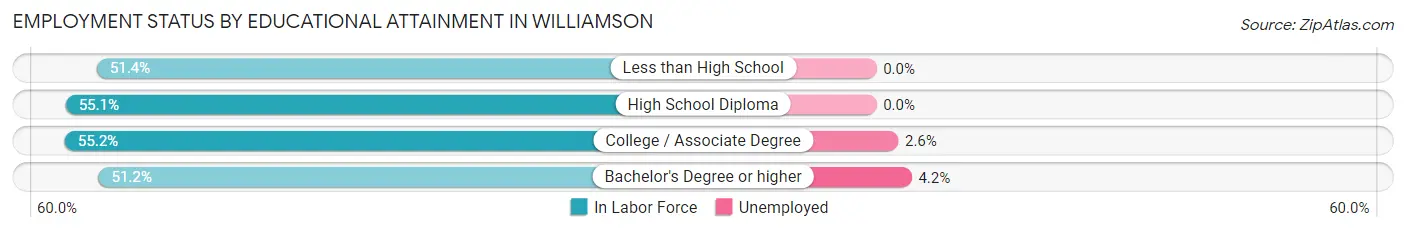
| Educational Attainment | In Labor Force | Unemployed |
| Less than High School | 95 (51.4%) | 0 (0.0%) |
| High School Diploma | 130 (55.1%) | 0 (0.0%) |
| College / Associate Degree | 545 (55.2%) | 26 (2.6%) |
| Bachelor's Degree or higher | 522 (51.2%) | 43 (4.2%) |
| Total | 1,292 (53.2%) | 68 (2.8%) |
Employment Occupations by Sex in Williamson
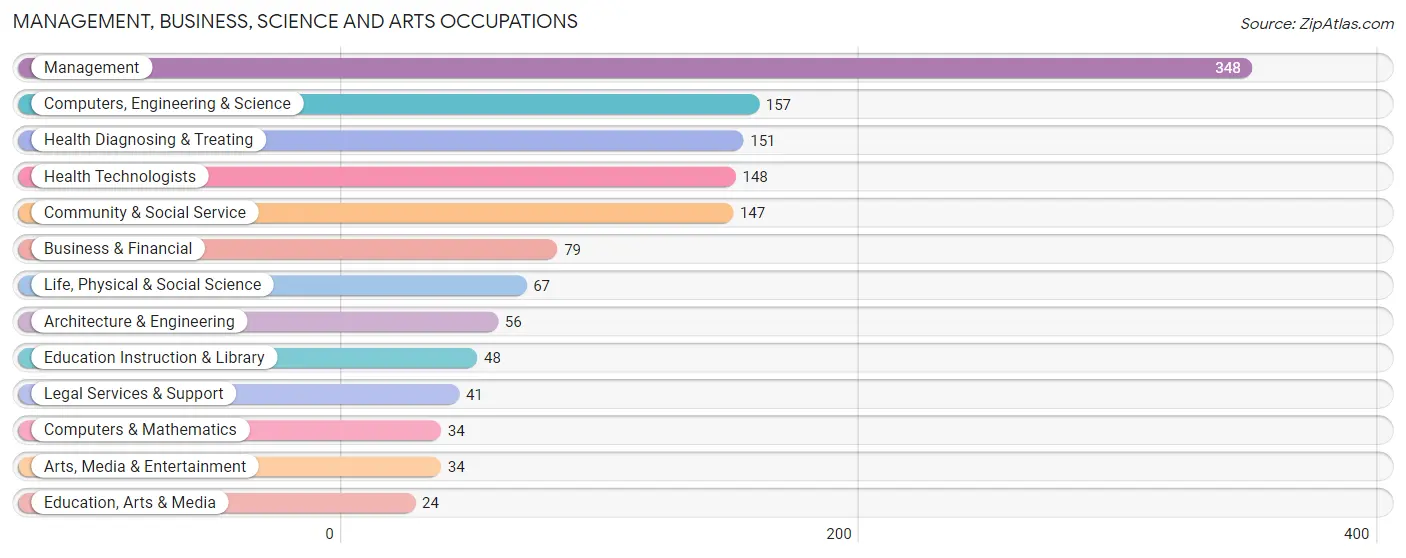
Management, Business, Science and Arts Occupations
The most common Management, Business, Science and Arts occupations in Williamson are Management (348 | 18.8%), Computers, Engineering & Science (157 | 8.5%), Health Diagnosing & Treating (151 | 8.2%), Health Technologists (148 | 8.0%), and Community & Social Service (147 | 7.9%).
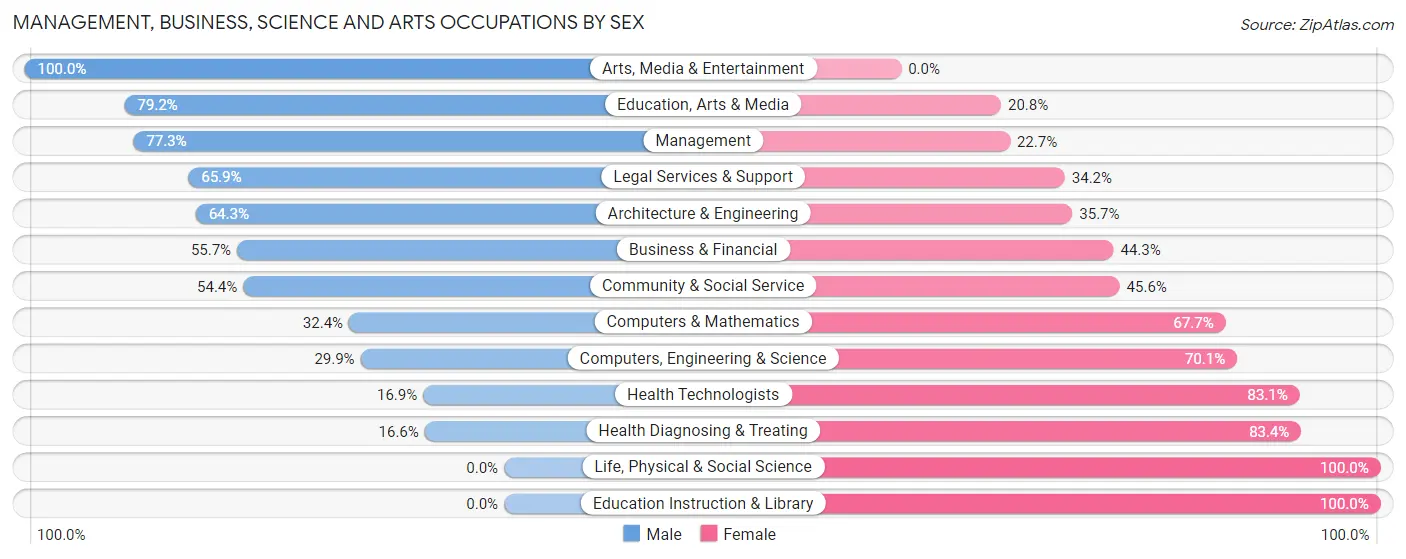
Management, Business, Science and Arts Occupations by Sex
Within the Management, Business, Science and Arts occupations in Williamson, the most male-oriented occupations are Arts, Media & Entertainment (100.0%), Education, Arts & Media (79.2%), and Management (77.3%), while the most female-oriented occupations are Life, Physical & Social Science (100.0%), Education Instruction & Library (100.0%), and Health Diagnosing & Treating (83.4%).
| Occupation | Male | Female |
| Management | 269 (77.3%) | 79 (22.7%) |
| Business & Financial | 44 (55.7%) | 35 (44.3%) |
| Computers, Engineering & Science | 47 (29.9%) | 110 (70.1%) |
| Computers & Mathematics | 11 (32.4%) | 23 (67.6%) |
| Architecture & Engineering | 36 (64.3%) | 20 (35.7%) |
| Life, Physical & Social Science | 0 (0.0%) | 67 (100.0%) |
| Community & Social Service | 80 (54.4%) | 67 (45.6%) |
| Education, Arts & Media | 19 (79.2%) | 5 (20.8%) |
| Legal Services & Support | 27 (65.8%) | 14 (34.2%) |
| Education Instruction & Library | 0 (0.0%) | 48 (100.0%) |
| Arts, Media & Entertainment | 34 (100.0%) | 0 (0.0%) |
| Health Diagnosing & Treating | 25 (16.6%) | 126 (83.4%) |
| Health Technologists | 25 (16.9%) | 123 (83.1%) |
| Total (Category) | 465 (52.7%) | 417 (47.3%) |
| Total (Overall) | 856 (46.3%) | 995 (53.7%) |
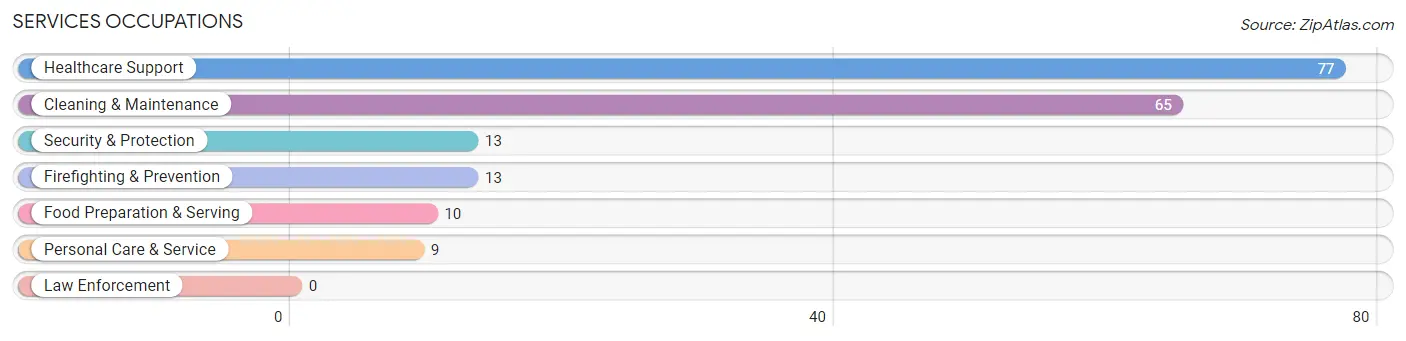
Services Occupations
The most common Services occupations in Williamson are Healthcare Support (77 | 4.2%), Cleaning & Maintenance (65 | 3.5%), Security & Protection (13 | 0.7%), Firefighting & Prevention (13 | 0.7%), and Food Preparation & Serving (10 | 0.5%).
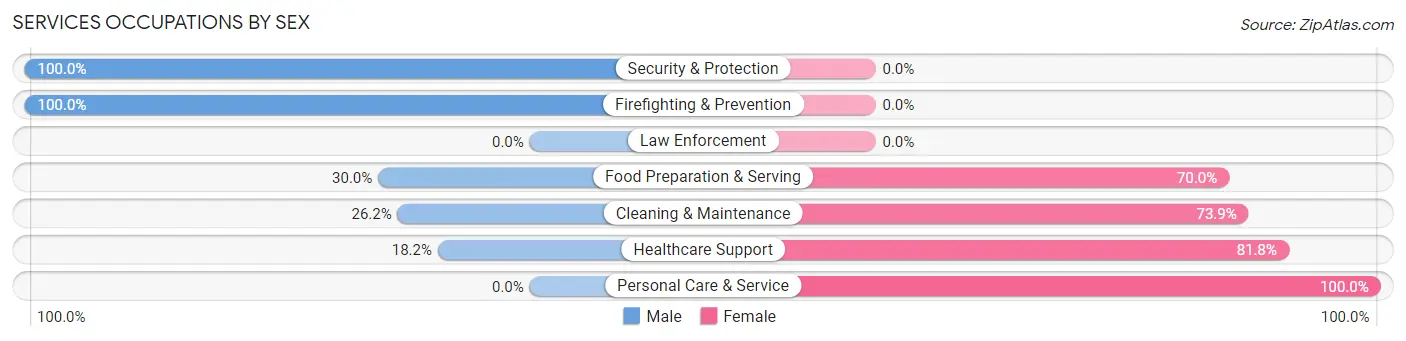
Services Occupations by Sex
Within the Services occupations in Williamson, the most male-oriented occupations are Security & Protection (100.0%), Firefighting & Prevention (100.0%), and Food Preparation & Serving (30.0%), while the most female-oriented occupations are Personal Care & Service (100.0%), Healthcare Support (81.8%), and Cleaning & Maintenance (73.9%).
| Occupation | Male | Female |
| Healthcare Support | 14 (18.2%) | 63 (81.8%) |
| Security & Protection | 13 (100.0%) | 0 (0.0%) |
| Firefighting & Prevention | 13 (100.0%) | 0 (0.0%) |
| Law Enforcement | 0 (0.0%) | 0 (0.0%) |
| Food Preparation & Serving | 3 (30.0%) | 7 (70.0%) |
| Cleaning & Maintenance | 17 (26.2%) | 48 (73.9%) |
| Personal Care & Service | 0 (0.0%) | 9 (100.0%) |
| Total (Category) | 47 (27.0%) | 127 (73.0%) |
| Total (Overall) | 856 (46.3%) | 995 (53.7%) |
Sales and Office Occupations
The most common Sales and Office occupations in Williamson are Office & Administration (263 | 14.2%), and Sales & Related (231 | 12.5%).
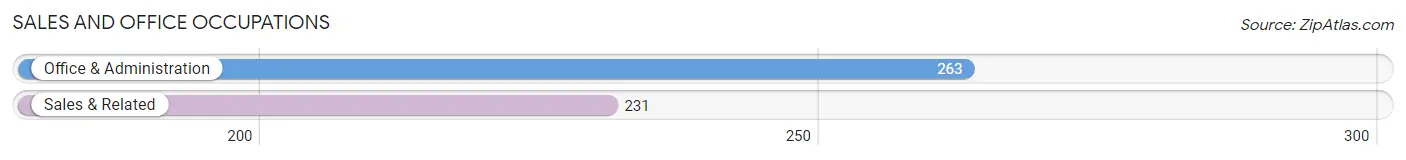
Sales and Office Occupations by Sex
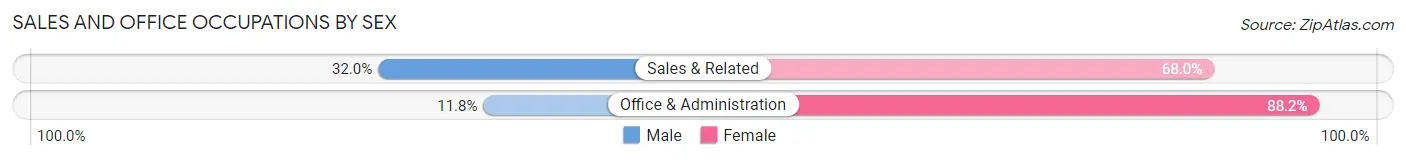
| Occupation | Male | Female |
| Sales & Related | 74 (32.0%) | 157 (68.0%) |
| Office & Administration | 31 (11.8%) | 232 (88.2%) |
| Total (Category) | 105 (21.3%) | 389 (78.7%) |
| Total (Overall) | 856 (46.3%) | 995 (53.7%) |
Natural Resources, Construction and Maintenance Occupations
The most common Natural Resources, Construction and Maintenance occupations in Williamson are Construction & Extraction (120 | 6.5%), and Installation, Maintenance & Repair (67 | 3.6%).
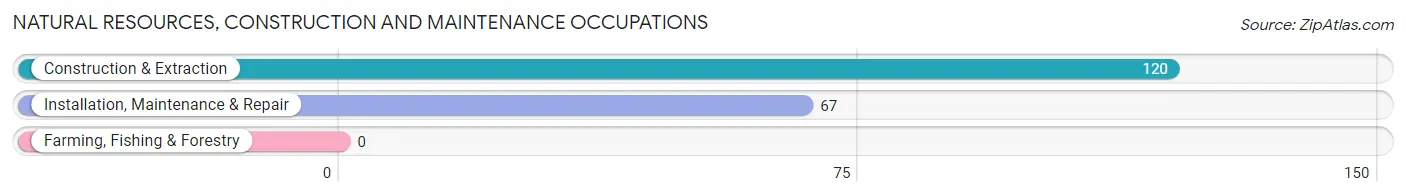
Natural Resources, Construction and Maintenance Occupations by Sex
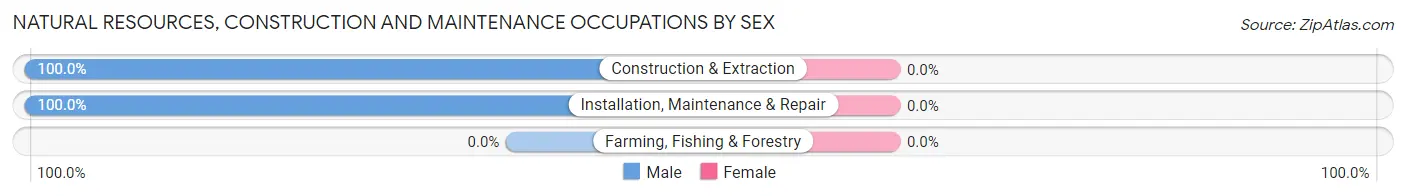
| Occupation | Male | Female |
| Farming, Fishing & Forestry | 0 (0.0%) | 0 (0.0%) |
| Construction & Extraction | 120 (100.0%) | 0 (0.0%) |
| Installation, Maintenance & Repair | 67 (100.0%) | 0 (0.0%) |
| Total (Category) | 187 (100.0%) | 0 (0.0%) |
| Total (Overall) | 856 (46.3%) | 995 (53.7%) |
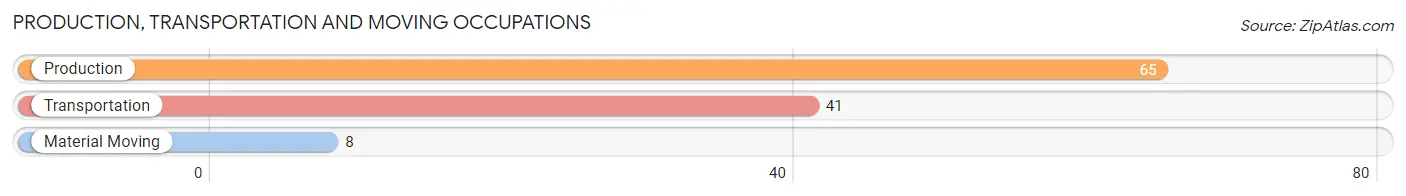
Production, Transportation and Moving Occupations
The most common Production, Transportation and Moving occupations in Williamson are Production (65 | 3.5%), Transportation (41 | 2.2%), and Material Moving (8 | 0.4%).
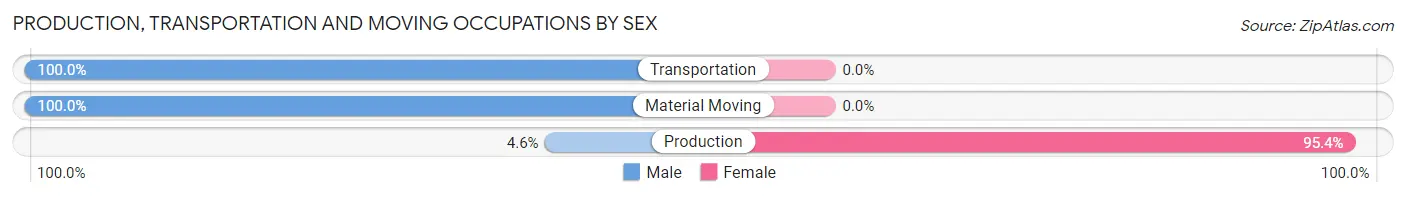
Production, Transportation and Moving Occupations by Sex
| Occupation | Male | Female |
| Production | 3 (4.6%) | 62 (95.4%) |
| Transportation | 41 (100.0%) | 0 (0.0%) |
| Material Moving | 8 (100.0%) | 0 (0.0%) |
| Total (Category) | 52 (45.6%) | 62 (54.4%) |
| Total (Overall) | 856 (46.3%) | 995 (53.7%) |
Employment Industries by Sex in Williamson
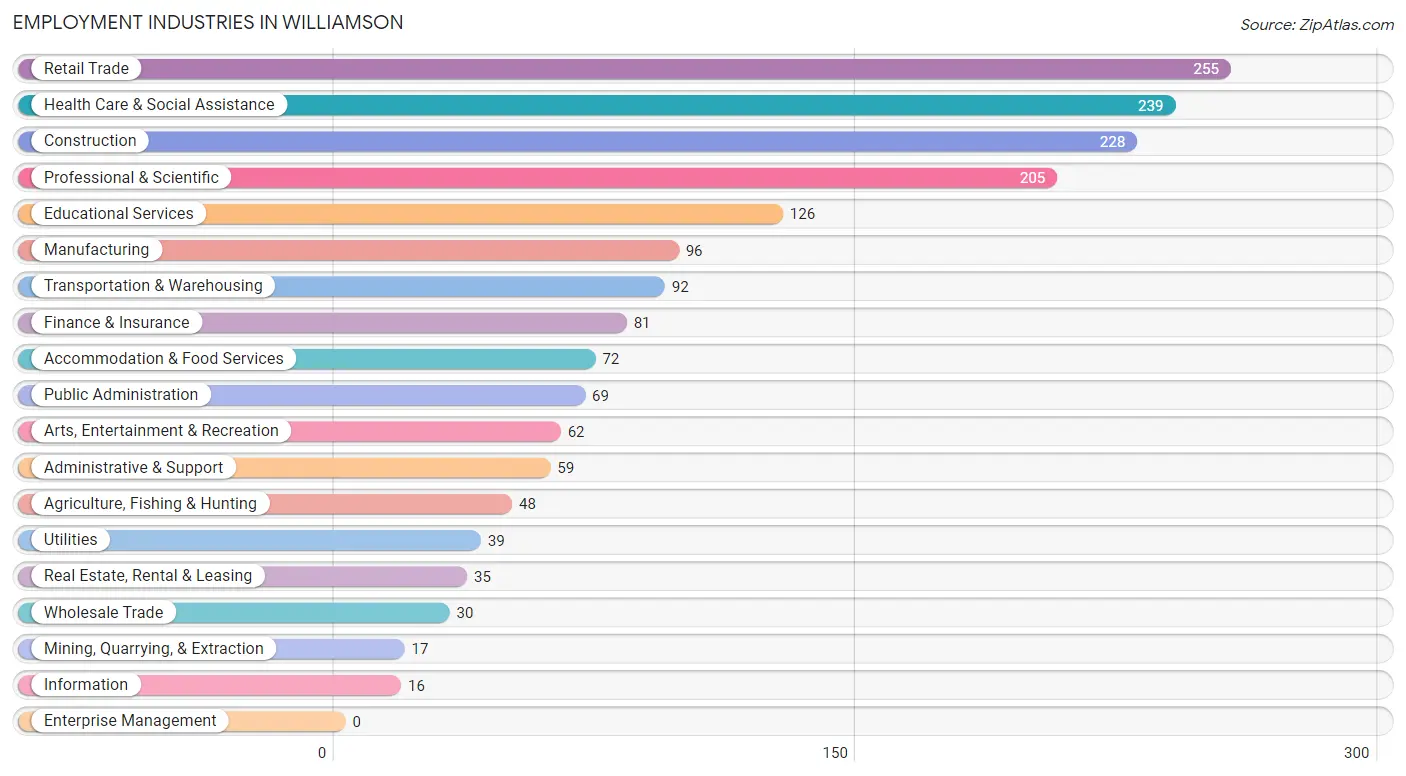
Employment Industries in Williamson
The major employment industries in Williamson include Retail Trade (255 | 13.8%), Health Care & Social Assistance (239 | 12.9%), Construction (228 | 12.3%), Professional & Scientific (205 | 11.1%), and Educational Services (126 | 6.8%).
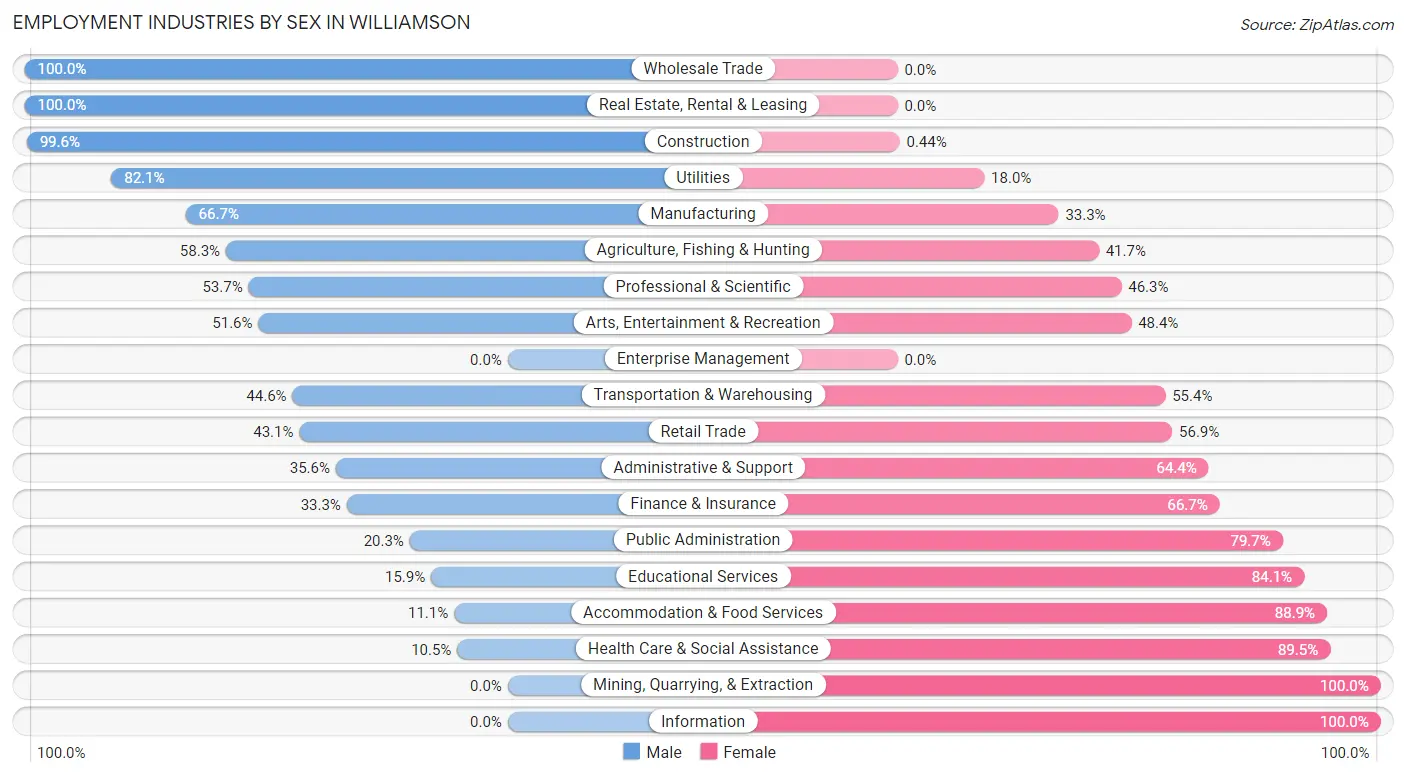
Employment Industries by Sex in Williamson
The Williamson industries that see more men than women are Wholesale Trade (100.0%), Real Estate, Rental & Leasing (100.0%), and Construction (99.6%), whereas the industries that tend to have a higher number of women are Mining, Quarrying, & Extraction (100.0%), Information (100.0%), and Health Care & Social Assistance (89.5%).
| Industry | Male | Female |
| Agriculture, Fishing & Hunting | 28 (58.3%) | 20 (41.7%) |
| Mining, Quarrying, & Extraction | 0 (0.0%) | 17 (100.0%) |
| Construction | 227 (99.6%) | 1 (0.4%) |
| Manufacturing | 64 (66.7%) | 32 (33.3%) |
| Wholesale Trade | 30 (100.0%) | 0 (0.0%) |
| Retail Trade | 110 (43.1%) | 145 (56.9%) |
| Transportation & Warehousing | 41 (44.6%) | 51 (55.4%) |
| Utilities | 32 (82.1%) | 7 (17.9%) |
| Information | 0 (0.0%) | 16 (100.0%) |
| Finance & Insurance | 27 (33.3%) | 54 (66.7%) |
| Real Estate, Rental & Leasing | 35 (100.0%) | 0 (0.0%) |
| Professional & Scientific | 110 (53.7%) | 95 (46.3%) |
| Enterprise Management | 0 (0.0%) | 0 (0.0%) |
| Administrative & Support | 21 (35.6%) | 38 (64.4%) |
| Educational Services | 20 (15.9%) | 106 (84.1%) |
| Health Care & Social Assistance | 25 (10.5%) | 214 (89.5%) |
| Arts, Entertainment & Recreation | 32 (51.6%) | 30 (48.4%) |
| Accommodation & Food Services | 8 (11.1%) | 64 (88.9%) |
| Public Administration | 14 (20.3%) | 55 (79.7%) |
| Total | 856 (46.3%) | 995 (53.7%) |
Education in Williamson
School Enrollment in Williamson
The most common levels of schooling among the 527 students in Williamson are college / undergraduate (184 | 34.9%), middle school (129 | 24.5%), and high school (90 | 17.1%).
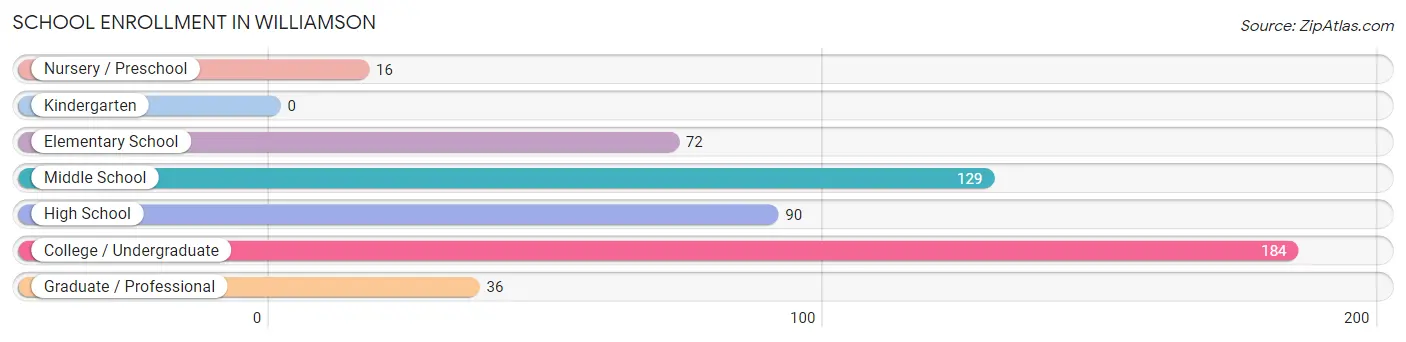
| School Level | # Students | % Students |
| Nursery / Preschool | 16 | 3.0% |
| Kindergarten | 0 | 0.0% |
| Elementary School | 72 | 13.7% |
| Middle School | 129 | 24.5% |
| High School | 90 | 17.1% |
| College / Undergraduate | 184 | 34.9% |
| Graduate / Professional | 36 | 6.8% |
| Total | 527 | 100.0% |
School Enrollment by Age by Funding Source in Williamson
Out of a total of 527 students who are enrolled in schools in Williamson, 73 (13.9%) attend a private institution, while the remaining 454 (86.1%) are enrolled in public schools. The age group of 25 to 34 year olds has the highest likelihood of being enrolled in private schools, with 20 (100.0% in the age bracket) enrolled. Conversely, the age group of 15 to 17 year olds has the lowest likelihood of being enrolled in a private school, with 58 (100.0% in the age bracket) attending a public institution.
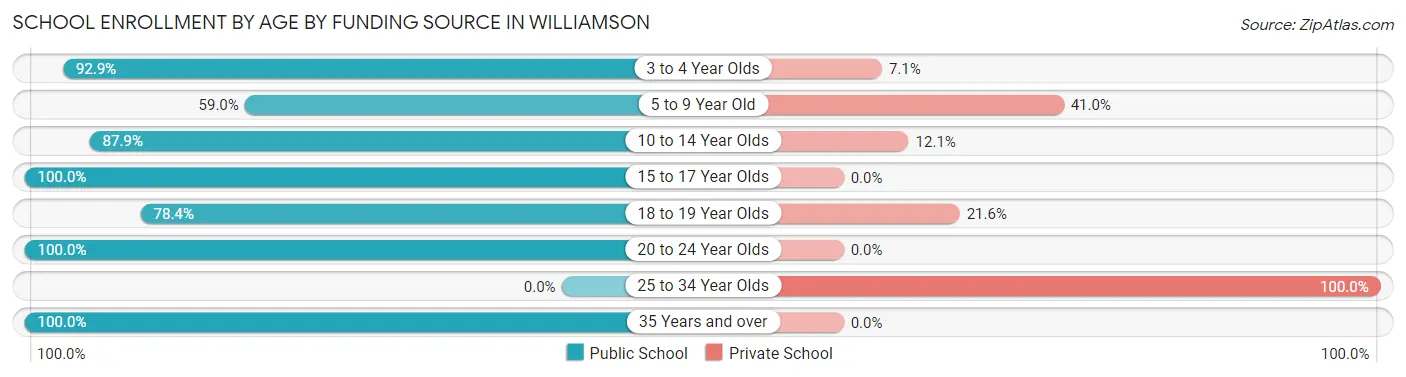
| Age Bracket | Public School | Private School |
| 3 to 4 Year Olds | 13 (92.9%) | 1 (7.1%) |
| 5 to 9 Year Old | 36 (59.0%) | 25 (41.0%) |
| 10 to 14 Year Olds | 138 (87.9%) | 19 (12.1%) |
| 15 to 17 Year Olds | 58 (100.0%) | 0 (0.0%) |
| 18 to 19 Year Olds | 29 (78.4%) | 8 (21.6%) |
| 20 to 24 Year Olds | 62 (100.0%) | 0 (0.0%) |
| 25 to 34 Year Olds | 0 (0.0%) | 20 (100.0%) |
| 35 Years and over | 118 (100.0%) | 0 (0.0%) |
| Total | 454 (86.1%) | 73 (13.9%) |
Educational Attainment by Field of Study in Williamson
Business (452 | 16.3%), education (449 | 16.2%), science & technology (319 | 11.5%), engineering (274 | 9.9%), and literature & languages (271 | 9.8%) are the most common fields of study among 2,768 individuals in Williamson who have obtained a bachelor's degree or higher.
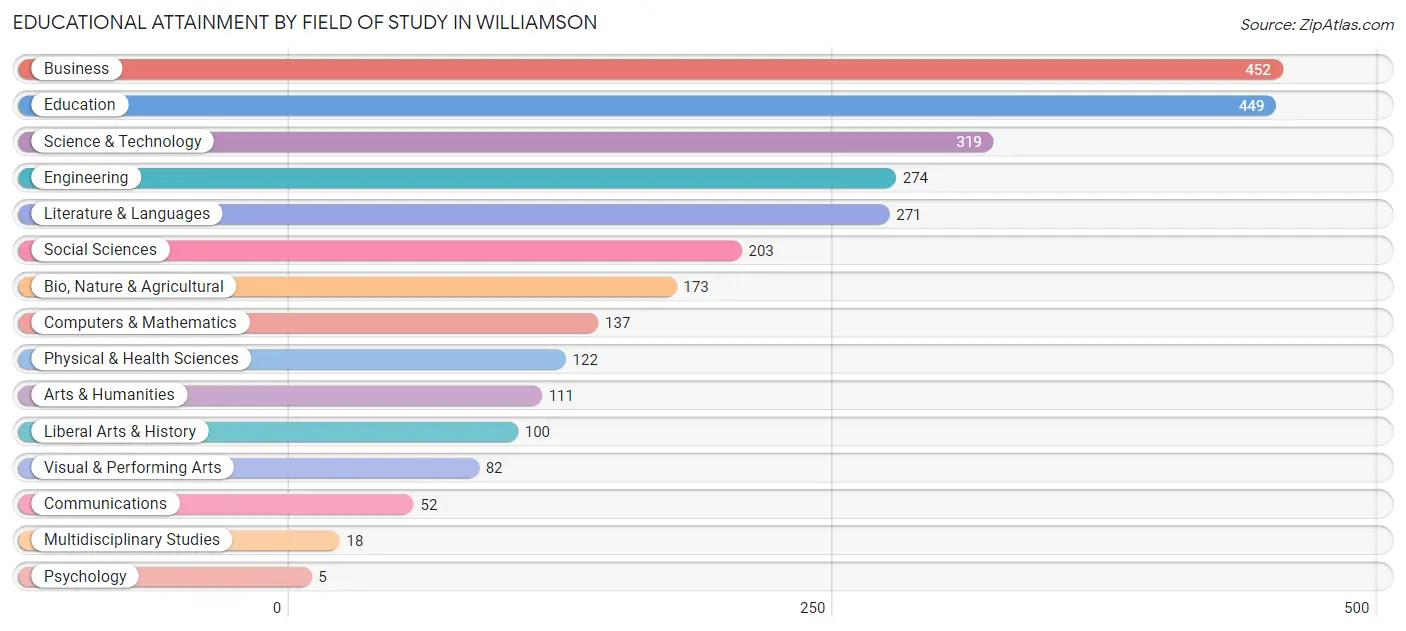
| Field of Study | # Graduates | % Graduates |
| Computers & Mathematics | 137 | 5.0% |
| Bio, Nature & Agricultural | 173 | 6.2% |
| Physical & Health Sciences | 122 | 4.4% |
| Psychology | 5 | 0.2% |
| Social Sciences | 203 | 7.3% |
| Engineering | 274 | 9.9% |
| Multidisciplinary Studies | 18 | 0.6% |
| Science & Technology | 319 | 11.5% |
| Business | 452 | 16.3% |
| Education | 449 | 16.2% |
| Literature & Languages | 271 | 9.8% |
| Liberal Arts & History | 100 | 3.6% |
| Visual & Performing Arts | 82 | 3.0% |
| Communications | 52 | 1.9% |
| Arts & Humanities | 111 | 4.0% |
| Total | 2,768 | 100.0% |
Transportation & Commute in Williamson
Vehicle Availability by Sex in Williamson
The most prevalent vehicle ownership categories in Williamson are males with 3 vehicles (313, accounting for 39.4%) and females with 3 vehicles (379, making up 31.5%).
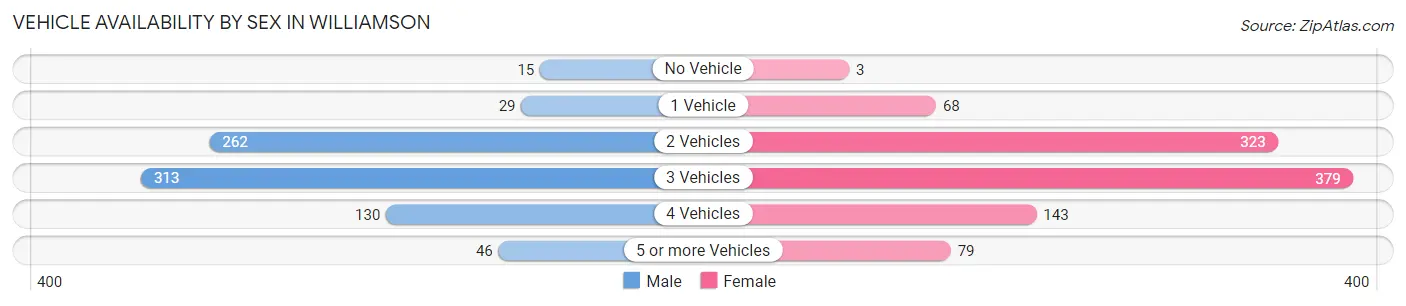
| Vehicles Available | Male | Female |
| No Vehicle | 15 (1.9%) | 3 (0.3%) |
| 1 Vehicle | 29 (3.6%) | 68 (6.8%) |
| 2 Vehicles | 262 (33.0%) | 323 (32.5%) |
| 3 Vehicles | 313 (39.4%) | 379 (38.1%) |
| 4 Vehicles | 130 (16.4%) | 143 (14.4%) |
| 5 or more Vehicles | 46 (5.8%) | 79 (7.9%) |
| Total | 795 (100.0%) | 995 (100.0%) |
Commute Time in Williamson
The most frequently occuring commute durations in Williamson are 30 to 34 minutes (315 commuters, 23.0%), 25 to 29 minutes (260 commuters, 19.0%), and 20 to 24 minutes (247 commuters, 18.0%).
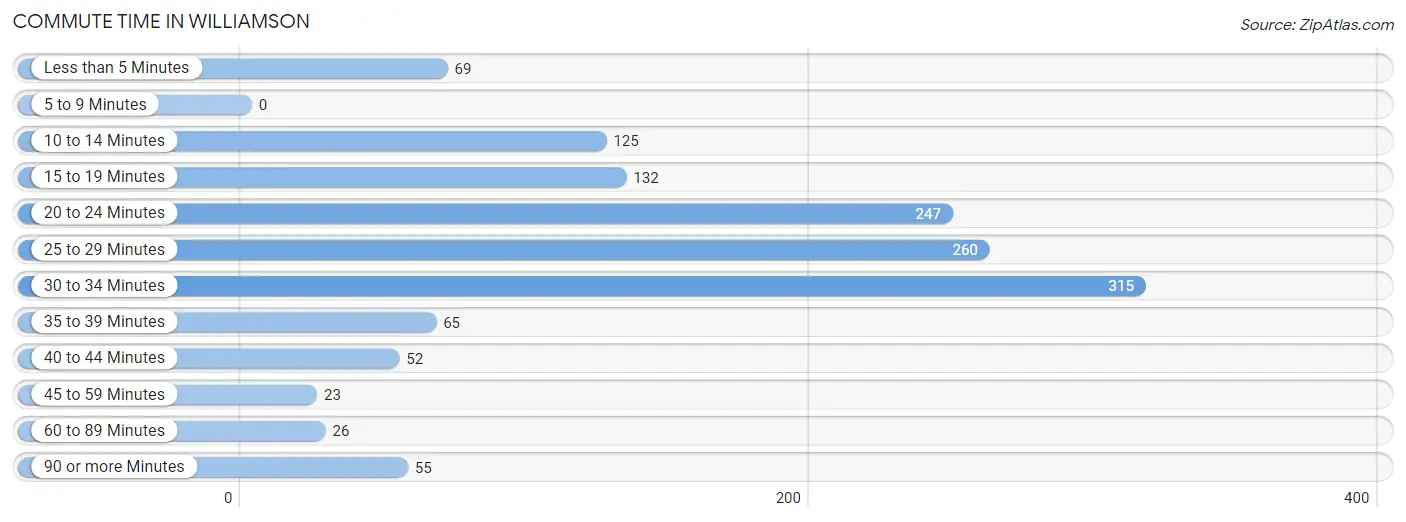
| Commute Time | # Commuters | % Commuters |
| Less than 5 Minutes | 69 | 5.0% |
| 5 to 9 Minutes | 0 | 0.0% |
| 10 to 14 Minutes | 125 | 9.1% |
| 15 to 19 Minutes | 132 | 9.6% |
| 20 to 24 Minutes | 247 | 18.0% |
| 25 to 29 Minutes | 260 | 19.0% |
| 30 to 34 Minutes | 315 | 23.0% |
| 35 to 39 Minutes | 65 | 4.8% |
| 40 to 44 Minutes | 52 | 3.8% |
| 45 to 59 Minutes | 23 | 1.7% |
| 60 to 89 Minutes | 26 | 1.9% |
| 90 or more Minutes | 55 | 4.0% |
Commute Time by Sex in Williamson
The most common commute times in Williamson are 30 to 34 minutes (201 commuters, 36.8%) for males and 20 to 24 minutes (236 commuters, 28.7%) for females.
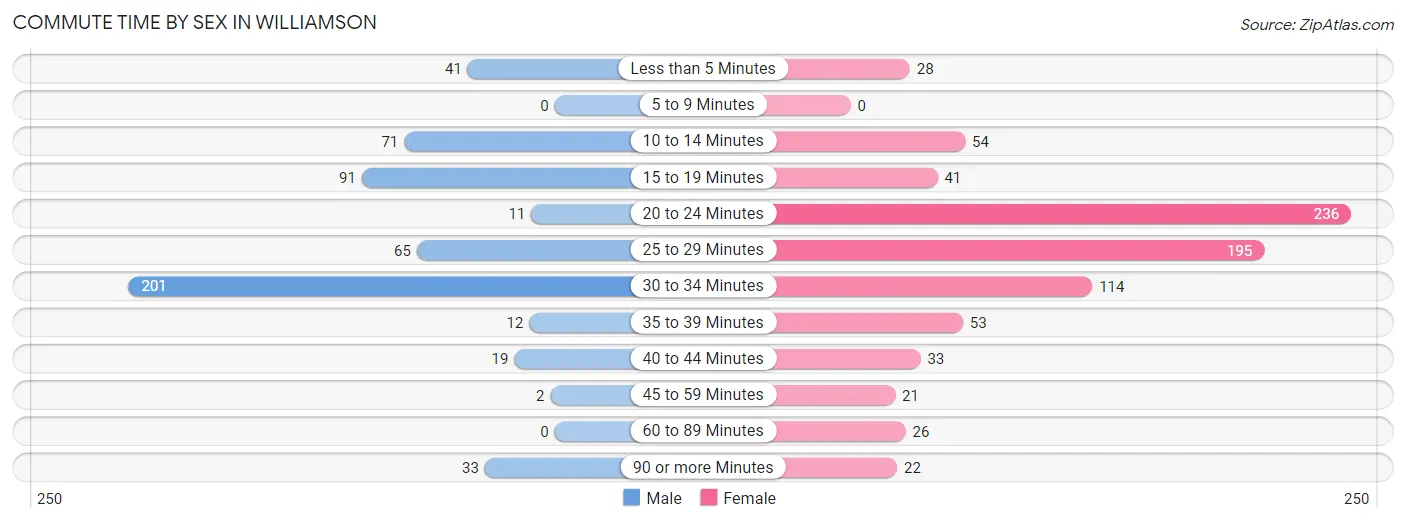
| Commute Time | Male | Female |
| Less than 5 Minutes | 41 (7.5%) | 28 (3.4%) |
| 5 to 9 Minutes | 0 (0.0%) | 0 (0.0%) |
| 10 to 14 Minutes | 71 (13.0%) | 54 (6.6%) |
| 15 to 19 Minutes | 91 (16.7%) | 41 (5.0%) |
| 20 to 24 Minutes | 11 (2.0%) | 236 (28.7%) |
| 25 to 29 Minutes | 65 (11.9%) | 195 (23.7%) |
| 30 to 34 Minutes | 201 (36.8%) | 114 (13.9%) |
| 35 to 39 Minutes | 12 (2.2%) | 53 (6.4%) |
| 40 to 44 Minutes | 19 (3.5%) | 33 (4.0%) |
| 45 to 59 Minutes | 2 (0.4%) | 21 (2.5%) |
| 60 to 89 Minutes | 0 (0.0%) | 26 (3.2%) |
| 90 or more Minutes | 33 (6.0%) | 22 (2.7%) |
Time of Departure to Work by Sex in Williamson
The most frequent times of departure to work in Williamson are 7:00 AM to 7:29 AM (160, 29.3%) for males and 7:30 AM to 7:59 AM (217, 26.4%) for females.
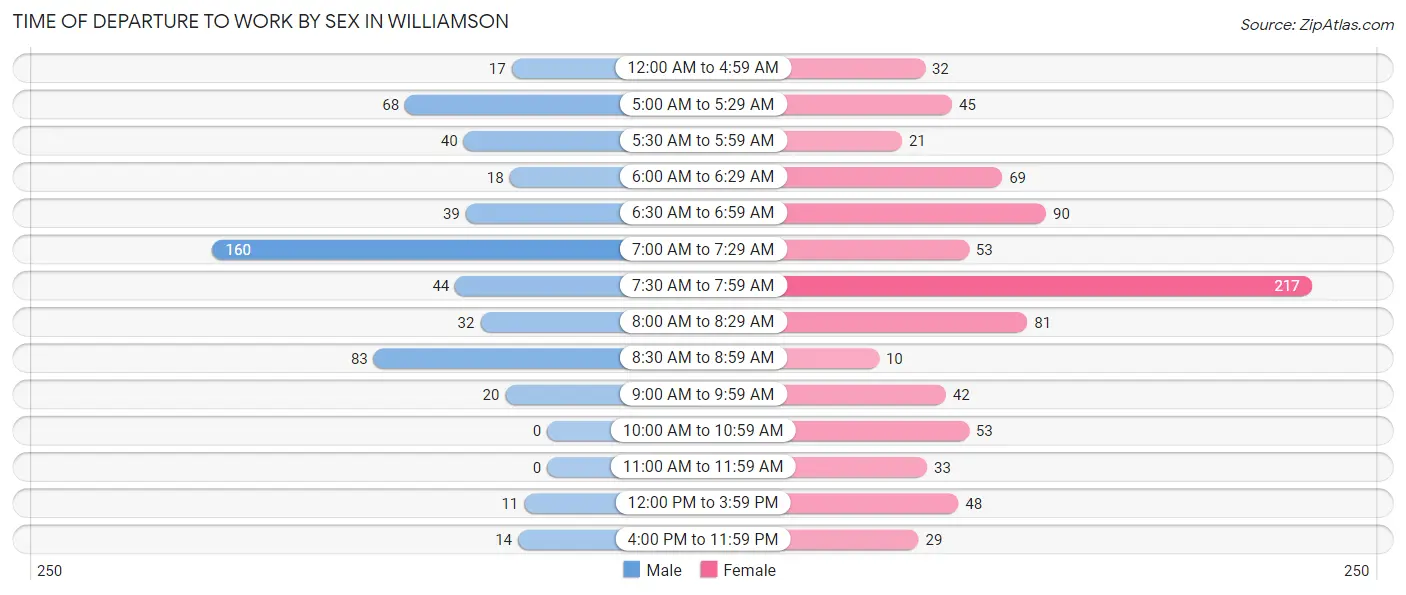
| Time of Departure | Male | Female |
| 12:00 AM to 4:59 AM | 17 (3.1%) | 32 (3.9%) |
| 5:00 AM to 5:29 AM | 68 (12.4%) | 45 (5.5%) |
| 5:30 AM to 5:59 AM | 40 (7.3%) | 21 (2.5%) |
| 6:00 AM to 6:29 AM | 18 (3.3%) | 69 (8.4%) |
| 6:30 AM to 6:59 AM | 39 (7.1%) | 90 (10.9%) |
| 7:00 AM to 7:29 AM | 160 (29.3%) | 53 (6.4%) |
| 7:30 AM to 7:59 AM | 44 (8.1%) | 217 (26.4%) |
| 8:00 AM to 8:29 AM | 32 (5.9%) | 81 (9.8%) |
| 8:30 AM to 8:59 AM | 83 (15.2%) | 10 (1.2%) |
| 9:00 AM to 9:59 AM | 20 (3.7%) | 42 (5.1%) |
| 10:00 AM to 10:59 AM | 0 (0.0%) | 53 (6.4%) |
| 11:00 AM to 11:59 AM | 0 (0.0%) | 33 (4.0%) |
| 12:00 PM to 3:59 PM | 11 (2.0%) | 48 (5.8%) |
| 4:00 PM to 11:59 PM | 14 (2.6%) | 29 (3.5%) |
| Total | 546 (100.0%) | 823 (100.0%) |
Housing Occupancy in Williamson
Occupancy by Ownership in Williamson
Of the total 2,958 dwellings in Williamson, owner-occupied units account for 2,739 (92.6%), while renter-occupied units make up 219 (7.4%).
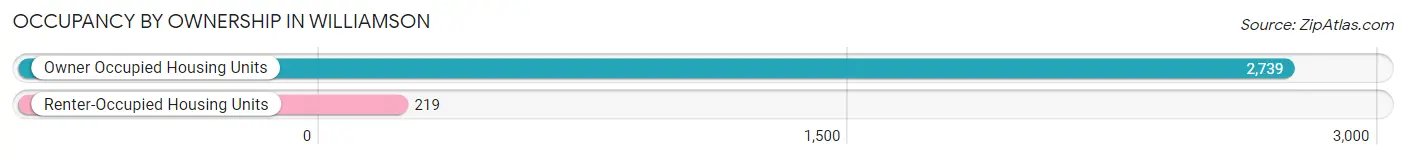
| Occupancy | # Housing Units | % Housing Units |
| Owner Occupied Housing Units | 2,739 | 92.6% |
| Renter-Occupied Housing Units | 219 | 7.4% |
| Total Occupied Housing Units | 2,958 | 100.0% |
Occupancy by Household Size in Williamson
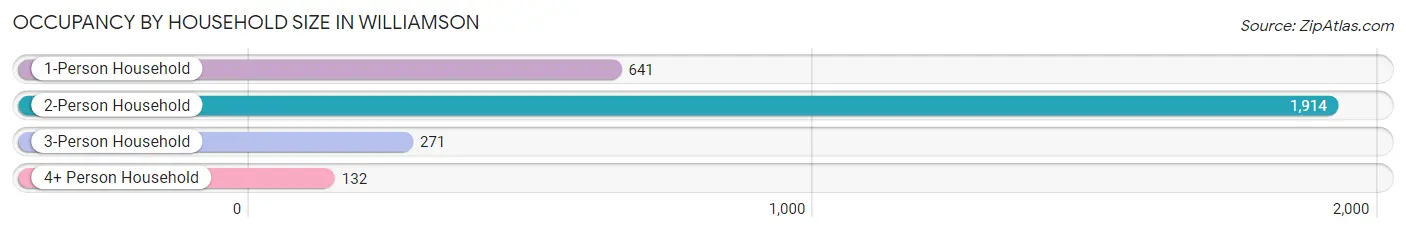
| Household Size | # Housing Units | % Housing Units |
| 1-Person Household | 641 | 21.7% |
| 2-Person Household | 1,914 | 64.7% |
| 3-Person Household | 271 | 9.2% |
| 4+ Person Household | 132 | 4.5% |
| Total Housing Units | 2,958 | 100.0% |
Occupancy by Ownership by Household Size in Williamson
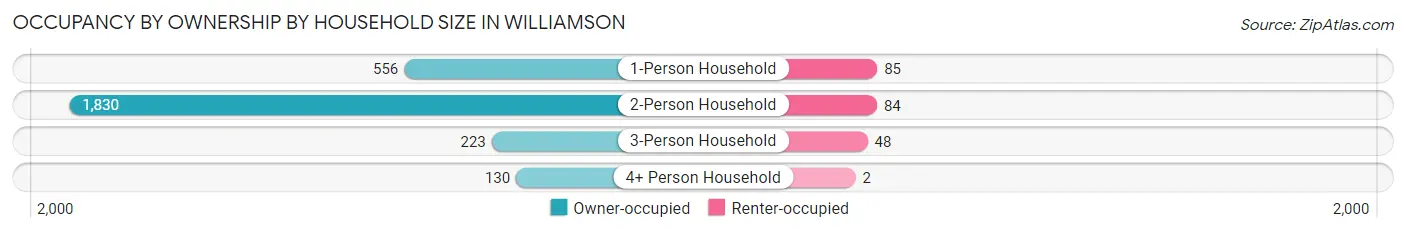
| Household Size | Owner-occupied | Renter-occupied |
| 1-Person Household | 556 (86.7%) | 85 (13.3%) |
| 2-Person Household | 1,830 (95.6%) | 84 (4.4%) |
| 3-Person Household | 223 (82.3%) | 48 (17.7%) |
| 4+ Person Household | 130 (98.5%) | 2 (1.5%) |
| Total Housing Units | 2,739 (92.6%) | 219 (7.4%) |
Occupancy by Educational Attainment in Williamson
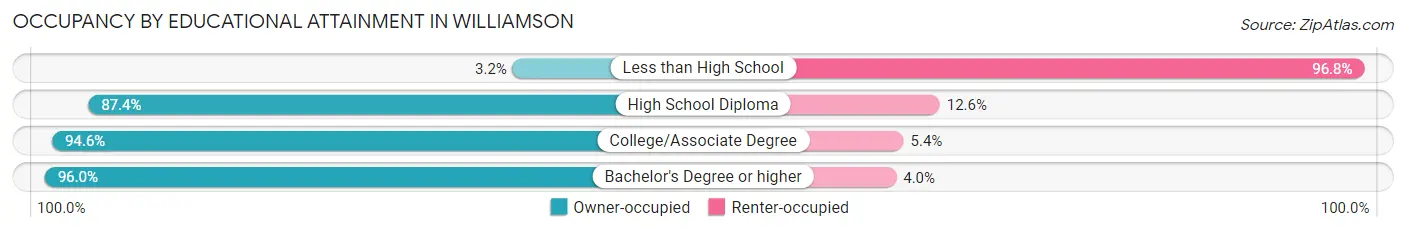
| Household Size | Owner-occupied | Renter-occupied |
| Less than High School | 2 (3.2%) | 60 (96.8%) |
| High School Diploma | 263 (87.4%) | 38 (12.6%) |
| College/Associate Degree | 1,149 (94.6%) | 66 (5.4%) |
| Bachelor's Degree or higher | 1,325 (96.0%) | 55 (4.0%) |
Occupancy by Age of Householder in Williamson
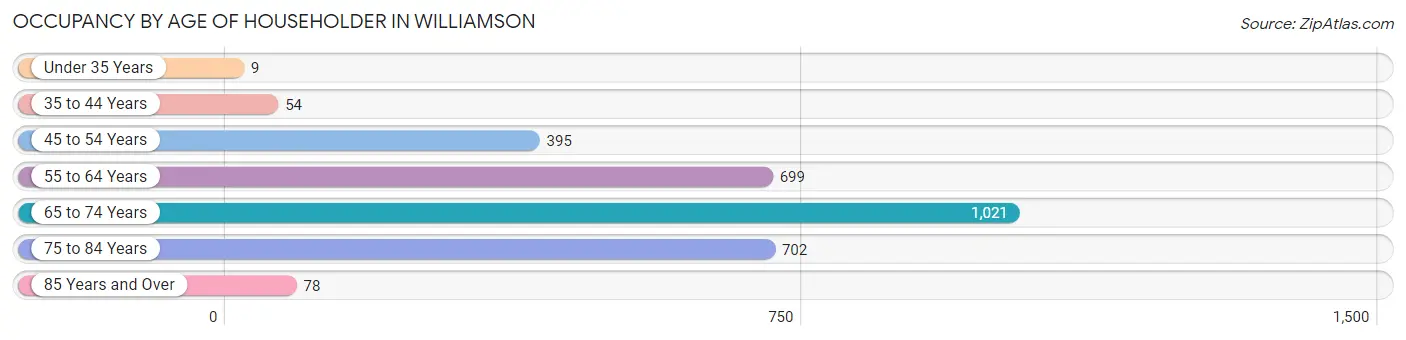
| Age Bracket | # Households | % Households |
| Under 35 Years | 9 | 0.3% |
| 35 to 44 Years | 54 | 1.8% |
| 45 to 54 Years | 395 | 13.4% |
| 55 to 64 Years | 699 | 23.6% |
| 65 to 74 Years | 1,021 | 34.5% |
| 75 to 84 Years | 702 | 23.7% |
| 85 Years and Over | 78 | 2.6% |
| Total | 2,958 | 100.0% |
Housing Finances in Williamson
Median Income by Occupancy in Williamson
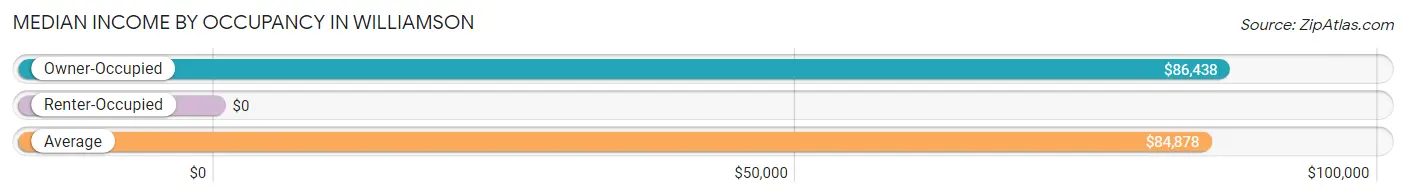
| Occupancy Type | # Households | Median Income |
| Owner-Occupied | 2,739 (92.6%) | $86,438 |
| Renter-Occupied | 219 (7.4%) | $0 |
| Average | 2,958 (100.0%) | $84,878 |
Occupancy by Householder Income Bracket in Williamson
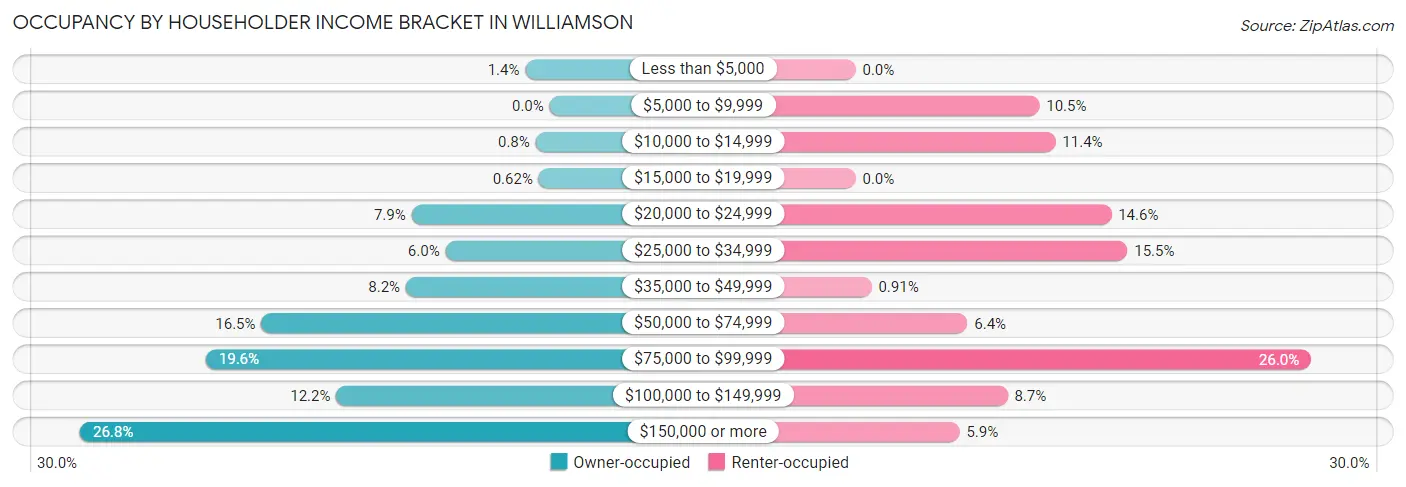
| Income Bracket | Owner-occupied | Renter-occupied |
| Less than $5,000 | 38 (1.4%) | 0 (0.0%) |
| $5,000 to $9,999 | 0 (0.0%) | 23 (10.5%) |
| $10,000 to $14,999 | 22 (0.8%) | 25 (11.4%) |
| $15,000 to $19,999 | 17 (0.6%) | 0 (0.0%) |
| $20,000 to $24,999 | 216 (7.9%) | 32 (14.6%) |
| $25,000 to $34,999 | 163 (5.9%) | 34 (15.5%) |
| $35,000 to $49,999 | 225 (8.2%) | 2 (0.9%) |
| $50,000 to $74,999 | 451 (16.5%) | 14 (6.4%) |
| $75,000 to $99,999 | 538 (19.6%) | 57 (26.0%) |
| $100,000 to $149,999 | 334 (12.2%) | 19 (8.7%) |
| $150,000 or more | 735 (26.8%) | 13 (5.9%) |
| Total | 2,739 (100.0%) | 219 (100.0%) |
Monthly Housing Cost Tiers in Williamson
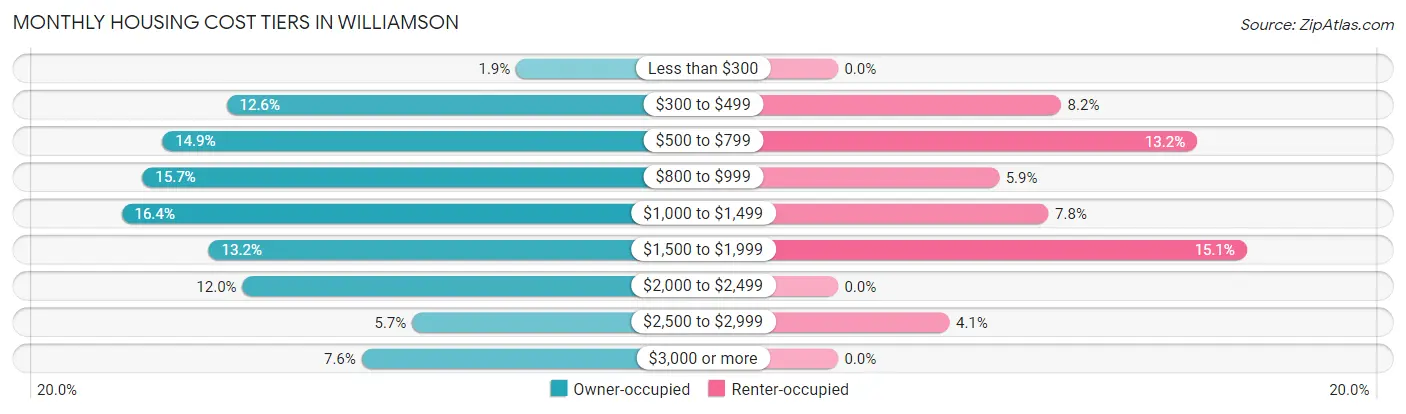
| Monthly Cost | Owner-occupied | Renter-occupied |
| Less than $300 | 52 (1.9%) | 0 (0.0%) |
| $300 to $499 | 344 (12.6%) | 18 (8.2%) |
| $500 to $799 | 409 (14.9%) | 29 (13.2%) |
| $800 to $999 | 429 (15.7%) | 13 (5.9%) |
| $1,000 to $1,499 | 450 (16.4%) | 17 (7.8%) |
| $1,500 to $1,999 | 362 (13.2%) | 33 (15.1%) |
| $2,000 to $2,499 | 328 (12.0%) | 0 (0.0%) |
| $2,500 to $2,999 | 157 (5.7%) | 9 (4.1%) |
| $3,000 or more | 208 (7.6%) | 0 (0.0%) |
| Total | 2,739 (100.0%) | 219 (100.0%) |
Physical Housing Characteristics in Williamson
Housing Structures in Williamson
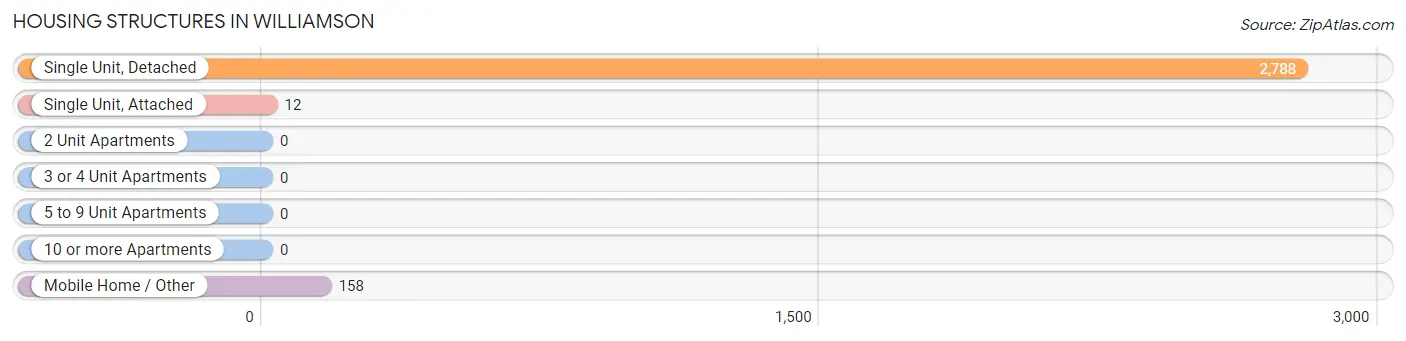
| Structure Type | # Housing Units | % Housing Units |
| Single Unit, Detached | 2,788 | 94.3% |
| Single Unit, Attached | 12 | 0.4% |
| 2 Unit Apartments | 0 | 0.0% |
| 3 or 4 Unit Apartments | 0 | 0.0% |
| 5 to 9 Unit Apartments | 0 | 0.0% |
| 10 or more Apartments | 0 | 0.0% |
| Mobile Home / Other | 158 | 5.3% |
| Total | 2,958 | 100.0% |
Housing Structures by Occupancy in Williamson
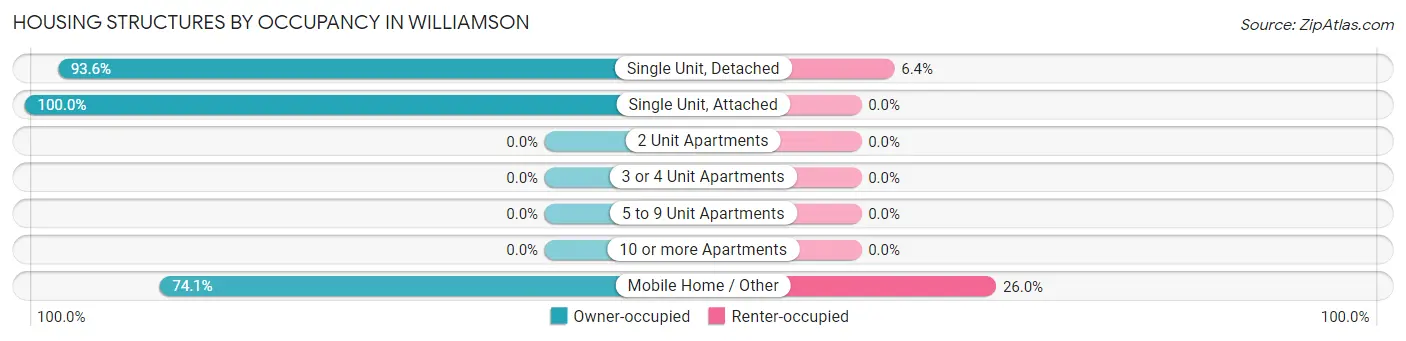
| Structure Type | Owner-occupied | Renter-occupied |
| Single Unit, Detached | 2,610 (93.6%) | 178 (6.4%) |
| Single Unit, Attached | 12 (100.0%) | 0 (0.0%) |
| 2 Unit Apartments | 0 (0.0%) | 0 (0.0%) |
| 3 or 4 Unit Apartments | 0 (0.0%) | 0 (0.0%) |
| 5 to 9 Unit Apartments | 0 (0.0%) | 0 (0.0%) |
| 10 or more Apartments | 0 (0.0%) | 0 (0.0%) |
| Mobile Home / Other | 117 (74.1%) | 41 (26.0%) |
| Total | 2,739 (92.6%) | 219 (7.4%) |
Housing Structures by Number of Rooms in Williamson
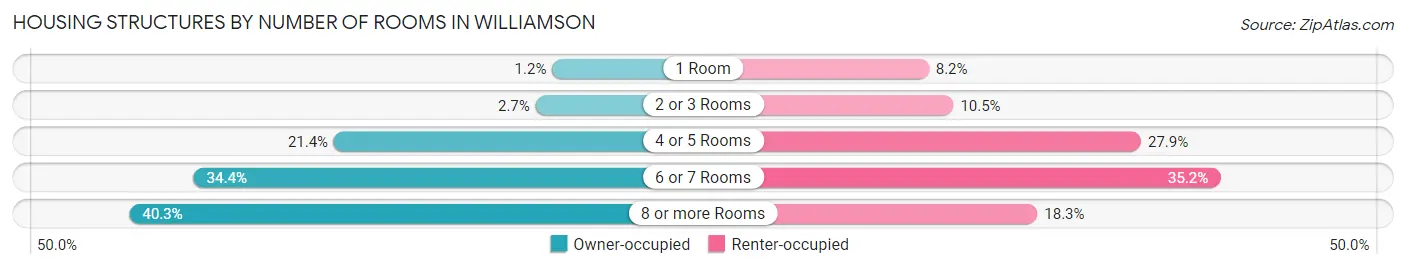
| Number of Rooms | Owner-occupied | Renter-occupied |
| 1 Room | 33 (1.2%) | 18 (8.2%) |
| 2 or 3 Rooms | 75 (2.7%) | 23 (10.5%) |
| 4 or 5 Rooms | 586 (21.4%) | 61 (27.9%) |
| 6 or 7 Rooms | 941 (34.4%) | 77 (35.2%) |
| 8 or more Rooms | 1,104 (40.3%) | 40 (18.3%) |
| Total | 2,739 (100.0%) | 219 (100.0%) |
Housing Structure by Heating Type in Williamson
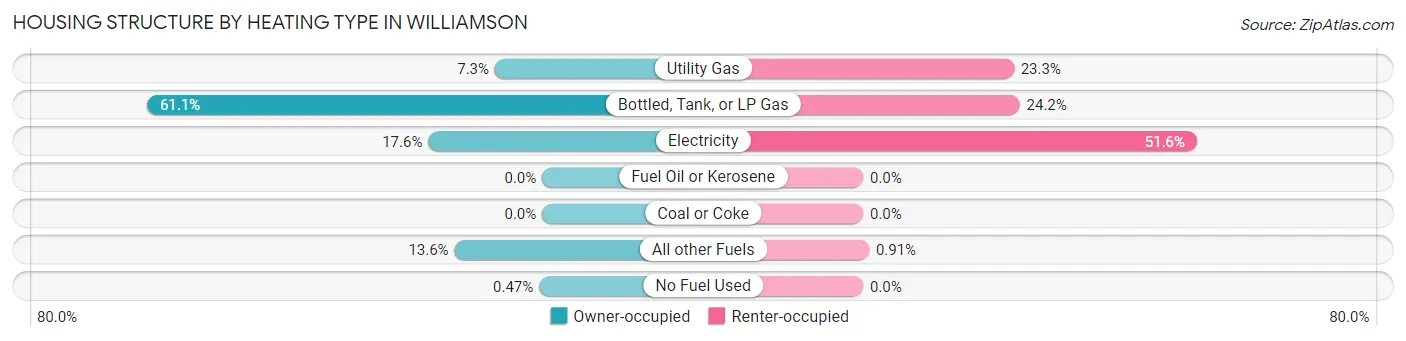
| Heating Type | Owner-occupied | Renter-occupied |
| Utility Gas | 200 (7.3%) | 51 (23.3%) |
| Bottled, Tank, or LP Gas | 1,673 (61.1%) | 53 (24.2%) |
| Electricity | 482 (17.6%) | 113 (51.6%) |
| Fuel Oil or Kerosene | 0 (0.0%) | 0 (0.0%) |
| Coal or Coke | 0 (0.0%) | 0 (0.0%) |
| All other Fuels | 371 (13.6%) | 2 (0.9%) |
| No Fuel Used | 13 (0.5%) | 0 (0.0%) |
| Total | 2,739 (100.0%) | 219 (100.0%) |
Household Vehicle Usage in Williamson
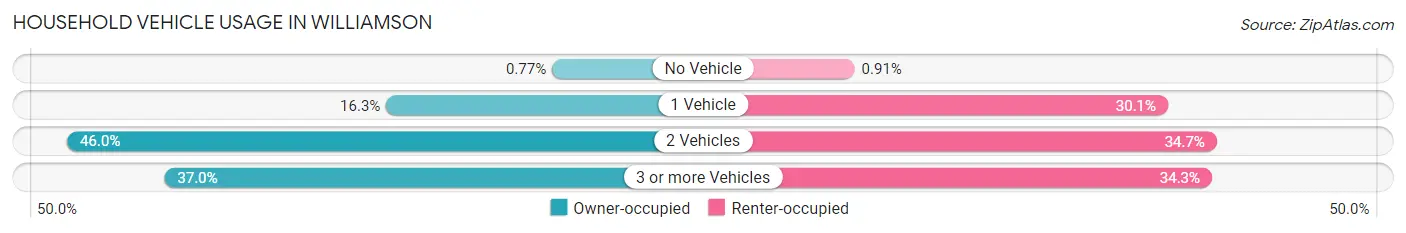
| Vehicles per Household | Owner-occupied | Renter-occupied |
| No Vehicle | 21 (0.8%) | 2 (0.9%) |
| 1 Vehicle | 445 (16.3%) | 66 (30.1%) |
| 2 Vehicles | 1,261 (46.0%) | 76 (34.7%) |
| 3 or more Vehicles | 1,012 (36.9%) | 75 (34.3%) |
| Total | 2,739 (100.0%) | 219 (100.0%) |
Real Estate & Mortgages in Williamson
Real Estate and Mortgage Overview in Williamson
| Characteristic | Without Mortgage | With Mortgage |
| Housing Units | 1,427 | 1,312 |
| Median Property Value | $622,400 | $590,400 |
| Median Household Income | $72,872 | $446 |
| Monthly Housing Costs | $703 | $196 |
| Real Estate Taxes | $3,033 | $0 |
Property Value by Mortgage Status in Williamson
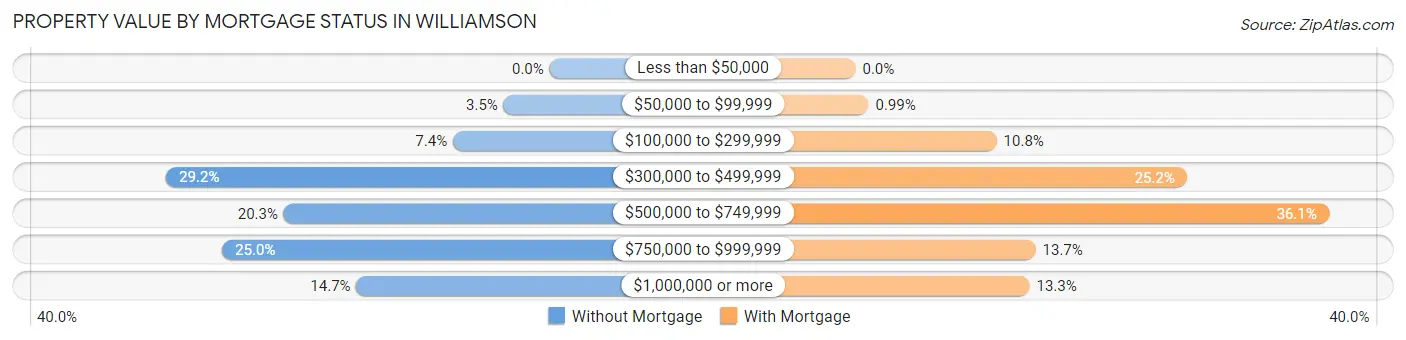
| Property Value | Without Mortgage | With Mortgage |
| Less than $50,000 | 0 (0.0%) | 0 (0.0%) |
| $50,000 to $99,999 | 50 (3.5%) | 13 (1.0%) |
| $100,000 to $299,999 | 105 (7.4%) | 141 (10.7%) |
| $300,000 to $499,999 | 417 (29.2%) | 331 (25.2%) |
| $500,000 to $749,999 | 289 (20.3%) | 473 (36.0%) |
| $750,000 to $999,999 | 356 (24.9%) | 180 (13.7%) |
| $1,000,000 or more | 210 (14.7%) | 174 (13.3%) |
| Total | 1,427 (100.0%) | 1,312 (100.0%) |
Household Income by Mortgage Status in Williamson
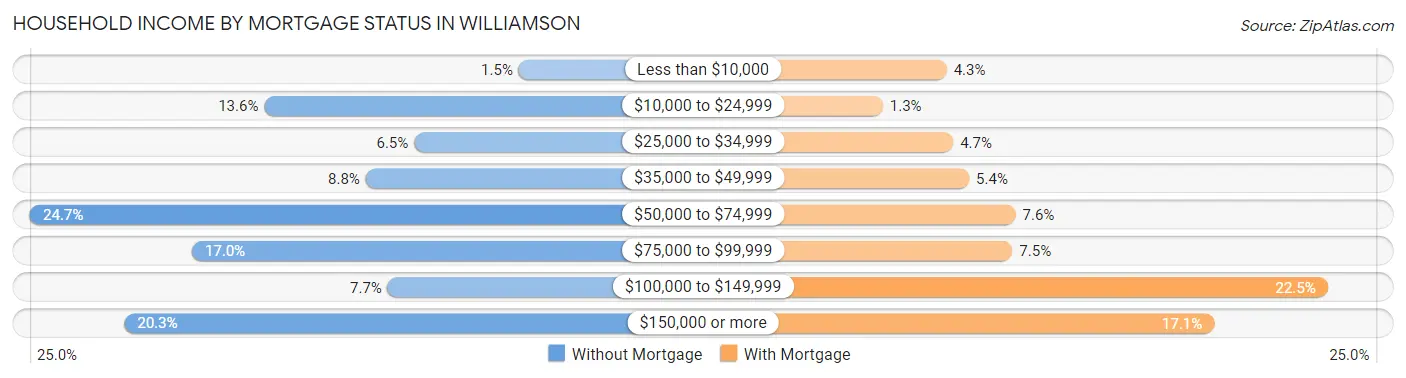
| Household Income | Without Mortgage | With Mortgage |
| Less than $10,000 | 21 (1.5%) | 57 (4.3%) |
| $10,000 to $24,999 | 194 (13.6%) | 17 (1.3%) |
| $25,000 to $34,999 | 92 (6.5%) | 61 (4.6%) |
| $35,000 to $49,999 | 125 (8.8%) | 71 (5.4%) |
| $50,000 to $74,999 | 353 (24.7%) | 100 (7.6%) |
| $75,000 to $99,999 | 243 (17.0%) | 98 (7.5%) |
| $100,000 to $149,999 | 110 (7.7%) | 295 (22.5%) |
| $150,000 or more | 289 (20.3%) | 224 (17.1%) |
| Total | 1,427 (100.0%) | 1,312 (100.0%) |
Property Value to Household Income Ratio in Williamson
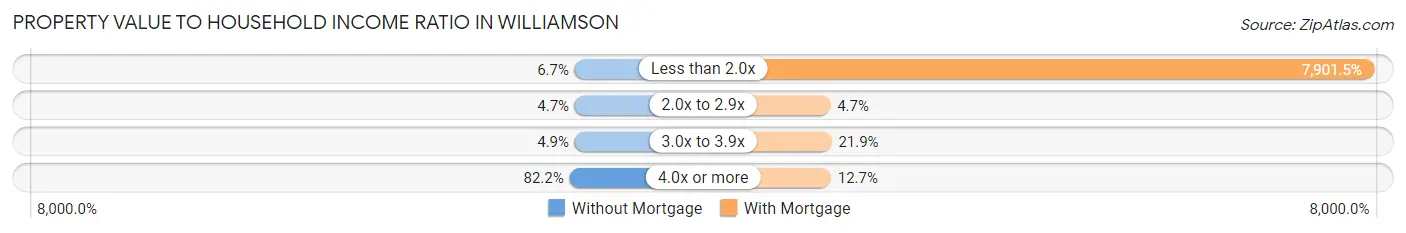
| Value-to-Income Ratio | Without Mortgage | With Mortgage |
| Less than 2.0x | 96 (6.7%) | 103,667 (7,901.4%) |
| 2.0x to 2.9x | 67 (4.7%) | 62 (4.7%) |
| 3.0x to 3.9x | 70 (4.9%) | 287 (21.9%) |
| 4.0x or more | 1,173 (82.2%) | 167 (12.7%) |
| Total | 1,427 (100.0%) | 1,312 (100.0%) |
Real Estate Taxes by Mortgage Status in Williamson
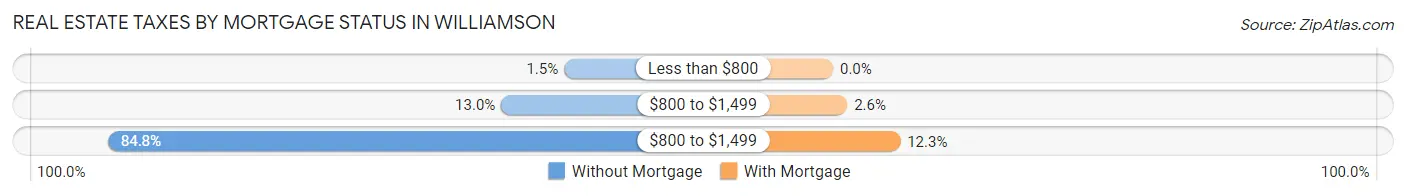
| Property Taxes | Without Mortgage | With Mortgage |
| Less than $800 | 21 (1.5%) | 0 (0.0%) |
| $800 to $1,499 | 185 (13.0%) | 34 (2.6%) |
| $800 to $1,499 | 1,210 (84.8%) | 161 (12.3%) |
| Total | 1,427 (100.0%) | 1,312 (100.0%) |
Health & Disability in Williamson
Health Insurance Coverage by Age in Williamson
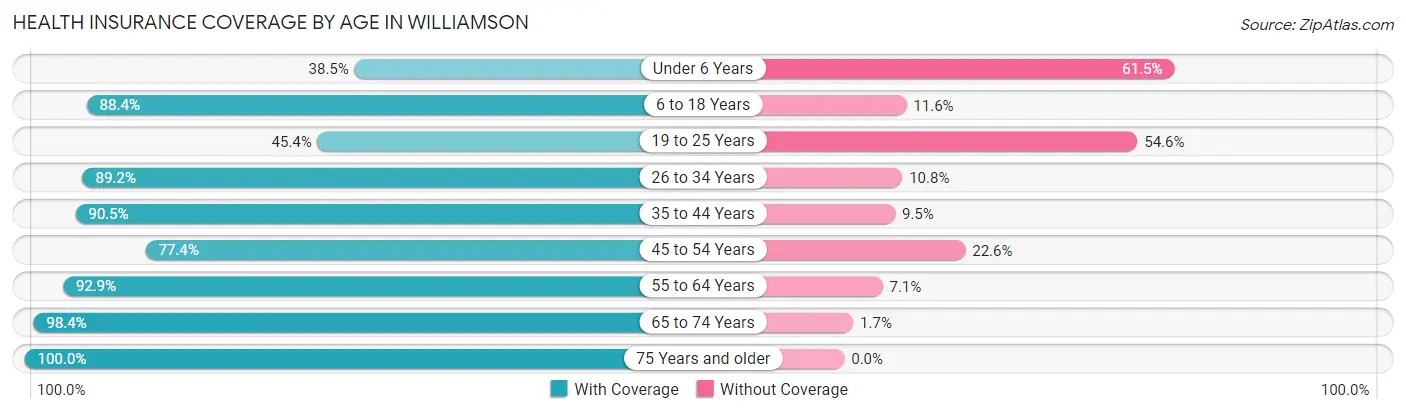
| Age Bracket | With Coverage | Without Coverage |
| Under 6 Years | 10 (38.5%) | 16 (61.5%) |
| 6 to 18 Years | 275 (88.4%) | 36 (11.6%) |
| 19 to 25 Years | 44 (45.4%) | 53 (54.6%) |
| 26 to 34 Years | 99 (89.2%) | 12 (10.8%) |
| 35 to 44 Years | 134 (90.5%) | 14 (9.5%) |
| 45 to 54 Years | 539 (77.4%) | 157 (22.6%) |
| 55 to 64 Years | 1,368 (92.9%) | 105 (7.1%) |
| 65 to 74 Years | 1,905 (98.4%) | 32 (1.7%) |
| 75 Years and older | 1,200 (100.0%) | 0 (0.0%) |
| Total | 5,574 (92.9%) | 425 (7.1%) |
Health Insurance Coverage by Citizenship Status in Williamson
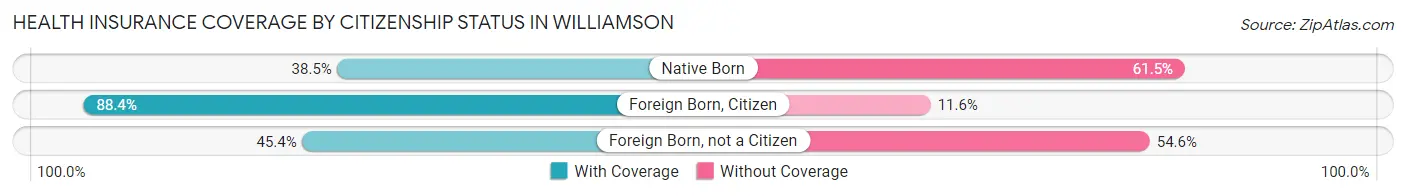
| Citizenship Status | With Coverage | Without Coverage |
| Native Born | 10 (38.5%) | 16 (61.5%) |
| Foreign Born, Citizen | 275 (88.4%) | 36 (11.6%) |
| Foreign Born, not a Citizen | 44 (45.4%) | 53 (54.6%) |
Health Insurance Coverage by Household Income in Williamson
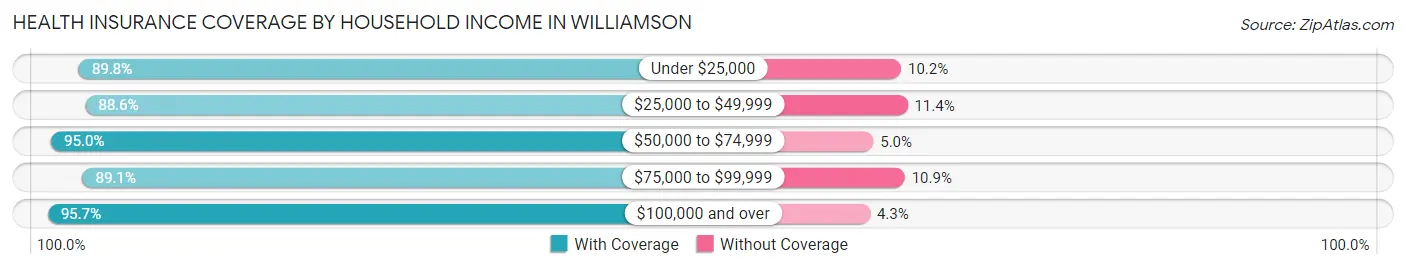
| Household Income | With Coverage | Without Coverage |
| Under $25,000 | 486 (89.8%) | 55 (10.2%) |
| $25,000 to $49,999 | 647 (88.6%) | 83 (11.4%) |
| $50,000 to $74,999 | 938 (95.0%) | 49 (5.0%) |
| $75,000 to $99,999 | 1,034 (89.1%) | 126 (10.9%) |
| $100,000 and over | 2,469 (95.7%) | 112 (4.3%) |
Public vs Private Health Insurance Coverage by Age in Williamson
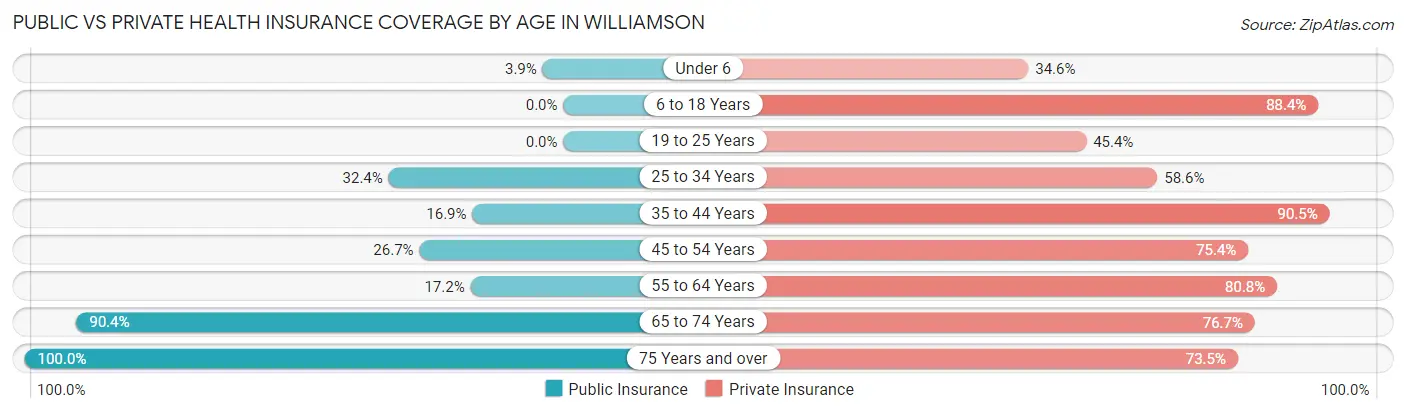
| Age Bracket | Public Insurance | Private Insurance |
| Under 6 | 1 (3.8%) | 9 (34.6%) |
| 6 to 18 Years | 0 (0.0%) | 275 (88.4%) |
| 19 to 25 Years | 0 (0.0%) | 44 (45.4%) |
| 25 to 34 Years | 36 (32.4%) | 65 (58.6%) |
| 35 to 44 Years | 25 (16.9%) | 134 (90.5%) |
| 45 to 54 Years | 186 (26.7%) | 525 (75.4%) |
| 55 to 64 Years | 254 (17.2%) | 1,190 (80.8%) |
| 65 to 74 Years | 1,751 (90.4%) | 1,485 (76.7%) |
| 75 Years and over | 1,200 (100.0%) | 882 (73.5%) |
| Total | 3,453 (57.6%) | 4,609 (76.8%) |
Disability Status by Sex by Age in Williamson
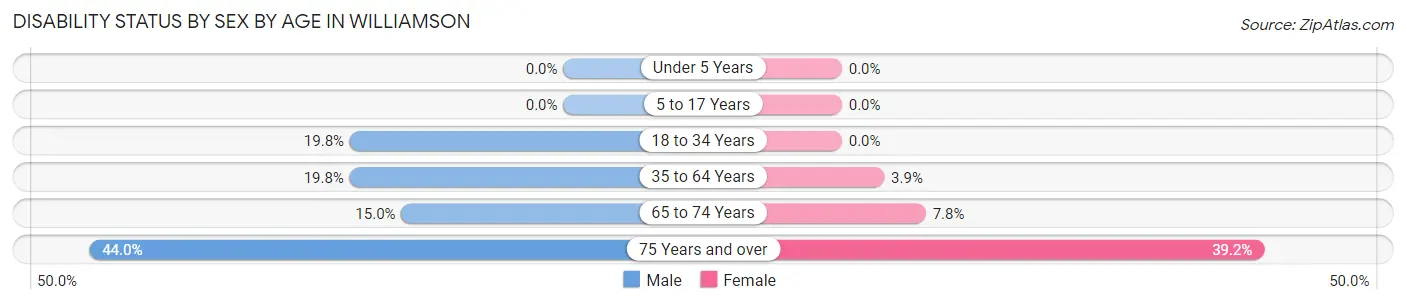
| Age Bracket | Male | Female |
| Under 5 Years | 0 (0.0%) | 0 (0.0%) |
| 5 to 17 Years | 0 (0.0%) | 0 (0.0%) |
| 18 to 34 Years | 21 (19.8%) | 0 (0.0%) |
| 35 to 64 Years | 182 (19.8%) | 55 (3.9%) |
| 65 to 74 Years | 158 (15.0%) | 69 (7.8%) |
| 75 Years and over | 308 (44.0%) | 196 (39.2%) |
Disability Class by Sex by Age in Williamson
Disability Class: Hearing Difficulty
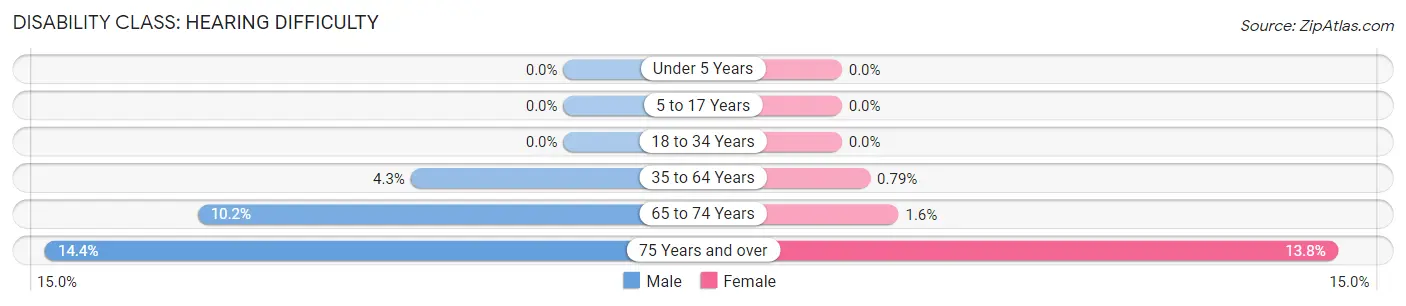
| Age Bracket | Male | Female |
| Under 5 Years | 0 (0.0%) | 0 (0.0%) |
| 5 to 17 Years | 0 (0.0%) | 0 (0.0%) |
| 18 to 34 Years | 0 (0.0%) | 0 (0.0%) |
| 35 to 64 Years | 39 (4.3%) | 11 (0.8%) |
| 65 to 74 Years | 107 (10.2%) | 14 (1.6%) |
| 75 Years and over | 101 (14.4%) | 69 (13.8%) |
Disability Class: Vision Difficulty
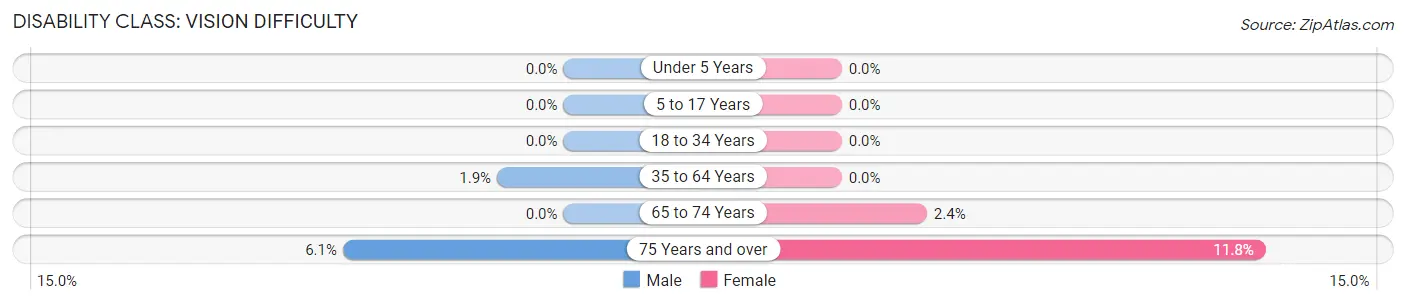
| Age Bracket | Male | Female |
| Under 5 Years | 0 (0.0%) | 0 (0.0%) |
| 5 to 17 Years | 0 (0.0%) | 0 (0.0%) |
| 18 to 34 Years | 0 (0.0%) | 0 (0.0%) |
| 35 to 64 Years | 17 (1.8%) | 0 (0.0%) |
| 65 to 74 Years | 0 (0.0%) | 21 (2.4%) |
| 75 Years and over | 43 (6.1%) | 59 (11.8%) |
Disability Class: Cognitive Difficulty
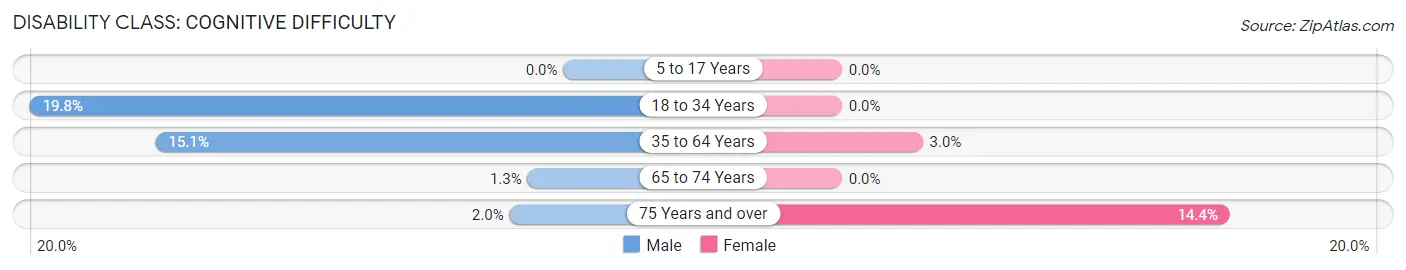
| Age Bracket | Male | Female |
| 5 to 17 Years | 0 (0.0%) | 0 (0.0%) |
| 18 to 34 Years | 21 (19.8%) | 0 (0.0%) |
| 35 to 64 Years | 139 (15.1%) | 42 (3.0%) |
| 65 to 74 Years | 14 (1.3%) | 0 (0.0%) |
| 75 Years and over | 14 (2.0%) | 72 (14.4%) |
Disability Class: Ambulatory Difficulty
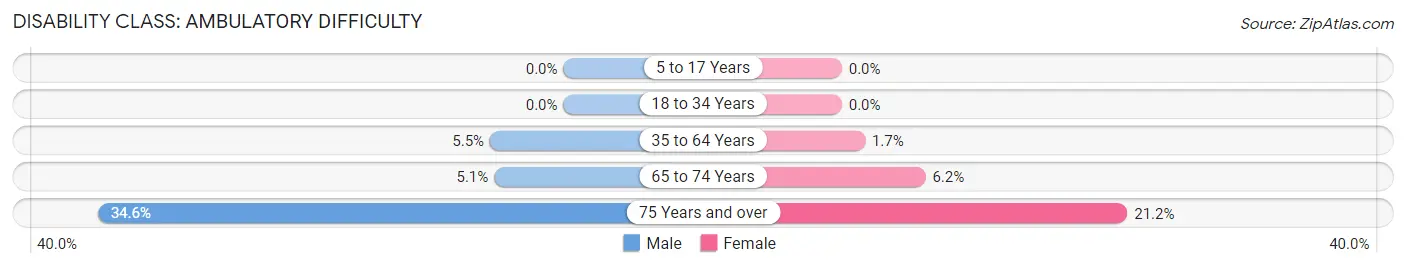
| Age Bracket | Male | Female |
| 5 to 17 Years | 0 (0.0%) | 0 (0.0%) |
| 18 to 34 Years | 0 (0.0%) | 0 (0.0%) |
| 35 to 64 Years | 50 (5.4%) | 24 (1.7%) |
| 65 to 74 Years | 54 (5.1%) | 55 (6.2%) |
| 75 Years and over | 242 (34.6%) | 106 (21.2%) |
Disability Class: Self-Care Difficulty
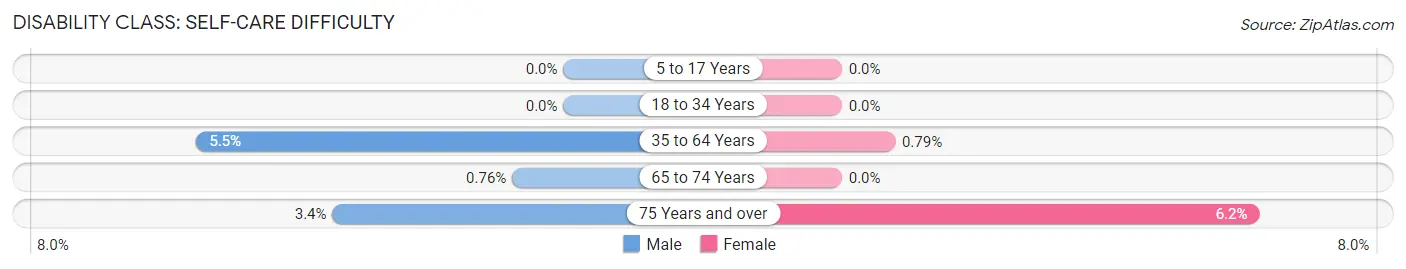
| Age Bracket | Male | Female |
| 5 to 17 Years | 0 (0.0%) | 0 (0.0%) |
| 18 to 34 Years | 0 (0.0%) | 0 (0.0%) |
| 35 to 64 Years | 50 (5.4%) | 11 (0.8%) |
| 65 to 74 Years | 8 (0.8%) | 0 (0.0%) |
| 75 Years and over | 24 (3.4%) | 31 (6.2%) |
Technology Access in Williamson
Computing Device Access in Williamson
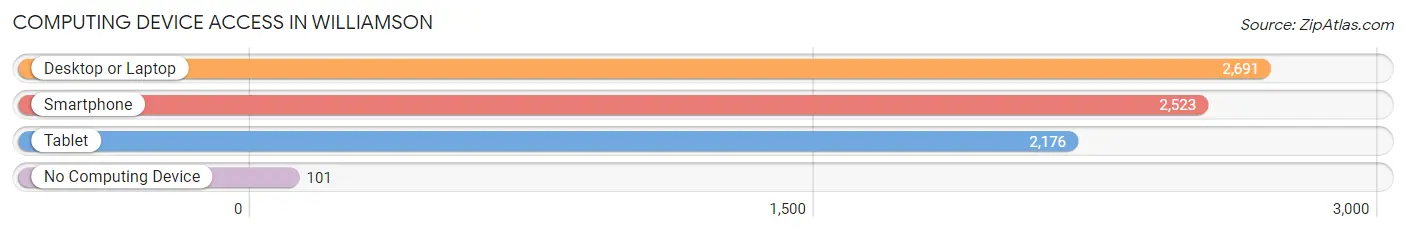
| Device Type | # Households | % Households |
| Desktop or Laptop | 2,691 | 91.0% |
| Smartphone | 2,523 | 85.3% |
| Tablet | 2,176 | 73.6% |
| No Computing Device | 101 | 3.4% |
| Total | 2,958 | 100.0% |
Internet Access in Williamson
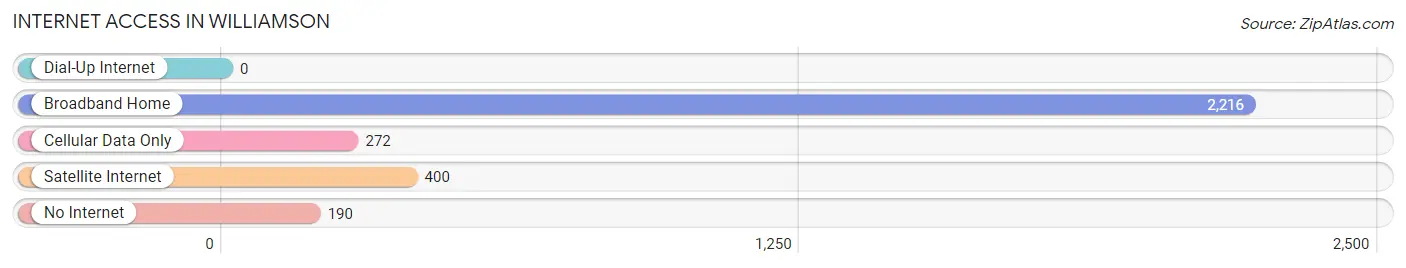
| Internet Type | # Households | % Households |
| Dial-Up Internet | 0 | 0.0% |
| Broadband Home | 2,216 | 74.9% |
| Cellular Data Only | 272 | 9.2% |
| Satellite Internet | 400 | 13.5% |
| No Internet | 190 | 6.4% |
| Total | 2,958 | 100.0% |
Williamson Summary
Williamson is a small unincorporated community located in Pinal County, Arizona. It is situated in the Sonoran Desert, approximately 40 miles southeast of Phoenix. The town is located on the Gila River Indian Reservation, and is home to the Gila River Indian Community. The population of Williamson was estimated to be 1,845 in 2019.
History
Williamson was founded in 1878 by a group of settlers from the nearby town of Florence. The settlers named the town after William Williamson, a local rancher. The town was originally a farming community, and the main crops grown were cotton, alfalfa, and wheat. In the early 1900s, the town began to grow as a result of the construction of the Southern Pacific Railroad. The railroad brought new settlers to the area, and the town began to expand.
In the 1920s, the town was home to a number of businesses, including a general store, a hotel, a bank, and a post office. The town also had a school, which was attended by both Native American and non-Native American children.
In the 1950s, the town began to decline as a result of the construction of the Coolidge Dam, which diverted water away from the Gila River. This caused the town to become increasingly isolated, and many of the businesses closed. In the 1970s, the town was revitalized when the Gila River Indian Community was established. The community opened a casino, which brought new jobs and economic opportunities to the area.
Geography
Williamson is located in the Sonoran Desert, approximately 40 miles southeast of Phoenix. The town is situated on the Gila River Indian Reservation, and is surrounded by the Gila River Indian Community. The town is located at an elevation of 1,845 feet, and has a total area of 0.6 square miles.
The climate in Williamson is hot and dry, with temperatures ranging from the mid-90s in the summer to the mid-50s in the winter. The town receives an average of 8 inches of rain per year.
Economy
The economy of Williamson is largely based on tourism and the Gila River Indian Community. The town is home to the Gila River Casino, which is the largest employer in the area. The casino provides jobs for many of the town’s residents, and also attracts visitors from all over the state.
The town is also home to a number of small businesses, including restaurants, convenience stores, and gas stations. The town also has a number of agricultural operations, including cotton, alfalfa, and wheat farms.
Demographics
As of 2019, the population of Williamson was estimated to be 1,845. The town is predominantly Native American, with the Gila River Indian Community making up the majority of the population. The town also has a small Hispanic population, as well as a small number of non-Hispanic whites. The median household income in Williamson is $30,000, and the median home value is $90,000.
Common Questions
What is Per Capita Income in Williamson?
Per Capita income in Williamson is $57,921.
What is the Median Family Income in Williamson?
Median Family Income in Williamson is $92,069.
What is the Median Household income in Williamson?
Median Household Income in Williamson is $84,878.
What is Income or Wage Gap in Williamson?
Income or Wage Gap in Williamson is 34.7%.
Women in Williamson earn 65.3 cents for every dollar earned by a man.
What is Inequality or Gini Index in Williamson?
Inequality or Gini Index in Williamson is 0.44.
What is the Total Population of Williamson?
Total Population of Williamson is 5,999.
What is the Total Male Population of Williamson?
Total Male Population of Williamson is 2,951.
What is the Total Female Population of Williamson?
Total Female Population of Williamson is 3,048.
What is the Ratio of Males per 100 Females in Williamson?
There are 96.82 Males per 100 Females in Williamson.
What is the Ratio of Females per 100 Males in Williamson?
There are 103.29 Females per 100 Males in Williamson.
What is the Median Population Age in Williamson?
Median Population Age in Williamson is 65.4 Years.
What is the Average Family Size in Williamson
Average Family Size in Williamson is 2.3 People.
What is the Average Household Size in Williamson
Average Household Size in Williamson is 2.0 People.
How Large is the Labor Force in Williamson?
There are 1,888 People in the Labor Forcein in Williamson.
What is the Percentage of People in the Labor Force in Williamson?
32.8% of People are in the Labor Force in Williamson.
What is the Unemployment Rate in Williamson?
Unemployment Rate in Williamson is 1.9%.