Tucson Estates, AZ Map & Demographics
Tucson Estates Map
Tucson Estates Overview
$32,229
PER CAPITA INCOME
$75,280
AVG FAMILY INCOME
$61,545
AVG HOUSEHOLD INCOME
45.0%
WAGE / INCOME GAP [ % ]
55.0¢/ $1
WAGE / INCOME GAP [ $ ]
$11,770
FAMILY INCOME DEFICIT
0.40
INEQUALITY / GINI INDEX
12,795
TOTAL POPULATION
6,234
MALE POPULATION
6,561
FEMALE POPULATION
95.02
MALES / 100 FEMALES
105.25
FEMALES / 100 MALES
53.1
MEDIAN AGE
2.9
AVG FAMILY SIZE
2.3
AVG HOUSEHOLD SIZE
4,612
LABOR FORCE [ PEOPLE ]
41.5%
PERCENT IN LABOR FORCE
3.3%
UNEMPLOYMENT RATE
Income in Tucson Estates
Income Overview in Tucson Estates
Per Capita Income in Tucson Estates is $32,229, while median incomes of families and households are $75,280 and $61,545 respectively.
| Characteristic | Number | Measure |
| Per Capita Income | 12,795 | $32,229 |
| Median Family Income | 3,589 | $75,280 |
| Mean Family Income | 3,589 | $87,964 |
| Median Household Income | 5,507 | $61,545 |
| Mean Household Income | 5,507 | $75,235 |
| Income Deficit | 3,589 | $11,770 |
| Wage / Income Gap (%) | 12,795 | 44.98% |
| Wage / Income Gap ($) | 12,795 | 55.02¢ per $1 |
| Gini / Inequality Index | 12,795 | 0.40 |
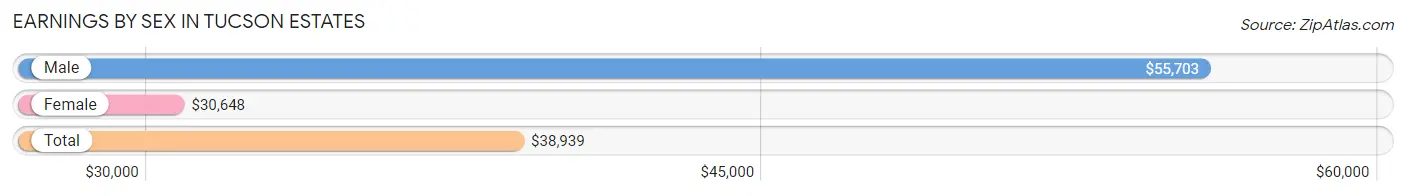
Earnings by Sex in Tucson Estates
Average Earnings in Tucson Estates are $38,939, $55,703 for men and $30,648 for women, a difference of 45.0%.
| Sex | Number | Average Earnings |
| Male | 2,693 (56.3%) | $55,703 |
| Female | 2,092 (43.7%) | $30,648 |
| Total | 4,785 (100.0%) | $38,939 |
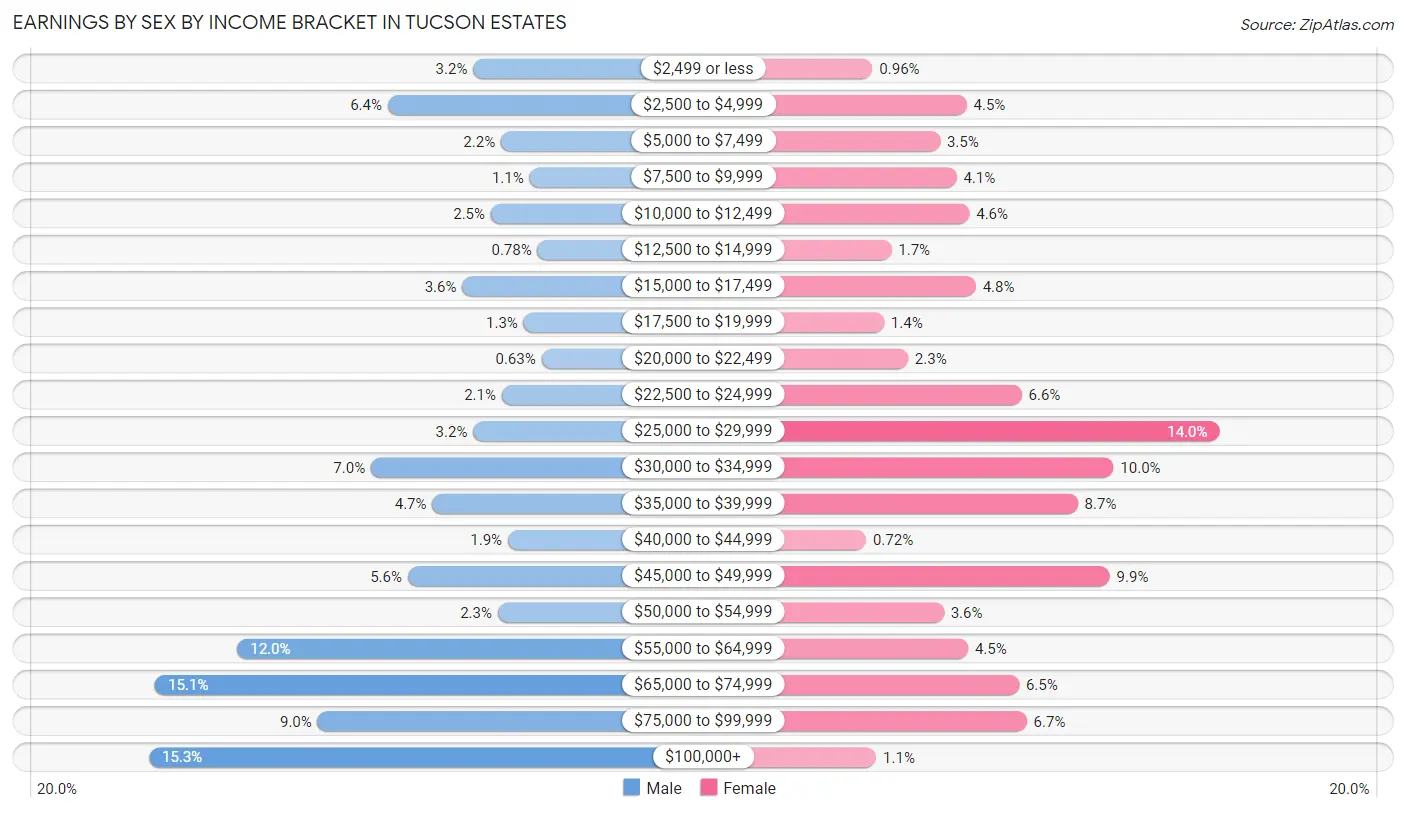
Earnings by Sex by Income Bracket in Tucson Estates
The most common earnings brackets in Tucson Estates are $100,000+ for men (413 | 15.3%) and $25,000 to $29,999 for women (292 | 14.0%).
| Income | Male | Female |
| $2,499 or less | 86 (3.2%) | 20 (1.0%) |
| $2,500 to $4,999 | 172 (6.4%) | 94 (4.5%) |
| $5,000 to $7,499 | 58 (2.1%) | 73 (3.5%) |
| $7,500 to $9,999 | 29 (1.1%) | 86 (4.1%) |
| $10,000 to $12,499 | 68 (2.5%) | 96 (4.6%) |
| $12,500 to $14,999 | 21 (0.8%) | 35 (1.7%) |
| $15,000 to $17,499 | 97 (3.6%) | 101 (4.8%) |
| $17,500 to $19,999 | 35 (1.3%) | 29 (1.4%) |
| $20,000 to $22,499 | 17 (0.6%) | 48 (2.3%) |
| $22,500 to $24,999 | 57 (2.1%) | 137 (6.6%) |
| $25,000 to $29,999 | 86 (3.2%) | 292 (14.0%) |
| $30,000 to $34,999 | 189 (7.0%) | 209 (10.0%) |
| $35,000 to $39,999 | 127 (4.7%) | 181 (8.6%) |
| $40,000 to $44,999 | 51 (1.9%) | 15 (0.7%) |
| $45,000 to $49,999 | 152 (5.6%) | 206 (9.9%) |
| $50,000 to $54,999 | 61 (2.3%) | 76 (3.6%) |
| $55,000 to $64,999 | 324 (12.0%) | 95 (4.5%) |
| $65,000 to $74,999 | 407 (15.1%) | 135 (6.5%) |
| $75,000 to $99,999 | 243 (9.0%) | 141 (6.7%) |
| $100,000+ | 413 (15.3%) | 23 (1.1%) |
| Total | 2,693 (100.0%) | 2,092 (100.0%) |
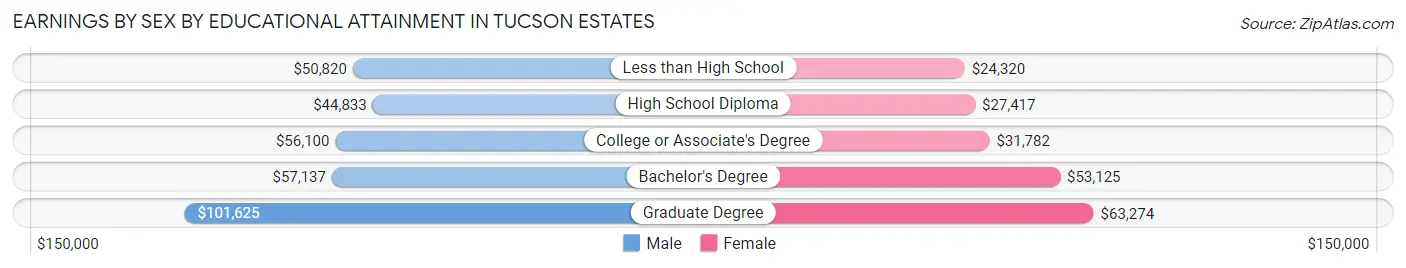
Earnings by Sex by Educational Attainment in Tucson Estates
Average earnings in Tucson Estates are $56,901 for men and $32,287 for women, a difference of 43.3%. Men with an educational attainment of graduate degree enjoy the highest average annual earnings of $101,625, while those with high school diploma education earn the least with $44,833. Women with an educational attainment of graduate degree earn the most with the average annual earnings of $63,274, while those with less than high school education have the smallest earnings of $24,320.
| Educational Attainment | Male Income | Female Income |
| Less than High School | $50,820 | $24,320 |
| High School Diploma | $44,833 | $27,417 |
| College or Associate's Degree | $56,100 | $31,782 |
| Bachelor's Degree | $57,137 | $53,125 |
| Graduate Degree | $101,625 | $63,274 |
| Total | $56,901 | $32,287 |
Family Income in Tucson Estates
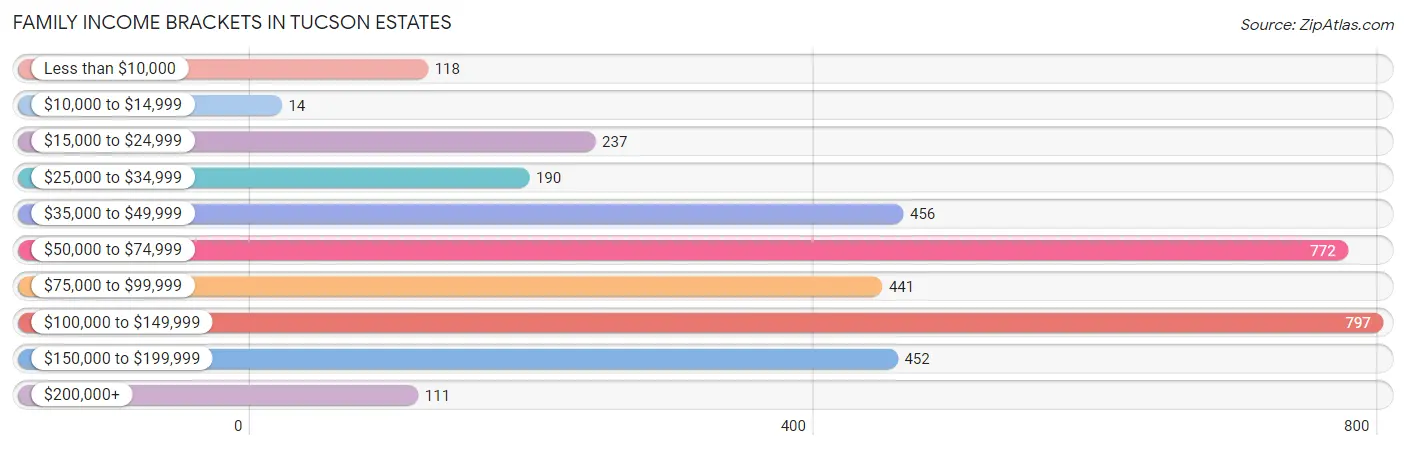
Family Income Brackets in Tucson Estates
According to the Tucson Estates family income data, there are 797 families falling into the $100,000 to $149,999 income range, which is the most common income bracket and makes up 22.2% of all families. Conversely, the $10,000 to $14,999 income bracket is the least frequent group with only 14 families (0.4%) belonging to this category.
| Income Bracket | # Families | % Families |
| Less than $10,000 | 118 | 3.3% |
| $10,000 to $14,999 | 14 | 0.4% |
| $15,000 to $24,999 | 237 | 6.6% |
| $25,000 to $34,999 | 190 | 5.3% |
| $35,000 to $49,999 | 456 | 12.7% |
| $50,000 to $74,999 | 772 | 21.5% |
| $75,000 to $99,999 | 441 | 12.3% |
| $100,000 to $149,999 | 797 | 22.2% |
| $150,000 to $199,999 | 452 | 12.6% |
| $200,000+ | 111 | 3.1% |
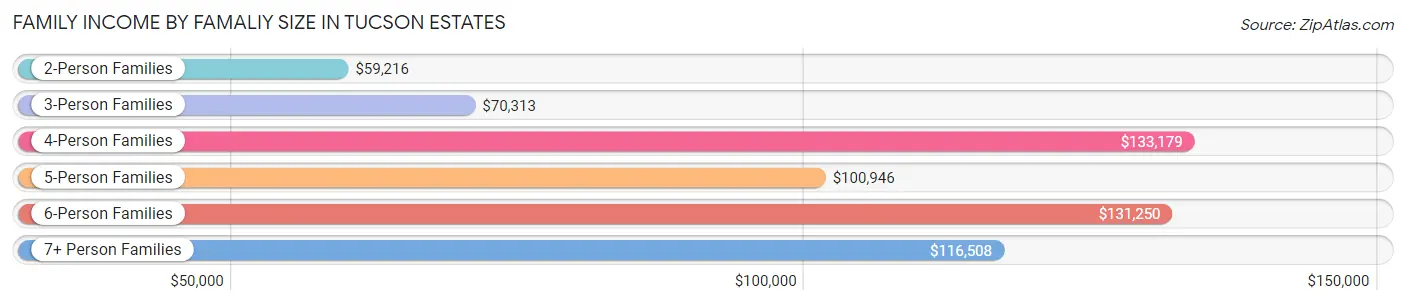
Family Income by Famaliy Size in Tucson Estates
4-person families (477 | 13.3%) account for the highest median family income in Tucson Estates with $133,179 per family, while 4-person families (477 | 13.3%) have the highest median income of $33,295 per family member.
| Income Bracket | # Families | Median Income |
| 2-Person Families | 2,134 (59.5%) | $59,216 |
| 3-Person Families | 424 (11.8%) | $70,313 |
| 4-Person Families | 477 (13.3%) | $133,179 |
| 5-Person Families | 378 (10.5%) | $100,946 |
| 6-Person Families | 40 (1.1%) | $131,250 |
| 7+ Person Families | 136 (3.8%) | $116,508 |
| Total | 3,589 (100.0%) | $75,280 |
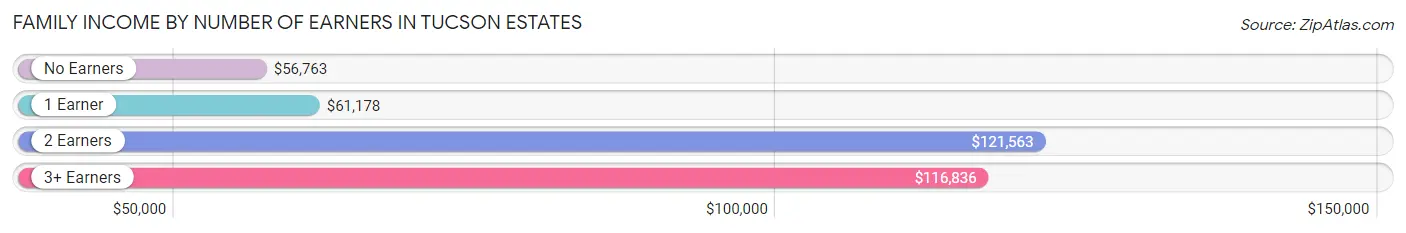
Family Income by Number of Earners in Tucson Estates
The median family income in Tucson Estates is $75,280, with families comprising 2 earners (946) having the highest median family income of $121,563, while families with no earners (1,398) have the lowest median family income of $56,763, accounting for 26.4% and 39.0% of families, respectively.
| Number of Earners | # Families | Median Income |
| No Earners | 1,398 (39.0%) | $56,763 |
| 1 Earner | 877 (24.4%) | $61,178 |
| 2 Earners | 946 (26.4%) | $121,563 |
| 3+ Earners | 368 (10.2%) | $116,836 |
| Total | 3,589 (100.0%) | $75,280 |
Household Income in Tucson Estates
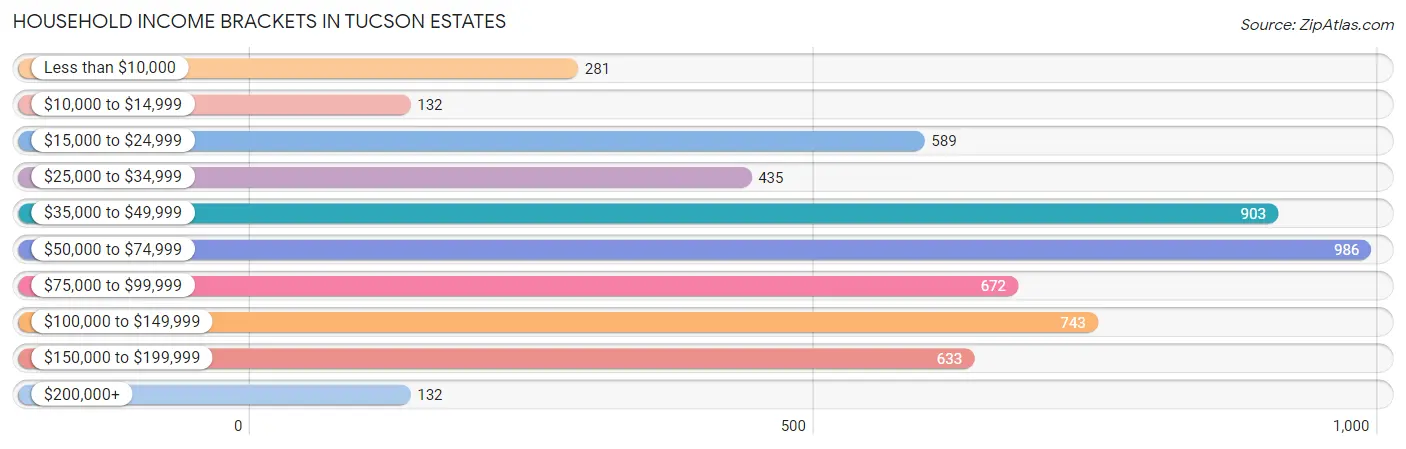
Household Income Brackets in Tucson Estates
With 986 households falling in the category, the $50,000 to $74,999 income range is the most frequent in Tucson Estates, accounting for 17.9% of all households. In contrast, only 132 households (2.4%) fall into the $10,000 to $14,999 income bracket, making it the least populous group.
| Income Bracket | # Households | % Households |
| Less than $10,000 | 281 | 5.1% |
| $10,000 to $14,999 | 132 | 2.4% |
| $15,000 to $24,999 | 589 | 10.7% |
| $25,000 to $34,999 | 435 | 7.9% |
| $35,000 to $49,999 | 903 | 16.4% |
| $50,000 to $74,999 | 986 | 17.9% |
| $75,000 to $99,999 | 672 | 12.2% |
| $100,000 to $149,999 | 743 | 13.5% |
| $150,000 to $199,999 | 633 | 11.5% |
| $200,000+ | 132 | 2.4% |
Household Income by Householder Age in Tucson Estates
The median household income in Tucson Estates is $61,545, with the highest median household income of $95,156 found in the 45 to 64 years age bracket for the primary householder. A total of 1,934 households (35.1%) fall into this category. Meanwhile, the 15 to 24 years age bracket for the primary householder has the lowest median household income of $0, with 101 households (1.8%) in this group.
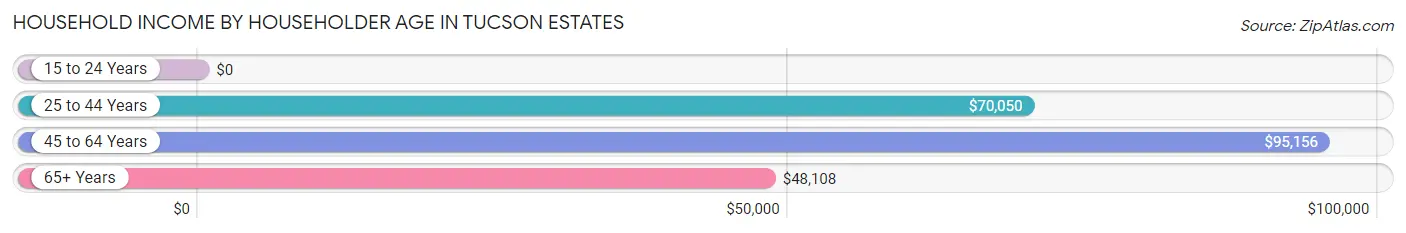
| Income Bracket | # Households | Median Income |
| 15 to 24 Years | 101 (1.8%) | $0 |
| 25 to 44 Years | 673 (12.2%) | $70,050 |
| 45 to 64 Years | 1,934 (35.1%) | $95,156 |
| 65+ Years | 2,799 (50.8%) | $48,108 |
| Total | 5,507 (100.0%) | $61,545 |
Poverty in Tucson Estates
Income Below Poverty by Sex and Age in Tucson Estates
With 9.5% poverty level for males and 8.4% for females among the residents of Tucson Estates, under 5 year old males and 55 to 64 year old females are the most vulnerable to poverty, with 44 males (84.6%) and 145 females (20.0%) in their respective age groups living below the poverty level.
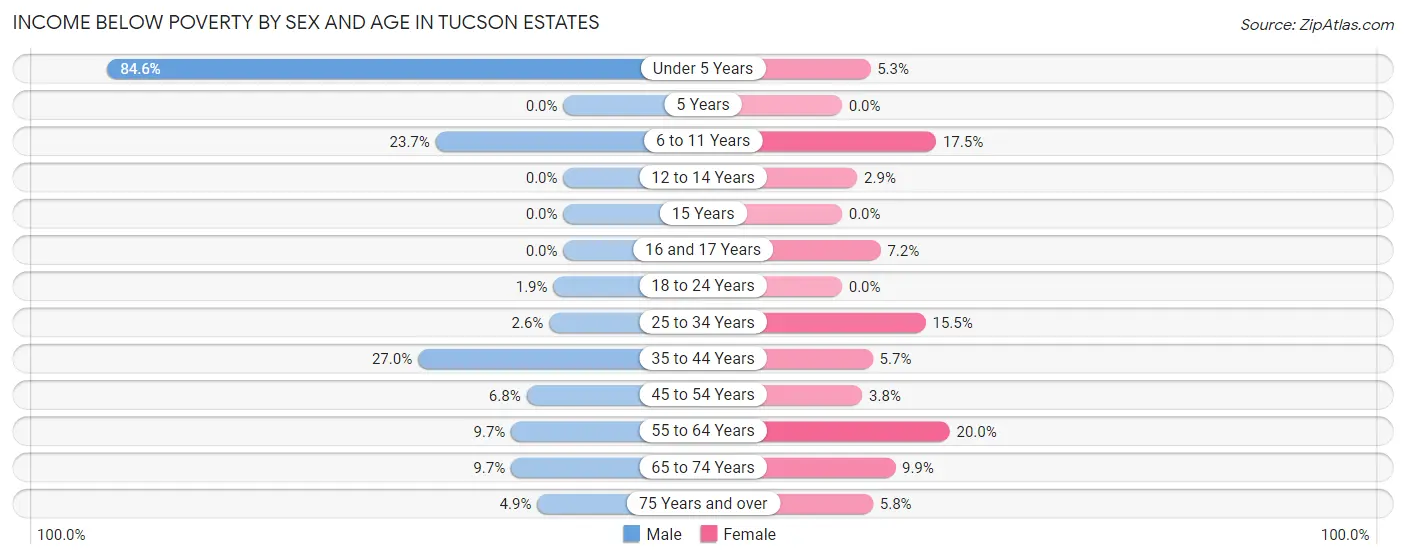
| Age Bracket | Male | Female |
| Under 5 Years | 44 (84.6%) | 14 (5.3%) |
| 5 Years | 0 (0.0%) | 0 (0.0%) |
| 6 to 11 Years | 78 (23.7%) | 50 (17.5%) |
| 12 to 14 Years | 0 (0.0%) | 10 (2.9%) |
| 15 Years | 0 (0.0%) | 0 (0.0%) |
| 16 and 17 Years | 0 (0.0%) | 14 (7.2%) |
| 18 to 24 Years | 12 (1.8%) | 0 (0.0%) |
| 25 to 34 Years | 11 (2.6%) | 76 (15.5%) |
| 35 to 44 Years | 150 (27.0%) | 26 (5.7%) |
| 45 to 54 Years | 70 (6.8%) | 32 (3.8%) |
| 55 to 64 Years | 72 (9.7%) | 145 (20.0%) |
| 65 to 74 Years | 110 (9.7%) | 105 (9.9%) |
| 75 Years and over | 43 (4.9%) | 77 (5.8%) |
| Total | 590 (9.5%) | 549 (8.4%) |
Income Above Poverty by Sex and Age in Tucson Estates
According to the poverty statistics in Tucson Estates, males aged 12 to 14 years and females aged 15 years are the age groups that are most secure financially, with 100.0% of males and 100.0% of females in these age groups living above the poverty line.
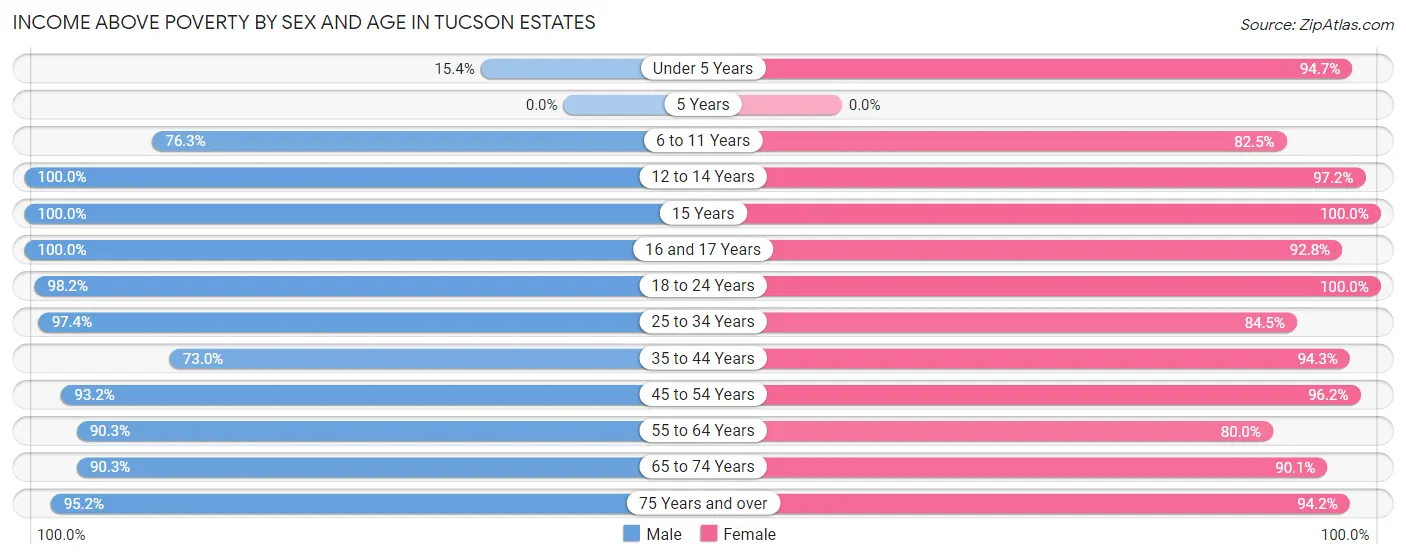
| Age Bracket | Male | Female |
| Under 5 Years | 8 (15.4%) | 251 (94.7%) |
| 5 Years | 0 (0.0%) | 0 (0.0%) |
| 6 to 11 Years | 251 (76.3%) | 236 (82.5%) |
| 12 to 14 Years | 344 (100.0%) | 341 (97.2%) |
| 15 Years | 11 (100.0%) | 44 (100.0%) |
| 16 and 17 Years | 91 (100.0%) | 181 (92.8%) |
| 18 to 24 Years | 635 (98.2%) | 508 (100.0%) |
| 25 to 34 Years | 407 (97.4%) | 413 (84.5%) |
| 35 to 44 Years | 406 (73.0%) | 428 (94.3%) |
| 45 to 54 Years | 954 (93.2%) | 815 (96.2%) |
| 55 to 64 Years | 672 (90.3%) | 580 (80.0%) |
| 65 to 74 Years | 1,022 (90.3%) | 958 (90.1%) |
| 75 Years and over | 843 (95.2%) | 1,257 (94.2%) |
| Total | 5,644 (90.5%) | 6,012 (91.6%) |
Income Below Poverty Among Married-Couple Families in Tucson Estates
The poverty statistics for married-couple families in Tucson Estates show that 2.9% or 82 of the total 2,871 families live below the poverty line. Families with no children have the highest poverty rate of 3.8%, comprising of 82 families. On the other hand, families with 1 or 2 children have the lowest poverty rate of 0.0%, which includes 0 families.
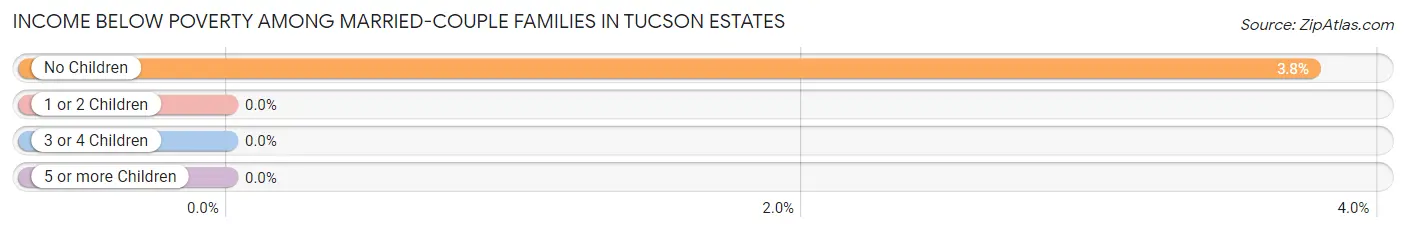
| Children | Above Poverty | Below Poverty |
| No Children | 2,094 (96.2%) | 82 (3.8%) |
| 1 or 2 Children | 545 (100.0%) | 0 (0.0%) |
| 3 or 4 Children | 99 (100.0%) | 0 (0.0%) |
| 5 or more Children | 51 (100.0%) | 0 (0.0%) |
| Total | 2,789 (97.1%) | 82 (2.9%) |
Income Below Poverty Among Single-Parent Households in Tucson Estates
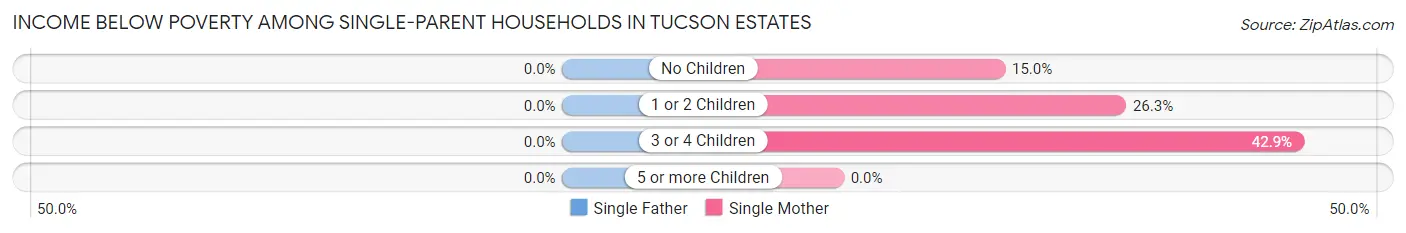
| Children | Single Father | Single Mother |
| No Children | 0 (0.0%) | 23 (15.0%) |
| 1 or 2 Children | 0 (0.0%) | 46 (26.3%) |
| 3 or 4 Children | 0 (0.0%) | 42 (42.9%) |
| 5 or more Children | 0 (0.0%) | 0 (0.0%) |
| Total | 0 (0.0%) | 111 (26.1%) |
Income Below Poverty Among Married-Couple vs Single-Parent Households in Tucson Estates
The poverty data for Tucson Estates shows that 82 of the married-couple family households (2.9%) and 111 of the single-parent households (15.5%) are living below the poverty level. Within the married-couple family households, those with no children have the highest poverty rate, with 82 households (3.8%) falling below the poverty line. Among the single-parent households, those with 3 or 4 children have the highest poverty rate, with 42 household (28.2%) living below poverty.
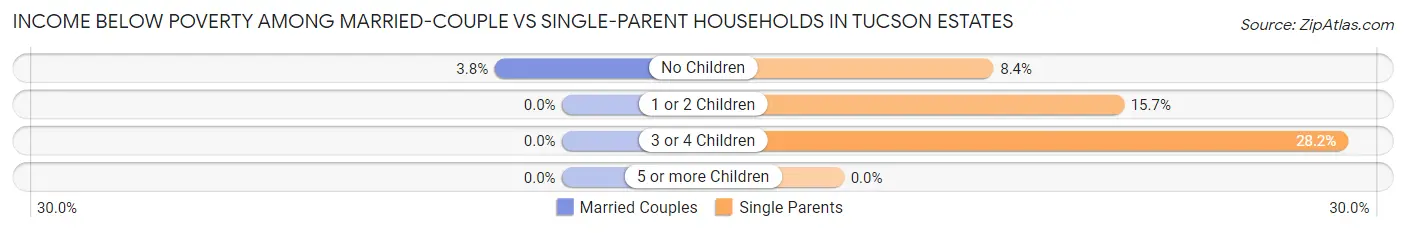
| Children | Married-Couple Families | Single-Parent Households |
| No Children | 82 (3.8%) | 23 (8.4%) |
| 1 or 2 Children | 0 (0.0%) | 46 (15.7%) |
| 3 or 4 Children | 0 (0.0%) | 42 (28.2%) |
| 5 or more Children | 0 (0.0%) | 0 (0.0%) |
| Total | 82 (2.9%) | 111 (15.5%) |
Race in Tucson Estates
The most populous races in Tucson Estates are White / Caucasian (8,718 | 68.1%), Hispanic or Latino (5,444 | 42.5%), and Some other Race (1,951 | 15.2%).
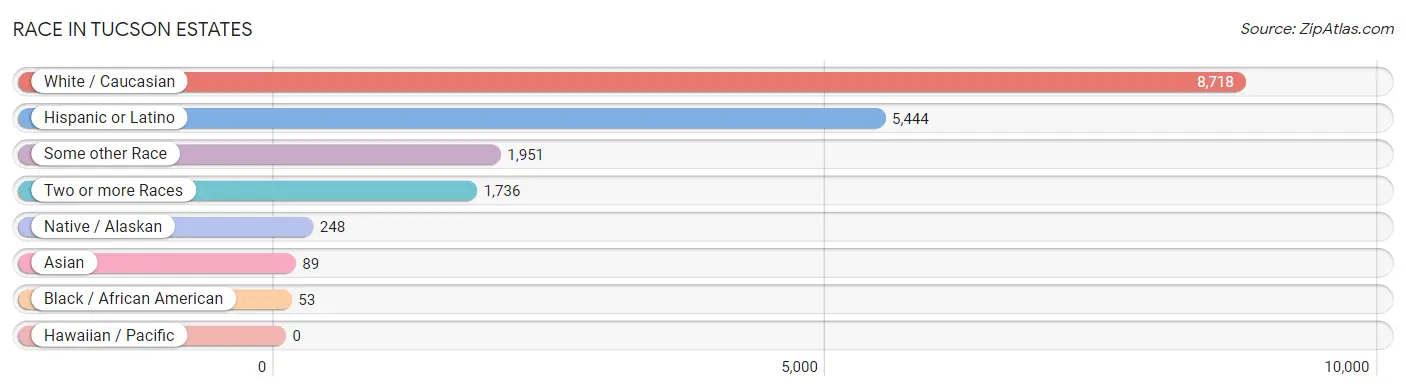
| Race | # Population | % Population |
| Asian | 89 | 0.7% |
| Black / African American | 53 | 0.4% |
| Hawaiian / Pacific | 0 | 0.0% |
| Hispanic or Latino | 5,444 | 42.5% |
| Native / Alaskan | 248 | 1.9% |
| White / Caucasian | 8,718 | 68.1% |
| Two or more Races | 1,736 | 13.6% |
| Some other Race | 1,951 | 15.2% |
| Total | 12,795 | 100.0% |
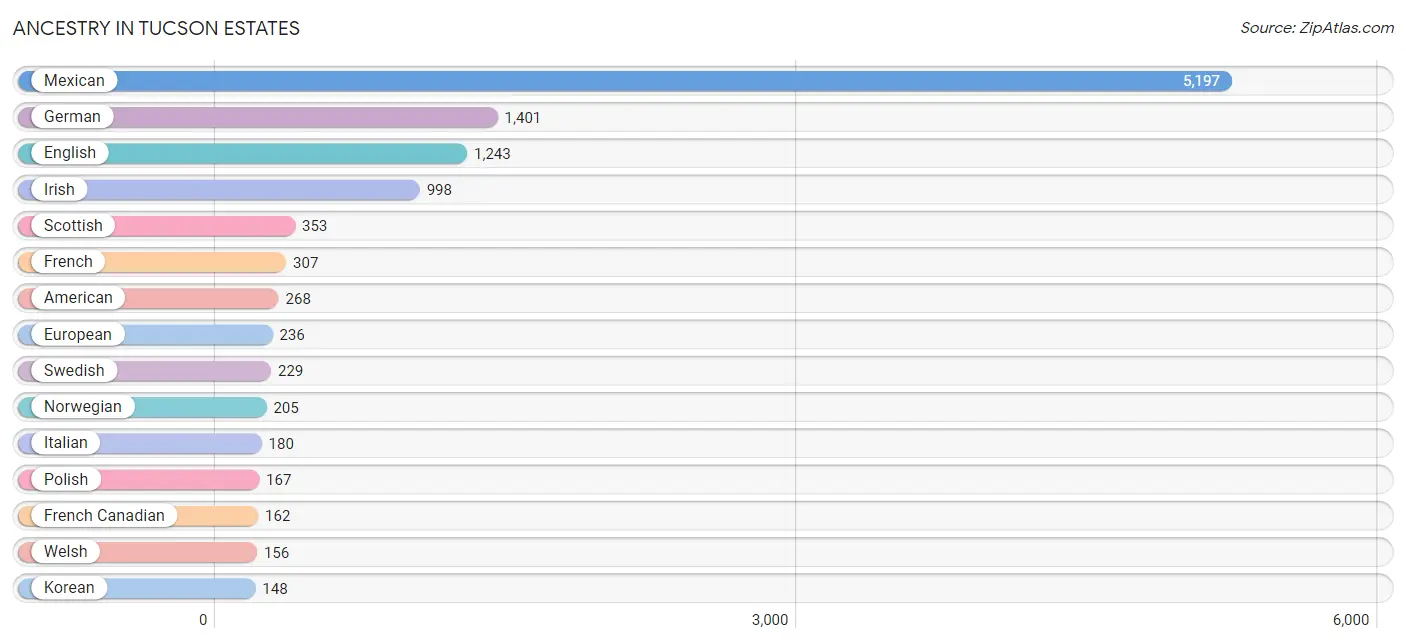
Ancestry in Tucson Estates
The most populous ancestries reported in Tucson Estates are Mexican (5,197 | 40.6%), German (1,401 | 11.0%), English (1,243 | 9.7%), Irish (998 | 7.8%), and Scottish (353 | 2.8%), together accounting for 71.8% of all Tucson Estates residents.
| Ancestry | # Population | % Population |
| American | 268 | 2.1% |
| Apache | 2 | 0.0% |
| Arab | 19 | 0.2% |
| Austrian | 25 | 0.2% |
| Belgian | 21 | 0.2% |
| Bhutanese | 18 | 0.1% |
| British | 73 | 0.6% |
| Canadian | 34 | 0.3% |
| Central American | 47 | 0.4% |
| Central American Indian | 12 | 0.1% |
| Cherokee | 18 | 0.1% |
| Choctaw | 5 | 0.0% |
| Croatian | 15 | 0.1% |
| Czech | 35 | 0.3% |
| Czechoslovakian | 8 | 0.1% |
| Danish | 39 | 0.3% |
| Dutch | 50 | 0.4% |
| Eastern European | 25 | 0.2% |
| English | 1,243 | 9.7% |
| European | 236 | 1.8% |
| Finnish | 34 | 0.3% |
| French | 307 | 2.4% |
| French Canadian | 162 | 1.3% |
| German | 1,401 | 11.0% |
| Greek | 27 | 0.2% |
| Guatemalan | 15 | 0.1% |
| Hungarian | 39 | 0.3% |
| Indian (Asian) | 62 | 0.5% |
| Irish | 998 | 7.8% |
| Iroquois | 8 | 0.1% |
| Italian | 180 | 1.4% |
| Korean | 148 | 1.2% |
| Luxembourger | 29 | 0.2% |
| Mexican | 5,197 | 40.6% |
| Navajo | 2 | 0.0% |
| Nicaraguan | 20 | 0.2% |
| Northern European | 66 | 0.5% |
| Norwegian | 205 | 1.6% |
| Ottawa | 11 | 0.1% |
| Panamanian | 12 | 0.1% |
| Polish | 167 | 1.3% |
| Portuguese | 11 | 0.1% |
| Pueblo | 28 | 0.2% |
| Russian | 16 | 0.1% |
| Scandinavian | 59 | 0.5% |
| Scotch-Irish | 118 | 0.9% |
| Scottish | 353 | 2.8% |
| Slavic | 13 | 0.1% |
| Slovak | 9 | 0.1% |
| Slovene | 15 | 0.1% |
| Spaniard | 87 | 0.7% |
| Spanish | 42 | 0.3% |
| Sri Lankan | 11 | 0.1% |
| Swedish | 229 | 1.8% |
| Thai | 16 | 0.1% |
| Tohono O'Odham | 28 | 0.2% |
| Ukrainian | 8 | 0.1% |
| Welsh | 156 | 1.2% |
| Yaqui | 75 | 0.6% |
| Yugoslavian | 20 | 0.2% | View All 60 Rows |
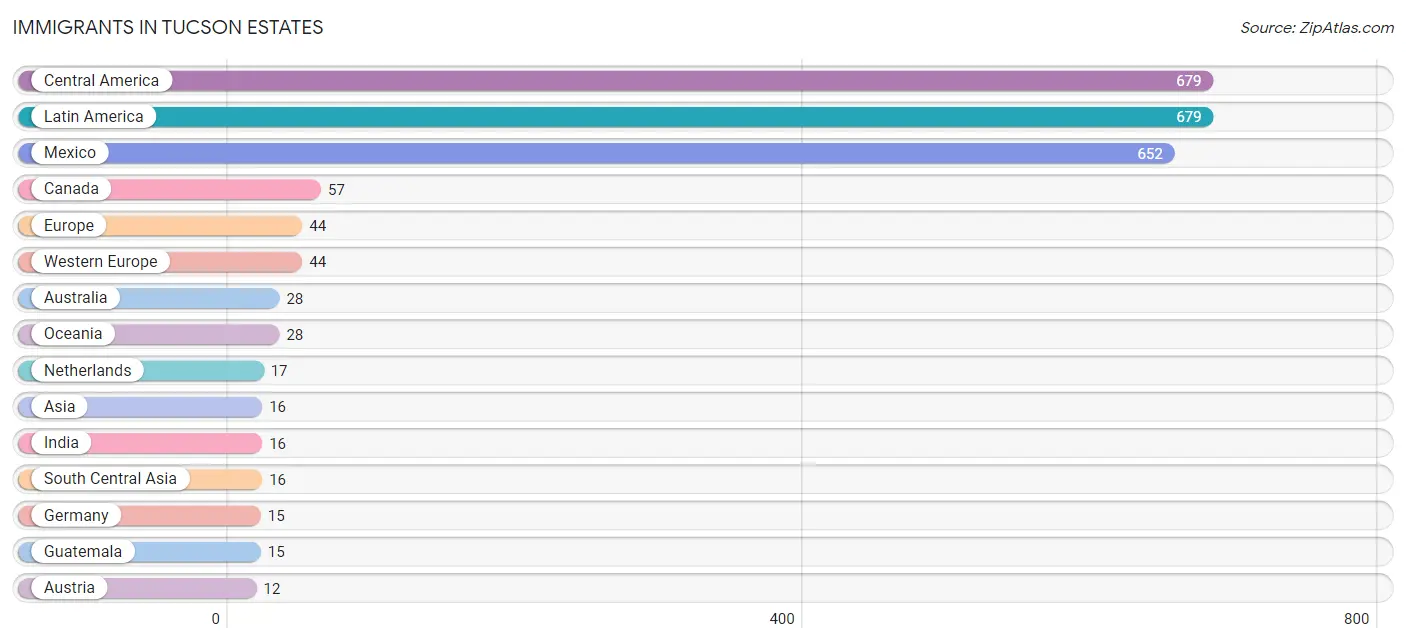
Immigrants in Tucson Estates
The most numerous immigrant groups reported in Tucson Estates came from Central America (679 | 5.3%), Latin America (679 | 5.3%), Mexico (652 | 5.1%), Canada (57 | 0.4%), and Europe (44 | 0.3%), together accounting for 16.5% of all Tucson Estates residents.
| Immigration Origin | # Population | % Population |
| Africa | 8 | 0.1% |
| Asia | 16 | 0.1% |
| Australia | 28 | 0.2% |
| Austria | 12 | 0.1% |
| Canada | 57 | 0.4% |
| Central America | 679 | 5.3% |
| Europe | 44 | 0.3% |
| Germany | 15 | 0.1% |
| Guatemala | 15 | 0.1% |
| India | 16 | 0.1% |
| Latin America | 679 | 5.3% |
| Mexico | 652 | 5.1% |
| Morocco | 8 | 0.1% |
| Netherlands | 17 | 0.1% |
| Northern Africa | 8 | 0.1% |
| Oceania | 28 | 0.2% |
| Panama | 12 | 0.1% |
| South Central Asia | 16 | 0.1% |
| Western Europe | 44 | 0.3% | View All 19 Rows |
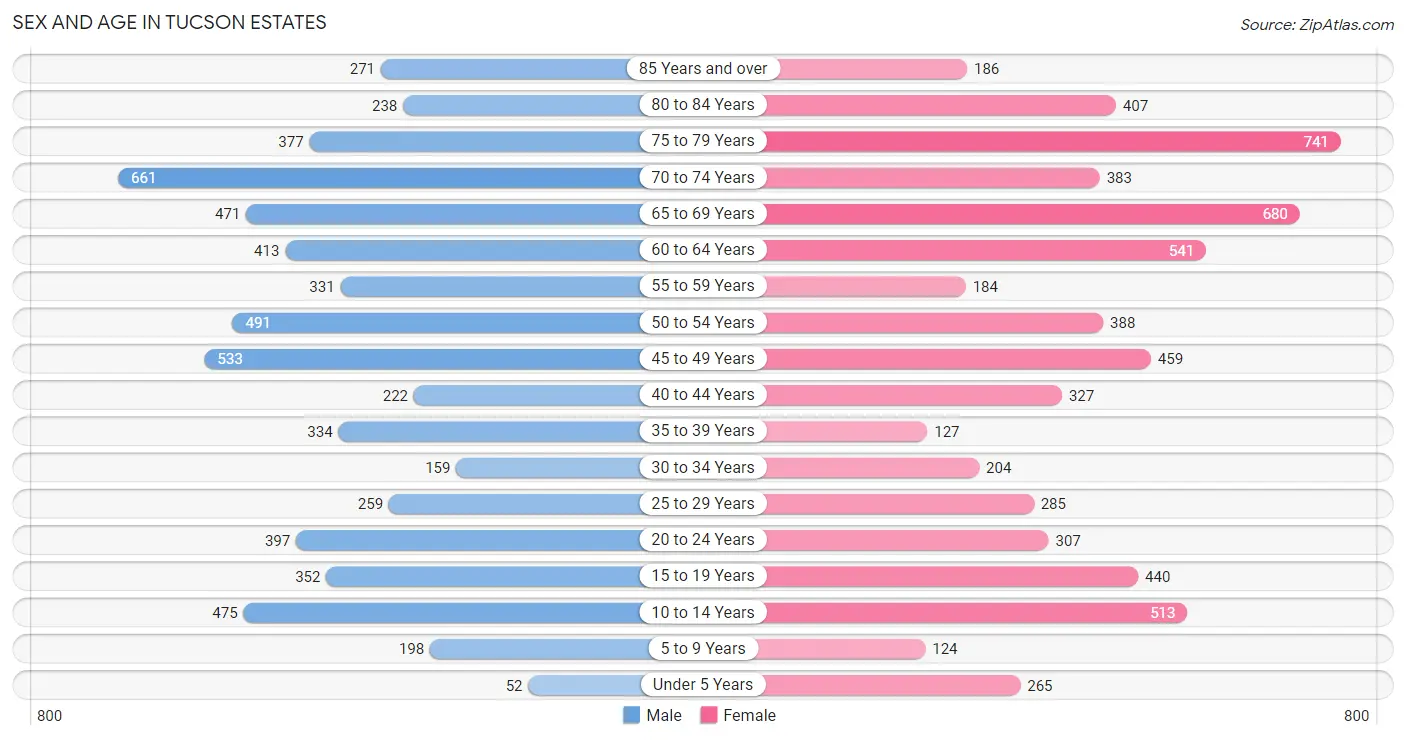
Sex and Age in Tucson Estates
Sex and Age in Tucson Estates
The most populous age groups in Tucson Estates are 70 to 74 Years (661 | 10.6%) for men and 75 to 79 Years (741 | 11.3%) for women.
| Age Bracket | Male | Female |
| Under 5 Years | 52 (0.8%) | 265 (4.0%) |
| 5 to 9 Years | 198 (3.2%) | 124 (1.9%) |
| 10 to 14 Years | 475 (7.6%) | 513 (7.8%) |
| 15 to 19 Years | 352 (5.7%) | 440 (6.7%) |
| 20 to 24 Years | 397 (6.4%) | 307 (4.7%) |
| 25 to 29 Years | 259 (4.2%) | 285 (4.3%) |
| 30 to 34 Years | 159 (2.5%) | 204 (3.1%) |
| 35 to 39 Years | 334 (5.4%) | 127 (1.9%) |
| 40 to 44 Years | 222 (3.6%) | 327 (5.0%) |
| 45 to 49 Years | 533 (8.6%) | 459 (7.0%) |
| 50 to 54 Years | 491 (7.9%) | 388 (5.9%) |
| 55 to 59 Years | 331 (5.3%) | 184 (2.8%) |
| 60 to 64 Years | 413 (6.6%) | 541 (8.3%) |
| 65 to 69 Years | 471 (7.6%) | 680 (10.4%) |
| 70 to 74 Years | 661 (10.6%) | 383 (5.8%) |
| 75 to 79 Years | 377 (6.0%) | 741 (11.3%) |
| 80 to 84 Years | 238 (3.8%) | 407 (6.2%) |
| 85 Years and over | 271 (4.3%) | 186 (2.8%) |
| Total | 6,234 (100.0%) | 6,561 (100.0%) |
Families and Households in Tucson Estates
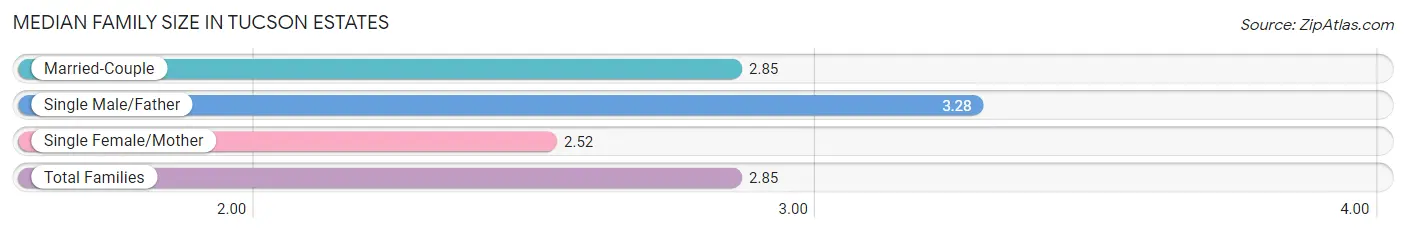
Median Family Size in Tucson Estates
The median family size in Tucson Estates is 2.85 persons per family, with single male/father families (292 | 8.1%) accounting for the largest median family size of 3.28 persons per family. On the other hand, single female/mother families (426 | 11.9%) represent the smallest median family size with 2.52 persons per family.
| Family Type | # Families | Family Size |
| Married-Couple | 2,871 (80.0%) | 2.85 |
| Single Male/Father | 292 (8.1%) | 3.28 |
| Single Female/Mother | 426 (11.9%) | 2.52 |
| Total Families | 3,589 (100.0%) | 2.85 |
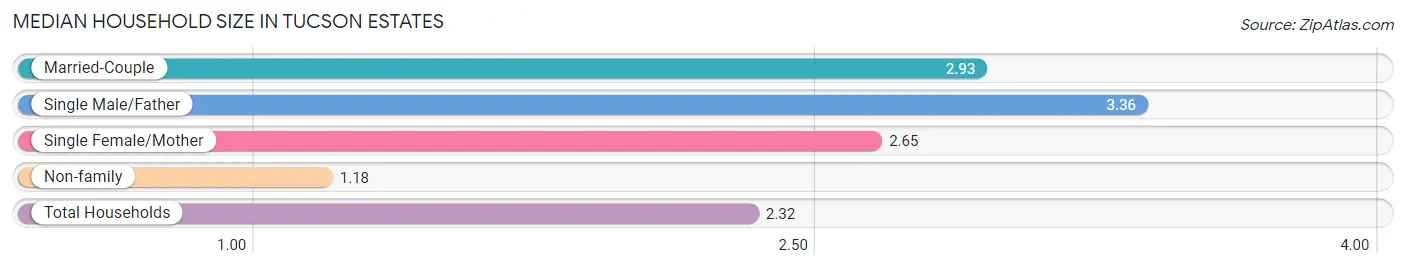
Median Household Size in Tucson Estates
The median household size in Tucson Estates is 2.32 persons per household, with single male/father households (292 | 5.3%) accounting for the largest median household size of 3.36 persons per household. non-family households (1,918 | 34.8%) represent the smallest median household size with 1.18 persons per household.
| Household Type | # Households | Household Size |
| Married-Couple | 2,871 (52.1%) | 2.93 |
| Single Male/Father | 292 (5.3%) | 3.36 |
| Single Female/Mother | 426 (7.7%) | 2.65 |
| Non-family | 1,918 (34.8%) | 1.18 |
| Total Households | 5,507 (100.0%) | 2.32 |
Household Size by Marriage Status in Tucson Estates
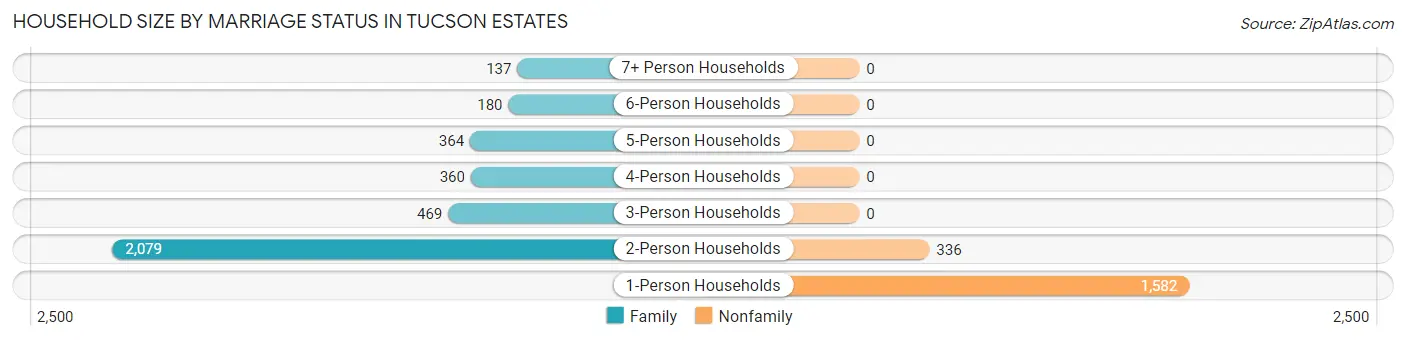
Out of a total of 5,507 households in Tucson Estates, 3,589 (65.2%) are family households, while 1,918 (34.8%) are nonfamily households. The most numerous type of family households are 2-person households, comprising 2,079, and the most common type of nonfamily households are 1-person households, comprising 1,582.
| Household Size | Family Households | Nonfamily Households |
| 1-Person Households | - | 1,582 (28.7%) |
| 2-Person Households | 2,079 (37.8%) | 336 (6.1%) |
| 3-Person Households | 469 (8.5%) | 0 (0.0%) |
| 4-Person Households | 360 (6.5%) | 0 (0.0%) |
| 5-Person Households | 364 (6.6%) | 0 (0.0%) |
| 6-Person Households | 180 (3.3%) | 0 (0.0%) |
| 7+ Person Households | 137 (2.5%) | 0 (0.0%) |
| Total | 3,589 (65.2%) | 1,918 (34.8%) |
Female Fertility in Tucson Estates
Fertility by Age in Tucson Estates
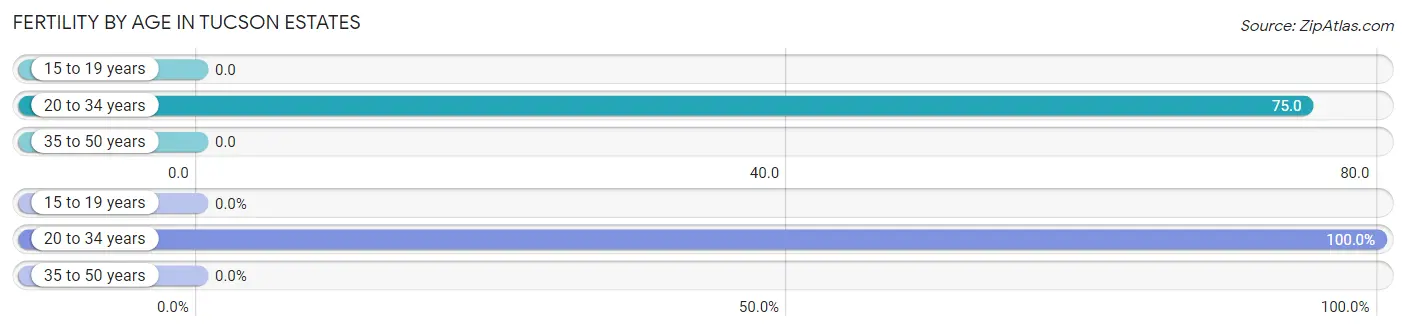
Average fertility rate in Tucson Estates is 28.0 births per 1,000 women. Women in the age bracket of 20 to 34 years have the highest fertility rate with 75.0 births per 1,000 women. Women in the age bracket of 20 to 34 years acount for 100.0% of all women with births.
| Age Bracket | Women with Births | Births / 1,000 Women |
| 15 to 19 years | 0 (0.0%) | 0.0 |
| 20 to 34 years | 60 (100.0%) | 75.0 |
| 35 to 50 years | 0 (0.0%) | 0.0 |
| Total | 60 (100.0%) | 28.0 |
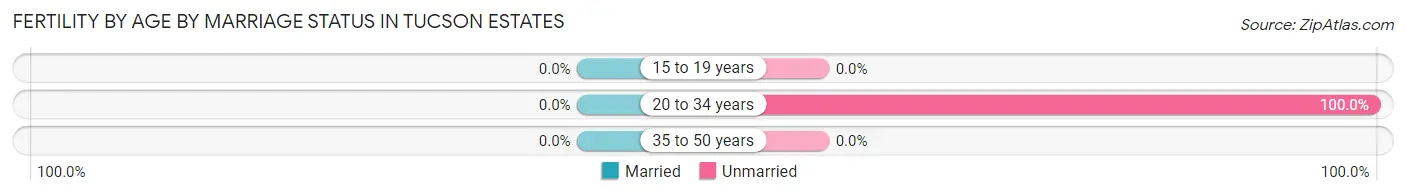
Fertility by Age by Marriage Status in Tucson Estates
| Age Bracket | Married | Unmarried |
| 15 to 19 years | 0 (0.0%) | 0 (0.0%) |
| 20 to 34 years | 0 (0.0%) | 60 (100.0%) |
| 35 to 50 years | 0 (0.0%) | 0 (0.0%) |
| Total | 0 (0.0%) | 60 (100.0%) |
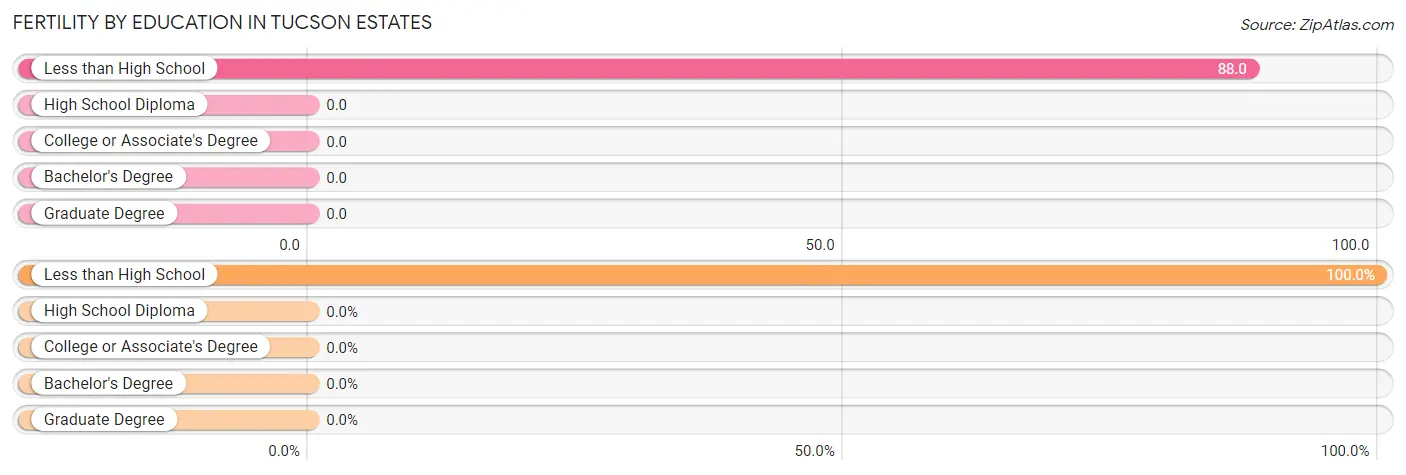
Fertility by Education in Tucson Estates
| Educational Attainment | Women with Births | Births / 1,000 Women |
| Less than High School | 60 (100.0%) | 88.0 |
| High School Diploma | 0 (0.0%) | 0.0 |
| College or Associate's Degree | 0 (0.0%) | 0.0 |
| Bachelor's Degree | 0 (0.0%) | 0.0 |
| Graduate Degree | 0 (0.0%) | 0.0 |
| Total | 60 (100.0%) | 28.0 |
Fertility by Education by Marriage Status in Tucson Estates
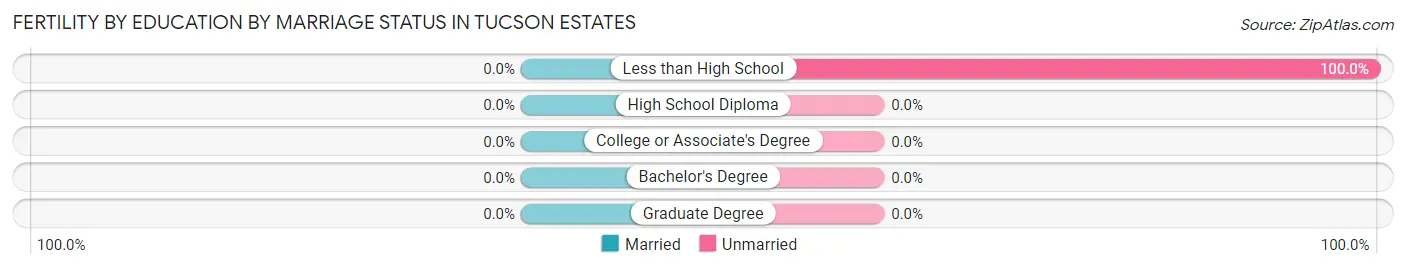
| Educational Attainment | Married | Unmarried |
| Less than High School | 0 (0.0%) | 60 (100.0%) |
| High School Diploma | 0 (0.0%) | 0 (0.0%) |
| College or Associate's Degree | 0 (0.0%) | 0 (0.0%) |
| Bachelor's Degree | 0 (0.0%) | 0 (0.0%) |
| Graduate Degree | 0 (0.0%) | 0 (0.0%) |
| Total | 0 (0.0%) | 60 (100.0%) |
Employment Characteristics in Tucson Estates
Employment by Class of Employer in Tucson Estates
Among the 4,385 employed individuals in Tucson Estates, private company employees (2,660 | 60.7%), not-for-profit organizations (389 | 8.9%), and federal government employees (342 | 7.8%) make up the most common classes of employment.
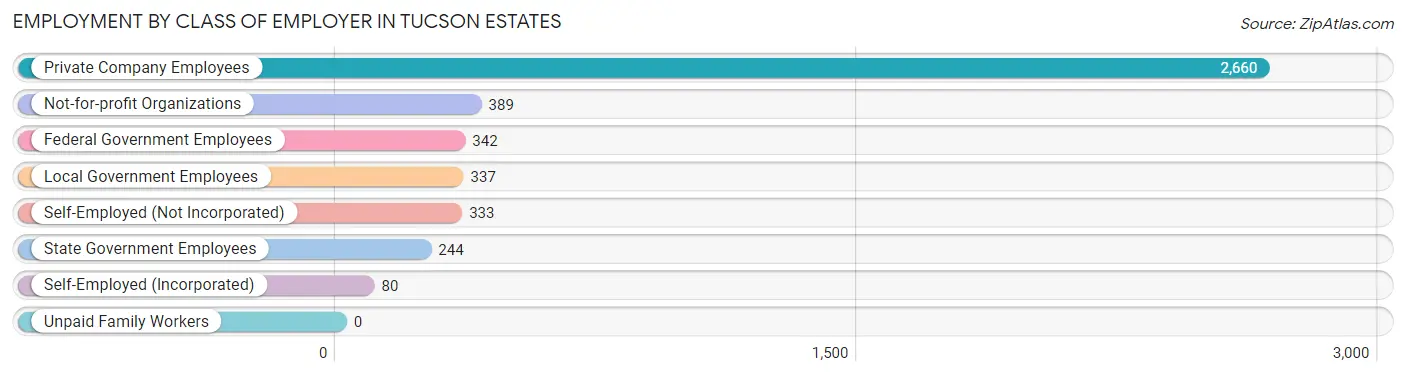
| Employer Class | # Employees | % Employees |
| Private Company Employees | 2,660 | 60.7% |
| Self-Employed (Incorporated) | 80 | 1.8% |
| Self-Employed (Not Incorporated) | 333 | 7.6% |
| Not-for-profit Organizations | 389 | 8.9% |
| Local Government Employees | 337 | 7.7% |
| State Government Employees | 244 | 5.6% |
| Federal Government Employees | 342 | 7.8% |
| Unpaid Family Workers | 0 | 0.0% |
| Total | 4,385 | 100.0% |
Employment Status by Age in Tucson Estates
According to the labor force statistics for Tucson Estates, out of the total population over 16 years of age (11,113), 41.5% or 4,612 individuals are in the labor force, with 3.3% or 152 of them unemployed. The age group with the highest labor force participation rate is 25 to 29 years, with 86.0% or 468 individuals in the labor force. Within the labor force, the 16 to 19 years age range has the highest percentage of unemployed individuals, with 13.0% or 32 of them being unemployed.
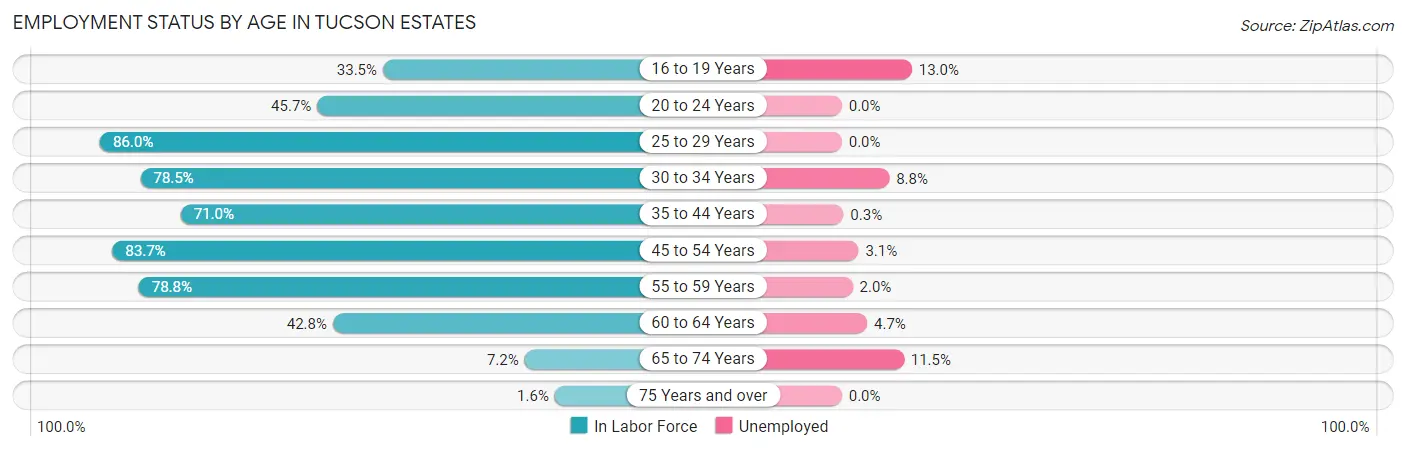
| Age Bracket | In Labor Force | Unemployed |
| 16 to 19 Years | 247 (33.5%) | 32 (13.0%) |
| 20 to 24 Years | 322 (45.7%) | 0 (0.0%) |
| 25 to 29 Years | 468 (86.0%) | 0 (0.0%) |
| 30 to 34 Years | 285 (78.5%) | 25 (8.8%) |
| 35 to 44 Years | 717 (71.0%) | 2 (0.3%) |
| 45 to 54 Years | 1,566 (83.7%) | 49 (3.1%) |
| 55 to 59 Years | 406 (78.8%) | 8 (2.0%) |
| 60 to 64 Years | 408 (42.8%) | 19 (4.7%) |
| 65 to 74 Years | 158 (7.2%) | 18 (11.5%) |
| 75 Years and over | 36 (1.6%) | 0 (0.0%) |
| Total | 4,612 (41.5%) | 152 (3.3%) |
Employment Status by Educational Attainment in Tucson Estates
According to labor force statistics for Tucson Estates, 73.2% of individuals (3,848) out of the total population between 25 and 64 years of age (5,257) are in the labor force, with 2.6% or 100 of them being unemployed. The group with the highest labor force participation rate are those with the educational attainment of bachelor's degree or higher, with 88.3% or 1,106 individuals in the labor force. Within the labor force, individuals with less than high school education have the highest percentage of unemployment, with 9.4% or 34 of them being unemployed.
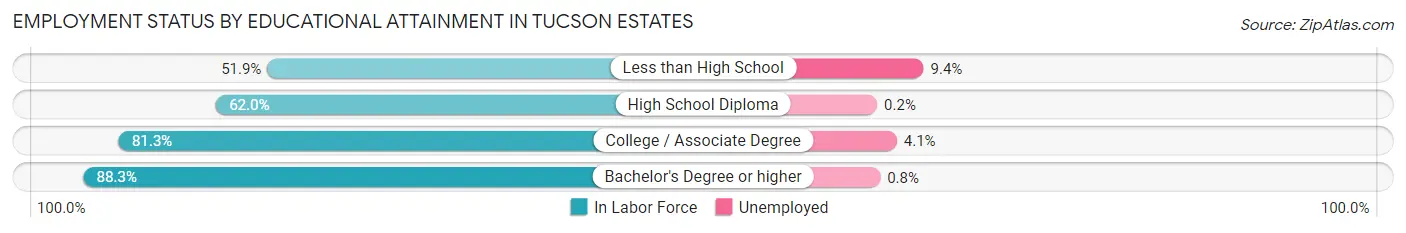
| Educational Attainment | In Labor Force | Unemployed |
| Less than High School | 362 (51.9%) | 66 (9.4%) |
| High School Diploma | 983 (62.0%) | 3 (0.2%) |
| College / Associate Degree | 1,400 (81.3%) | 71 (4.1%) |
| Bachelor's Degree or higher | 1,106 (88.3%) | 10 (0.8%) |
| Total | 3,848 (73.2%) | 137 (2.6%) |
Employment Occupations by Sex in Tucson Estates
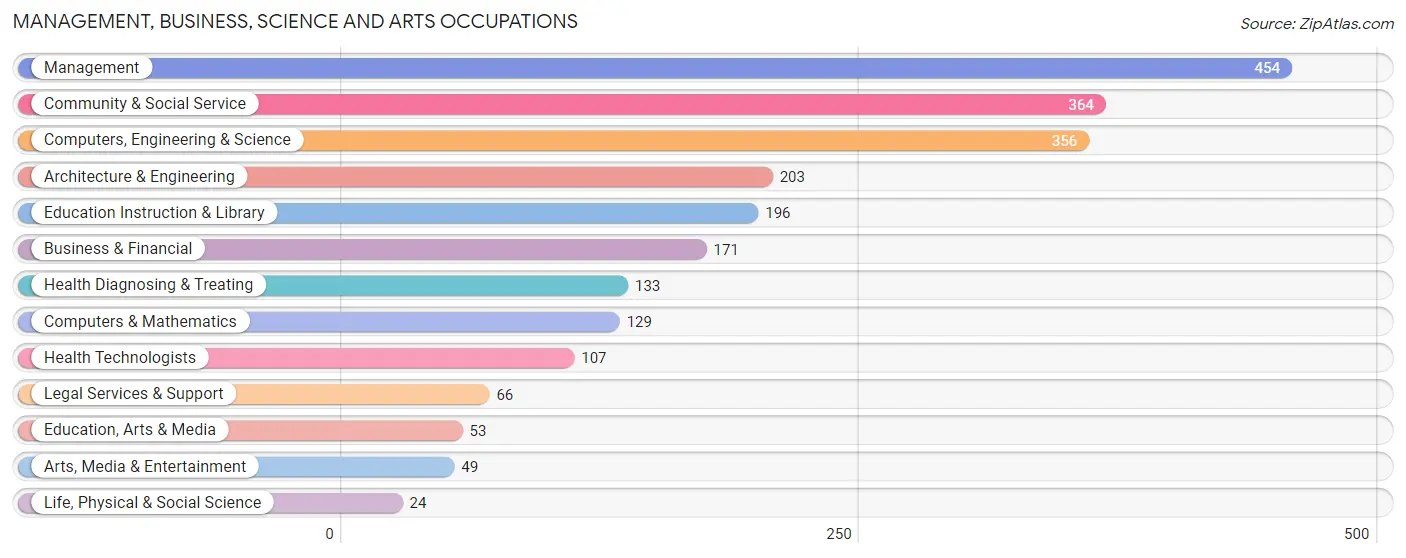
Management, Business, Science and Arts Occupations
The most common Management, Business, Science and Arts occupations in Tucson Estates are Management (454 | 10.2%), Community & Social Service (364 | 8.2%), Computers, Engineering & Science (356 | 8.0%), Architecture & Engineering (203 | 4.5%), and Education Instruction & Library (196 | 4.4%).
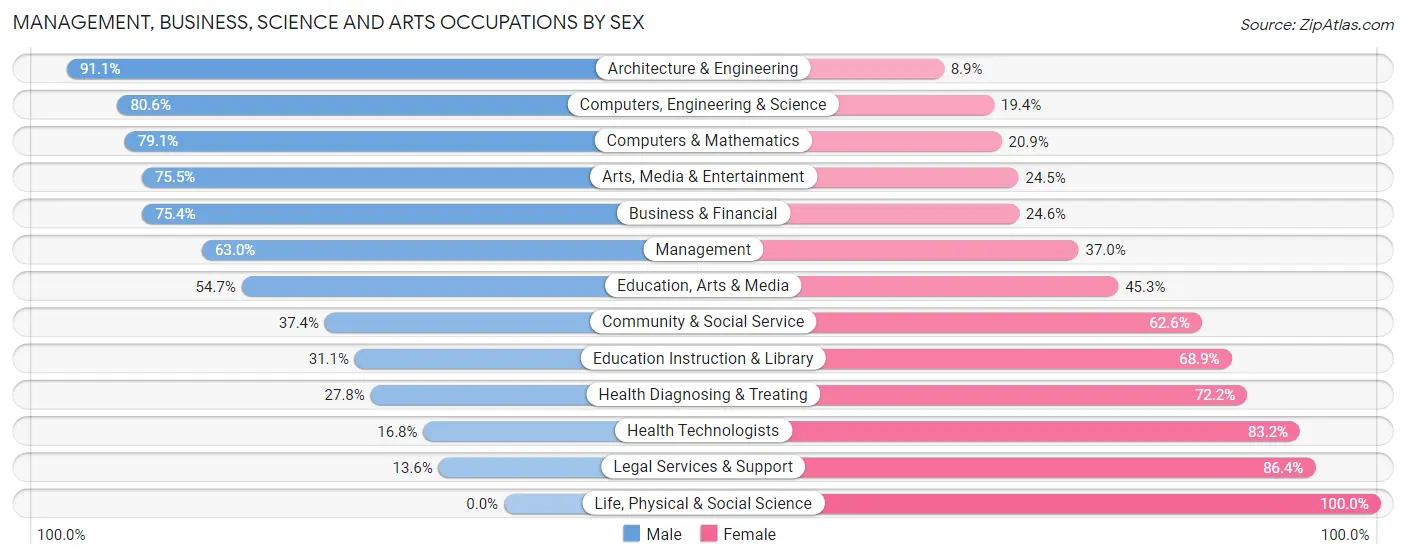
Management, Business, Science and Arts Occupations by Sex
Within the Management, Business, Science and Arts occupations in Tucson Estates, the most male-oriented occupations are Architecture & Engineering (91.1%), Computers, Engineering & Science (80.6%), and Computers & Mathematics (79.1%), while the most female-oriented occupations are Life, Physical & Social Science (100.0%), Legal Services & Support (86.4%), and Health Technologists (83.2%).
| Occupation | Male | Female |
| Management | 286 (63.0%) | 168 (37.0%) |
| Business & Financial | 129 (75.4%) | 42 (24.6%) |
| Computers, Engineering & Science | 287 (80.6%) | 69 (19.4%) |
| Computers & Mathematics | 102 (79.1%) | 27 (20.9%) |
| Architecture & Engineering | 185 (91.1%) | 18 (8.9%) |
| Life, Physical & Social Science | 0 (0.0%) | 24 (100.0%) |
| Community & Social Service | 136 (37.4%) | 228 (62.6%) |
| Education, Arts & Media | 29 (54.7%) | 24 (45.3%) |
| Legal Services & Support | 9 (13.6%) | 57 (86.4%) |
| Education Instruction & Library | 61 (31.1%) | 135 (68.9%) |
| Arts, Media & Entertainment | 37 (75.5%) | 12 (24.5%) |
| Health Diagnosing & Treating | 37 (27.8%) | 96 (72.2%) |
| Health Technologists | 18 (16.8%) | 89 (83.2%) |
| Total (Category) | 875 (59.2%) | 603 (40.8%) |
| Total (Overall) | 2,524 (56.6%) | 1,936 (43.4%) |
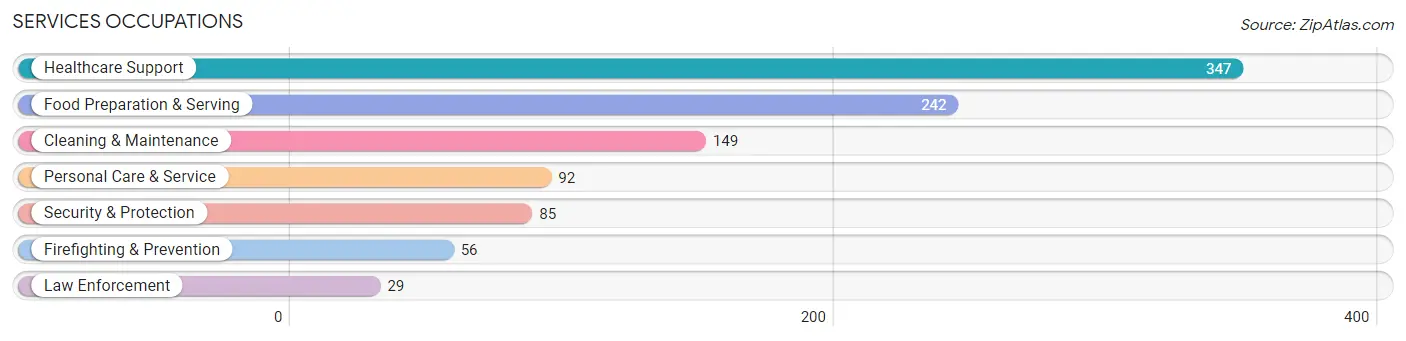
Services Occupations
The most common Services occupations in Tucson Estates are Healthcare Support (347 | 7.8%), Food Preparation & Serving (242 | 5.4%), Cleaning & Maintenance (149 | 3.3%), Personal Care & Service (92 | 2.1%), and Security & Protection (85 | 1.9%).
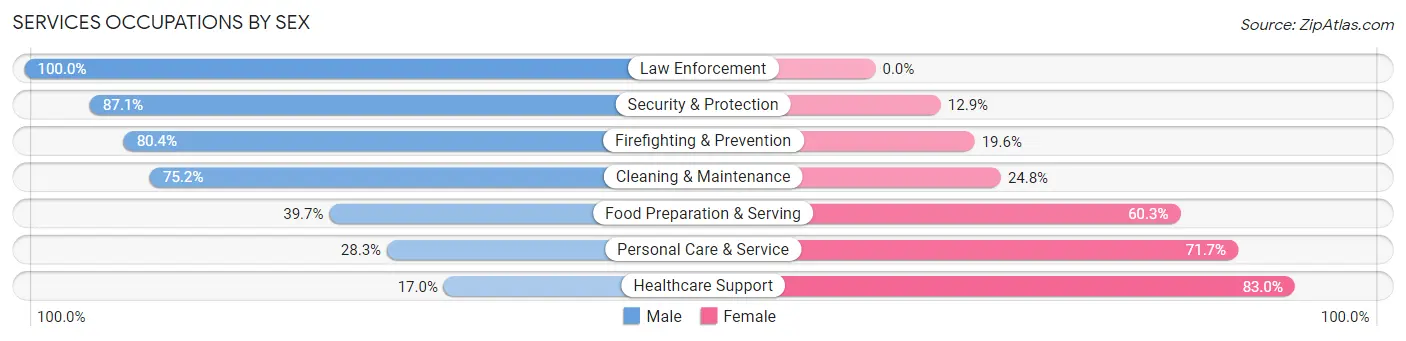
Services Occupations by Sex
Within the Services occupations in Tucson Estates, the most male-oriented occupations are Law Enforcement (100.0%), Security & Protection (87.1%), and Firefighting & Prevention (80.4%), while the most female-oriented occupations are Healthcare Support (83.0%), Personal Care & Service (71.7%), and Food Preparation & Serving (60.3%).
| Occupation | Male | Female |
| Healthcare Support | 59 (17.0%) | 288 (83.0%) |
| Security & Protection | 74 (87.1%) | 11 (12.9%) |
| Firefighting & Prevention | 45 (80.4%) | 11 (19.6%) |
| Law Enforcement | 29 (100.0%) | 0 (0.0%) |
| Food Preparation & Serving | 96 (39.7%) | 146 (60.3%) |
| Cleaning & Maintenance | 112 (75.2%) | 37 (24.8%) |
| Personal Care & Service | 26 (28.3%) | 66 (71.7%) |
| Total (Category) | 367 (40.1%) | 548 (59.9%) |
| Total (Overall) | 2,524 (56.6%) | 1,936 (43.4%) |
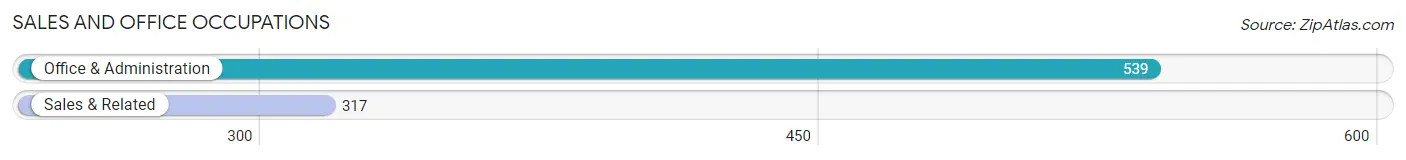
Sales and Office Occupations
The most common Sales and Office occupations in Tucson Estates are Office & Administration (539 | 12.1%), and Sales & Related (317 | 7.1%).
Sales and Office Occupations by Sex
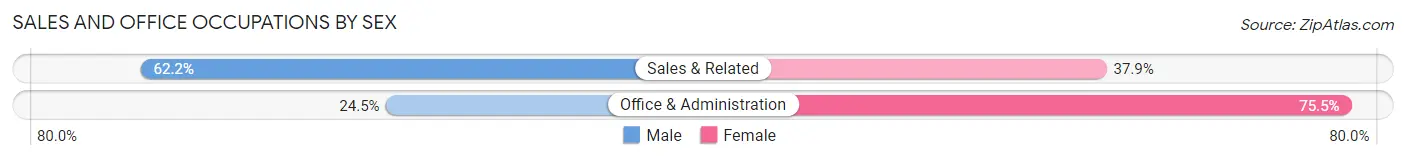
| Occupation | Male | Female |
| Sales & Related | 197 (62.2%) | 120 (37.9%) |
| Office & Administration | 132 (24.5%) | 407 (75.5%) |
| Total (Category) | 329 (38.4%) | 527 (61.6%) |
| Total (Overall) | 2,524 (56.6%) | 1,936 (43.4%) |
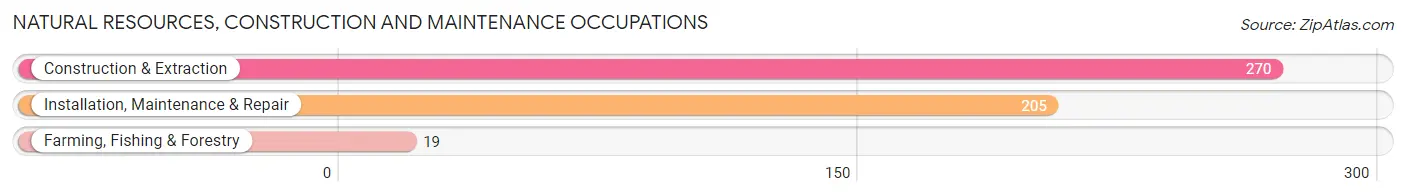
Natural Resources, Construction and Maintenance Occupations
The most common Natural Resources, Construction and Maintenance occupations in Tucson Estates are Construction & Extraction (270 | 6.0%), Installation, Maintenance & Repair (205 | 4.6%), and Farming, Fishing & Forestry (19 | 0.4%).
Natural Resources, Construction and Maintenance Occupations by Sex
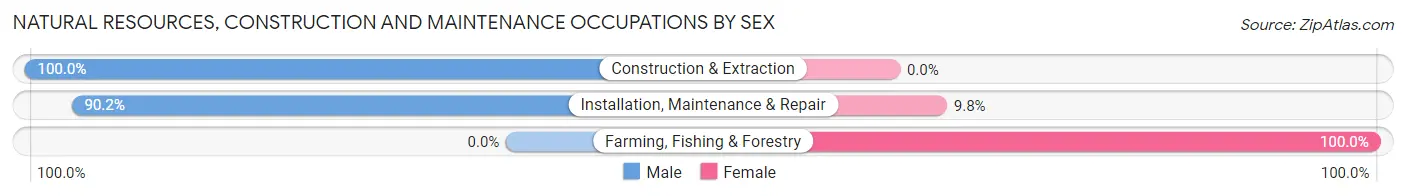
| Occupation | Male | Female |
| Farming, Fishing & Forestry | 0 (0.0%) | 19 (100.0%) |
| Construction & Extraction | 270 (100.0%) | 0 (0.0%) |
| Installation, Maintenance & Repair | 185 (90.2%) | 20 (9.8%) |
| Total (Category) | 455 (92.1%) | 39 (7.9%) |
| Total (Overall) | 2,524 (56.6%) | 1,936 (43.4%) |
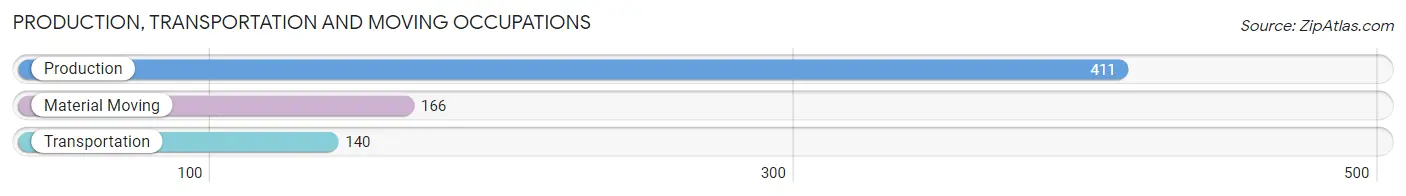
Production, Transportation and Moving Occupations
The most common Production, Transportation and Moving occupations in Tucson Estates are Production (411 | 9.2%), Material Moving (166 | 3.7%), and Transportation (140 | 3.1%).
Production, Transportation and Moving Occupations by Sex
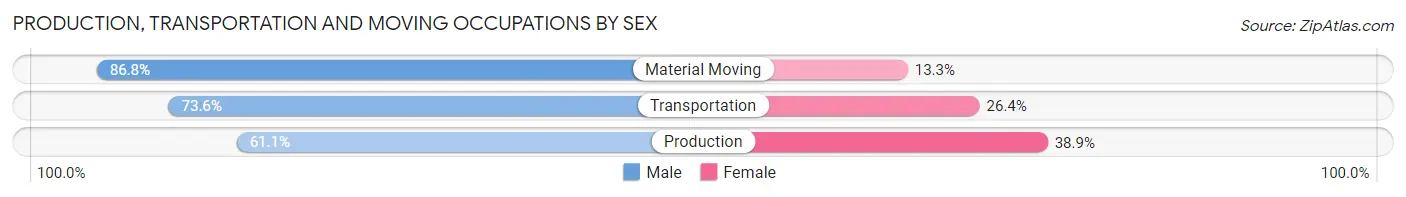
| Occupation | Male | Female |
| Production | 251 (61.1%) | 160 (38.9%) |
| Transportation | 103 (73.6%) | 37 (26.4%) |
| Material Moving | 144 (86.8%) | 22 (13.3%) |
| Total (Category) | 498 (69.5%) | 219 (30.5%) |
| Total (Overall) | 2,524 (56.6%) | 1,936 (43.4%) |
Employment Industries by Sex in Tucson Estates
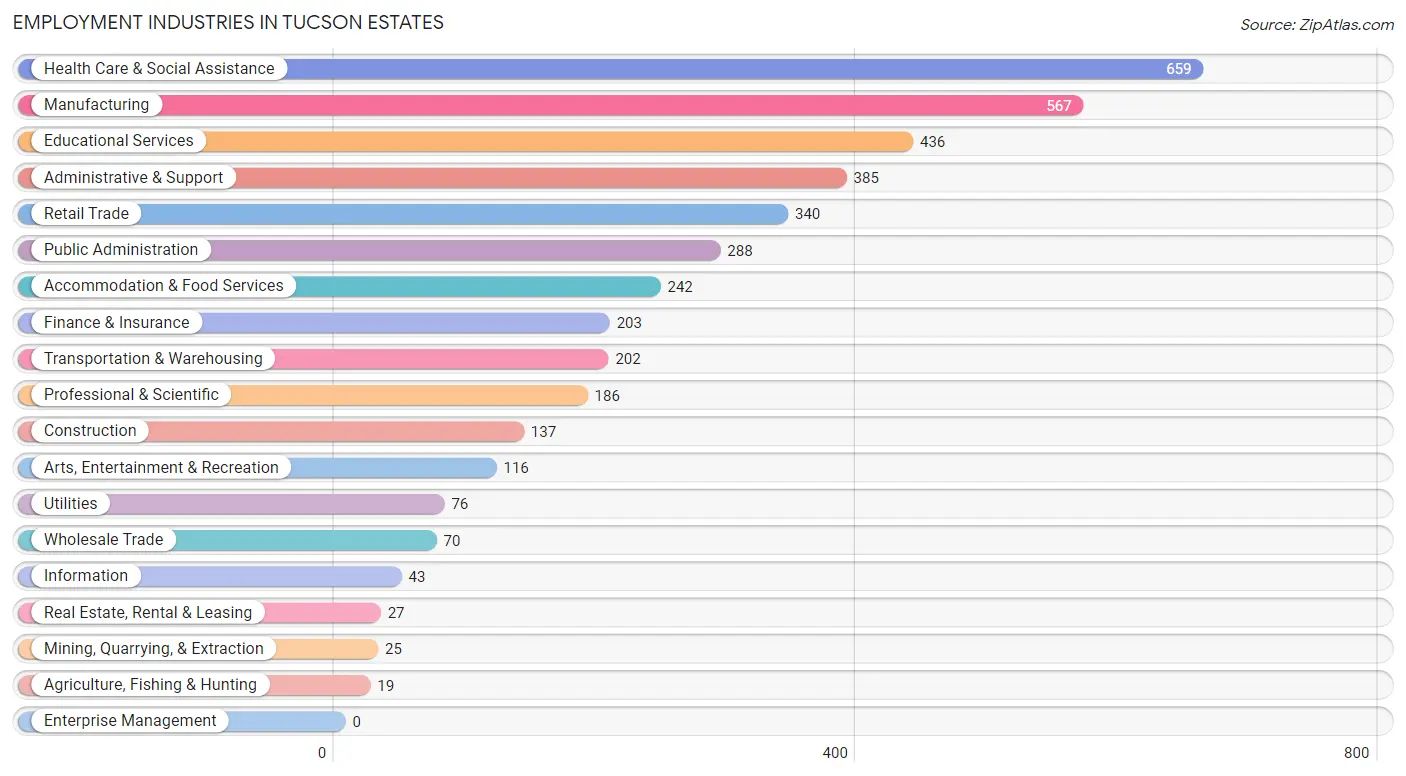
Employment Industries in Tucson Estates
The major employment industries in Tucson Estates include Health Care & Social Assistance (659 | 14.8%), Manufacturing (567 | 12.7%), Educational Services (436 | 9.8%), Administrative & Support (385 | 8.6%), and Retail Trade (340 | 7.6%).
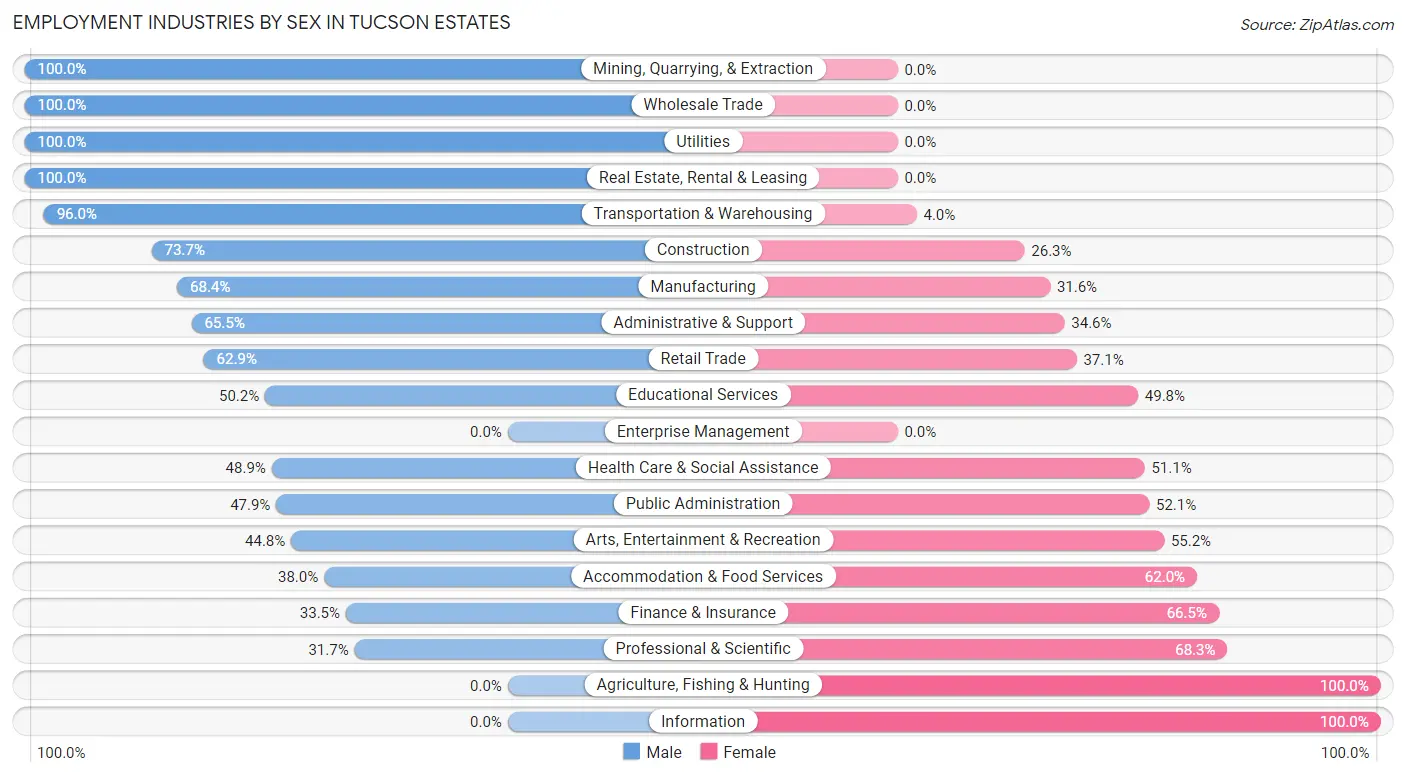
Employment Industries by Sex in Tucson Estates
The Tucson Estates industries that see more men than women are Mining, Quarrying, & Extraction (100.0%), Wholesale Trade (100.0%), and Utilities (100.0%), whereas the industries that tend to have a higher number of women are Agriculture, Fishing & Hunting (100.0%), Information (100.0%), and Professional & Scientific (68.3%).
| Industry | Male | Female |
| Agriculture, Fishing & Hunting | 0 (0.0%) | 19 (100.0%) |
| Mining, Quarrying, & Extraction | 25 (100.0%) | 0 (0.0%) |
| Construction | 101 (73.7%) | 36 (26.3%) |
| Manufacturing | 388 (68.4%) | 179 (31.6%) |
| Wholesale Trade | 70 (100.0%) | 0 (0.0%) |
| Retail Trade | 214 (62.9%) | 126 (37.1%) |
| Transportation & Warehousing | 194 (96.0%) | 8 (4.0%) |
| Utilities | 76 (100.0%) | 0 (0.0%) |
| Information | 0 (0.0%) | 43 (100.0%) |
| Finance & Insurance | 68 (33.5%) | 135 (66.5%) |
| Real Estate, Rental & Leasing | 27 (100.0%) | 0 (0.0%) |
| Professional & Scientific | 59 (31.7%) | 127 (68.3%) |
| Enterprise Management | 0 (0.0%) | 0 (0.0%) |
| Administrative & Support | 252 (65.4%) | 133 (34.5%) |
| Educational Services | 219 (50.2%) | 217 (49.8%) |
| Health Care & Social Assistance | 322 (48.9%) | 337 (51.1%) |
| Arts, Entertainment & Recreation | 52 (44.8%) | 64 (55.2%) |
| Accommodation & Food Services | 92 (38.0%) | 150 (62.0%) |
| Public Administration | 138 (47.9%) | 150 (52.1%) |
| Total | 2,524 (56.6%) | 1,936 (43.4%) |
Education in Tucson Estates
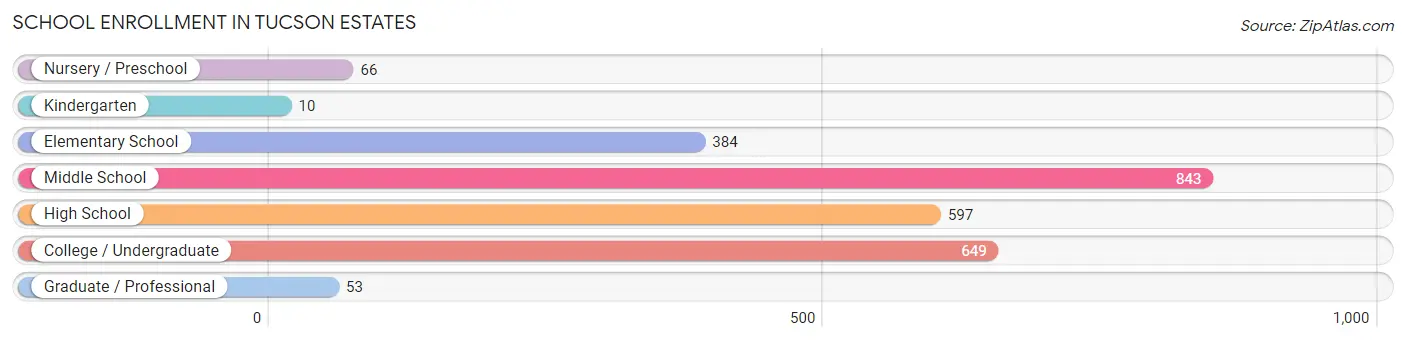
School Enrollment in Tucson Estates
The most common levels of schooling among the 2,602 students in Tucson Estates are middle school (843 | 32.4%), college / undergraduate (649 | 24.9%), and high school (597 | 22.9%).
| School Level | # Students | % Students |
| Nursery / Preschool | 66 | 2.5% |
| Kindergarten | 10 | 0.4% |
| Elementary School | 384 | 14.8% |
| Middle School | 843 | 32.4% |
| High School | 597 | 22.9% |
| College / Undergraduate | 649 | 24.9% |
| Graduate / Professional | 53 | 2.0% |
| Total | 2,602 | 100.0% |
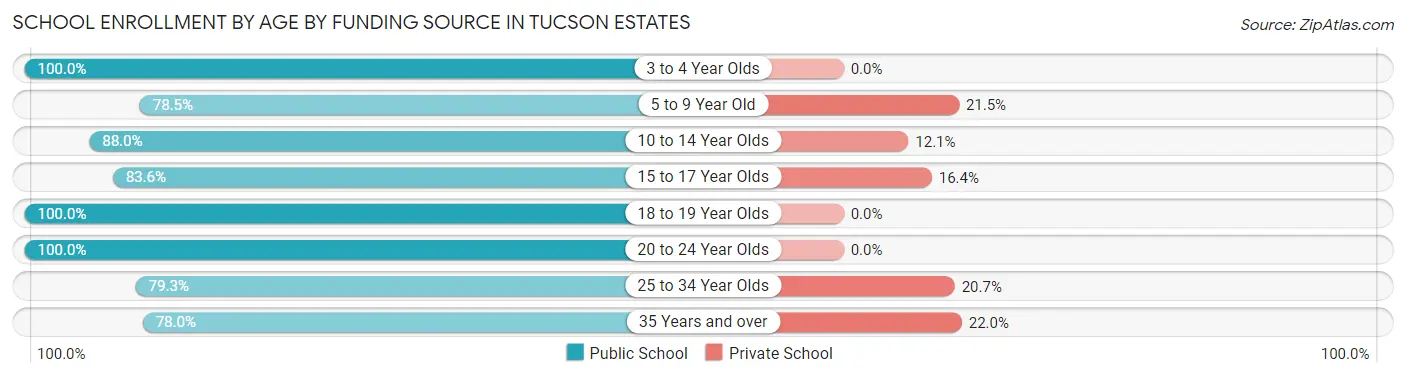
School Enrollment by Age by Funding Source in Tucson Estates
Out of a total of 2,602 students who are enrolled in schools in Tucson Estates, 268 (10.3%) attend a private institution, while the remaining 2,334 (89.7%) are enrolled in public schools. The age group of 35 years and over has the highest likelihood of being enrolled in private schools, with 22 (22.0% in the age bracket) enrolled. Conversely, the age group of 3 to 4 year olds has the lowest likelihood of being enrolled in a private school, with 76 (100.0% in the age bracket) attending a public institution.
| Age Bracket | Public School | Private School |
| 3 to 4 Year Olds | 76 (100.0%) | 0 (0.0%) |
| 5 to 9 Year Old | 245 (78.5%) | 67 (21.5%) |
| 10 to 14 Year Olds | 854 (87.9%) | 117 (12.0%) |
| 15 to 17 Year Olds | 285 (83.6%) | 56 (16.4%) |
| 18 to 19 Year Olds | 394 (100.0%) | 0 (0.0%) |
| 20 to 24 Year Olds | 379 (100.0%) | 0 (0.0%) |
| 25 to 34 Year Olds | 23 (79.3%) | 6 (20.7%) |
| 35 Years and over | 78 (78.0%) | 22 (22.0%) |
| Total | 2,334 (89.7%) | 268 (10.3%) |
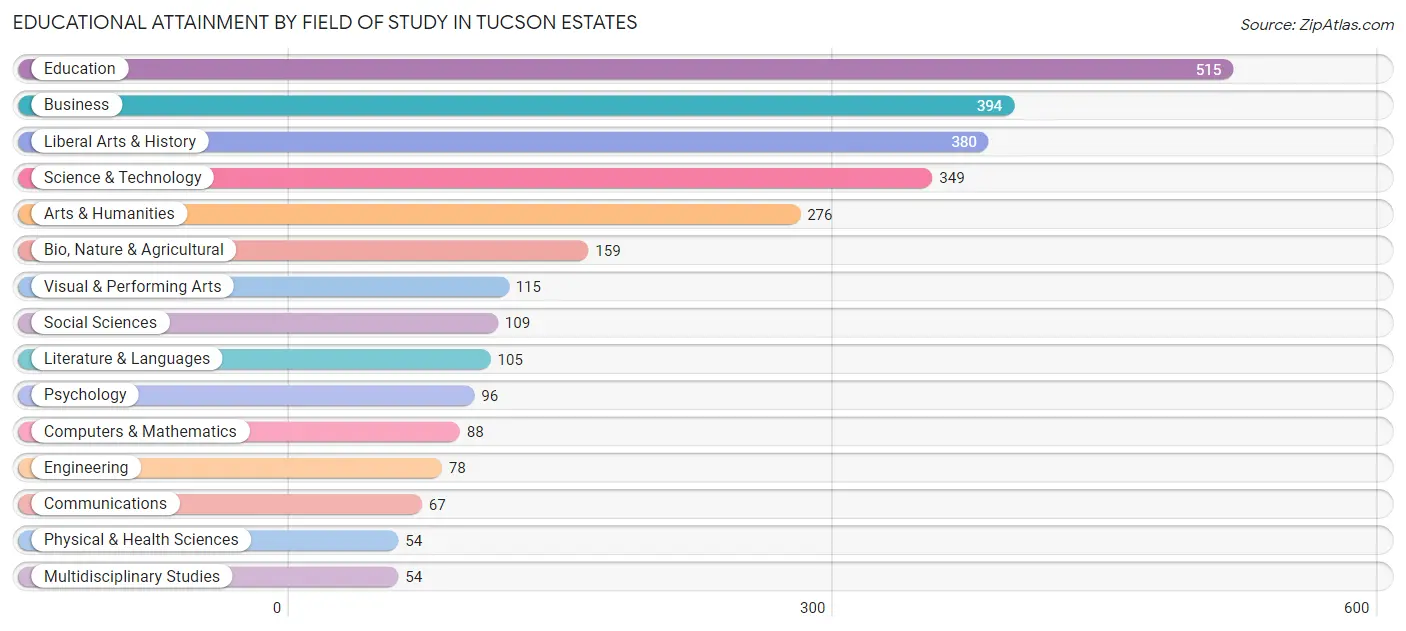
Educational Attainment by Field of Study in Tucson Estates
Education (515 | 18.1%), business (394 | 13.9%), liberal arts & history (380 | 13.4%), science & technology (349 | 12.3%), and arts & humanities (276 | 9.7%) are the most common fields of study among 2,839 individuals in Tucson Estates who have obtained a bachelor's degree or higher.
| Field of Study | # Graduates | % Graduates |
| Computers & Mathematics | 88 | 3.1% |
| Bio, Nature & Agricultural | 159 | 5.6% |
| Physical & Health Sciences | 54 | 1.9% |
| Psychology | 96 | 3.4% |
| Social Sciences | 109 | 3.8% |
| Engineering | 78 | 2.8% |
| Multidisciplinary Studies | 54 | 1.9% |
| Science & Technology | 349 | 12.3% |
| Business | 394 | 13.9% |
| Education | 515 | 18.1% |
| Literature & Languages | 105 | 3.7% |
| Liberal Arts & History | 380 | 13.4% |
| Visual & Performing Arts | 115 | 4.1% |
| Communications | 67 | 2.4% |
| Arts & Humanities | 276 | 9.7% |
| Total | 2,839 | 100.0% |
Transportation & Commute in Tucson Estates
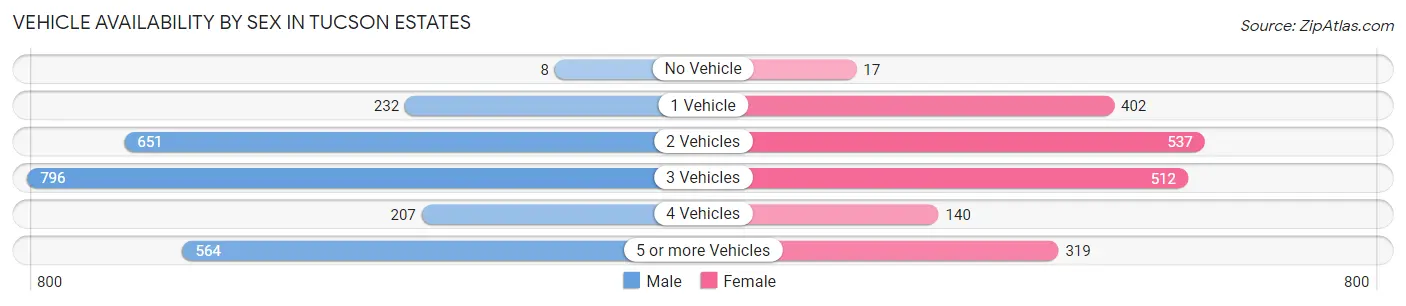
Vehicle Availability by Sex in Tucson Estates
The most prevalent vehicle ownership categories in Tucson Estates are males with 3 vehicles (796, accounting for 32.4%) and females with 3 vehicles (512, making up 41.3%).
| Vehicles Available | Male | Female |
| No Vehicle | 8 (0.3%) | 17 (0.9%) |
| 1 Vehicle | 232 (9.4%) | 402 (20.9%) |
| 2 Vehicles | 651 (26.5%) | 537 (27.9%) |
| 3 Vehicles | 796 (32.4%) | 512 (26.6%) |
| 4 Vehicles | 207 (8.4%) | 140 (7.3%) |
| 5 or more Vehicles | 564 (23.0%) | 319 (16.6%) |
| Total | 2,458 (100.0%) | 1,927 (100.0%) |
Commute Time in Tucson Estates
The most frequently occuring commute durations in Tucson Estates are 30 to 34 minutes (1,037 commuters, 27.4%), 45 to 59 minutes (631 commuters, 16.7%), and 20 to 24 minutes (561 commuters, 14.8%).
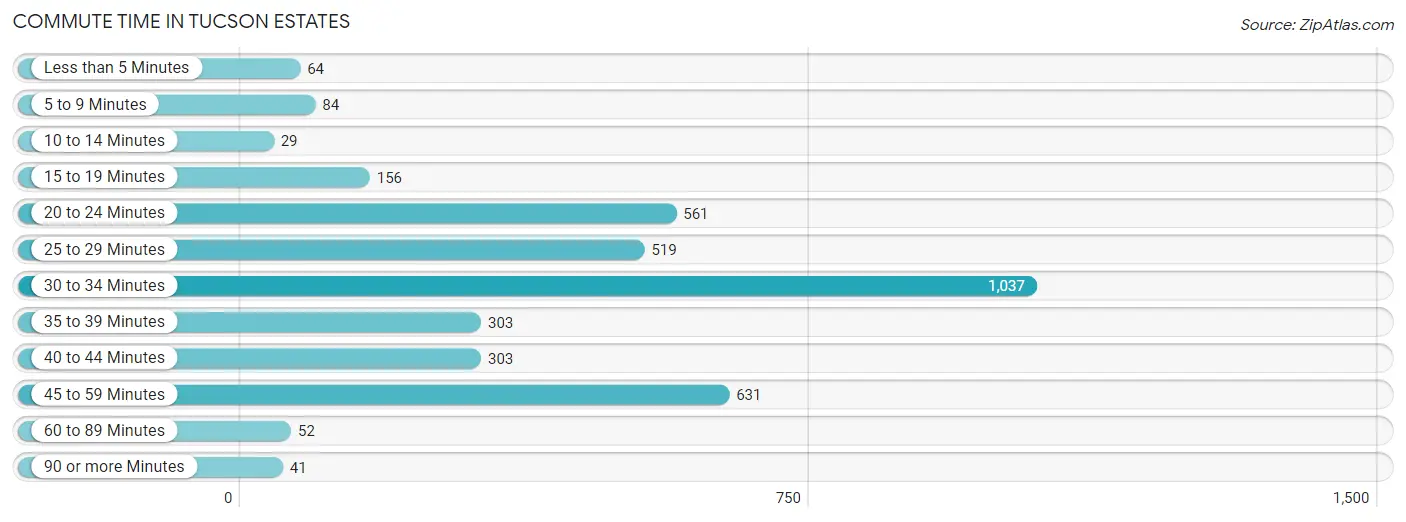
| Commute Time | # Commuters | % Commuters |
| Less than 5 Minutes | 64 | 1.7% |
| 5 to 9 Minutes | 84 | 2.2% |
| 10 to 14 Minutes | 29 | 0.8% |
| 15 to 19 Minutes | 156 | 4.1% |
| 20 to 24 Minutes | 561 | 14.8% |
| 25 to 29 Minutes | 519 | 13.7% |
| 30 to 34 Minutes | 1,037 | 27.4% |
| 35 to 39 Minutes | 303 | 8.0% |
| 40 to 44 Minutes | 303 | 8.0% |
| 45 to 59 Minutes | 631 | 16.7% |
| 60 to 89 Minutes | 52 | 1.4% |
| 90 or more Minutes | 41 | 1.1% |
Commute Time by Sex in Tucson Estates
The most common commute times in Tucson Estates are 30 to 34 minutes (639 commuters, 29.4%) for males and 30 to 34 minutes (398 commuters, 24.8%) for females.
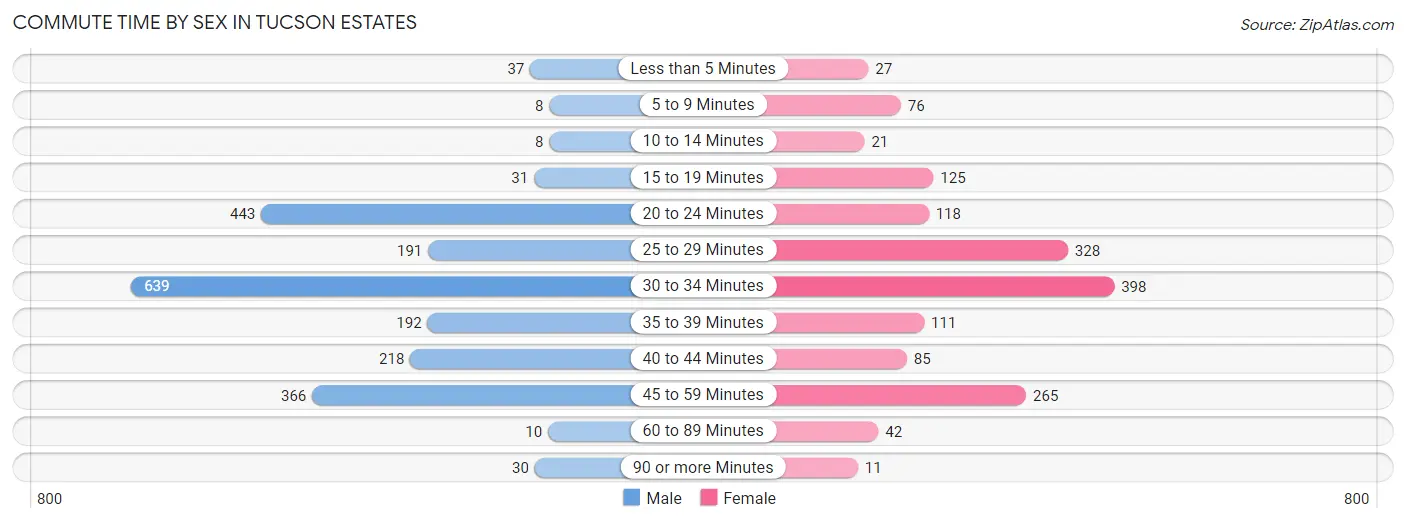
| Commute Time | Male | Female |
| Less than 5 Minutes | 37 (1.7%) | 27 (1.7%) |
| 5 to 9 Minutes | 8 (0.4%) | 76 (4.7%) |
| 10 to 14 Minutes | 8 (0.4%) | 21 (1.3%) |
| 15 to 19 Minutes | 31 (1.4%) | 125 (7.8%) |
| 20 to 24 Minutes | 443 (20.4%) | 118 (7.3%) |
| 25 to 29 Minutes | 191 (8.8%) | 328 (20.4%) |
| 30 to 34 Minutes | 639 (29.4%) | 398 (24.8%) |
| 35 to 39 Minutes | 192 (8.8%) | 111 (6.9%) |
| 40 to 44 Minutes | 218 (10.0%) | 85 (5.3%) |
| 45 to 59 Minutes | 366 (16.8%) | 265 (16.5%) |
| 60 to 89 Minutes | 10 (0.5%) | 42 (2.6%) |
| 90 or more Minutes | 30 (1.4%) | 11 (0.7%) |
Time of Departure to Work by Sex in Tucson Estates
The most frequent times of departure to work in Tucson Estates are 6:30 AM to 6:59 AM (504, 23.2%) for males and 6:30 AM to 6:59 AM (277, 17.2%) for females.
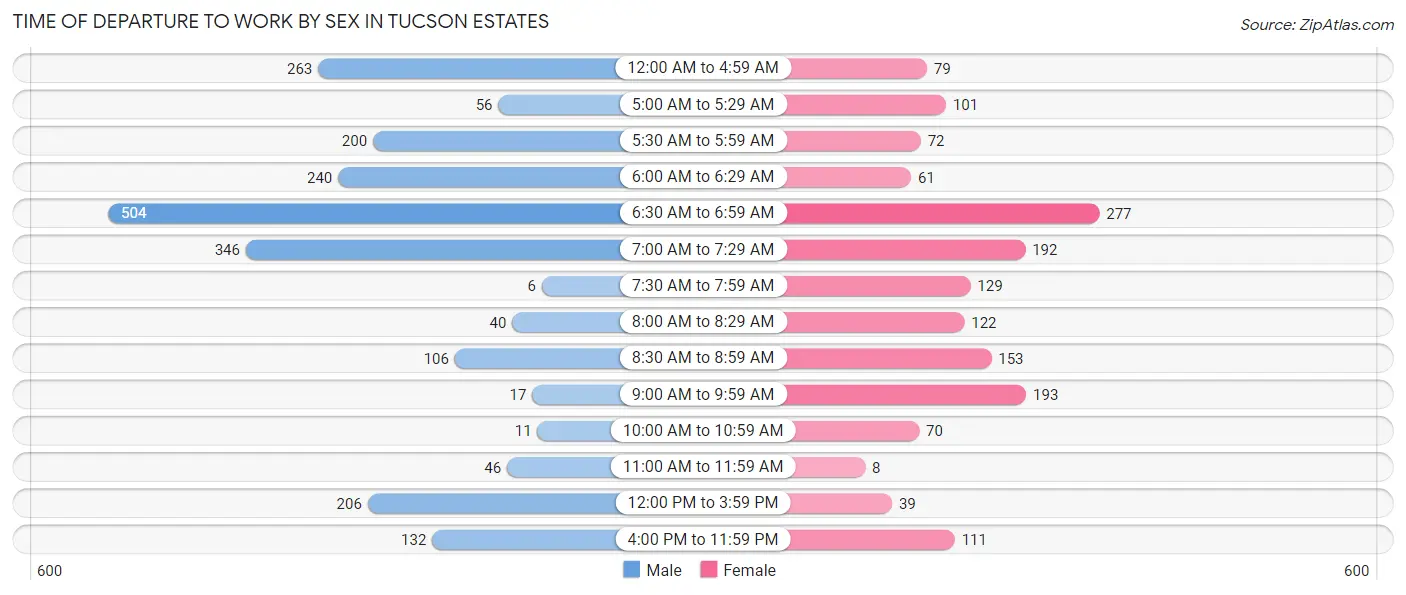
| Time of Departure | Male | Female |
| 12:00 AM to 4:59 AM | 263 (12.1%) | 79 (4.9%) |
| 5:00 AM to 5:29 AM | 56 (2.6%) | 101 (6.3%) |
| 5:30 AM to 5:59 AM | 200 (9.2%) | 72 (4.5%) |
| 6:00 AM to 6:29 AM | 240 (11.0%) | 61 (3.8%) |
| 6:30 AM to 6:59 AM | 504 (23.2%) | 277 (17.2%) |
| 7:00 AM to 7:29 AM | 346 (15.9%) | 192 (11.9%) |
| 7:30 AM to 7:59 AM | 6 (0.3%) | 129 (8.0%) |
| 8:00 AM to 8:29 AM | 40 (1.8%) | 122 (7.6%) |
| 8:30 AM to 8:59 AM | 106 (4.9%) | 153 (9.5%) |
| 9:00 AM to 9:59 AM | 17 (0.8%) | 193 (12.0%) |
| 10:00 AM to 10:59 AM | 11 (0.5%) | 70 (4.4%) |
| 11:00 AM to 11:59 AM | 46 (2.1%) | 8 (0.5%) |
| 12:00 PM to 3:59 PM | 206 (9.5%) | 39 (2.4%) |
| 4:00 PM to 11:59 PM | 132 (6.1%) | 111 (6.9%) |
| Total | 2,173 (100.0%) | 1,607 (100.0%) |
Housing Occupancy in Tucson Estates
Occupancy by Ownership in Tucson Estates
Of the total 5,507 dwellings in Tucson Estates, owner-occupied units account for 5,020 (91.2%), while renter-occupied units make up 487 (8.8%).
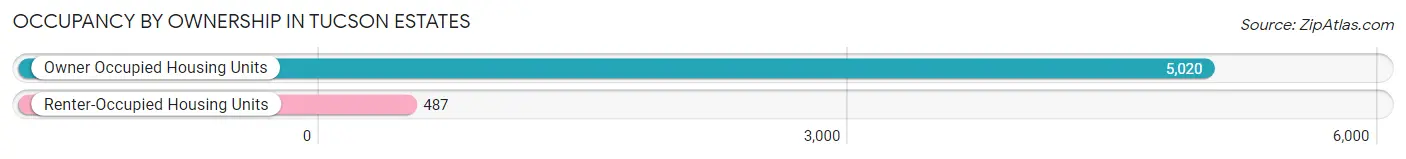
| Occupancy | # Housing Units | % Housing Units |
| Owner Occupied Housing Units | 5,020 | 91.2% |
| Renter-Occupied Housing Units | 487 | 8.8% |
| Total Occupied Housing Units | 5,507 | 100.0% |
Occupancy by Household Size in Tucson Estates
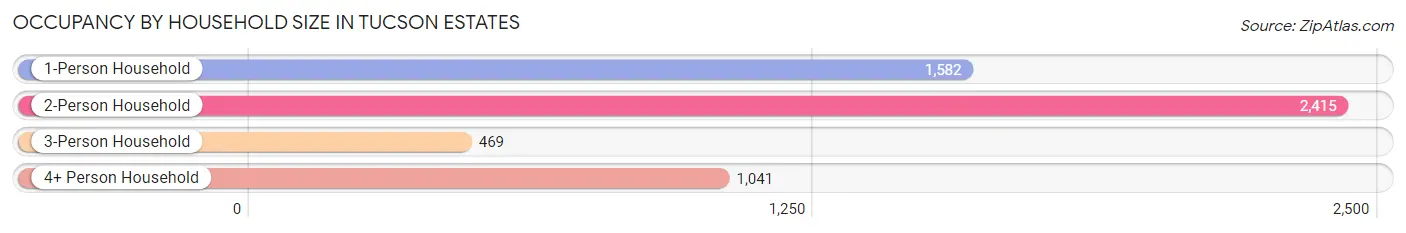
| Household Size | # Housing Units | % Housing Units |
| 1-Person Household | 1,582 | 28.7% |
| 2-Person Household | 2,415 | 43.9% |
| 3-Person Household | 469 | 8.5% |
| 4+ Person Household | 1,041 | 18.9% |
| Total Housing Units | 5,507 | 100.0% |
Occupancy by Ownership by Household Size in Tucson Estates
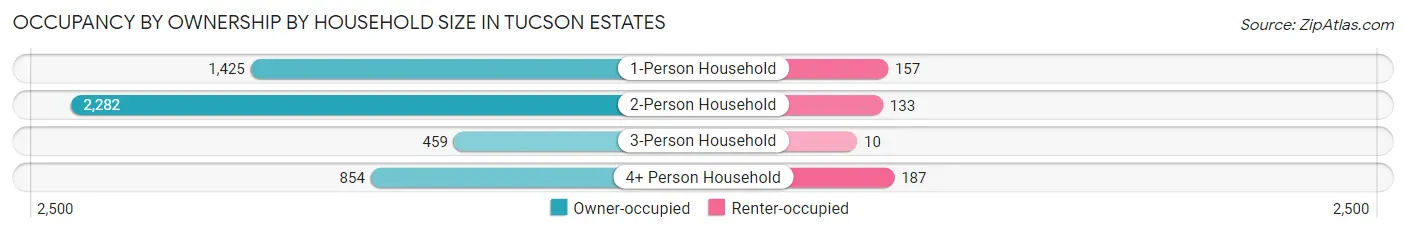
| Household Size | Owner-occupied | Renter-occupied |
| 1-Person Household | 1,425 (90.1%) | 157 (9.9%) |
| 2-Person Household | 2,282 (94.5%) | 133 (5.5%) |
| 3-Person Household | 459 (97.9%) | 10 (2.1%) |
| 4+ Person Household | 854 (82.0%) | 187 (18.0%) |
| Total Housing Units | 5,020 (91.2%) | 487 (8.8%) |
Occupancy by Educational Attainment in Tucson Estates
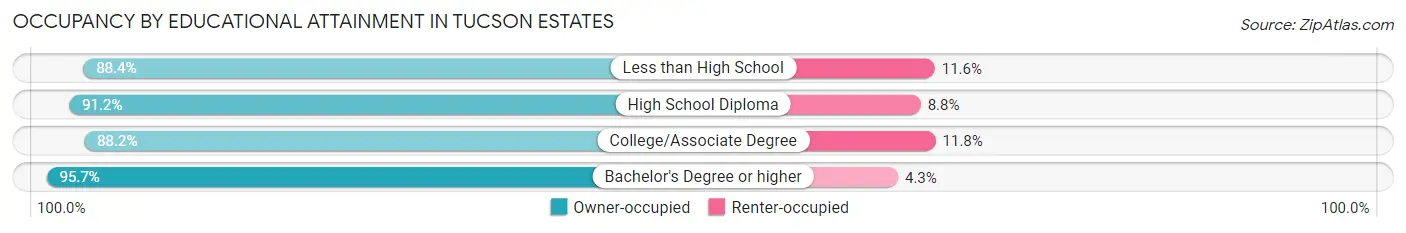
| Household Size | Owner-occupied | Renter-occupied |
| Less than High School | 380 (88.4%) | 50 (11.6%) |
| High School Diploma | 1,053 (91.2%) | 102 (8.8%) |
| College/Associate Degree | 1,954 (88.2%) | 261 (11.8%) |
| Bachelor's Degree or higher | 1,633 (95.7%) | 74 (4.3%) |
Occupancy by Age of Householder in Tucson Estates
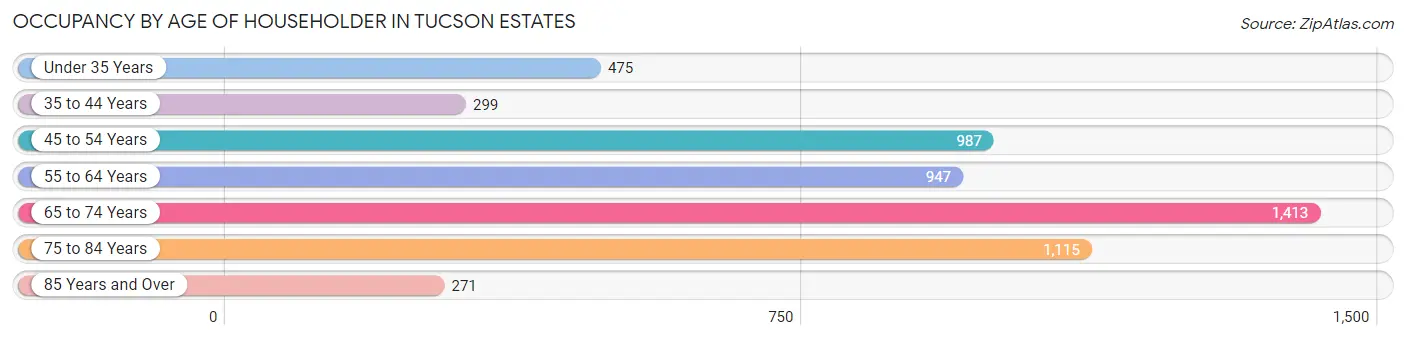
| Age Bracket | # Households | % Households |
| Under 35 Years | 475 | 8.6% |
| 35 to 44 Years | 299 | 5.4% |
| 45 to 54 Years | 987 | 17.9% |
| 55 to 64 Years | 947 | 17.2% |
| 65 to 74 Years | 1,413 | 25.7% |
| 75 to 84 Years | 1,115 | 20.3% |
| 85 Years and Over | 271 | 4.9% |
| Total | 5,507 | 100.0% |
Housing Finances in Tucson Estates
Median Income by Occupancy in Tucson Estates
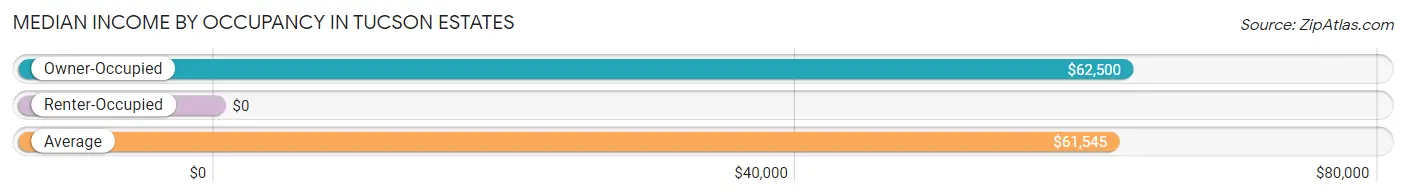
| Occupancy Type | # Households | Median Income |
| Owner-Occupied | 5,020 (91.2%) | $62,500 |
| Renter-Occupied | 487 (8.8%) | $0 |
| Average | 5,507 (100.0%) | $61,545 |
Occupancy by Householder Income Bracket in Tucson Estates
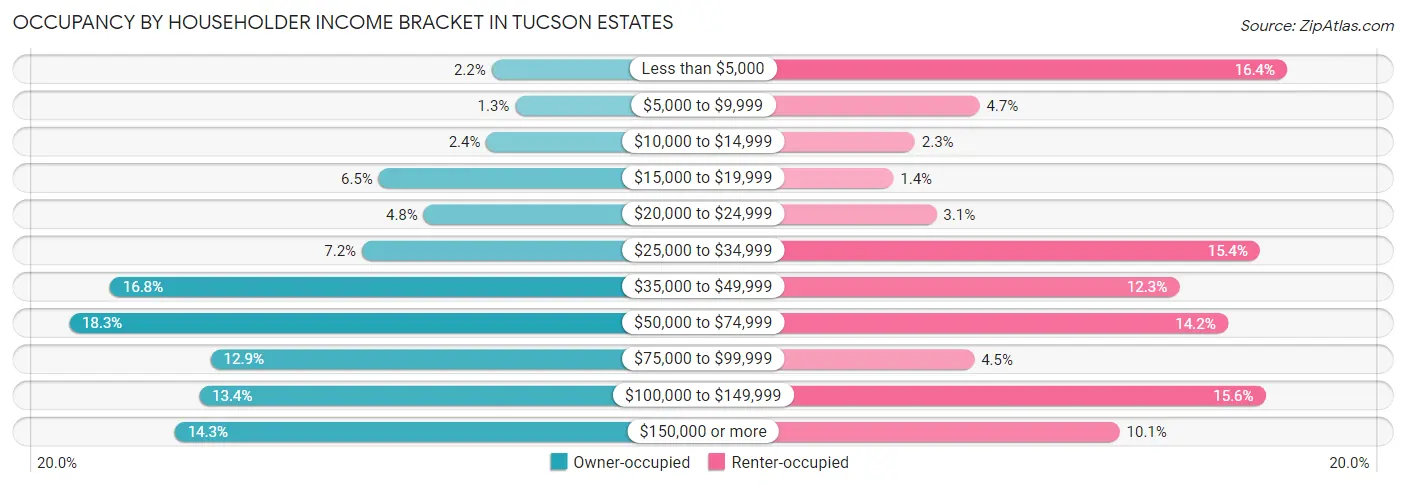
| Income Bracket | Owner-occupied | Renter-occupied |
| Less than $5,000 | 111 (2.2%) | 80 (16.4%) |
| $5,000 to $9,999 | 66 (1.3%) | 23 (4.7%) |
| $10,000 to $14,999 | 121 (2.4%) | 11 (2.3%) |
| $15,000 to $19,999 | 327 (6.5%) | 7 (1.4%) |
| $20,000 to $24,999 | 241 (4.8%) | 15 (3.1%) |
| $25,000 to $34,999 | 359 (7.1%) | 75 (15.4%) |
| $35,000 to $49,999 | 841 (16.8%) | 60 (12.3%) |
| $50,000 to $74,999 | 919 (18.3%) | 69 (14.2%) |
| $75,000 to $99,999 | 648 (12.9%) | 22 (4.5%) |
| $100,000 to $149,999 | 670 (13.4%) | 76 (15.6%) |
| $150,000 or more | 717 (14.3%) | 49 (10.1%) |
| Total | 5,020 (100.0%) | 487 (100.0%) |
Monthly Housing Cost Tiers in Tucson Estates
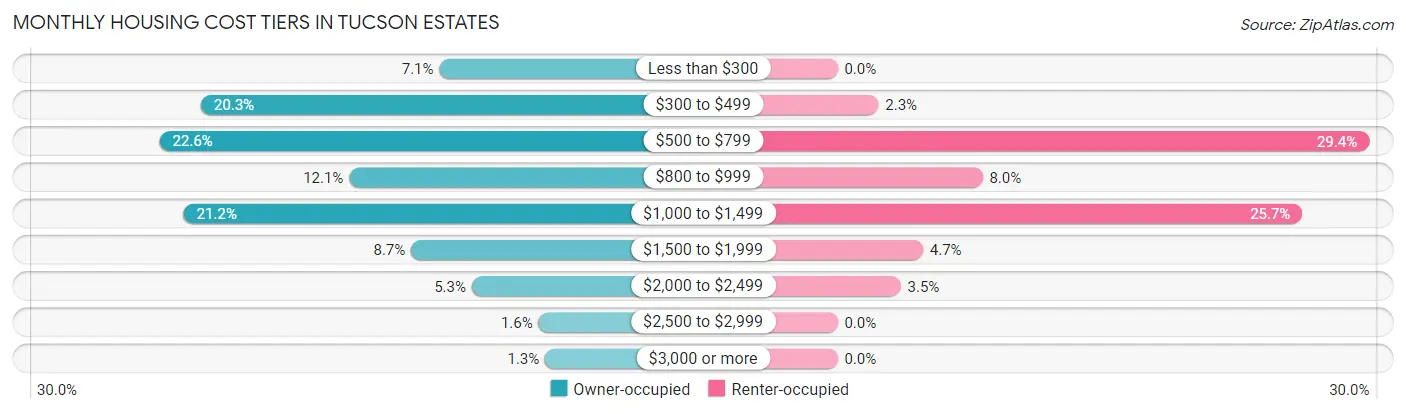
| Monthly Cost | Owner-occupied | Renter-occupied |
| Less than $300 | 356 (7.1%) | 0 (0.0%) |
| $300 to $499 | 1,017 (20.3%) | 11 (2.3%) |
| $500 to $799 | 1,132 (22.6%) | 143 (29.4%) |
| $800 to $999 | 606 (12.1%) | 39 (8.0%) |
| $1,000 to $1,499 | 1,065 (21.2%) | 125 (25.7%) |
| $1,500 to $1,999 | 434 (8.6%) | 23 (4.7%) |
| $2,000 to $2,499 | 266 (5.3%) | 17 (3.5%) |
| $2,500 to $2,999 | 81 (1.6%) | 0 (0.0%) |
| $3,000 or more | 63 (1.3%) | 0 (0.0%) |
| Total | 5,020 (100.0%) | 487 (100.0%) |
Physical Housing Characteristics in Tucson Estates
Housing Structures in Tucson Estates
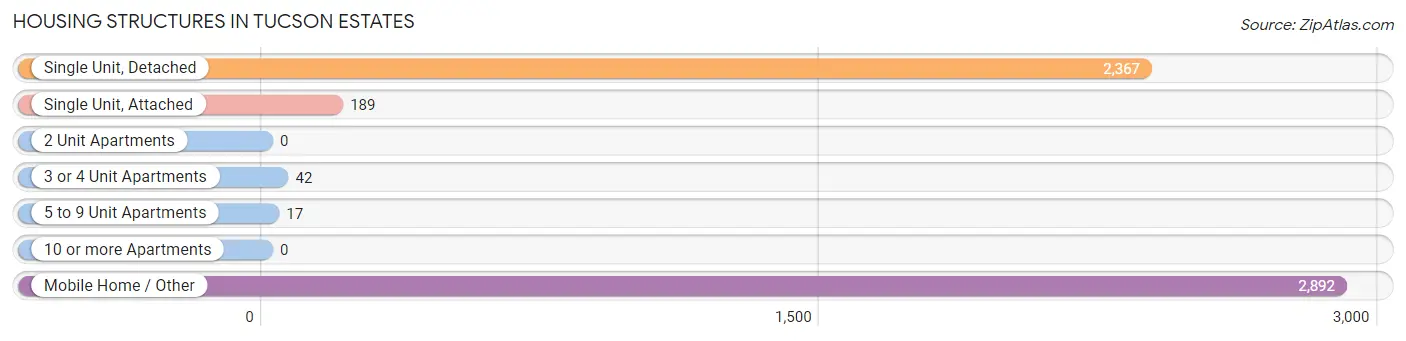
| Structure Type | # Housing Units | % Housing Units |
| Single Unit, Detached | 2,367 | 43.0% |
| Single Unit, Attached | 189 | 3.4% |
| 2 Unit Apartments | 0 | 0.0% |
| 3 or 4 Unit Apartments | 42 | 0.8% |
| 5 to 9 Unit Apartments | 17 | 0.3% |
| 10 or more Apartments | 0 | 0.0% |
| Mobile Home / Other | 2,892 | 52.5% |
| Total | 5,507 | 100.0% |
Housing Structures by Occupancy in Tucson Estates
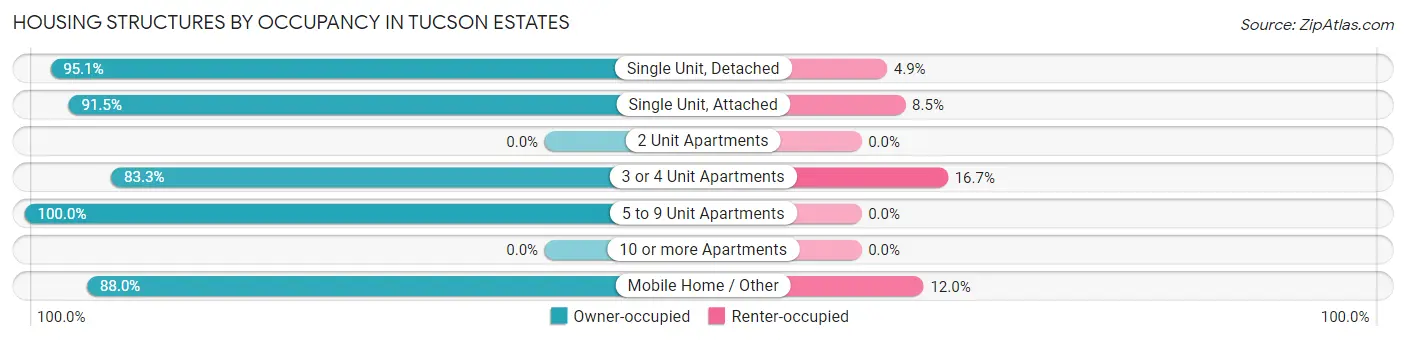
| Structure Type | Owner-occupied | Renter-occupied |
| Single Unit, Detached | 2,250 (95.1%) | 117 (4.9%) |
| Single Unit, Attached | 173 (91.5%) | 16 (8.5%) |
| 2 Unit Apartments | 0 (0.0%) | 0 (0.0%) |
| 3 or 4 Unit Apartments | 35 (83.3%) | 7 (16.7%) |
| 5 to 9 Unit Apartments | 17 (100.0%) | 0 (0.0%) |
| 10 or more Apartments | 0 (0.0%) | 0 (0.0%) |
| Mobile Home / Other | 2,545 (88.0%) | 347 (12.0%) |
| Total | 5,020 (91.2%) | 487 (8.8%) |
Housing Structures by Number of Rooms in Tucson Estates
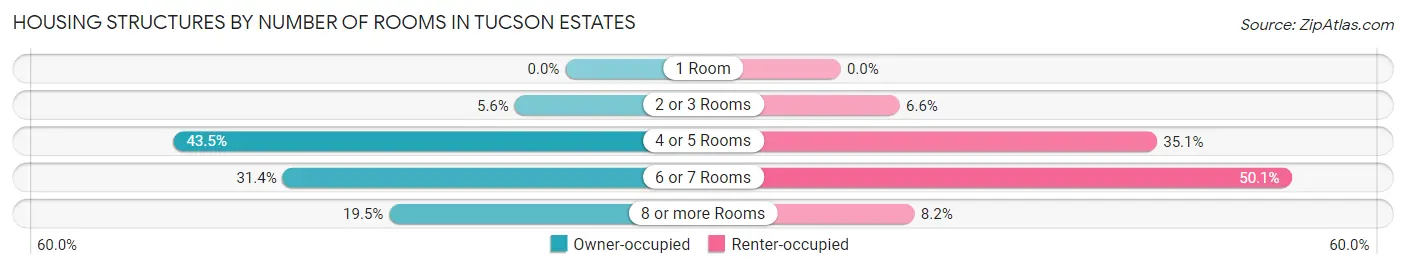
| Number of Rooms | Owner-occupied | Renter-occupied |
| 1 Room | 0 (0.0%) | 0 (0.0%) |
| 2 or 3 Rooms | 282 (5.6%) | 32 (6.6%) |
| 4 or 5 Rooms | 2,182 (43.5%) | 171 (35.1%) |
| 6 or 7 Rooms | 1,575 (31.4%) | 244 (50.1%) |
| 8 or more Rooms | 981 (19.5%) | 40 (8.2%) |
| Total | 5,020 (100.0%) | 487 (100.0%) |
Housing Structure by Heating Type in Tucson Estates
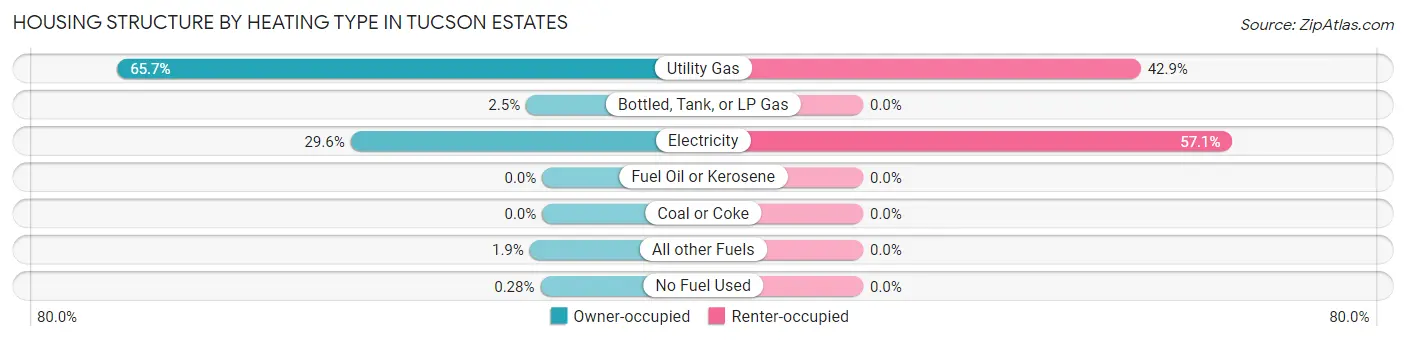
| Heating Type | Owner-occupied | Renter-occupied |
| Utility Gas | 3,297 (65.7%) | 209 (42.9%) |
| Bottled, Tank, or LP Gas | 125 (2.5%) | 0 (0.0%) |
| Electricity | 1,487 (29.6%) | 278 (57.1%) |
| Fuel Oil or Kerosene | 0 (0.0%) | 0 (0.0%) |
| Coal or Coke | 0 (0.0%) | 0 (0.0%) |
| All other Fuels | 97 (1.9%) | 0 (0.0%) |
| No Fuel Used | 14 (0.3%) | 0 (0.0%) |
| Total | 5,020 (100.0%) | 487 (100.0%) |
Household Vehicle Usage in Tucson Estates
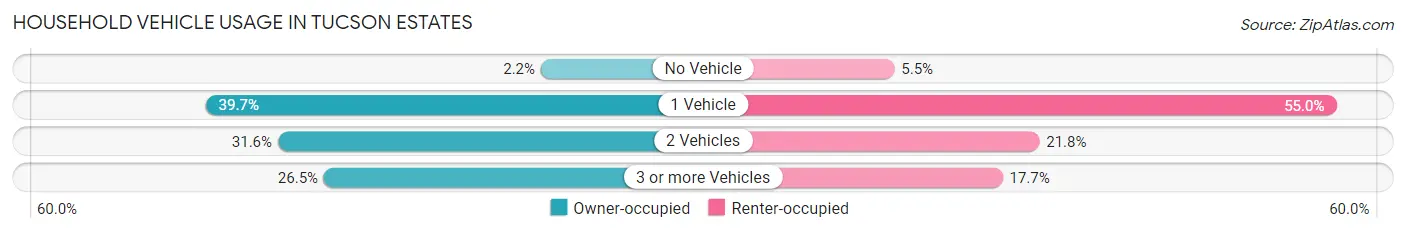
| Vehicles per Household | Owner-occupied | Renter-occupied |
| No Vehicle | 109 (2.2%) | 27 (5.5%) |
| 1 Vehicle | 1,994 (39.7%) | 268 (55.0%) |
| 2 Vehicles | 1,588 (31.6%) | 106 (21.8%) |
| 3 or more Vehicles | 1,329 (26.5%) | 86 (17.7%) |
| Total | 5,020 (100.0%) | 487 (100.0%) |
Real Estate & Mortgages in Tucson Estates
Real Estate and Mortgage Overview in Tucson Estates
| Characteristic | Without Mortgage | With Mortgage |
| Housing Units | 2,588 | 2,432 |
| Median Property Value | $152,100 | $212,900 |
| Median Household Income | $47,199 | $538 |
| Monthly Housing Costs | $488 | $47 |
| Real Estate Taxes | $1,277 | $24 |
Property Value by Mortgage Status in Tucson Estates
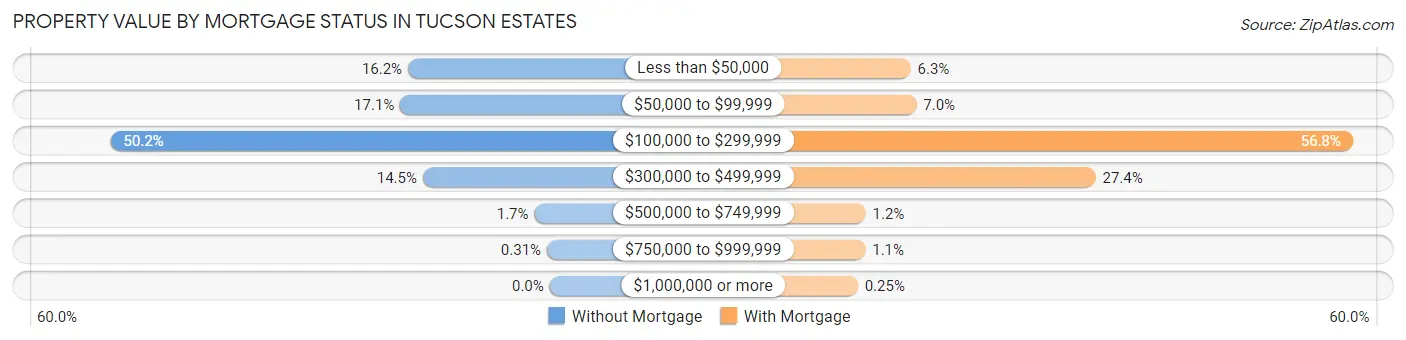
| Property Value | Without Mortgage | With Mortgage |
| Less than $50,000 | 419 (16.2%) | 153 (6.3%) |
| $50,000 to $99,999 | 442 (17.1%) | 169 (7.0%) |
| $100,000 to $299,999 | 1,299 (50.2%) | 1,382 (56.8%) |
| $300,000 to $499,999 | 375 (14.5%) | 667 (27.4%) |
| $500,000 to $749,999 | 45 (1.7%) | 28 (1.1%) |
| $750,000 to $999,999 | 8 (0.3%) | 27 (1.1%) |
| $1,000,000 or more | 0 (0.0%) | 6 (0.3%) |
| Total | 2,588 (100.0%) | 2,432 (100.0%) |
Household Income by Mortgage Status in Tucson Estates
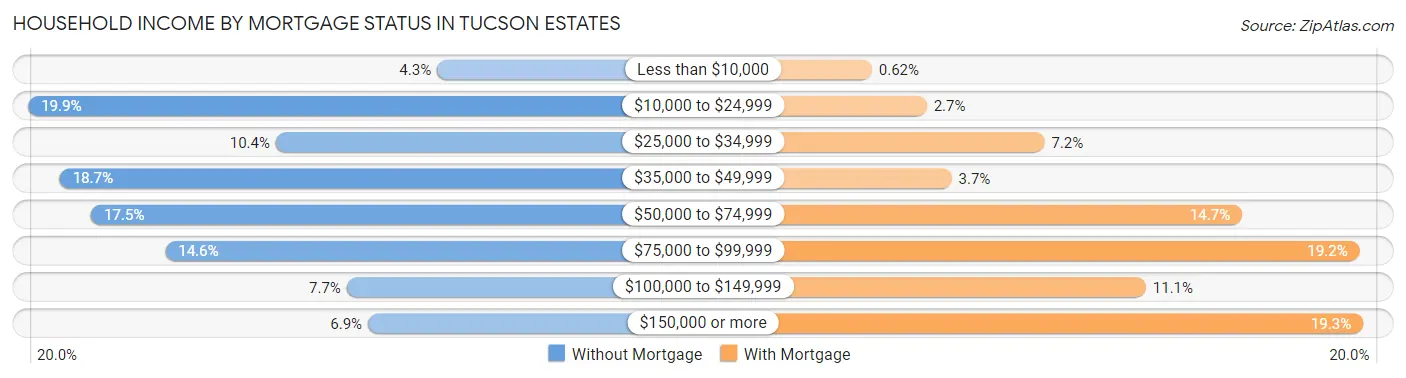
| Household Income | Without Mortgage | With Mortgage |
| Less than $10,000 | 111 (4.3%) | 15 (0.6%) |
| $10,000 to $24,999 | 514 (19.9%) | 66 (2.7%) |
| $25,000 to $34,999 | 270 (10.4%) | 175 (7.2%) |
| $35,000 to $49,999 | 483 (18.7%) | 89 (3.7%) |
| $50,000 to $74,999 | 452 (17.5%) | 358 (14.7%) |
| $75,000 to $99,999 | 379 (14.6%) | 467 (19.2%) |
| $100,000 to $149,999 | 200 (7.7%) | 269 (11.1%) |
| $150,000 or more | 179 (6.9%) | 470 (19.3%) |
| Total | 2,588 (100.0%) | 2,432 (100.0%) |
Property Value to Household Income Ratio in Tucson Estates
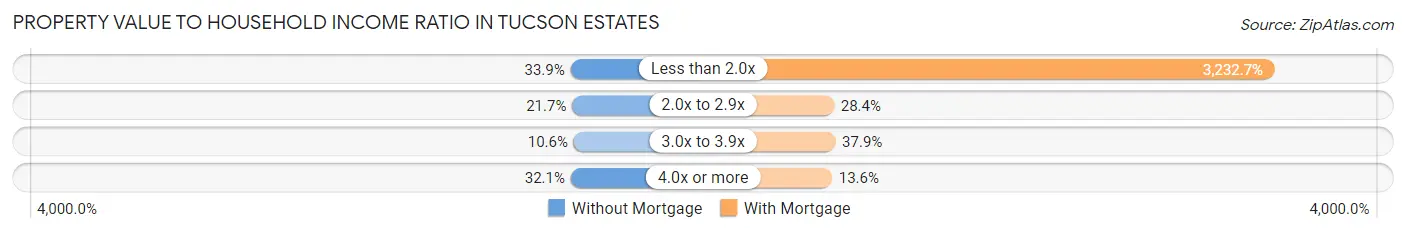
| Value-to-Income Ratio | Without Mortgage | With Mortgage |
| Less than 2.0x | 877 (33.9%) | 78,618 (3,232.7%) |
| 2.0x to 2.9x | 562 (21.7%) | 690 (28.4%) |
| 3.0x to 3.9x | 274 (10.6%) | 922 (37.9%) |
| 4.0x or more | 830 (32.1%) | 331 (13.6%) |
| Total | 2,588 (100.0%) | 2,432 (100.0%) |
Real Estate Taxes by Mortgage Status in Tucson Estates
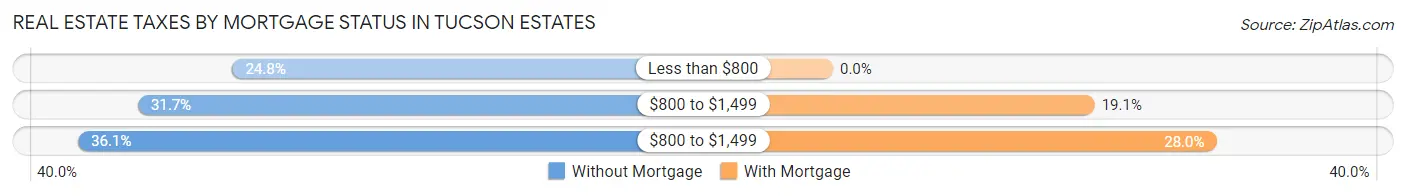
| Property Taxes | Without Mortgage | With Mortgage |
| Less than $800 | 642 (24.8%) | 0 (0.0%) |
| $800 to $1,499 | 821 (31.7%) | 465 (19.1%) |
| $800 to $1,499 | 934 (36.1%) | 681 (28.0%) |
| Total | 2,588 (100.0%) | 2,432 (100.0%) |
Health & Disability in Tucson Estates
Health Insurance Coverage by Age in Tucson Estates
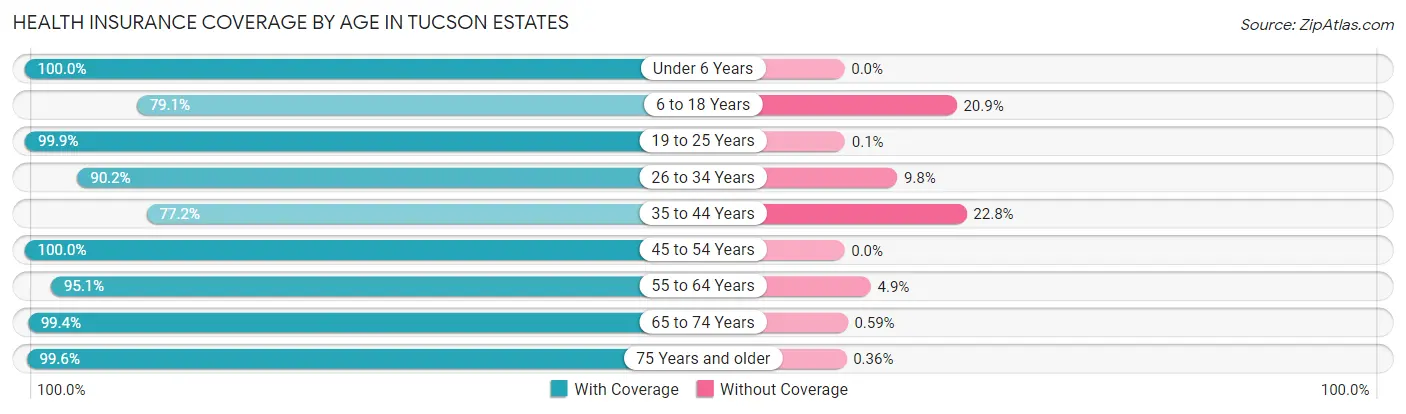
| Age Bracket | With Coverage | Without Coverage |
| Under 6 Years | 317 (100.0%) | 0 (0.0%) |
| 6 to 18 Years | 1,576 (79.1%) | 417 (20.9%) |
| 19 to 25 Years | 997 (99.9%) | 1 (0.1%) |
| 26 to 34 Years | 651 (90.2%) | 71 (9.8%) |
| 35 to 44 Years | 780 (77.2%) | 230 (22.8%) |
| 45 to 54 Years | 1,871 (100.0%) | 0 (0.0%) |
| 55 to 64 Years | 1,397 (95.1%) | 72 (4.9%) |
| 65 to 74 Years | 2,182 (99.4%) | 13 (0.6%) |
| 75 Years and older | 2,212 (99.6%) | 8 (0.4%) |
| Total | 11,983 (93.6%) | 812 (6.4%) |
Health Insurance Coverage by Citizenship Status in Tucson Estates
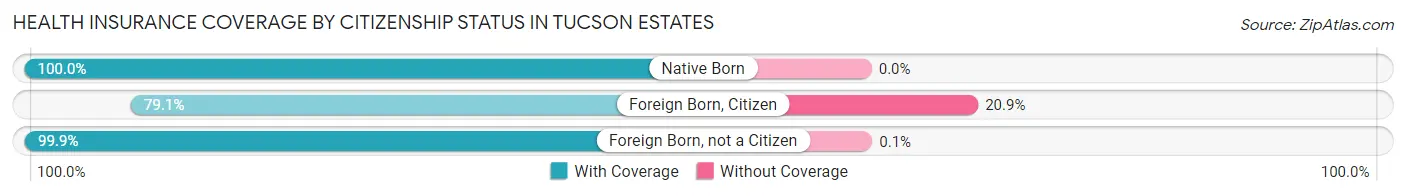
| Citizenship Status | With Coverage | Without Coverage |
| Native Born | 317 (100.0%) | 0 (0.0%) |
| Foreign Born, Citizen | 1,576 (79.1%) | 417 (20.9%) |
| Foreign Born, not a Citizen | 997 (99.9%) | 1 (0.1%) |
Health Insurance Coverage by Household Income in Tucson Estates
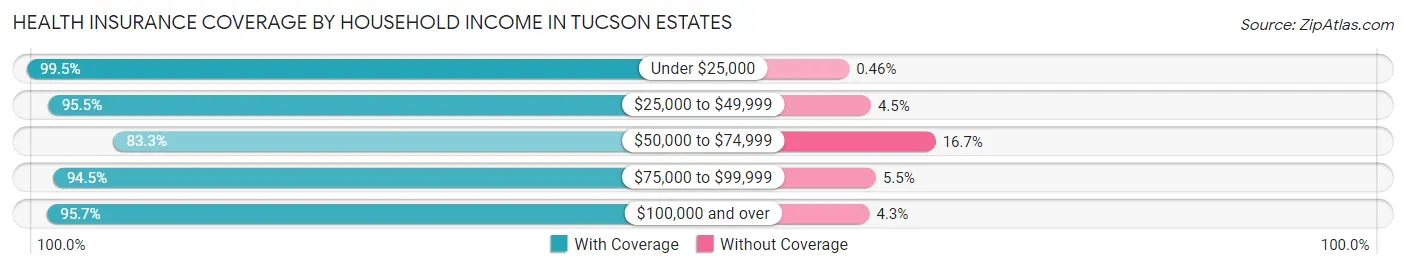
| Household Income | With Coverage | Without Coverage |
| Under $25,000 | 1,505 (99.5%) | 7 (0.5%) |
| $25,000 to $49,999 | 2,045 (95.5%) | 97 (4.5%) |
| $50,000 to $74,999 | 2,036 (83.3%) | 407 (16.7%) |
| $75,000 to $99,999 | 1,296 (94.5%) | 75 (5.5%) |
| $100,000 and over | 5,082 (95.7%) | 226 (4.3%) |
Public vs Private Health Insurance Coverage by Age in Tucson Estates
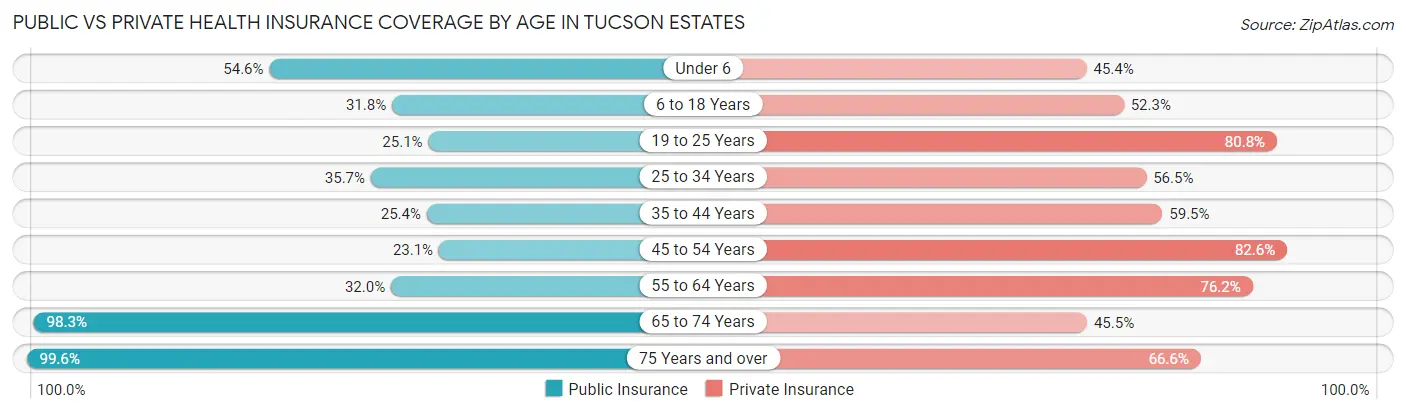
| Age Bracket | Public Insurance | Private Insurance |
| Under 6 | 173 (54.6%) | 144 (45.4%) |
| 6 to 18 Years | 634 (31.8%) | 1,043 (52.3%) |
| 19 to 25 Years | 250 (25.1%) | 806 (80.8%) |
| 25 to 34 Years | 258 (35.7%) | 408 (56.5%) |
| 35 to 44 Years | 256 (25.4%) | 601 (59.5%) |
| 45 to 54 Years | 432 (23.1%) | 1,546 (82.6%) |
| 55 to 64 Years | 470 (32.0%) | 1,120 (76.2%) |
| 65 to 74 Years | 2,158 (98.3%) | 999 (45.5%) |
| 75 Years and over | 2,212 (99.6%) | 1,479 (66.6%) |
| Total | 6,843 (53.5%) | 8,146 (63.7%) |
Disability Status by Sex by Age in Tucson Estates
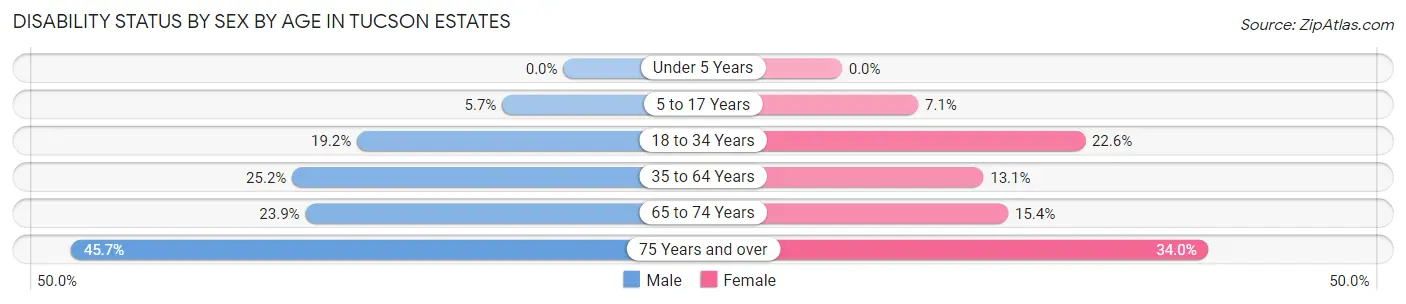
| Age Bracket | Male | Female |
| Under 5 Years | 0 (0.0%) | 0 (0.0%) |
| 5 to 17 Years | 44 (5.7%) | 62 (7.1%) |
| 18 to 34 Years | 204 (19.2%) | 225 (22.6%) |
| 35 to 64 Years | 585 (25.2%) | 266 (13.1%) |
| 65 to 74 Years | 271 (23.9%) | 164 (15.4%) |
| 75 Years and over | 405 (45.7%) | 454 (34.0%) |
Disability Class by Sex by Age in Tucson Estates
Disability Class: Hearing Difficulty
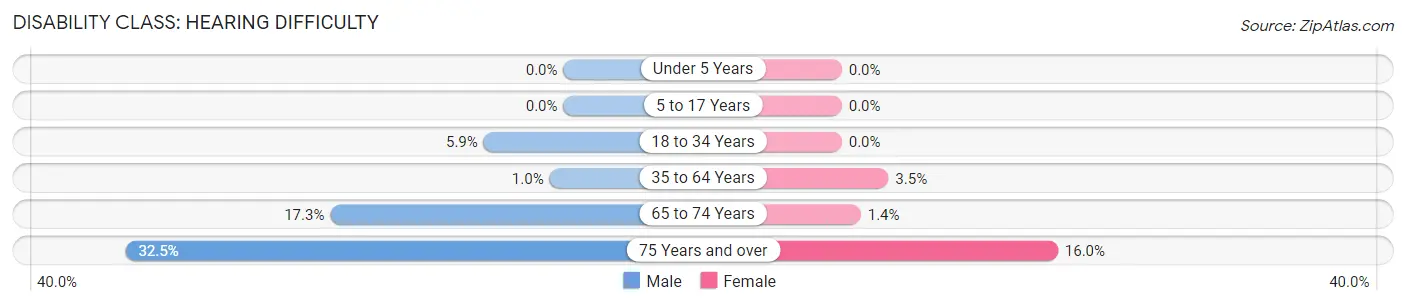
| Age Bracket | Male | Female |
| Under 5 Years | 0 (0.0%) | 0 (0.0%) |
| 5 to 17 Years | 0 (0.0%) | 0 (0.0%) |
| 18 to 34 Years | 63 (5.9%) | 0 (0.0%) |
| 35 to 64 Years | 24 (1.0%) | 70 (3.5%) |
| 65 to 74 Years | 196 (17.3%) | 15 (1.4%) |
| 75 Years and over | 288 (32.5%) | 214 (16.0%) |
Disability Class: Vision Difficulty
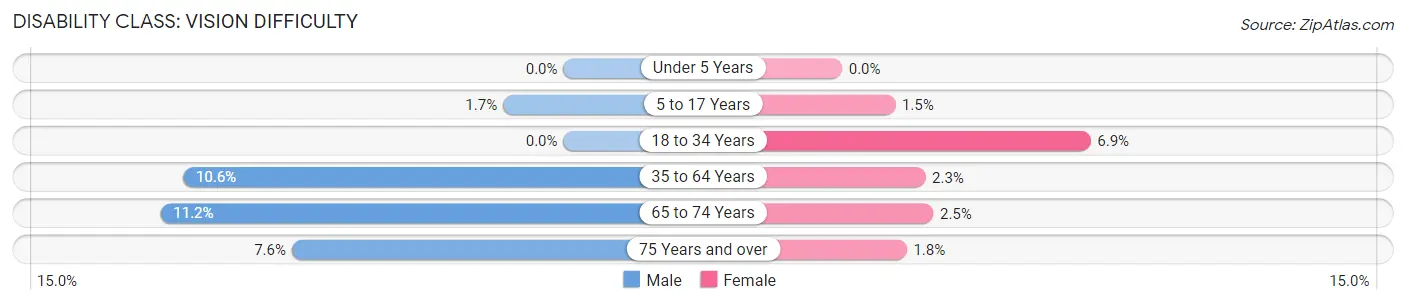
| Age Bracket | Male | Female |
| Under 5 Years | 0 (0.0%) | 0 (0.0%) |
| 5 to 17 Years | 13 (1.7%) | 13 (1.5%) |
| 18 to 34 Years | 0 (0.0%) | 69 (6.9%) |
| 35 to 64 Years | 246 (10.6%) | 47 (2.3%) |
| 65 to 74 Years | 127 (11.2%) | 27 (2.5%) |
| 75 Years and over | 67 (7.6%) | 24 (1.8%) |
Disability Class: Cognitive Difficulty
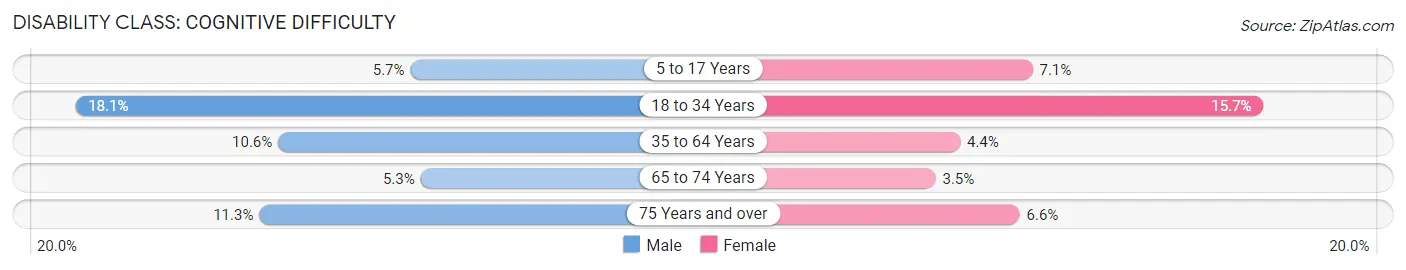
| Age Bracket | Male | Female |
| 5 to 17 Years | 44 (5.7%) | 62 (7.1%) |
| 18 to 34 Years | 193 (18.1%) | 156 (15.7%) |
| 35 to 64 Years | 246 (10.6%) | 89 (4.4%) |
| 65 to 74 Years | 60 (5.3%) | 37 (3.5%) |
| 75 Years and over | 100 (11.3%) | 88 (6.6%) |
Disability Class: Ambulatory Difficulty
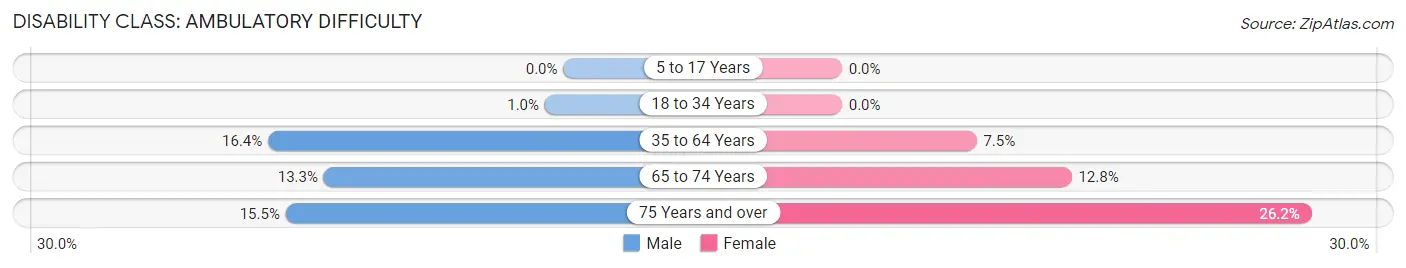
| Age Bracket | Male | Female |
| 5 to 17 Years | 0 (0.0%) | 0 (0.0%) |
| 18 to 34 Years | 11 (1.0%) | 0 (0.0%) |
| 35 to 64 Years | 382 (16.4%) | 152 (7.5%) |
| 65 to 74 Years | 151 (13.3%) | 136 (12.8%) |
| 75 Years and over | 137 (15.5%) | 349 (26.2%) |
Disability Class: Self-Care Difficulty
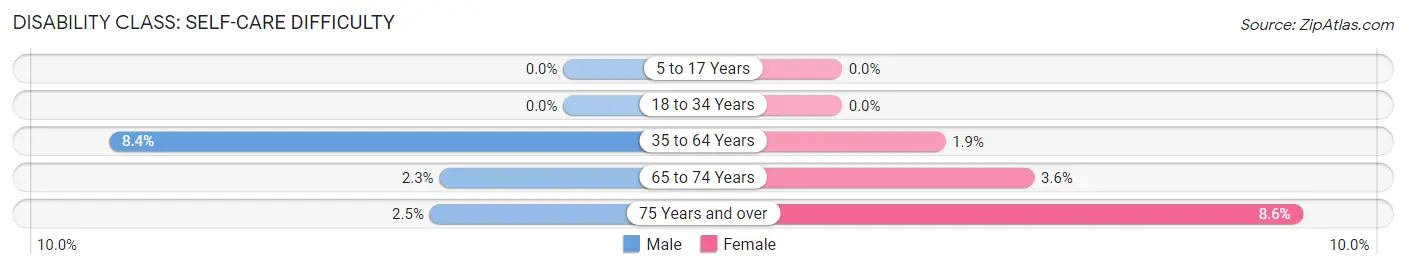
| Age Bracket | Male | Female |
| 5 to 17 Years | 0 (0.0%) | 0 (0.0%) |
| 18 to 34 Years | 0 (0.0%) | 0 (0.0%) |
| 35 to 64 Years | 196 (8.4%) | 39 (1.9%) |
| 65 to 74 Years | 26 (2.3%) | 38 (3.6%) |
| 75 Years and over | 22 (2.5%) | 114 (8.6%) |
Technology Access in Tucson Estates
Computing Device Access in Tucson Estates
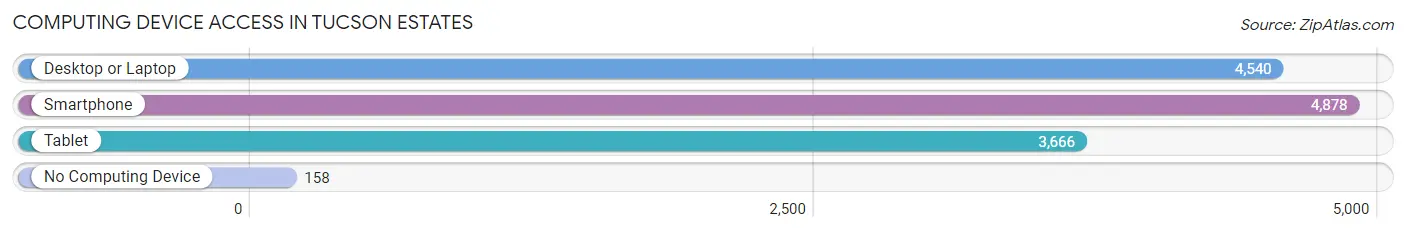
| Device Type | # Households | % Households |
| Desktop or Laptop | 4,540 | 82.4% |
| Smartphone | 4,878 | 88.6% |
| Tablet | 3,666 | 66.6% |
| No Computing Device | 158 | 2.9% |
| Total | 5,507 | 100.0% |
Internet Access in Tucson Estates
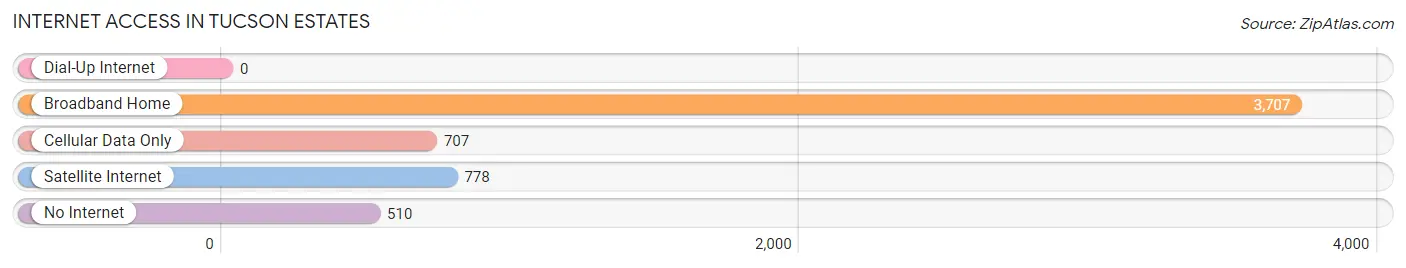
| Internet Type | # Households | % Households |
| Dial-Up Internet | 0 | 0.0% |
| Broadband Home | 3,707 | 67.3% |
| Cellular Data Only | 707 | 12.8% |
| Satellite Internet | 778 | 14.1% |
| No Internet | 510 | 9.3% |
| Total | 5,507 | 100.0% |
Tucson Estates Summary
Tucson Estates is a census-designated place (CDP) located in Pima County, Arizona. It is situated in the foothills of the Santa Catalina Mountains, approximately 20 miles north of downtown Tucson. The area is known for its rural atmosphere and its proximity to the city of Tucson. As of the 2010 census, the population of Tucson Estates was 8,945.
Geography
Tucson Estates is located at 32°25'17" North, 111°2'17" West (32.4214, -111.0378). It is situated in the foothills of the Santa Catalina Mountains, approximately 20 miles north of downtown Tucson. The area is bordered by the towns of Catalina and Oracle to the north, and the city of Tucson to the south. The CDP has a total area of 4.2 square miles, all of which is land.
Climate
Tucson Estates has a semi-arid climate, with hot summers and mild winters. The average annual temperature is 73°F, with an average high of 95°F in July and an average low of 51°F in January. The area receives an average of 11 inches of precipitation per year, with the majority of it falling in the summer months.
Demographics
As of the 2010 census, there were 8,945 people, 3,845 households, and 2,619 families residing in the CDP. The population density was 2,133.3 people per square mile. The racial makeup of the CDP was 87.2% White, 1.2% African American, 1.3% Native American, 0.7% Asian, 0.1% Pacific Islander, 7.2% from other races, and 2.4% from two or more races. Hispanic or Latino of any race were 18.2% of the population.
There were 3,845 households, out of which 24.2% had children under the age of 18 living with them, 54.2% were married couples living together, 10.2% had a female householder with no husband present, and 30.3% were non-families. 24.2% of all households were made up of individuals, and 11.2% had someone living alone who was 65 years of age or older. The average household size was 2.32 and the average family size was 2.75.
The median age in the CDP was 51.2 years. 19.2% of residents were under the age of 18; 5.7% were between the ages of 18 and 24; 17.2% were from 25 to 44; 33.2% were from 45 to 64; and 24.7% were 65 years of age or older. The gender makeup of the CDP was 48.2% male and 51.8% female.
Economy
Tucson Estates is primarily a residential area, with most of its residents commuting to nearby Tucson for work. The area is home to a few small businesses, including a gas station, a convenience store, and a few restaurants. The median household income in the CDP was $45,945 in 2018, and the median family income was $51,945.
Education
Tucson Estates is served by the Amphitheater Unified School District. The area is home to two elementary schools, one middle school, and one high school. The area is also home to several private schools, including a Montessori school and a Christian school.
Conclusion
Tucson Estates is a census-designated place located in Pima County, Arizona. It is situated in the foothills of the Santa Catalina Mountains, approximately 20 miles north of downtown Tucson. The area is known for its rural atmosphere and its proximity to the city of Tucson. As of the 2010 census, the population of Tucson Estates was 8,945. The CDP has a semi-arid climate, with hot summers and mild winters. The population is primarily White, with a significant Hispanic or Latino population. The area is primarily residential, with most of its residents commuting to nearby Tucson for work. The area is served by the Amphitheater Unified School District, and is home to several private schools.
Common Questions
What is Per Capita Income in Tucson Estates?
Per Capita income in Tucson Estates is $32,229.
What is the Median Family Income in Tucson Estates?
Median Family Income in Tucson Estates is $75,280.
What is the Median Household income in Tucson Estates?
Median Household Income in Tucson Estates is $61,545.
What is Income or Wage Gap in Tucson Estates?
Income or Wage Gap in Tucson Estates is 45.0%.
Women in Tucson Estates earn 55.0 cents for every dollar earned by a man.
What is Family Income Deficit in Tucson Estates?
Family Income Deficit in Tucson Estates is $11,770.
Families that are below poverty line in Tucson Estates earn $11,770 less on average than the poverty threshold level.
What is Inequality or Gini Index in Tucson Estates?
Inequality or Gini Index in Tucson Estates is 0.40.
What is the Total Population of Tucson Estates?
Total Population of Tucson Estates is 12,795.
What is the Total Male Population of Tucson Estates?
Total Male Population of Tucson Estates is 6,234.
What is the Total Female Population of Tucson Estates?
Total Female Population of Tucson Estates is 6,561.
What is the Ratio of Males per 100 Females in Tucson Estates?
There are 95.02 Males per 100 Females in Tucson Estates.
What is the Ratio of Females per 100 Males in Tucson Estates?
There are 105.25 Females per 100 Males in Tucson Estates.
What is the Median Population Age in Tucson Estates?
Median Population Age in Tucson Estates is 53.1 Years.
What is the Average Family Size in Tucson Estates
Average Family Size in Tucson Estates is 2.9 People.
What is the Average Household Size in Tucson Estates
Average Household Size in Tucson Estates is 2.3 People.
How Large is the Labor Force in Tucson Estates?
There are 4,612 People in the Labor Forcein in Tucson Estates.
What is the Percentage of People in the Labor Force in Tucson Estates?
41.5% of People are in the Labor Force in Tucson Estates.
What is the Unemployment Rate in Tucson Estates?
Unemployment Rate in Tucson Estates is 3.3%.