Tanque Verde, AZ Map & Demographics
Tanque Verde Map
Tanque Verde Overview
$63,222
PER CAPITA INCOME
$143,130
AVG FAMILY INCOME
$120,887
AVG HOUSEHOLD INCOME
40.6%
WAGE / INCOME GAP [ % ]
59.4¢/ $1
WAGE / INCOME GAP [ $ ]
0.41
INEQUALITY / GINI INDEX
14,815
TOTAL POPULATION
7,677
MALE POPULATION
7,138
FEMALE POPULATION
107.55
MALES / 100 FEMALES
92.98
FEMALES / 100 MALES
56.7
MEDIAN AGE
2.8
AVG FAMILY SIZE
2.4
AVG HOUSEHOLD SIZE
6,419
LABOR FORCE [ PEOPLE ]
50.1%
PERCENT IN LABOR FORCE
4.8%
UNEMPLOYMENT RATE
Income in Tanque Verde
Income Overview in Tanque Verde
Per Capita Income in Tanque Verde is $63,222, while median incomes of families and households are $143,130 and $120,887 respectively.
| Characteristic | Number | Measure |
| Per Capita Income | 14,815 | $63,222 |
| Median Family Income | 4,599 | $143,130 |
| Mean Family Income | 4,599 | $174,022 |
| Median Household Income | 6,048 | $120,887 |
| Mean Household Income | 6,048 | $153,569 |
| Income Deficit | 4,599 | $0 |
| Wage / Income Gap (%) | 14,815 | 40.62% |
| Wage / Income Gap ($) | 14,815 | 59.38¢ per $1 |
| Gini / Inequality Index | 14,815 | 0.41 |
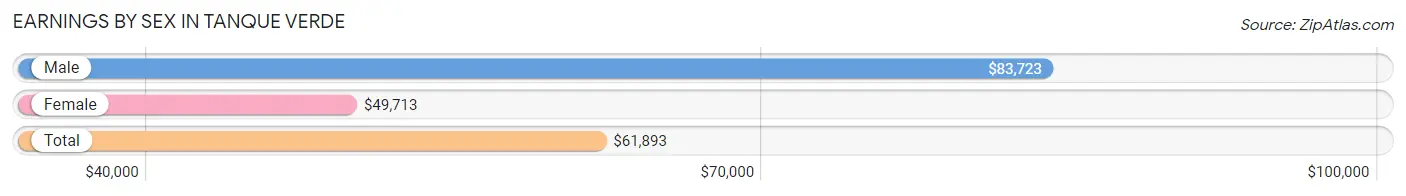
Earnings by Sex in Tanque Verde
Average Earnings in Tanque Verde are $61,893, $83,723 for men and $49,713 for women, a difference of 40.6%.
| Sex | Number | Average Earnings |
| Male | 3,920 (56.6%) | $83,723 |
| Female | 3,005 (43.4%) | $49,713 |
| Total | 6,925 (100.0%) | $61,893 |
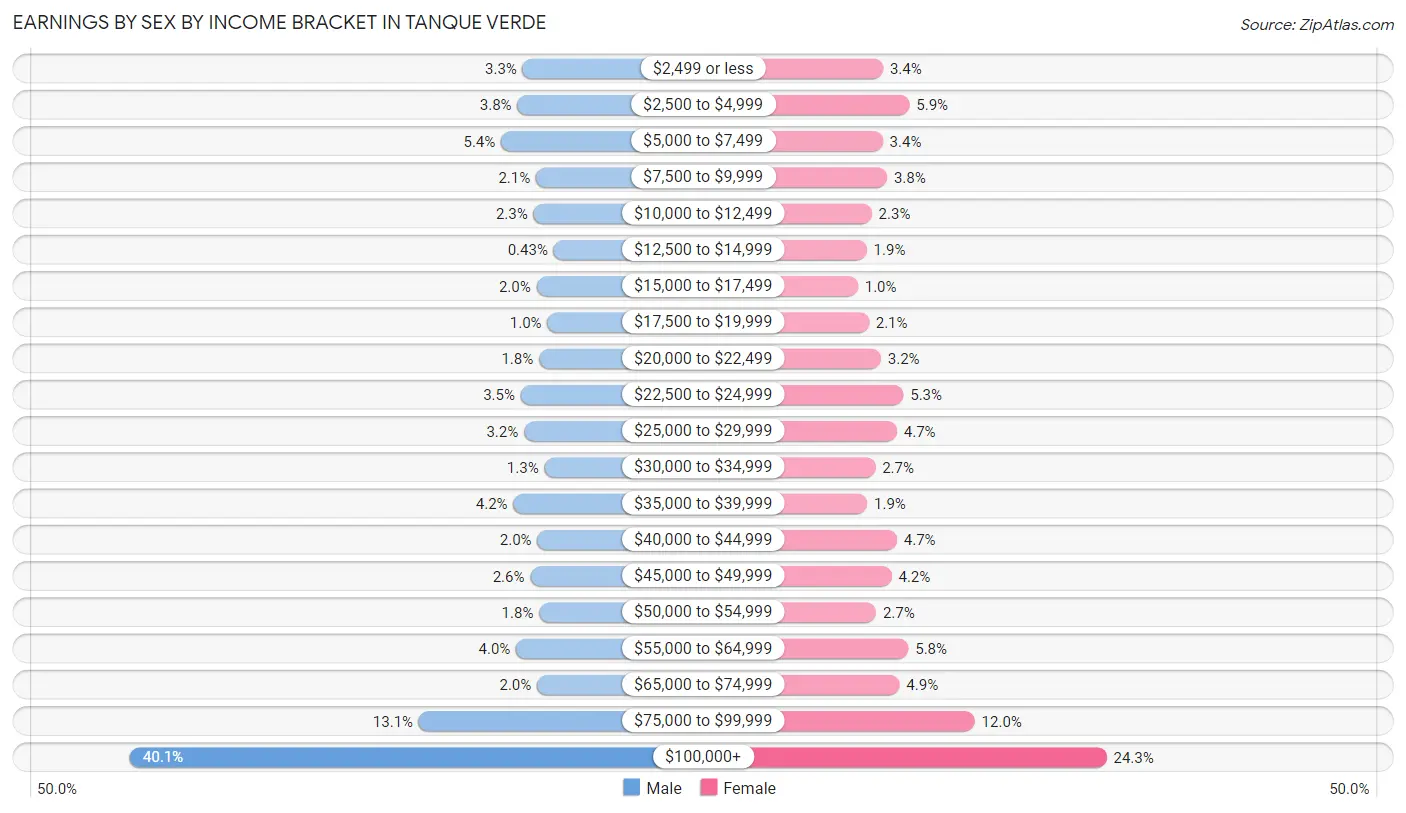
Earnings by Sex by Income Bracket in Tanque Verde
The most common earnings brackets in Tanque Verde are $100,000+ for men (1,573 | 40.1%) and $100,000+ for women (731 | 24.3%).
| Income | Male | Female |
| $2,499 or less | 131 (3.3%) | 102 (3.4%) |
| $2,500 to $4,999 | 150 (3.8%) | 176 (5.9%) |
| $5,000 to $7,499 | 210 (5.4%) | 101 (3.4%) |
| $7,500 to $9,999 | 82 (2.1%) | 113 (3.8%) |
| $10,000 to $12,499 | 91 (2.3%) | 70 (2.3%) |
| $12,500 to $14,999 | 17 (0.4%) | 56 (1.9%) |
| $15,000 to $17,499 | 80 (2.0%) | 31 (1.0%) |
| $17,500 to $19,999 | 40 (1.0%) | 62 (2.1%) |
| $20,000 to $22,499 | 71 (1.8%) | 96 (3.2%) |
| $22,500 to $24,999 | 138 (3.5%) | 159 (5.3%) |
| $25,000 to $29,999 | 126 (3.2%) | 141 (4.7%) |
| $30,000 to $34,999 | 51 (1.3%) | 80 (2.7%) |
| $35,000 to $39,999 | 165 (4.2%) | 57 (1.9%) |
| $40,000 to $44,999 | 77 (2.0%) | 141 (4.7%) |
| $45,000 to $49,999 | 103 (2.6%) | 126 (4.2%) |
| $50,000 to $54,999 | 70 (1.8%) | 82 (2.7%) |
| $55,000 to $64,999 | 155 (4.0%) | 173 (5.8%) |
| $65,000 to $74,999 | 78 (2.0%) | 148 (4.9%) |
| $75,000 to $99,999 | 512 (13.1%) | 360 (12.0%) |
| $100,000+ | 1,573 (40.1%) | 731 (24.3%) |
| Total | 3,920 (100.0%) | 3,005 (100.0%) |
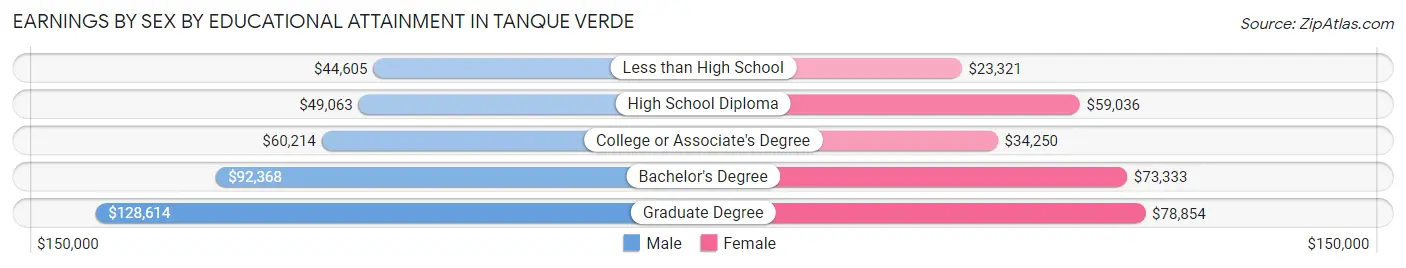
Earnings by Sex by Educational Attainment in Tanque Verde
Average earnings in Tanque Verde are $89,375 for men and $58,569 for women, a difference of 34.5%. Men with an educational attainment of graduate degree enjoy the highest average annual earnings of $128,614, while those with less than high school education earn the least with $44,605. Women with an educational attainment of graduate degree earn the most with the average annual earnings of $78,854, while those with less than high school education have the smallest earnings of $23,321.
| Educational Attainment | Male Income | Female Income |
| Less than High School | $44,605 | $23,321 |
| High School Diploma | $49,063 | $59,036 |
| College or Associate's Degree | $60,214 | $34,250 |
| Bachelor's Degree | $92,368 | $73,333 |
| Graduate Degree | $128,614 | $78,854 |
| Total | $89,375 | $58,569 |
Family Income in Tanque Verde
Family Income Brackets in Tanque Verde
According to the Tanque Verde family income data, there are 1,407 families falling into the $200,000+ income range, which is the most common income bracket and makes up 30.6% of all families. Conversely, the $10,000 to $14,999 income bracket is the least frequent group with only 5 families (0.1%) belonging to this category.
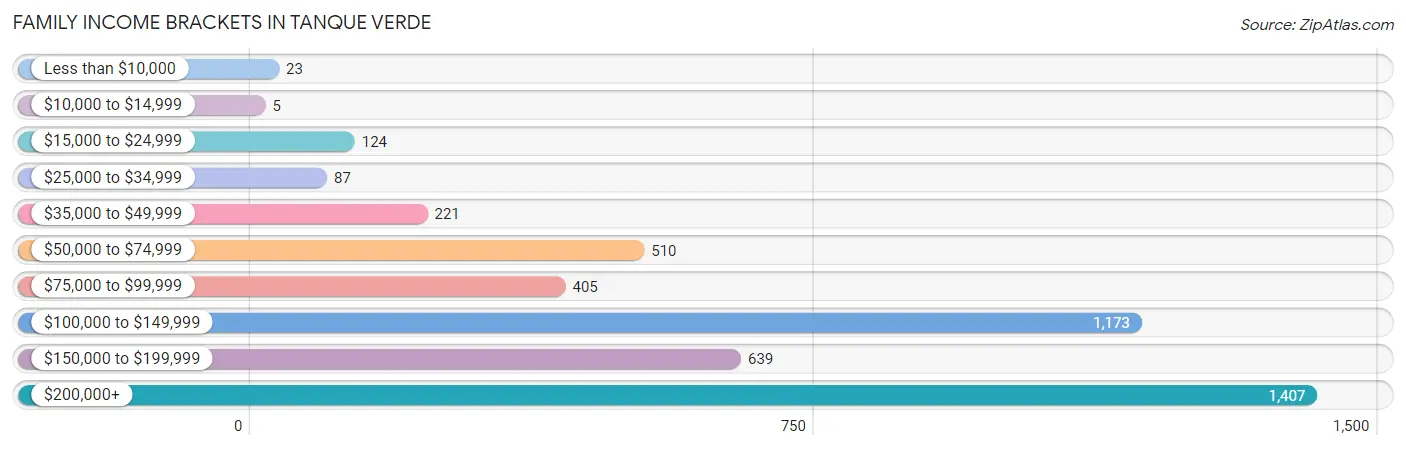
| Income Bracket | # Families | % Families |
| Less than $10,000 | 23 | 0.5% |
| $10,000 to $14,999 | 5 | 0.1% |
| $15,000 to $24,999 | 124 | 2.7% |
| $25,000 to $34,999 | 87 | 1.9% |
| $35,000 to $49,999 | 221 | 4.8% |
| $50,000 to $74,999 | 510 | 11.1% |
| $75,000 to $99,999 | 405 | 8.8% |
| $100,000 to $149,999 | 1,173 | 25.5% |
| $150,000 to $199,999 | 639 | 13.9% |
| $200,000+ | 1,407 | 30.6% |
Family Income by Famaliy Size in Tanque Verde
7+ person families (79 | 1.7%) account for the highest median family income in Tanque Verde with $250,001 per family, while 2-person families (2,903 | 63.1%) have the highest median income of $62,194 per family member.
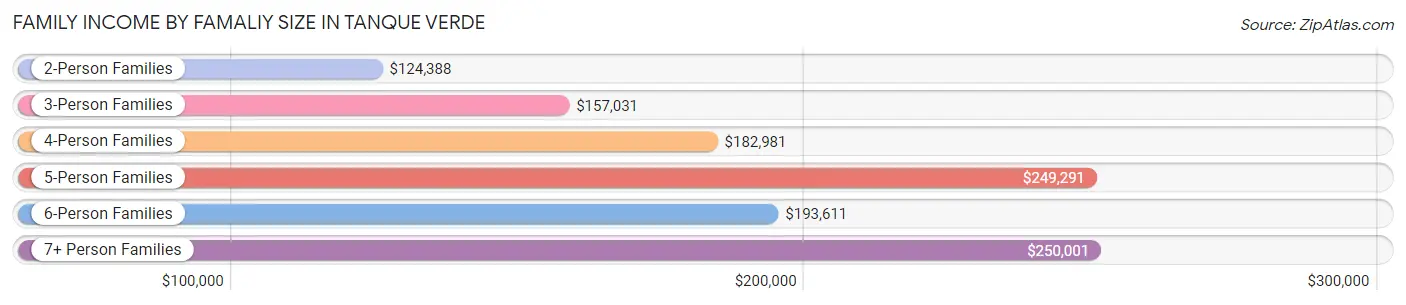
| Income Bracket | # Families | Median Income |
| 2-Person Families | 2,903 (63.1%) | $124,388 |
| 3-Person Families | 657 (14.3%) | $157,031 |
| 4-Person Families | 727 (15.8%) | $182,981 |
| 5-Person Families | 157 (3.4%) | $249,291 |
| 6-Person Families | 76 (1.7%) | $193,611 |
| 7+ Person Families | 79 (1.7%) | $250,001 |
| Total | 4,599 (100.0%) | $143,130 |
Family Income by Number of Earners in Tanque Verde
The median family income in Tanque Verde is $143,130, with families comprising 3+ earners (291) having the highest median family income of $218,304, while families with no earners (1,175) have the lowest median family income of $103,375, accounting for 6.3% and 25.6% of families, respectively.
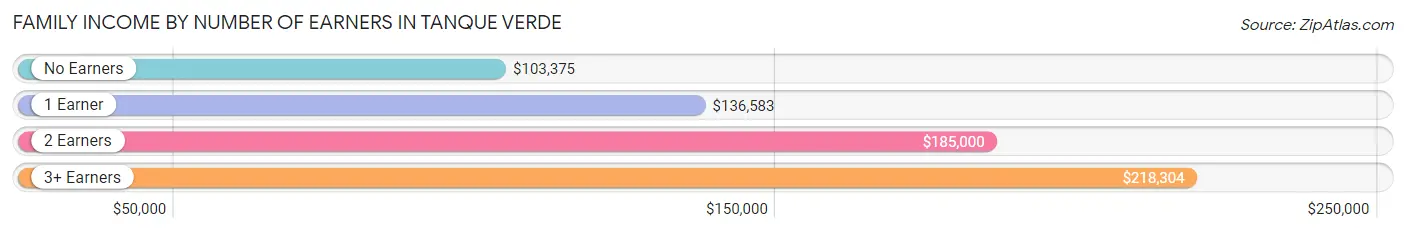
| Number of Earners | # Families | Median Income |
| No Earners | 1,175 (25.6%) | $103,375 |
| 1 Earner | 1,401 (30.5%) | $136,583 |
| 2 Earners | 1,732 (37.7%) | $185,000 |
| 3+ Earners | 291 (6.3%) | $218,304 |
| Total | 4,599 (100.0%) | $143,130 |
Household Income in Tanque Verde
Household Income Brackets in Tanque Verde
With 1,536 households falling in the category, the $200,000+ income range is the most frequent in Tanque Verde, accounting for 25.4% of all households. In contrast, only 12 households (0.2%) fall into the $10,000 to $14,999 income bracket, making it the least populous group.
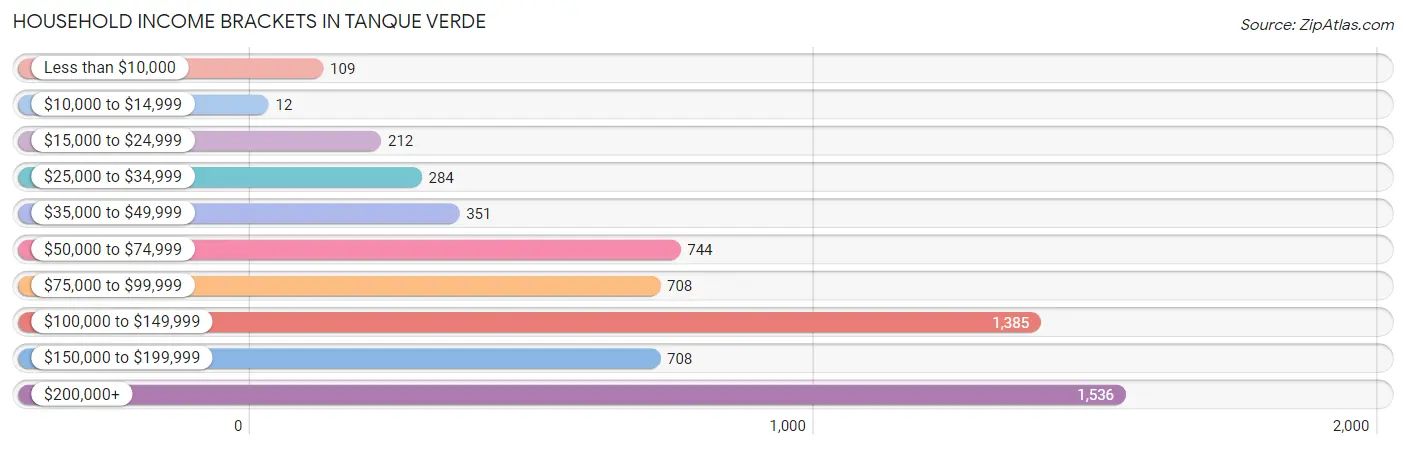
| Income Bracket | # Households | % Households |
| Less than $10,000 | 109 | 1.8% |
| $10,000 to $14,999 | 12 | 0.2% |
| $15,000 to $24,999 | 212 | 3.5% |
| $25,000 to $34,999 | 284 | 4.7% |
| $35,000 to $49,999 | 351 | 5.8% |
| $50,000 to $74,999 | 744 | 12.3% |
| $75,000 to $99,999 | 708 | 11.7% |
| $100,000 to $149,999 | 1,385 | 22.9% |
| $150,000 to $199,999 | 708 | 11.7% |
| $200,000+ | 1,536 | 25.4% |
Household Income by Householder Age in Tanque Verde
The median household income in Tanque Verde is $120,887, with the highest median household income of $160,833 found in the 25 to 44 years age bracket for the primary householder. A total of 618 households (10.2%) fall into this category. Meanwhile, the 15 to 24 years age bracket for the primary householder has the lowest median household income of $0, with 74 households (1.2%) in this group.
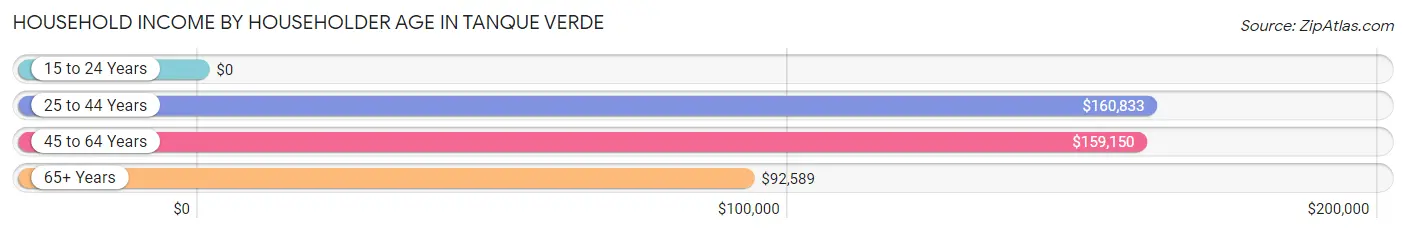
| Income Bracket | # Households | Median Income |
| 15 to 24 Years | 74 (1.2%) | $0 |
| 25 to 44 Years | 618 (10.2%) | $160,833 |
| 45 to 64 Years | 2,457 (40.6%) | $159,150 |
| 65+ Years | 2,899 (47.9%) | $92,589 |
| Total | 6,048 (100.0%) | $120,887 |
Poverty in Tanque Verde
Income Below Poverty by Sex and Age in Tanque Verde
With 1.7% poverty level for males and 3.1% for females among the residents of Tanque Verde, 6 to 11 year old males and 18 to 24 year old females are the most vulnerable to poverty, with 23 males (5.8%) and 43 females (11.9%) in their respective age groups living below the poverty level.
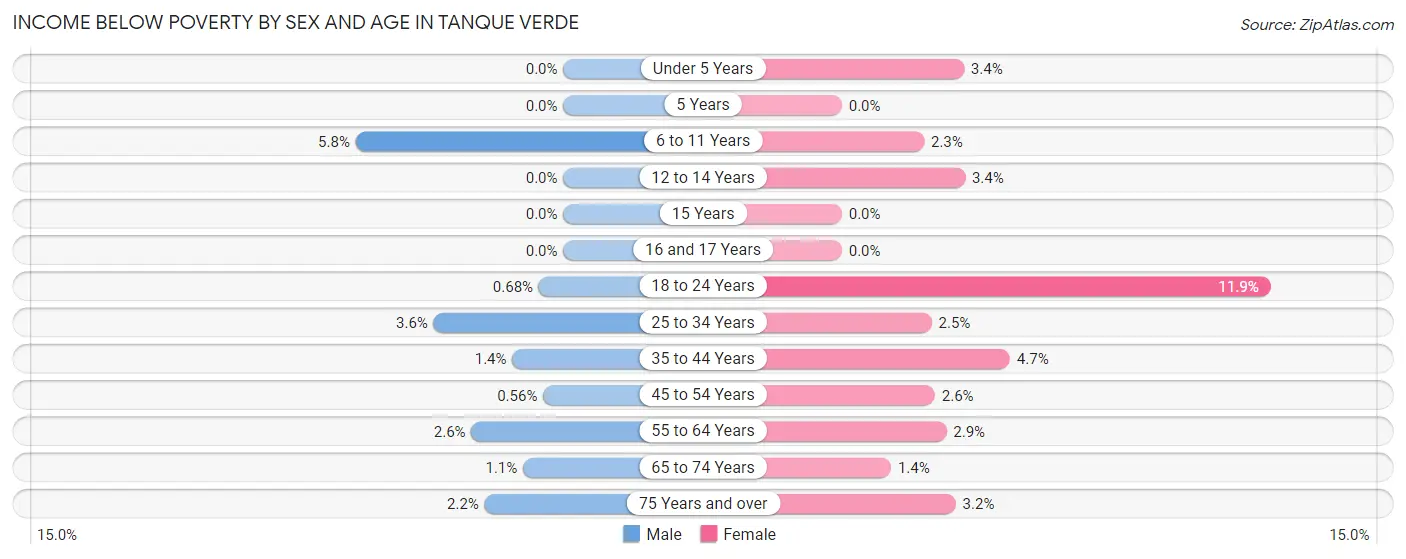
| Age Bracket | Male | Female |
| Under 5 Years | 0 (0.0%) | 8 (3.4%) |
| 5 Years | 0 (0.0%) | 0 (0.0%) |
| 6 to 11 Years | 23 (5.8%) | 8 (2.3%) |
| 12 to 14 Years | 0 (0.0%) | 7 (3.4%) |
| 15 Years | 0 (0.0%) | 0 (0.0%) |
| 16 and 17 Years | 0 (0.0%) | 0 (0.0%) |
| 18 to 24 Years | 3 (0.7%) | 43 (11.9%) |
| 25 to 34 Years | 15 (3.6%) | 8 (2.5%) |
| 35 to 44 Years | 8 (1.4%) | 30 (4.7%) |
| 45 to 54 Years | 5 (0.6%) | 24 (2.6%) |
| 55 to 64 Years | 37 (2.6%) | 43 (2.9%) |
| 65 to 74 Years | 16 (1.1%) | 19 (1.4%) |
| 75 Years and over | 24 (2.2%) | 30 (3.2%) |
| Total | 131 (1.7%) | 220 (3.1%) |
Income Above Poverty by Sex and Age in Tanque Verde
According to the poverty statistics in Tanque Verde, males aged under 5 years and females aged 5 years are the age groups that are most secure financially, with 100.0% of males and 100.0% of females in these age groups living above the poverty line.
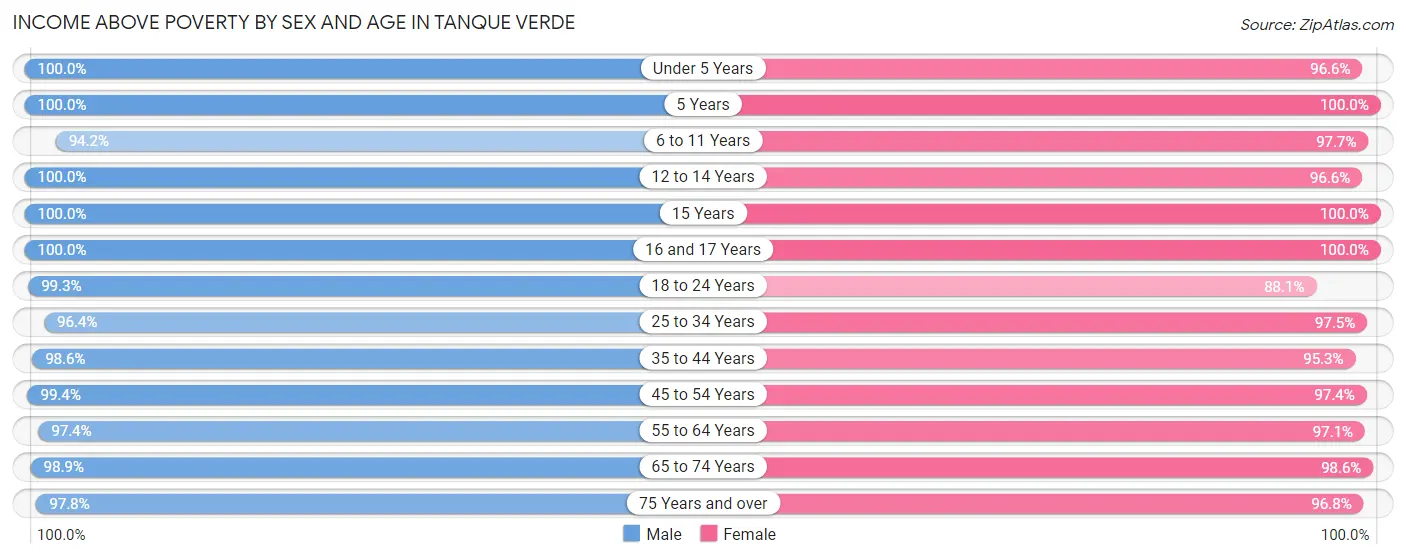
| Age Bracket | Male | Female |
| Under 5 Years | 178 (100.0%) | 227 (96.6%) |
| 5 Years | 18 (100.0%) | 66 (100.0%) |
| 6 to 11 Years | 375 (94.2%) | 342 (97.7%) |
| 12 to 14 Years | 332 (100.0%) | 197 (96.6%) |
| 15 Years | 101 (100.0%) | 89 (100.0%) |
| 16 and 17 Years | 336 (100.0%) | 129 (100.0%) |
| 18 to 24 Years | 437 (99.3%) | 317 (88.1%) |
| 25 to 34 Years | 401 (96.4%) | 312 (97.5%) |
| 35 to 44 Years | 555 (98.6%) | 611 (95.3%) |
| 45 to 54 Years | 891 (99.4%) | 904 (97.4%) |
| 55 to 64 Years | 1,411 (97.4%) | 1,434 (97.1%) |
| 65 to 74 Years | 1,408 (98.9%) | 1,370 (98.6%) |
| 75 Years and over | 1,070 (97.8%) | 917 (96.8%) |
| Total | 7,513 (98.3%) | 6,915 (96.9%) |
Income Below Poverty Among Married-Couple Families in Tanque Verde
The poverty statistics for married-couple families in Tanque Verde show that 0.8% or 31 of the total 4,099 families live below the poverty line. Families with no children have the highest poverty rate of 0.8%, comprising of 24 families. On the other hand, families with 3 or 4 children have the lowest poverty rate of 0.0%, which includes 0 families.
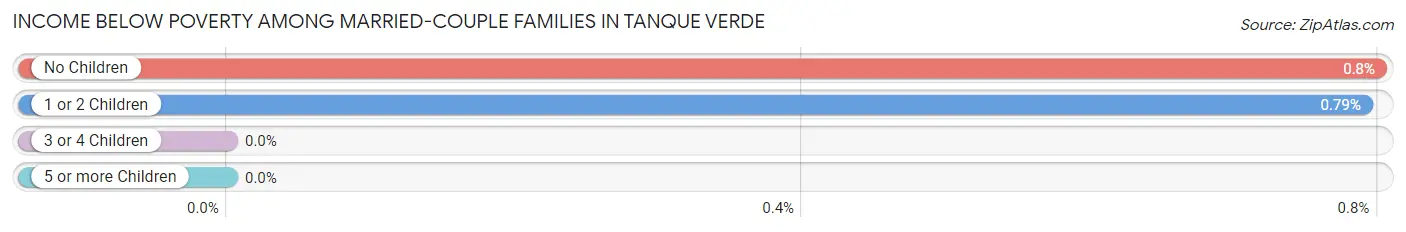
| Children | Above Poverty | Below Poverty |
| No Children | 2,991 (99.2%) | 24 (0.8%) |
| 1 or 2 Children | 880 (99.2%) | 7 (0.8%) |
| 3 or 4 Children | 140 (100.0%) | 0 (0.0%) |
| 5 or more Children | 57 (100.0%) | 0 (0.0%) |
| Total | 4,068 (99.2%) | 31 (0.8%) |
Income Below Poverty Among Single-Parent Households in Tanque Verde
According to the poverty data in Tanque Verde, 1.8% or 4 single-father households and 9.8% or 27 single-mother households are living below the poverty line. Among single-father households, those with no children have the highest poverty rate, with 4 households (2.4%) experiencing poverty. Likewise, among single-mother households, those with 1 or 2 children have the highest poverty rate, with 21 households (25.9%) falling below the poverty line.
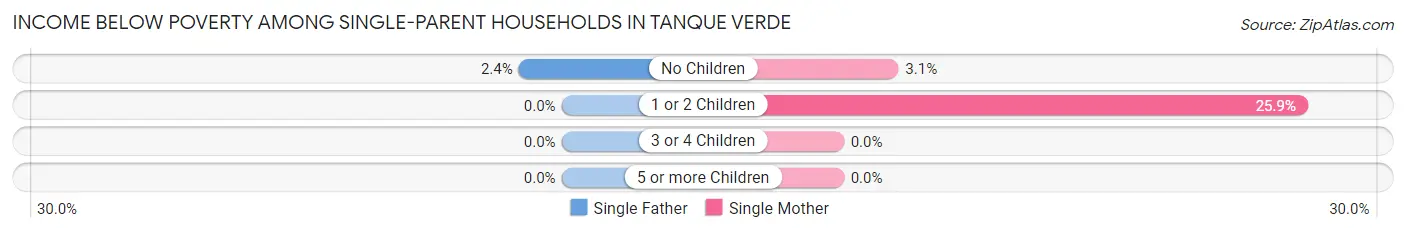
| Children | Single Father | Single Mother |
| No Children | 4 (2.4%) | 6 (3.1%) |
| 1 or 2 Children | 0 (0.0%) | 21 (25.9%) |
| 3 or 4 Children | 0 (0.0%) | 0 (0.0%) |
| 5 or more Children | 0 (0.0%) | 0 (0.0%) |
| Total | 4 (1.8%) | 27 (9.8%) |
Income Below Poverty Among Married-Couple vs Single-Parent Households in Tanque Verde
The poverty data for Tanque Verde shows that 31 of the married-couple family households (0.8%) and 31 of the single-parent households (6.2%) are living below the poverty level. Within the married-couple family households, those with no children have the highest poverty rate, with 24 households (0.8%) falling below the poverty line. Among the single-parent households, those with 1 or 2 children have the highest poverty rate, with 21 household (15.9%) living below poverty.
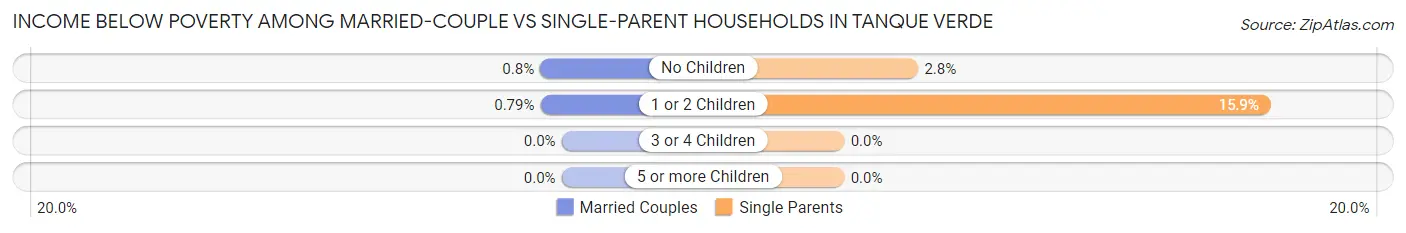
| Children | Married-Couple Families | Single-Parent Households |
| No Children | 24 (0.8%) | 10 (2.8%) |
| 1 or 2 Children | 7 (0.8%) | 21 (15.9%) |
| 3 or 4 Children | 0 (0.0%) | 0 (0.0%) |
| 5 or more Children | 0 (0.0%) | 0 (0.0%) |
| Total | 31 (0.8%) | 31 (6.2%) |
Race in Tanque Verde
The most populous races in Tanque Verde are White / Caucasian (13,274 | 89.6%), Hispanic or Latino (1,531 | 10.3%), and Two or more Races (959 | 6.5%).
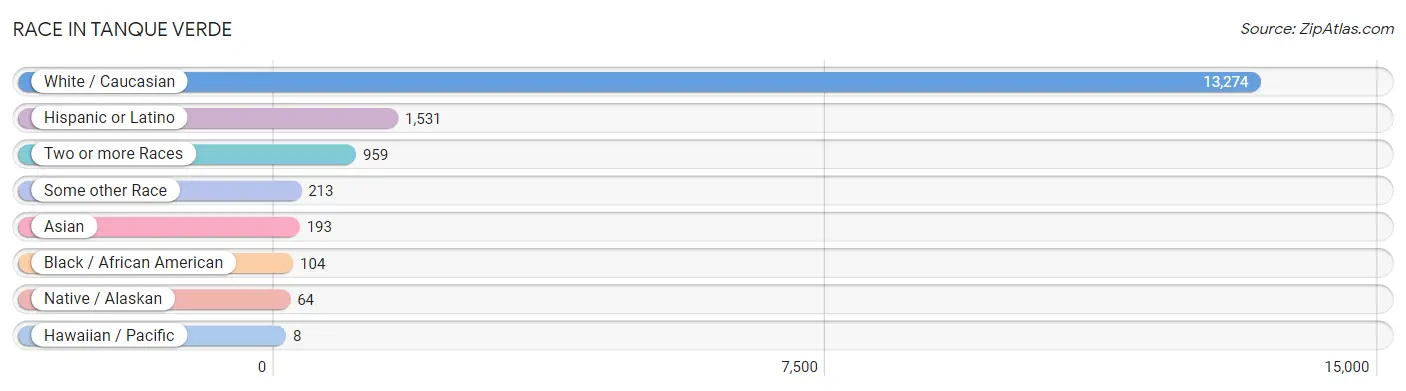
| Race | # Population | % Population |
| Asian | 193 | 1.3% |
| Black / African American | 104 | 0.7% |
| Hawaiian / Pacific | 8 | 0.1% |
| Hispanic or Latino | 1,531 | 10.3% |
| Native / Alaskan | 64 | 0.4% |
| White / Caucasian | 13,274 | 89.6% |
| Two or more Races | 959 | 6.5% |
| Some other Race | 213 | 1.4% |
| Total | 14,815 | 100.0% |
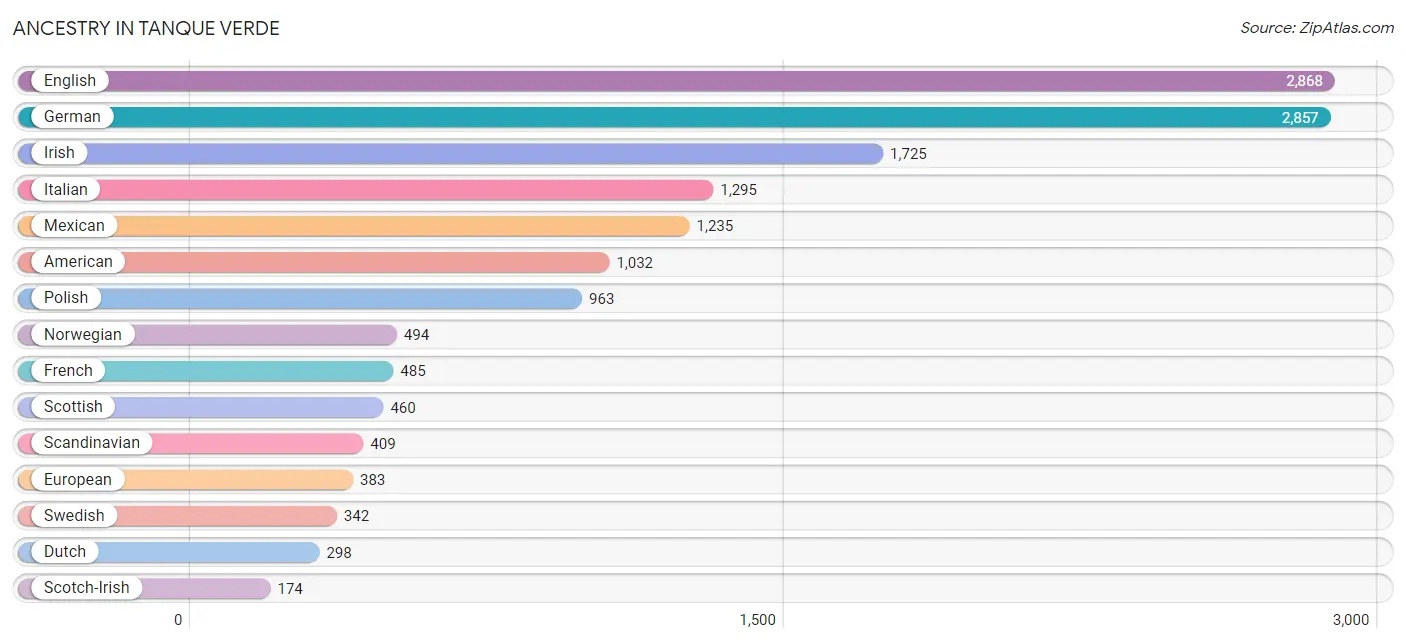
Ancestry in Tanque Verde
The most populous ancestries reported in Tanque Verde are English (2,868 | 19.4%), German (2,857 | 19.3%), Irish (1,725 | 11.6%), Italian (1,295 | 8.7%), and Mexican (1,235 | 8.3%), together accounting for 67.4% of all Tanque Verde residents.
| Ancestry | # Population | % Population |
| Afghan | 71 | 0.5% |
| African | 6 | 0.0% |
| American | 1,032 | 7.0% |
| Apache | 10 | 0.1% |
| Arab | 47 | 0.3% |
| Armenian | 35 | 0.2% |
| Australian | 5 | 0.0% |
| Austrian | 98 | 0.7% |
| Belgian | 5 | 0.0% |
| Bhutanese | 116 | 0.8% |
| Bolivian | 16 | 0.1% |
| British | 135 | 0.9% |
| Burmese | 28 | 0.2% |
| Canadian | 127 | 0.9% |
| Celtic | 13 | 0.1% |
| Central American | 58 | 0.4% |
| Central American Indian | 13 | 0.1% |
| Cherokee | 35 | 0.2% |
| Chilean | 9 | 0.1% |
| Chippewa | 5 | 0.0% |
| Choctaw | 4 | 0.0% |
| Colombian | 10 | 0.1% |
| Costa Rican | 58 | 0.4% |
| Cree | 1 | 0.0% |
| Croatian | 93 | 0.6% |
| Cuban | 7 | 0.1% |
| Czech | 130 | 0.9% |
| Czechoslovakian | 21 | 0.1% |
| Danish | 85 | 0.6% |
| Dutch | 298 | 2.0% |
| Eastern European | 55 | 0.4% |
| English | 2,868 | 19.4% |
| European | 383 | 2.6% |
| Finnish | 49 | 0.3% |
| French | 485 | 3.3% |
| French Canadian | 53 | 0.4% |
| German | 2,857 | 19.3% |
| Greek | 56 | 0.4% |
| Hungarian | 63 | 0.4% |
| Indian (Asian) | 122 | 0.8% |
| Irish | 1,725 | 11.6% |
| Iroquois | 5 | 0.0% |
| Israeli | 5 | 0.0% |
| Italian | 1,295 | 8.7% |
| Korean | 116 | 0.8% |
| Latvian | 24 | 0.2% |
| Lebanese | 47 | 0.3% |
| Lithuanian | 129 | 0.9% |
| Luxembourger | 12 | 0.1% |
| Maltese | 28 | 0.2% |
| Mexican | 1,235 | 8.3% |
| Native Hawaiian | 24 | 0.2% |
| Navajo | 1 | 0.0% |
| Nigerian | 19 | 0.1% |
| Northern European | 71 | 0.5% |
| Norwegian | 494 | 3.3% |
| Ottawa | 53 | 0.4% |
| Peruvian | 13 | 0.1% |
| Polish | 963 | 6.5% |
| Portuguese | 21 | 0.1% |
| Puerto Rican | 34 | 0.2% |
| Romanian | 19 | 0.1% |
| Russian | 164 | 1.1% |
| Scandinavian | 409 | 2.8% |
| Scotch-Irish | 174 | 1.2% |
| Scottish | 460 | 3.1% |
| Sioux | 12 | 0.1% |
| Slovak | 38 | 0.3% |
| Slovene | 15 | 0.1% |
| South American | 51 | 0.3% |
| Spaniard | 32 | 0.2% |
| Spanish | 30 | 0.2% |
| Sri Lankan | 36 | 0.2% |
| Subsaharan African | 25 | 0.2% |
| Swedish | 342 | 2.3% |
| Swiss | 90 | 0.6% |
| Thai | 31 | 0.2% |
| Tohono O'Odham | 1 | 0.0% |
| Ukrainian | 103 | 0.7% |
| Uruguayan | 3 | 0.0% |
| Welsh | 102 | 0.7% |
| Yugoslavian | 13 | 0.1% | View All 82 Rows |
Immigrants in Tanque Verde
The most numerous immigrant groups reported in Tanque Verde came from Latin America (342 | 2.3%), Europe (298 | 2.0%), Central America (279 | 1.9%), Mexico (247 | 1.7%), and Asia (159 | 1.1%), together accounting for 8.9% of all Tanque Verde residents.
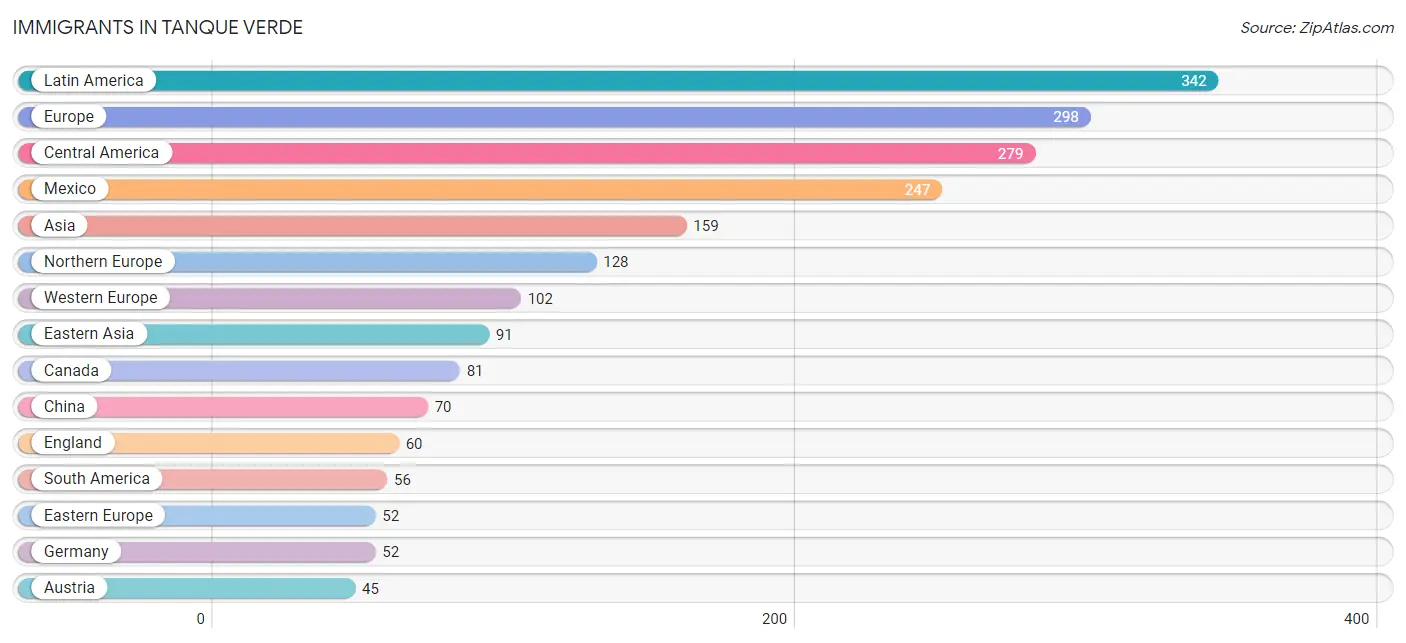
| Immigration Origin | # Population | % Population |
| Afghanistan | 20 | 0.1% |
| Armenia | 5 | 0.0% |
| Asia | 159 | 1.1% |
| Australia | 5 | 0.0% |
| Austria | 45 | 0.3% |
| Bolivia | 16 | 0.1% |
| Brazil | 11 | 0.1% |
| Canada | 81 | 0.5% |
| Caribbean | 7 | 0.1% |
| Central America | 279 | 1.9% |
| Chile | 9 | 0.1% |
| China | 70 | 0.5% |
| Colombia | 6 | 0.0% |
| Costa Rica | 32 | 0.2% |
| Cuba | 7 | 0.1% |
| Eastern Asia | 91 | 0.6% |
| Eastern Europe | 52 | 0.4% |
| England | 60 | 0.4% |
| Europe | 298 | 2.0% |
| Germany | 52 | 0.4% |
| Hungary | 5 | 0.0% |
| India | 25 | 0.2% |
| Ireland | 8 | 0.1% |
| Israel | 5 | 0.0% |
| Italy | 11 | 0.1% |
| Japan | 8 | 0.1% |
| Korea | 13 | 0.1% |
| Latin America | 342 | 2.3% |
| Mexico | 247 | 1.7% |
| Netherlands | 5 | 0.0% |
| Northern Europe | 128 | 0.9% |
| Oceania | 5 | 0.0% |
| Peru | 11 | 0.1% |
| Philippines | 9 | 0.1% |
| Poland | 9 | 0.1% |
| Russia | 38 | 0.3% |
| South America | 56 | 0.4% |
| South Central Asia | 45 | 0.3% |
| South Eastern Asia | 13 | 0.1% |
| Southern Europe | 16 | 0.1% |
| Spain | 5 | 0.0% |
| Taiwan | 22 | 0.2% |
| Uruguay | 3 | 0.0% |
| Vietnam | 4 | 0.0% |
| Western Asia | 10 | 0.1% |
| Western Europe | 102 | 0.7% | View All 46 Rows |
Sex and Age in Tanque Verde
Sex and Age in Tanque Verde
The most populous age groups in Tanque Verde are 65 to 69 Years (951 | 12.4%) for men and 65 to 69 Years (826 | 11.6%) for women.
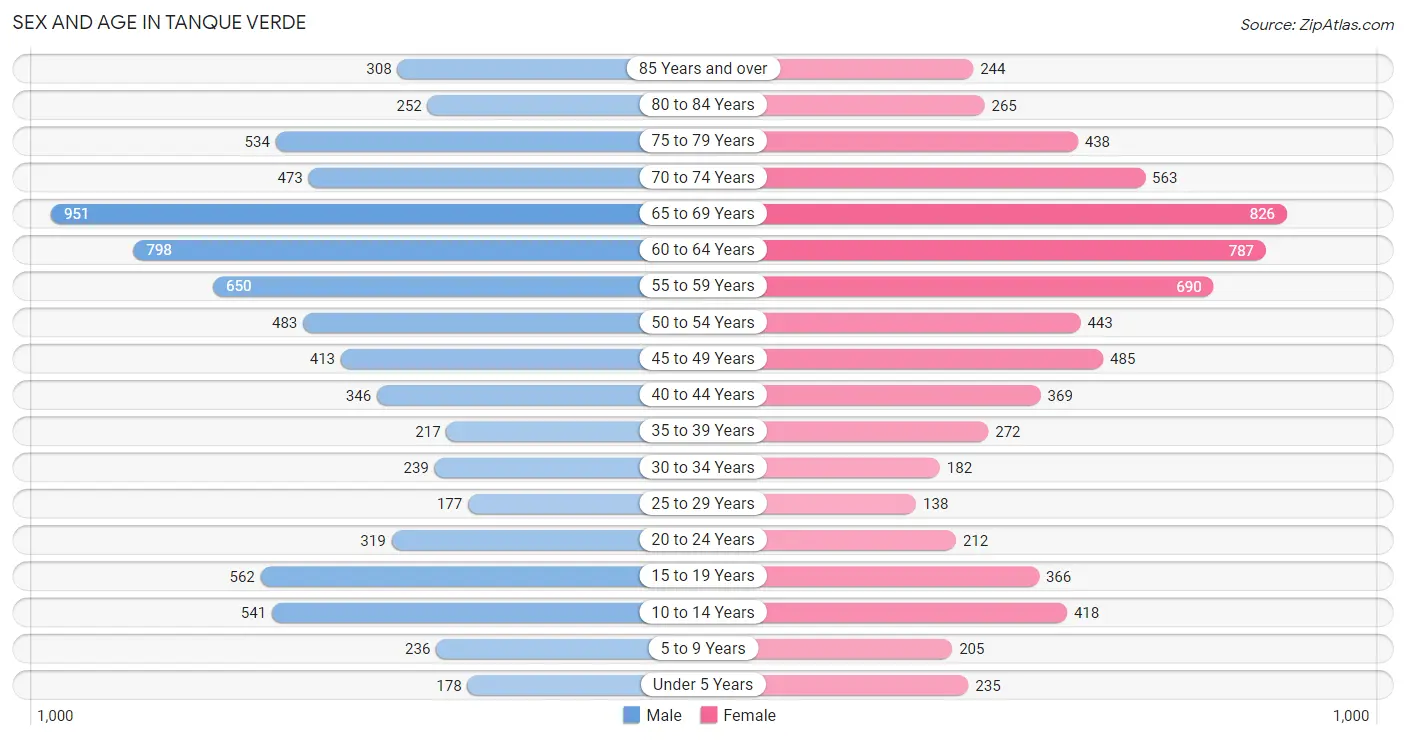
| Age Bracket | Male | Female |
| Under 5 Years | 178 (2.3%) | 235 (3.3%) |
| 5 to 9 Years | 236 (3.1%) | 205 (2.9%) |
| 10 to 14 Years | 541 (7.0%) | 418 (5.9%) |
| 15 to 19 Years | 562 (7.3%) | 366 (5.1%) |
| 20 to 24 Years | 319 (4.2%) | 212 (3.0%) |
| 25 to 29 Years | 177 (2.3%) | 138 (1.9%) |
| 30 to 34 Years | 239 (3.1%) | 182 (2.5%) |
| 35 to 39 Years | 217 (2.8%) | 272 (3.8%) |
| 40 to 44 Years | 346 (4.5%) | 369 (5.2%) |
| 45 to 49 Years | 413 (5.4%) | 485 (6.8%) |
| 50 to 54 Years | 483 (6.3%) | 443 (6.2%) |
| 55 to 59 Years | 650 (8.5%) | 690 (9.7%) |
| 60 to 64 Years | 798 (10.4%) | 787 (11.0%) |
| 65 to 69 Years | 951 (12.4%) | 826 (11.6%) |
| 70 to 74 Years | 473 (6.2%) | 563 (7.9%) |
| 75 to 79 Years | 534 (7.0%) | 438 (6.1%) |
| 80 to 84 Years | 252 (3.3%) | 265 (3.7%) |
| 85 Years and over | 308 (4.0%) | 244 (3.4%) |
| Total | 7,677 (100.0%) | 7,138 (100.0%) |
Families and Households in Tanque Verde
Median Family Size in Tanque Verde
The median family size in Tanque Verde is 2.81 persons per family, with married-couple families (4,099 | 89.1%) accounting for the largest median family size of 2.84 persons per family. On the other hand, single male/father families (223 | 4.9%) represent the smallest median family size with 2.43 persons per family.
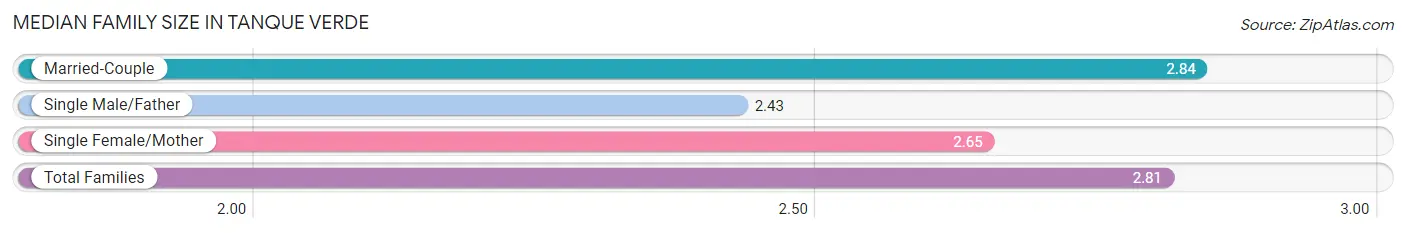
| Family Type | # Families | Family Size |
| Married-Couple | 4,099 (89.1%) | 2.84 |
| Single Male/Father | 223 (4.9%) | 2.43 |
| Single Female/Mother | 277 (6.0%) | 2.65 |
| Total Families | 4,599 (100.0%) | 2.81 |
Median Household Size in Tanque Verde
The median household size in Tanque Verde is 2.43 persons per household, with married-couple households (4,099 | 67.8%) accounting for the largest median household size of 2.85 persons per household. non-family households (1,449 | 24.0%) represent the smallest median household size with 1.15 persons per household.
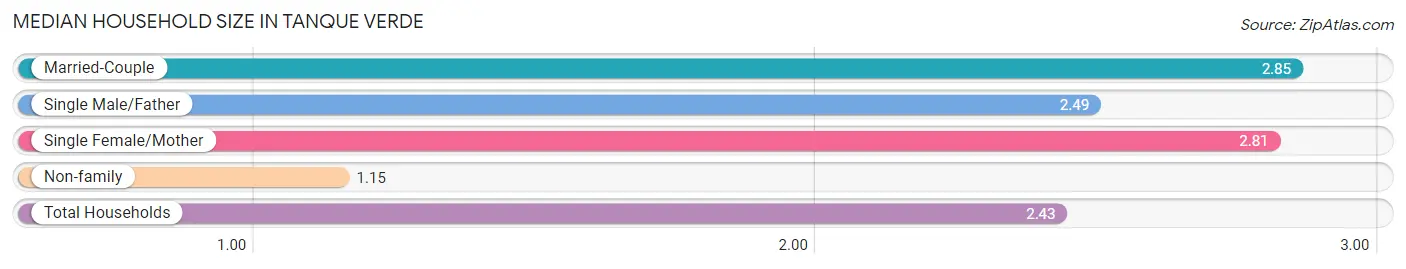
| Household Type | # Households | Household Size |
| Married-Couple | 4,099 (67.8%) | 2.85 |
| Single Male/Father | 223 (3.7%) | 2.49 |
| Single Female/Mother | 277 (4.6%) | 2.81 |
| Non-family | 1,449 (24.0%) | 1.15 |
| Total Households | 6,048 (100.0%) | 2.43 |
Household Size by Marriage Status in Tanque Verde
Out of a total of 6,048 households in Tanque Verde, 4,599 (76.0%) are family households, while 1,449 (24.0%) are nonfamily households. The most numerous type of family households are 2-person households, comprising 2,841, and the most common type of nonfamily households are 1-person households, comprising 1,242.
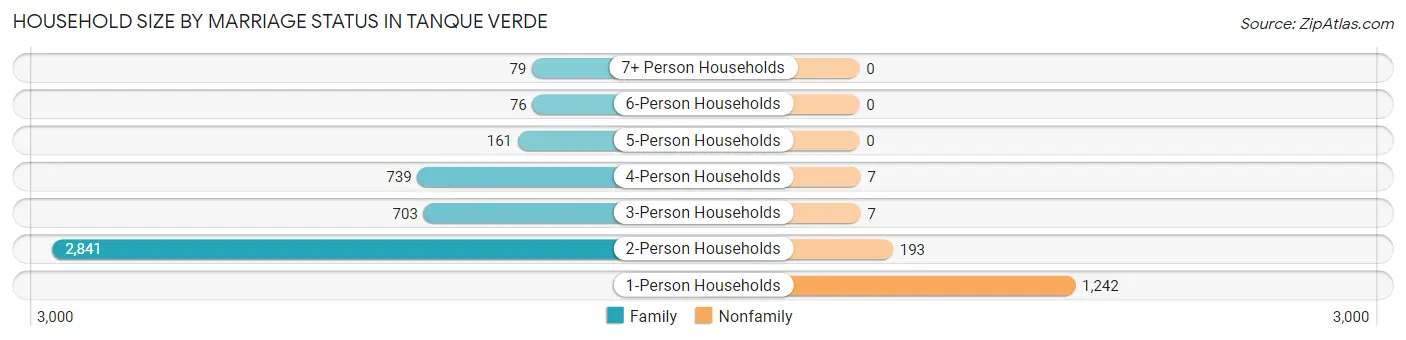
| Household Size | Family Households | Nonfamily Households |
| 1-Person Households | - | 1,242 (20.5%) |
| 2-Person Households | 2,841 (47.0%) | 193 (3.2%) |
| 3-Person Households | 703 (11.6%) | 7 (0.1%) |
| 4-Person Households | 739 (12.2%) | 7 (0.1%) |
| 5-Person Households | 161 (2.7%) | 0 (0.0%) |
| 6-Person Households | 76 (1.3%) | 0 (0.0%) |
| 7+ Person Households | 79 (1.3%) | 0 (0.0%) |
| Total | 4,599 (76.0%) | 1,449 (24.0%) |
Female Fertility in Tanque Verde
Fertility by Age in Tanque Verde
Average fertility rate in Tanque Verde is 27.0 births per 1,000 women. Women in the age bracket of 20 to 34 years have the highest fertility rate with 55.0 births per 1,000 women. Women in the age bracket of 20 to 34 years acount for 52.7% of all women with births.
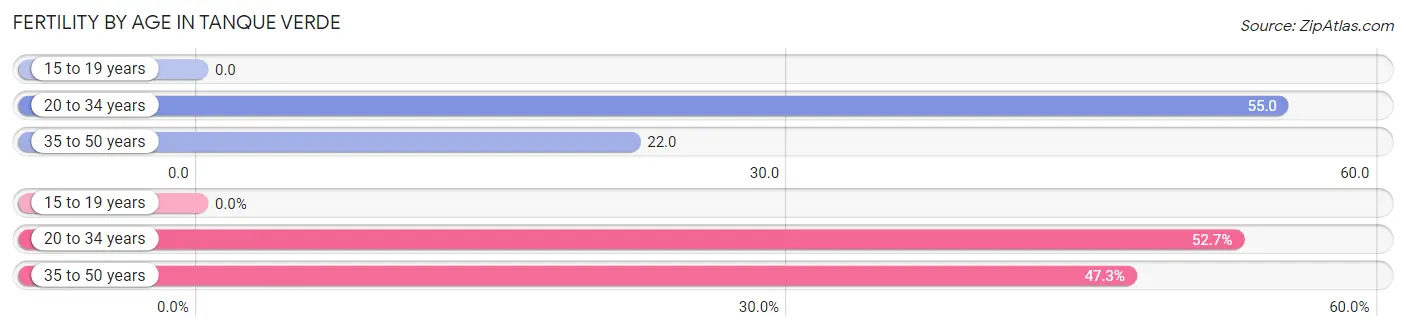
| Age Bracket | Women with Births | Births / 1,000 Women |
| 15 to 19 years | 0 (0.0%) | 0.0 |
| 20 to 34 years | 29 (52.7%) | 55.0 |
| 35 to 50 years | 26 (47.3%) | 22.0 |
| Total | 55 (100.0%) | 27.0 |
Fertility by Age by Marriage Status in Tanque Verde
81.8% of women with births (55) in Tanque Verde are married. The highest percentage of unmarried women with births falls into 20 to 34 years age bracket with 34.5% of them unmarried at the time of birth, while the lowest percentage of unmarried women with births belong to 35 to 50 years age bracket with 0.0% of them unmarried.
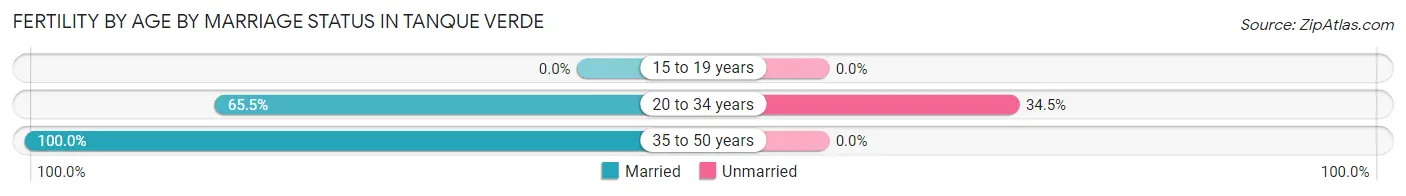
| Age Bracket | Married | Unmarried |
| 15 to 19 years | 0 (0.0%) | 0 (0.0%) |
| 20 to 34 years | 19 (65.5%) | 10 (34.5%) |
| 35 to 50 years | 26 (100.0%) | 0 (0.0%) |
| Total | 45 (81.8%) | 10 (18.2%) |
Fertility by Education in Tanque Verde
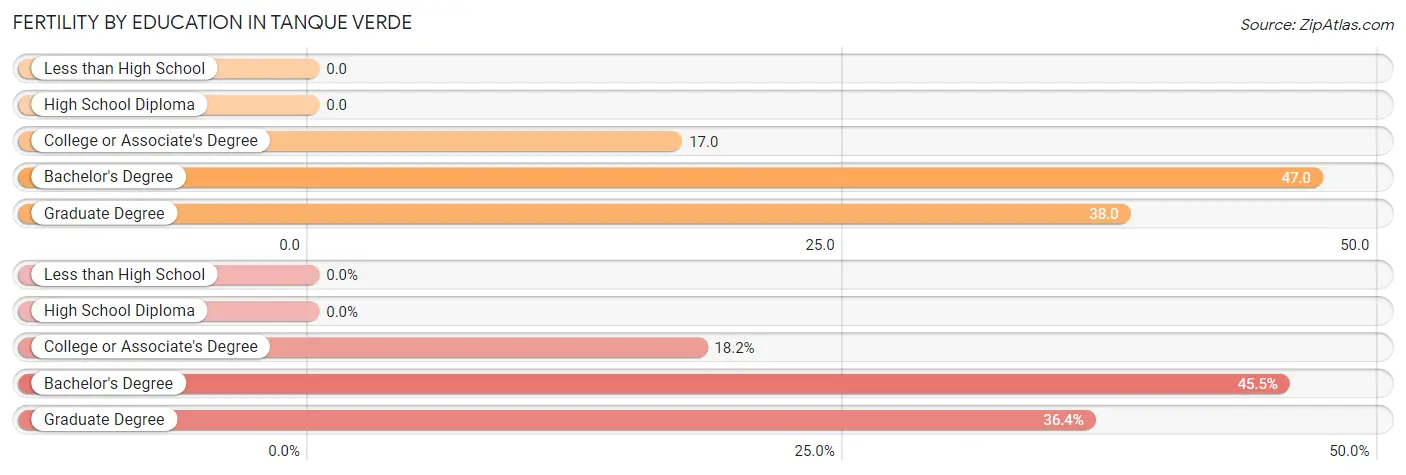
| Educational Attainment | Women with Births | Births / 1,000 Women |
| Less than High School | 0 (0.0%) | 0.0 |
| High School Diploma | 0 (0.0%) | 0.0 |
| College or Associate's Degree | 10 (18.2%) | 17.0 |
| Bachelor's Degree | 25 (45.5%) | 47.0 |
| Graduate Degree | 20 (36.4%) | 38.0 |
| Total | 55 (100.0%) | 27.0 |
Fertility by Education by Marriage Status in Tanque Verde
18.2% of women with births in Tanque Verde are unmarried. Women with the educational attainment of bachelor's degree are most likely to be married with 100.0% of them married at childbirth, while women with the educational attainment of college or associate's degree are least likely to be married with 100.0% of them unmarried at childbirth.
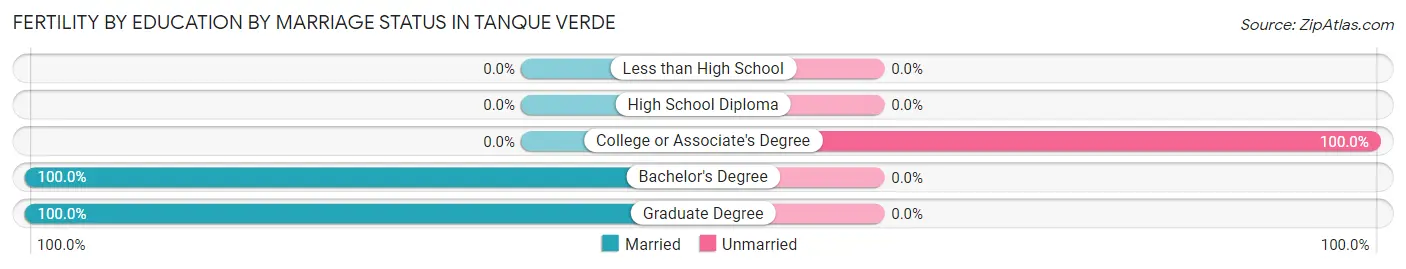
| Educational Attainment | Married | Unmarried |
| Less than High School | 0 (0.0%) | 0 (0.0%) |
| High School Diploma | 0 (0.0%) | 0 (0.0%) |
| College or Associate's Degree | 0 (0.0%) | 10 (100.0%) |
| Bachelor's Degree | 25 (100.0%) | 0 (0.0%) |
| Graduate Degree | 20 (100.0%) | 0 (0.0%) |
| Total | 45 (81.8%) | 10 (18.2%) |
Employment Characteristics in Tanque Verde
Employment by Class of Employer in Tanque Verde
Among the 6,036 employed individuals in Tanque Verde, private company employees (3,178 | 52.6%), self-employed (incorporated) (728 | 12.1%), and self-employed (not incorporated) (634 | 10.5%) make up the most common classes of employment.
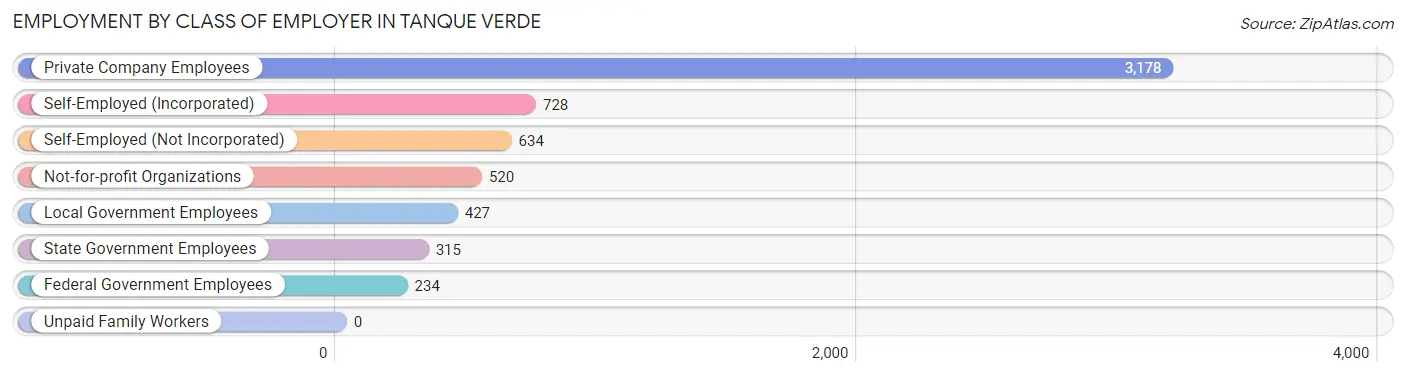
| Employer Class | # Employees | % Employees |
| Private Company Employees | 3,178 | 52.6% |
| Self-Employed (Incorporated) | 728 | 12.1% |
| Self-Employed (Not Incorporated) | 634 | 10.5% |
| Not-for-profit Organizations | 520 | 8.6% |
| Local Government Employees | 427 | 7.1% |
| State Government Employees | 315 | 5.2% |
| Federal Government Employees | 234 | 3.9% |
| Unpaid Family Workers | 0 | 0.0% |
| Total | 6,036 | 100.0% |
Employment Status by Age in Tanque Verde
According to the labor force statistics for Tanque Verde, out of the total population over 16 years of age (12,812), 50.1% or 6,419 individuals are in the labor force, with 4.8% or 308 of them unemployed. The age group with the highest labor force participation rate is 45 to 54 years, with 86.6% or 1,580 individuals in the labor force. Within the labor force, the 25 to 29 years age range has the highest percentage of unemployed individuals, with 47.1% or 126 of them being unemployed.
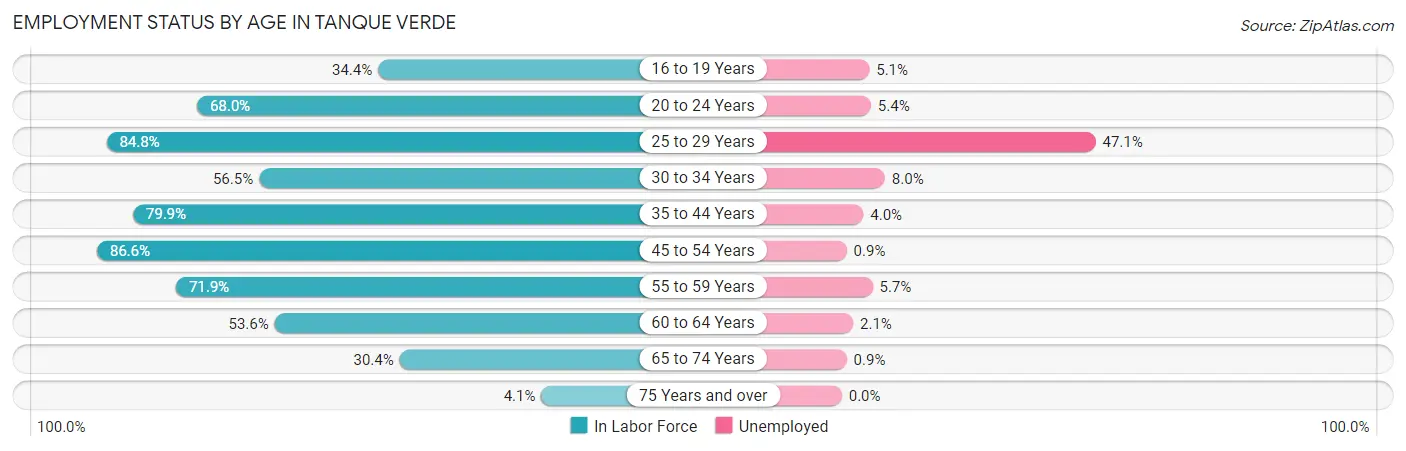
| Age Bracket | In Labor Force | Unemployed |
| 16 to 19 Years | 254 (34.4%) | 13 (5.1%) |
| 20 to 24 Years | 361 (68.0%) | 19 (5.4%) |
| 25 to 29 Years | 267 (84.8%) | 126 (47.1%) |
| 30 to 34 Years | 238 (56.5%) | 19 (8.0%) |
| 35 to 44 Years | 962 (79.9%) | 38 (4.0%) |
| 45 to 54 Years | 1,580 (86.6%) | 14 (0.9%) |
| 55 to 59 Years | 963 (71.9%) | 55 (5.7%) |
| 60 to 64 Years | 850 (53.6%) | 18 (2.1%) |
| 65 to 74 Years | 855 (30.4%) | 8 (0.9%) |
| 75 Years and over | 84 (4.1%) | 0 (0.0%) |
| Total | 6,419 (50.1%) | 308 (4.8%) |
Employment Status by Educational Attainment in Tanque Verde
According to labor force statistics for Tanque Verde, 72.7% of individuals (4,863) out of the total population between 25 and 64 years of age (6,689) are in the labor force, with 5.5% or 267 of them being unemployed. The group with the highest labor force participation rate are those with the educational attainment of bachelor's degree or higher, with 79.7% or 3,183 individuals in the labor force. Within the labor force, individuals with college / associate degree education have the highest percentage of unemployment, with 10.8% or 127 of them being unemployed.
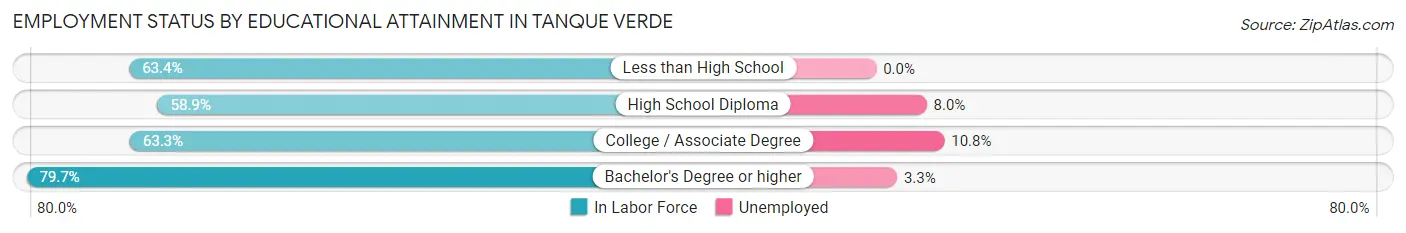
| Educational Attainment | In Labor Force | Unemployed |
| Less than High School | 85 (63.4%) | 0 (0.0%) |
| High School Diploma | 411 (58.9%) | 56 (8.0%) |
| College / Associate Degree | 1,179 (63.3%) | 201 (10.8%) |
| Bachelor's Degree or higher | 3,183 (79.7%) | 132 (3.3%) |
| Total | 4,863 (72.7%) | 368 (5.5%) |
Employment Occupations by Sex in Tanque Verde
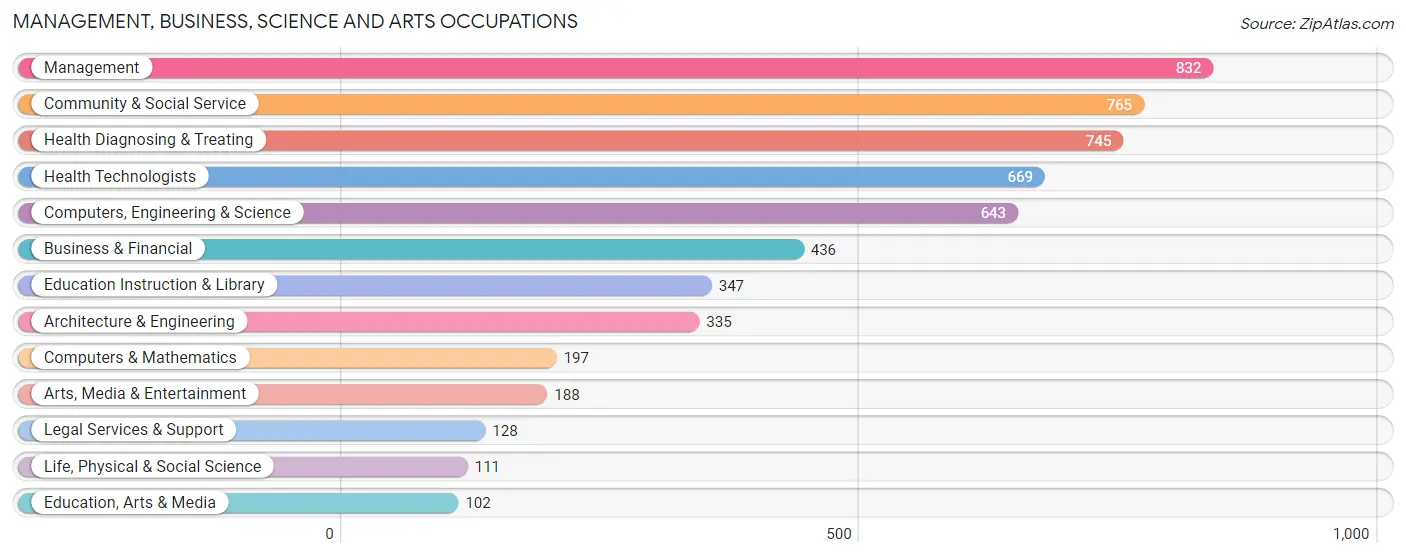
Management, Business, Science and Arts Occupations
The most common Management, Business, Science and Arts occupations in Tanque Verde are Management (832 | 13.7%), Community & Social Service (765 | 12.6%), Health Diagnosing & Treating (745 | 12.2%), Health Technologists (669 | 11.0%), and Computers, Engineering & Science (643 | 10.5%).
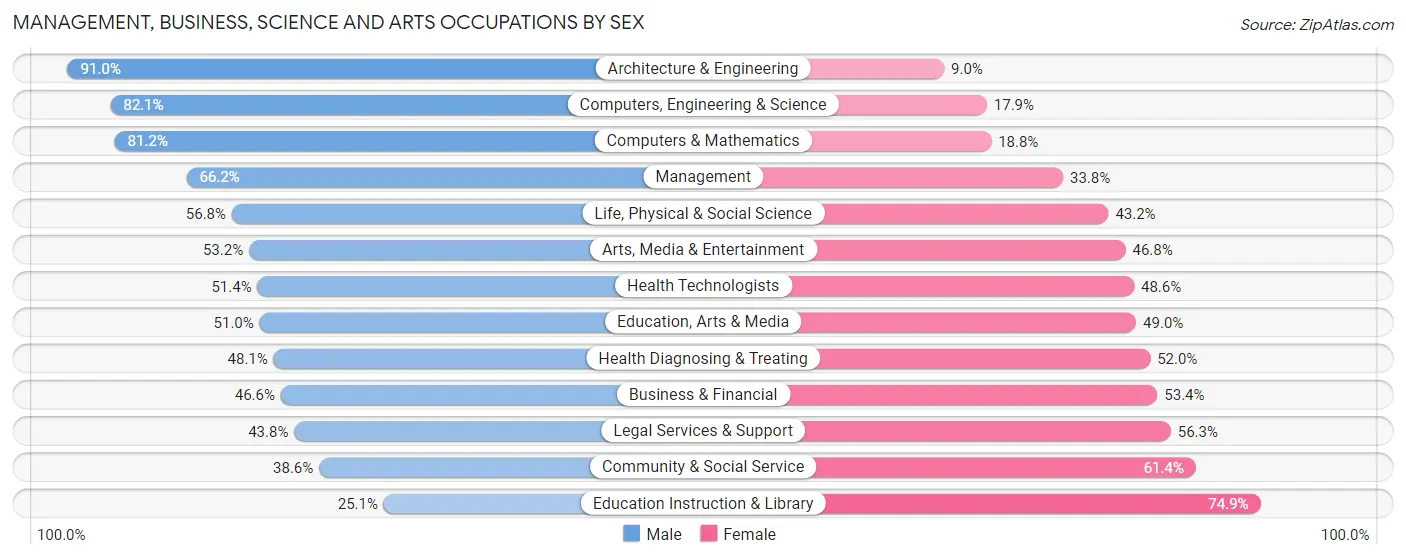
Management, Business, Science and Arts Occupations by Sex
Within the Management, Business, Science and Arts occupations in Tanque Verde, the most male-oriented occupations are Architecture & Engineering (91.0%), Computers, Engineering & Science (82.1%), and Computers & Mathematics (81.2%), while the most female-oriented occupations are Education Instruction & Library (74.9%), Community & Social Service (61.4%), and Legal Services & Support (56.2%).
| Occupation | Male | Female |
| Management | 551 (66.2%) | 281 (33.8%) |
| Business & Financial | 203 (46.6%) | 233 (53.4%) |
| Computers, Engineering & Science | 528 (82.1%) | 115 (17.9%) |
| Computers & Mathematics | 160 (81.2%) | 37 (18.8%) |
| Architecture & Engineering | 305 (91.0%) | 30 (9.0%) |
| Life, Physical & Social Science | 63 (56.8%) | 48 (43.2%) |
| Community & Social Service | 295 (38.6%) | 470 (61.4%) |
| Education, Arts & Media | 52 (51.0%) | 50 (49.0%) |
| Legal Services & Support | 56 (43.8%) | 72 (56.2%) |
| Education Instruction & Library | 87 (25.1%) | 260 (74.9%) |
| Arts, Media & Entertainment | 100 (53.2%) | 88 (46.8%) |
| Health Diagnosing & Treating | 358 (48.0%) | 387 (51.9%) |
| Health Technologists | 344 (51.4%) | 325 (48.6%) |
| Total (Category) | 1,935 (56.6%) | 1,486 (43.4%) |
| Total (Overall) | 3,468 (56.9%) | 2,624 (43.1%) |
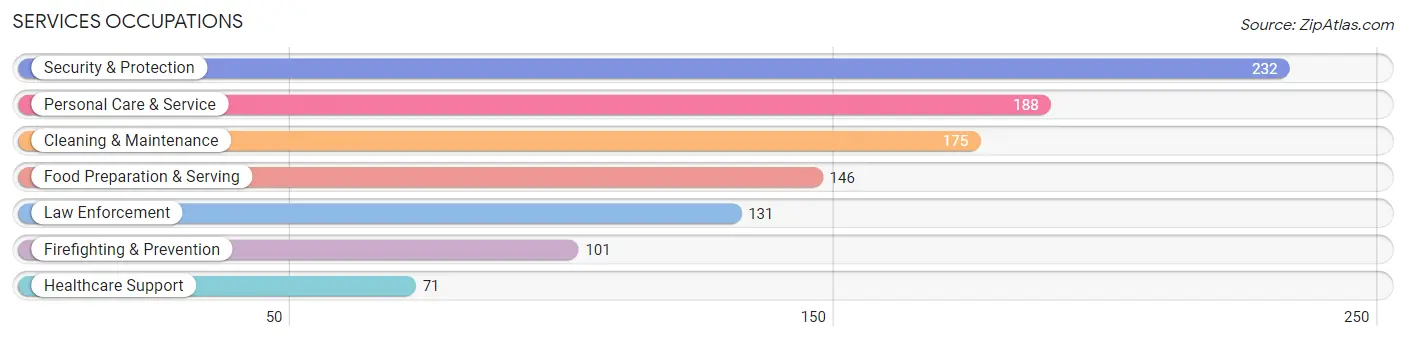
Services Occupations
The most common Services occupations in Tanque Verde are Security & Protection (232 | 3.8%), Personal Care & Service (188 | 3.1%), Cleaning & Maintenance (175 | 2.9%), Food Preparation & Serving (146 | 2.4%), and Law Enforcement (131 | 2.1%).
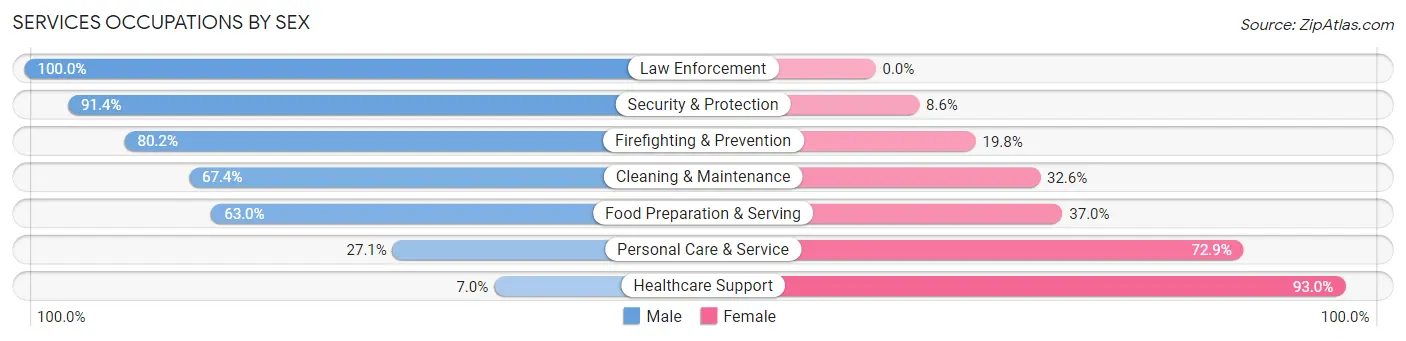
Services Occupations by Sex
Within the Services occupations in Tanque Verde, the most male-oriented occupations are Law Enforcement (100.0%), Security & Protection (91.4%), and Firefighting & Prevention (80.2%), while the most female-oriented occupations are Healthcare Support (93.0%), Personal Care & Service (72.9%), and Food Preparation & Serving (37.0%).
| Occupation | Male | Female |
| Healthcare Support | 5 (7.0%) | 66 (93.0%) |
| Security & Protection | 212 (91.4%) | 20 (8.6%) |
| Firefighting & Prevention | 81 (80.2%) | 20 (19.8%) |
| Law Enforcement | 131 (100.0%) | 0 (0.0%) |
| Food Preparation & Serving | 92 (63.0%) | 54 (37.0%) |
| Cleaning & Maintenance | 118 (67.4%) | 57 (32.6%) |
| Personal Care & Service | 51 (27.1%) | 137 (72.9%) |
| Total (Category) | 478 (58.9%) | 334 (41.1%) |
| Total (Overall) | 3,468 (56.9%) | 2,624 (43.1%) |
Sales and Office Occupations
The most common Sales and Office occupations in Tanque Verde are Office & Administration (674 | 11.1%), and Sales & Related (589 | 9.7%).
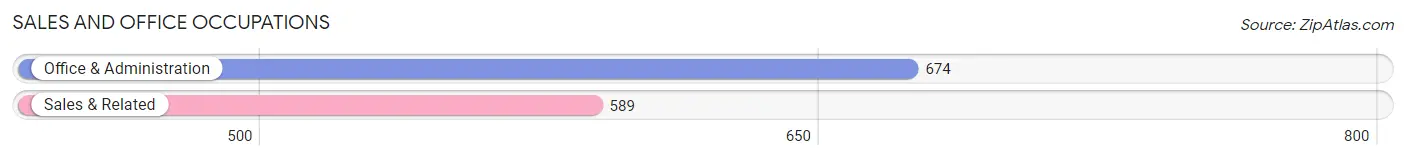
Sales and Office Occupations by Sex
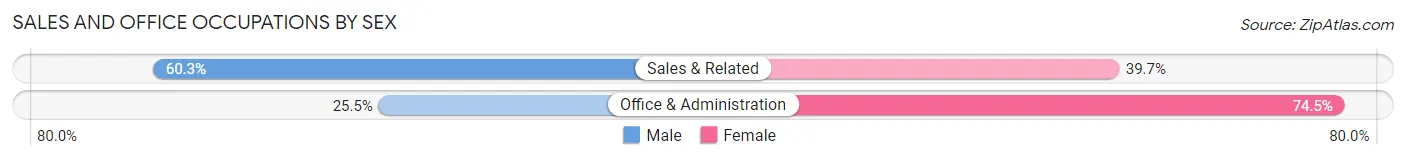
| Occupation | Male | Female |
| Sales & Related | 355 (60.3%) | 234 (39.7%) |
| Office & Administration | 172 (25.5%) | 502 (74.5%) |
| Total (Category) | 527 (41.7%) | 736 (58.3%) |
| Total (Overall) | 3,468 (56.9%) | 2,624 (43.1%) |
Natural Resources, Construction and Maintenance Occupations
The most common Natural Resources, Construction and Maintenance occupations in Tanque Verde are Installation, Maintenance & Repair (208 | 3.4%), Construction & Extraction (120 | 2.0%), and Farming, Fishing & Forestry (4 | 0.1%).
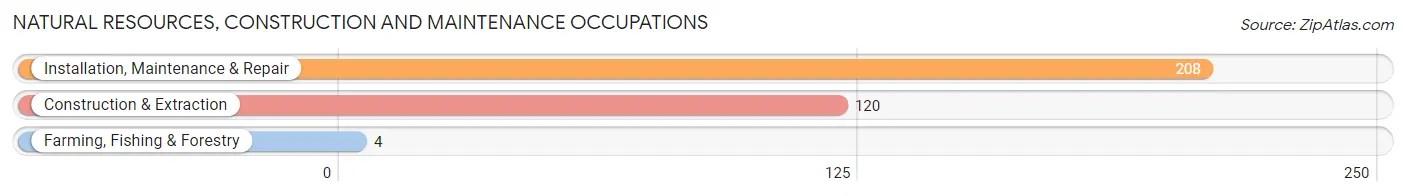
Natural Resources, Construction and Maintenance Occupations by Sex
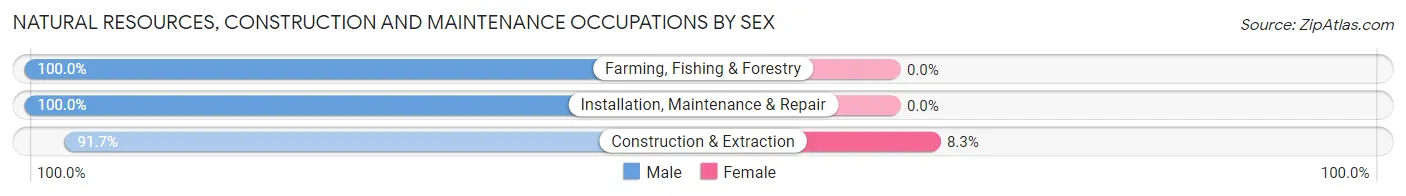
| Occupation | Male | Female |
| Farming, Fishing & Forestry | 4 (100.0%) | 0 (0.0%) |
| Construction & Extraction | 110 (91.7%) | 10 (8.3%) |
| Installation, Maintenance & Repair | 208 (100.0%) | 0 (0.0%) |
| Total (Category) | 322 (97.0%) | 10 (3.0%) |
| Total (Overall) | 3,468 (56.9%) | 2,624 (43.1%) |
Production, Transportation and Moving Occupations
The most common Production, Transportation and Moving occupations in Tanque Verde are Transportation (112 | 1.8%), Production (107 | 1.8%), and Material Moving (45 | 0.7%).
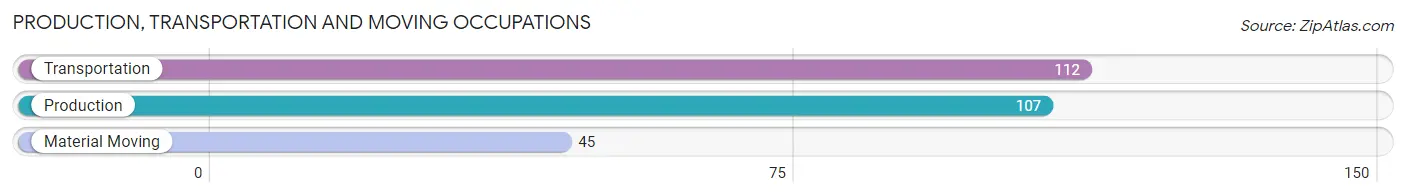
Production, Transportation and Moving Occupations by Sex
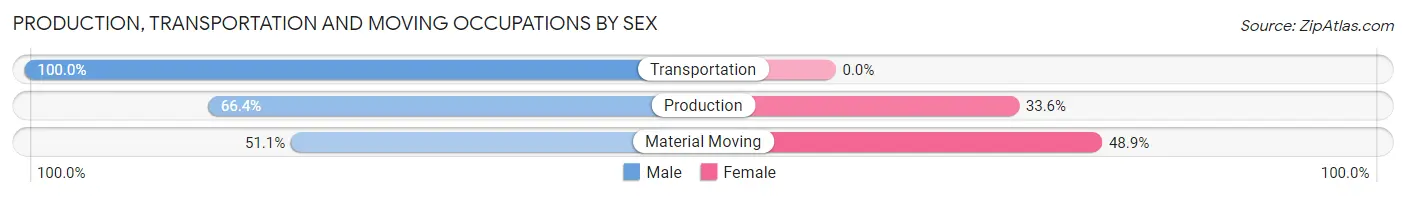
| Occupation | Male | Female |
| Production | 71 (66.4%) | 36 (33.6%) |
| Transportation | 112 (100.0%) | 0 (0.0%) |
| Material Moving | 23 (51.1%) | 22 (48.9%) |
| Total (Category) | 206 (78.0%) | 58 (22.0%) |
| Total (Overall) | 3,468 (56.9%) | 2,624 (43.1%) |
Employment Industries by Sex in Tanque Verde
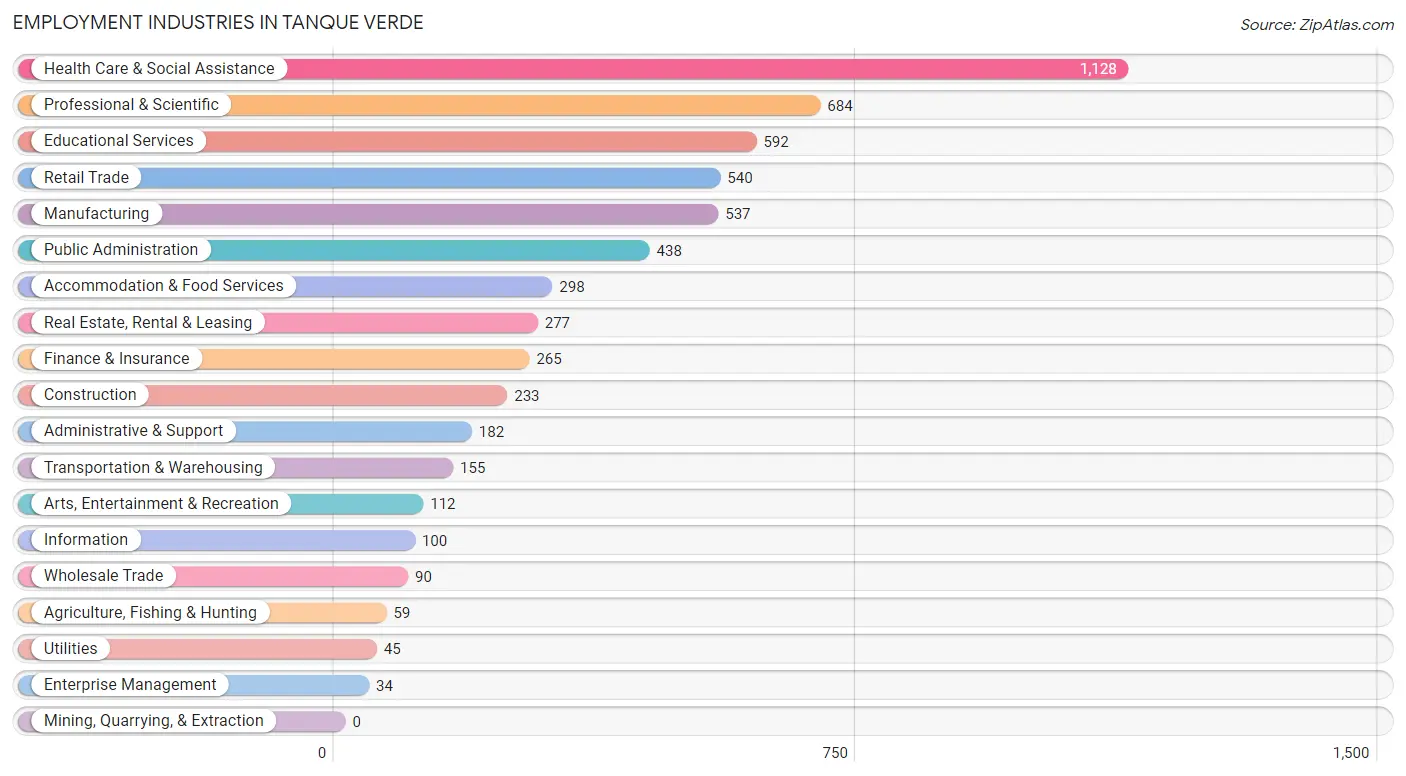
Employment Industries in Tanque Verde
The major employment industries in Tanque Verde include Health Care & Social Assistance (1,128 | 18.5%), Professional & Scientific (684 | 11.2%), Educational Services (592 | 9.7%), Retail Trade (540 | 8.9%), and Manufacturing (537 | 8.8%).
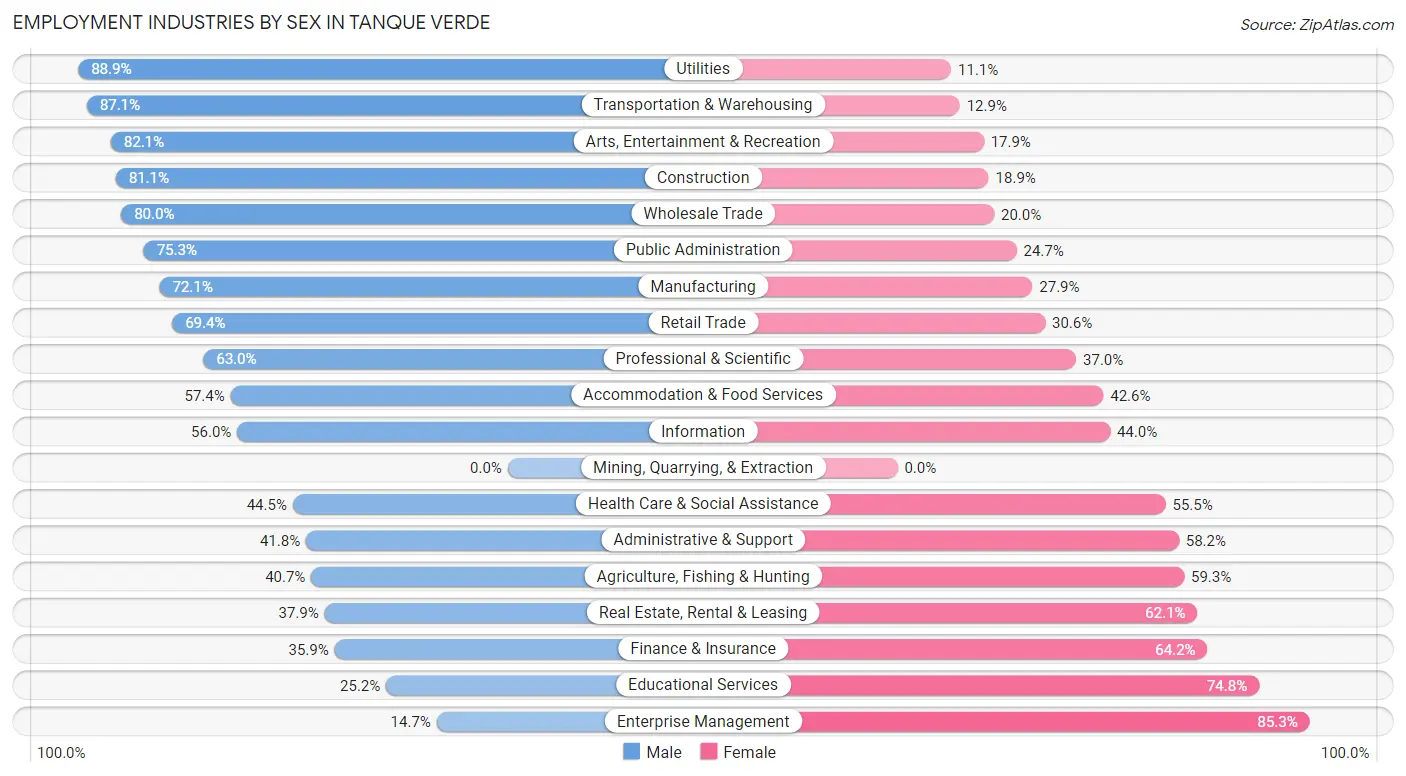
Employment Industries by Sex in Tanque Verde
The Tanque Verde industries that see more men than women are Utilities (88.9%), Transportation & Warehousing (87.1%), and Arts, Entertainment & Recreation (82.1%), whereas the industries that tend to have a higher number of women are Enterprise Management (85.3%), Educational Services (74.8%), and Finance & Insurance (64.1%).
| Industry | Male | Female |
| Agriculture, Fishing & Hunting | 24 (40.7%) | 35 (59.3%) |
| Mining, Quarrying, & Extraction | 0 (0.0%) | 0 (0.0%) |
| Construction | 189 (81.1%) | 44 (18.9%) |
| Manufacturing | 387 (72.1%) | 150 (27.9%) |
| Wholesale Trade | 72 (80.0%) | 18 (20.0%) |
| Retail Trade | 375 (69.4%) | 165 (30.6%) |
| Transportation & Warehousing | 135 (87.1%) | 20 (12.9%) |
| Utilities | 40 (88.9%) | 5 (11.1%) |
| Information | 56 (56.0%) | 44 (44.0%) |
| Finance & Insurance | 95 (35.8%) | 170 (64.1%) |
| Real Estate, Rental & Leasing | 105 (37.9%) | 172 (62.1%) |
| Professional & Scientific | 431 (63.0%) | 253 (37.0%) |
| Enterprise Management | 5 (14.7%) | 29 (85.3%) |
| Administrative & Support | 76 (41.8%) | 106 (58.2%) |
| Educational Services | 149 (25.2%) | 443 (74.8%) |
| Health Care & Social Assistance | 502 (44.5%) | 626 (55.5%) |
| Arts, Entertainment & Recreation | 92 (82.1%) | 20 (17.9%) |
| Accommodation & Food Services | 171 (57.4%) | 127 (42.6%) |
| Public Administration | 330 (75.3%) | 108 (24.7%) |
| Total | 3,468 (56.9%) | 2,624 (43.1%) |
Education in Tanque Verde
School Enrollment in Tanque Verde
The most common levels of schooling among the 2,883 students in Tanque Verde are high school (882 | 30.6%), middle school (705 | 24.4%), and college / undergraduate (668 | 23.2%).
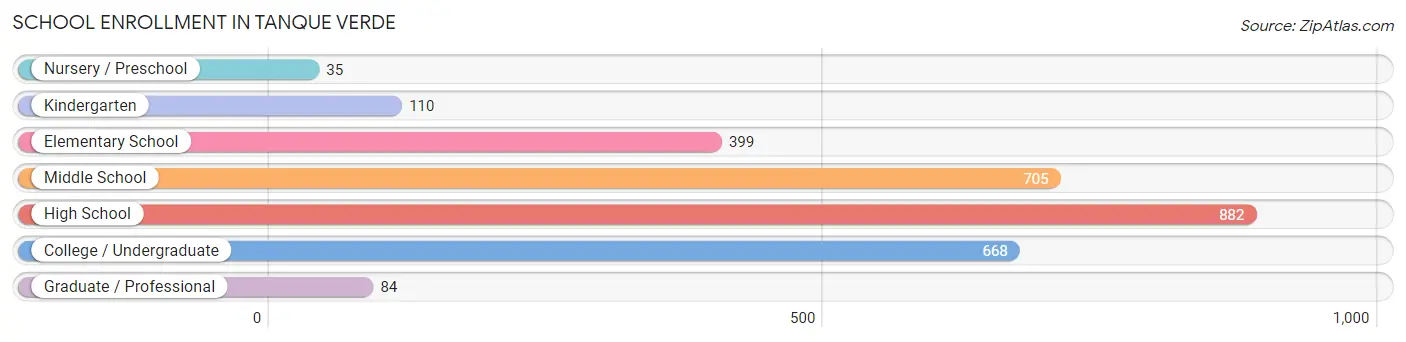
| School Level | # Students | % Students |
| Nursery / Preschool | 35 | 1.2% |
| Kindergarten | 110 | 3.8% |
| Elementary School | 399 | 13.8% |
| Middle School | 705 | 24.4% |
| High School | 882 | 30.6% |
| College / Undergraduate | 668 | 23.2% |
| Graduate / Professional | 84 | 2.9% |
| Total | 2,883 | 100.0% |
School Enrollment by Age by Funding Source in Tanque Verde
Out of a total of 2,883 students who are enrolled in schools in Tanque Verde, 507 (17.6%) attend a private institution, while the remaining 2,376 (82.4%) are enrolled in public schools. The age group of 35 years and over has the highest likelihood of being enrolled in private schools, with 55 (47.8% in the age bracket) enrolled. Conversely, the age group of 20 to 24 year olds has the lowest likelihood of being enrolled in a private school, with 353 (95.2% in the age bracket) attending a public institution.
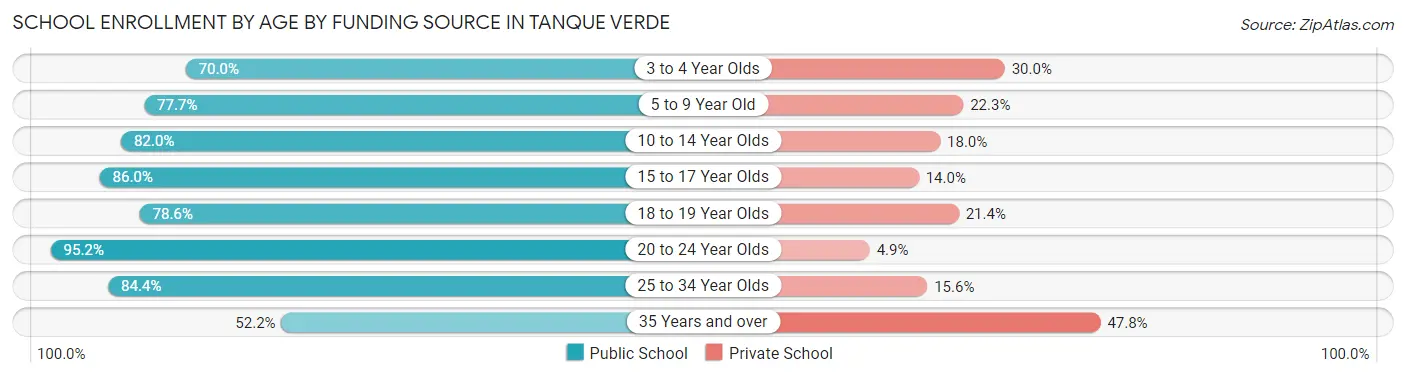
| Age Bracket | Public School | Private School |
| 3 to 4 Year Olds | 21 (70.0%) | 9 (30.0%) |
| 5 to 9 Year Old | 328 (77.7%) | 94 (22.3%) |
| 10 to 14 Year Olds | 781 (82.0%) | 171 (18.0%) |
| 15 to 17 Year Olds | 560 (86.0%) | 91 (14.0%) |
| 18 to 19 Year Olds | 198 (78.6%) | 54 (21.4%) |
| 20 to 24 Year Olds | 353 (95.2%) | 18 (4.9%) |
| 25 to 34 Year Olds | 76 (84.4%) | 14 (15.6%) |
| 35 Years and over | 60 (52.2%) | 55 (47.8%) |
| Total | 2,376 (82.4%) | 507 (17.6%) |
Educational Attainment by Field of Study in Tanque Verde
Business (1,218 | 16.6%), engineering (787 | 10.7%), science & technology (689 | 9.4%), bio, nature & agricultural (677 | 9.2%), and education (662 | 9.0%) are the most common fields of study among 7,321 individuals in Tanque Verde who have obtained a bachelor's degree or higher.
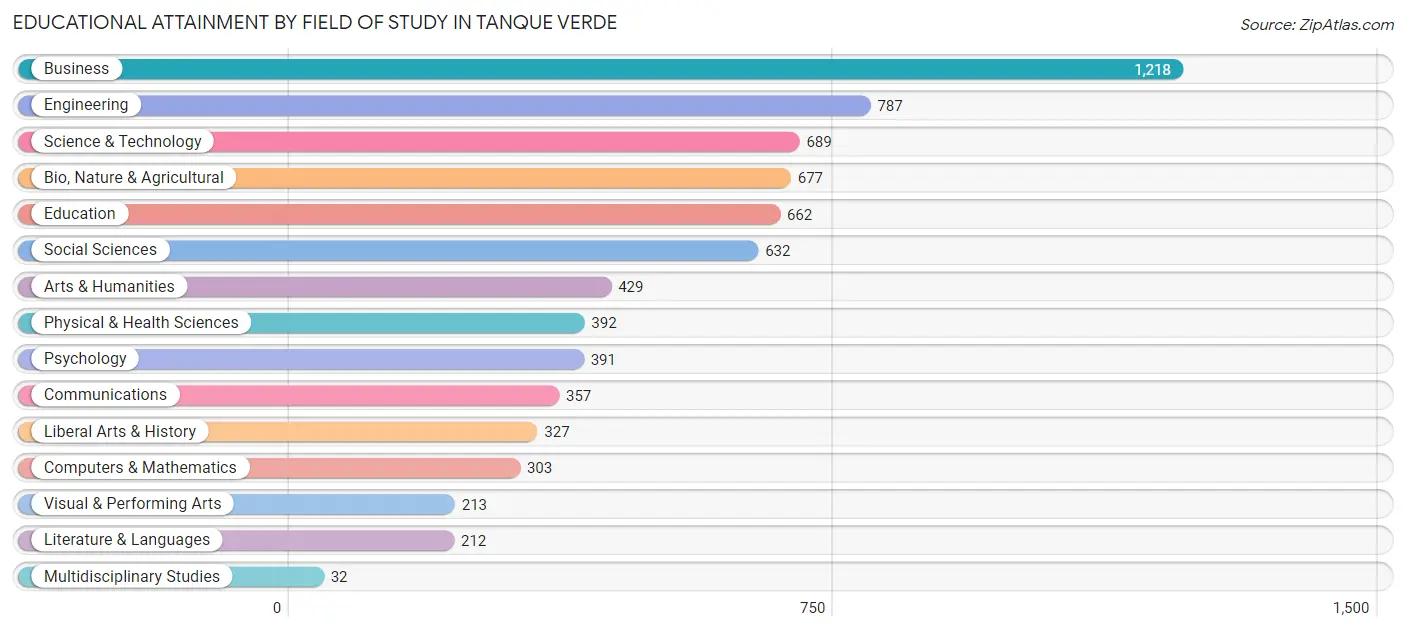
| Field of Study | # Graduates | % Graduates |
| Computers & Mathematics | 303 | 4.1% |
| Bio, Nature & Agricultural | 677 | 9.2% |
| Physical & Health Sciences | 392 | 5.3% |
| Psychology | 391 | 5.3% |
| Social Sciences | 632 | 8.6% |
| Engineering | 787 | 10.7% |
| Multidisciplinary Studies | 32 | 0.4% |
| Science & Technology | 689 | 9.4% |
| Business | 1,218 | 16.6% |
| Education | 662 | 9.0% |
| Literature & Languages | 212 | 2.9% |
| Liberal Arts & History | 327 | 4.5% |
| Visual & Performing Arts | 213 | 2.9% |
| Communications | 357 | 4.9% |
| Arts & Humanities | 429 | 5.9% |
| Total | 7,321 | 100.0% |
Transportation & Commute in Tanque Verde
Vehicle Availability by Sex in Tanque Verde
The most prevalent vehicle ownership categories in Tanque Verde are males with 2 vehicles (1,278, accounting for 37.4%) and females with 2 vehicles (992, making up 49.3%).
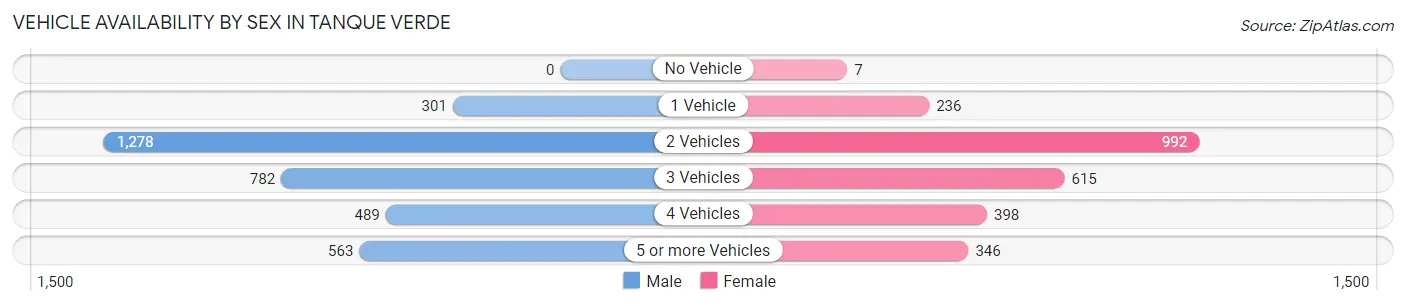
| Vehicles Available | Male | Female |
| No Vehicle | 0 (0.0%) | 7 (0.3%) |
| 1 Vehicle | 301 (8.8%) | 236 (9.1%) |
| 2 Vehicles | 1,278 (37.4%) | 992 (38.2%) |
| 3 Vehicles | 782 (22.9%) | 615 (23.7%) |
| 4 Vehicles | 489 (14.3%) | 398 (15.3%) |
| 5 or more Vehicles | 563 (16.5%) | 346 (13.3%) |
| Total | 3,413 (100.0%) | 2,594 (100.0%) |
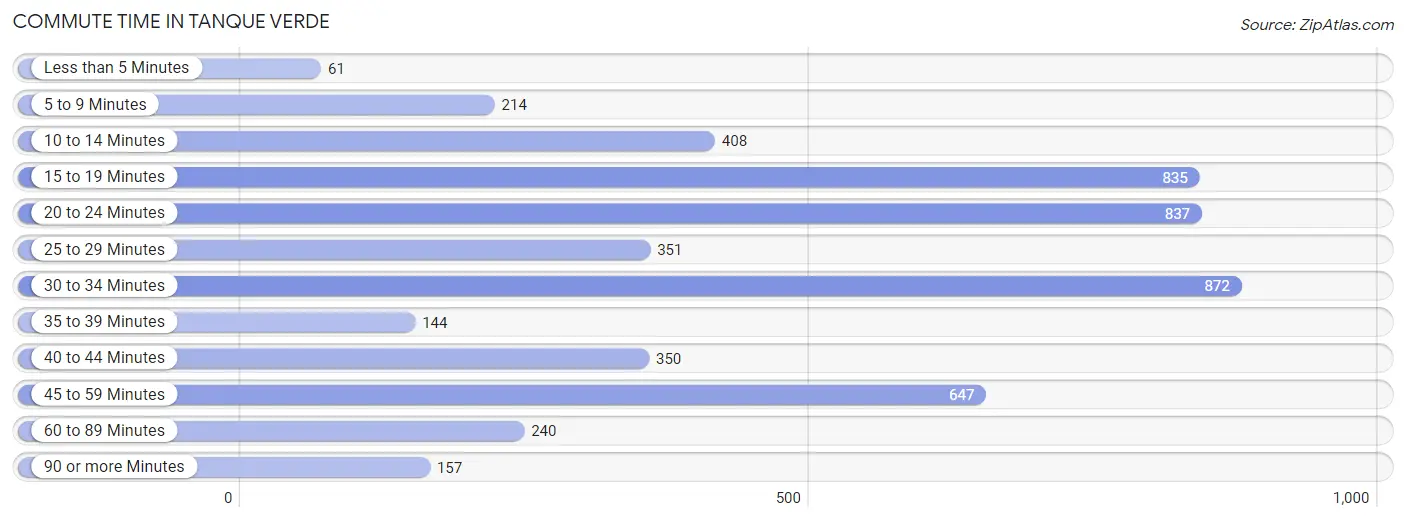
Commute Time in Tanque Verde
The most frequently occuring commute durations in Tanque Verde are 30 to 34 minutes (872 commuters, 17.0%), 20 to 24 minutes (837 commuters, 16.4%), and 15 to 19 minutes (835 commuters, 16.3%).
| Commute Time | # Commuters | % Commuters |
| Less than 5 Minutes | 61 | 1.2% |
| 5 to 9 Minutes | 214 | 4.2% |
| 10 to 14 Minutes | 408 | 8.0% |
| 15 to 19 Minutes | 835 | 16.3% |
| 20 to 24 Minutes | 837 | 16.4% |
| 25 to 29 Minutes | 351 | 6.9% |
| 30 to 34 Minutes | 872 | 17.0% |
| 35 to 39 Minutes | 144 | 2.8% |
| 40 to 44 Minutes | 350 | 6.8% |
| 45 to 59 Minutes | 647 | 12.7% |
| 60 to 89 Minutes | 240 | 4.7% |
| 90 or more Minutes | 157 | 3.1% |
Commute Time by Sex in Tanque Verde
The most common commute times in Tanque Verde are 15 to 19 minutes (494 commuters, 16.7%) for males and 30 to 34 minutes (429 commuters, 19.9%) for females.
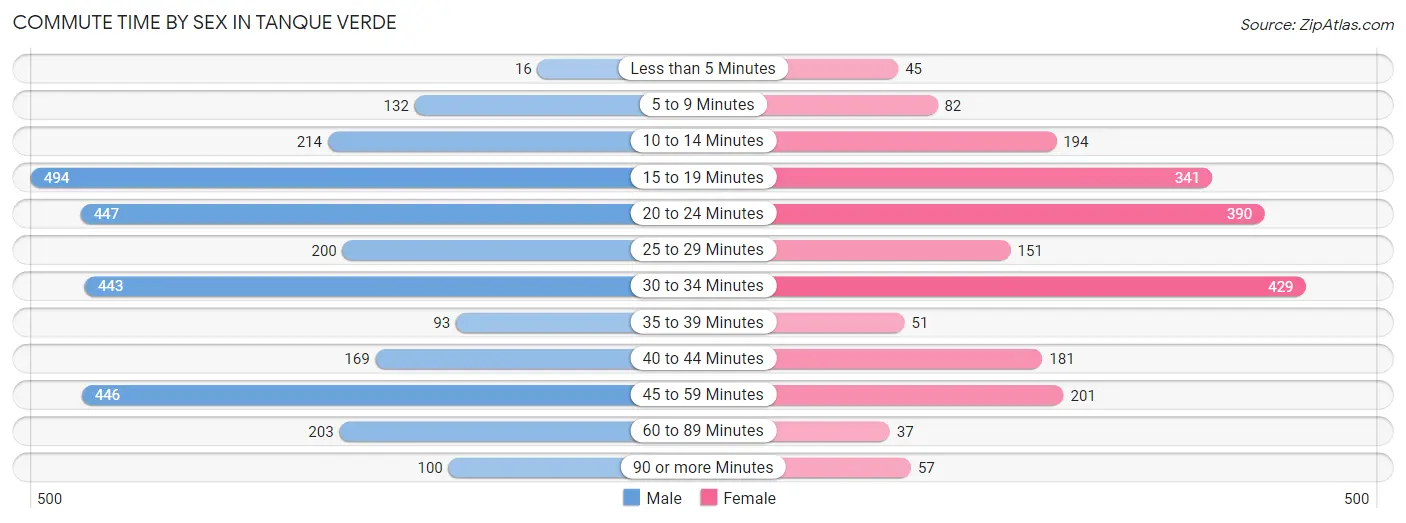
| Commute Time | Male | Female |
| Less than 5 Minutes | 16 (0.5%) | 45 (2.1%) |
| 5 to 9 Minutes | 132 (4.5%) | 82 (3.8%) |
| 10 to 14 Minutes | 214 (7.2%) | 194 (9.0%) |
| 15 to 19 Minutes | 494 (16.7%) | 341 (15.8%) |
| 20 to 24 Minutes | 447 (15.1%) | 390 (18.1%) |
| 25 to 29 Minutes | 200 (6.8%) | 151 (7.0%) |
| 30 to 34 Minutes | 443 (15.0%) | 429 (19.9%) |
| 35 to 39 Minutes | 93 (3.2%) | 51 (2.4%) |
| 40 to 44 Minutes | 169 (5.7%) | 181 (8.4%) |
| 45 to 59 Minutes | 446 (15.1%) | 201 (9.3%) |
| 60 to 89 Minutes | 203 (6.9%) | 37 (1.7%) |
| 90 or more Minutes | 100 (3.4%) | 57 (2.6%) |
Time of Departure to Work by Sex in Tanque Verde
The most frequent times of departure to work in Tanque Verde are 7:00 AM to 7:29 AM (555, 18.8%) for males and 7:00 AM to 7:29 AM (564, 26.1%) for females.
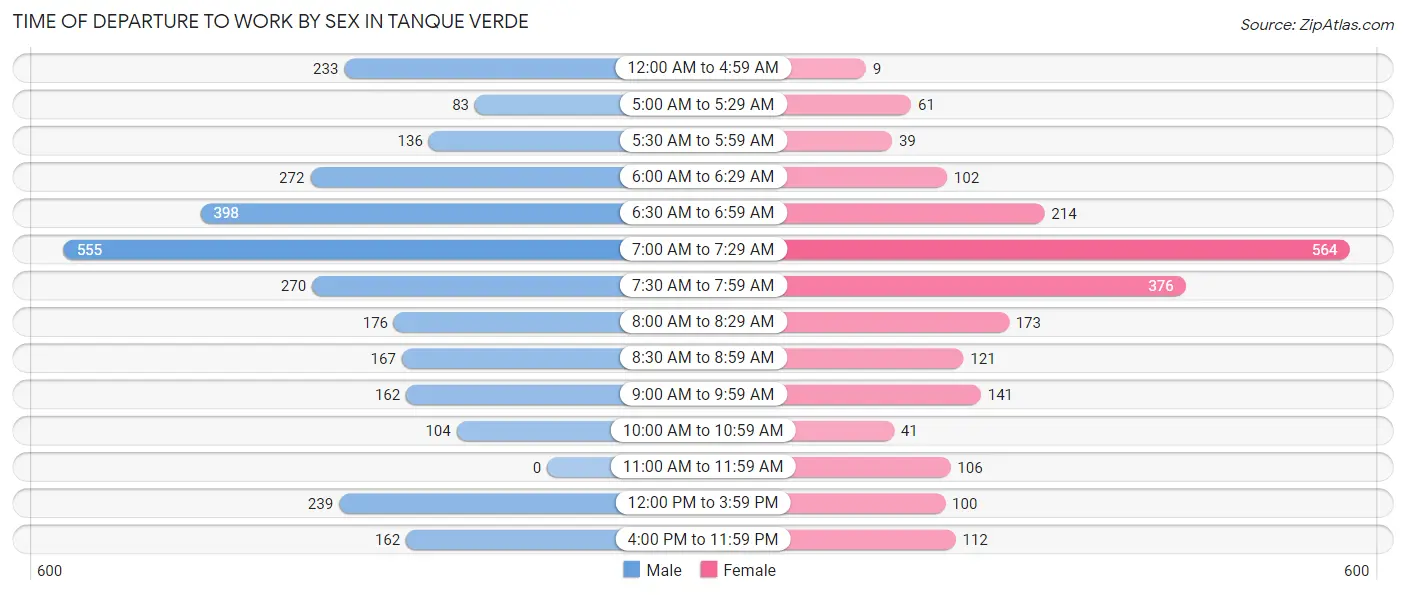
| Time of Departure | Male | Female |
| 12:00 AM to 4:59 AM | 233 (7.9%) | 9 (0.4%) |
| 5:00 AM to 5:29 AM | 83 (2.8%) | 61 (2.8%) |
| 5:30 AM to 5:59 AM | 136 (4.6%) | 39 (1.8%) |
| 6:00 AM to 6:29 AM | 272 (9.2%) | 102 (4.7%) |
| 6:30 AM to 6:59 AM | 398 (13.5%) | 214 (9.9%) |
| 7:00 AM to 7:29 AM | 555 (18.8%) | 564 (26.1%) |
| 7:30 AM to 7:59 AM | 270 (9.1%) | 376 (17.4%) |
| 8:00 AM to 8:29 AM | 176 (5.9%) | 173 (8.0%) |
| 8:30 AM to 8:59 AM | 167 (5.7%) | 121 (5.6%) |
| 9:00 AM to 9:59 AM | 162 (5.5%) | 141 (6.5%) |
| 10:00 AM to 10:59 AM | 104 (3.5%) | 41 (1.9%) |
| 11:00 AM to 11:59 AM | 0 (0.0%) | 106 (4.9%) |
| 12:00 PM to 3:59 PM | 239 (8.1%) | 100 (4.6%) |
| 4:00 PM to 11:59 PM | 162 (5.5%) | 112 (5.2%) |
| Total | 2,957 (100.0%) | 2,159 (100.0%) |
Housing Occupancy in Tanque Verde
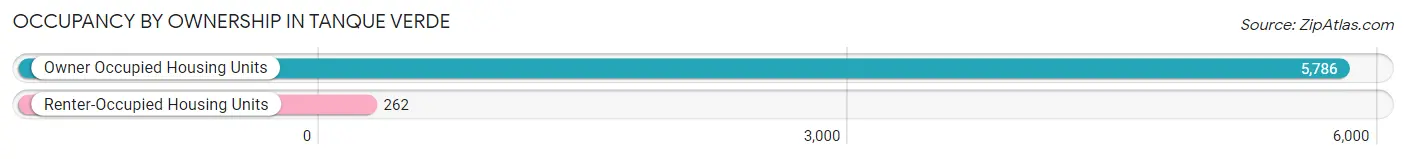
Occupancy by Ownership in Tanque Verde
Of the total 6,048 dwellings in Tanque Verde, owner-occupied units account for 5,786 (95.7%), while renter-occupied units make up 262 (4.3%).
| Occupancy | # Housing Units | % Housing Units |
| Owner Occupied Housing Units | 5,786 | 95.7% |
| Renter-Occupied Housing Units | 262 | 4.3% |
| Total Occupied Housing Units | 6,048 | 100.0% |
Occupancy by Household Size in Tanque Verde
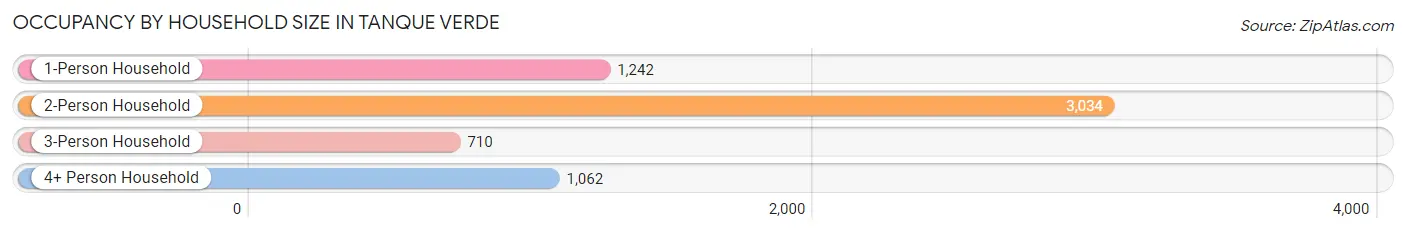
| Household Size | # Housing Units | % Housing Units |
| 1-Person Household | 1,242 | 20.5% |
| 2-Person Household | 3,034 | 50.2% |
| 3-Person Household | 710 | 11.7% |
| 4+ Person Household | 1,062 | 17.6% |
| Total Housing Units | 6,048 | 100.0% |
Occupancy by Ownership by Household Size in Tanque Verde
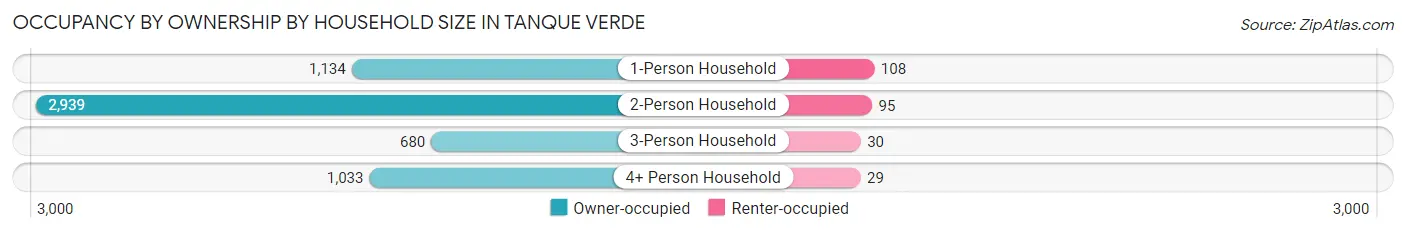
| Household Size | Owner-occupied | Renter-occupied |
| 1-Person Household | 1,134 (91.3%) | 108 (8.7%) |
| 2-Person Household | 2,939 (96.9%) | 95 (3.1%) |
| 3-Person Household | 680 (95.8%) | 30 (4.2%) |
| 4+ Person Household | 1,033 (97.3%) | 29 (2.7%) |
| Total Housing Units | 5,786 (95.7%) | 262 (4.3%) |
Occupancy by Educational Attainment in Tanque Verde
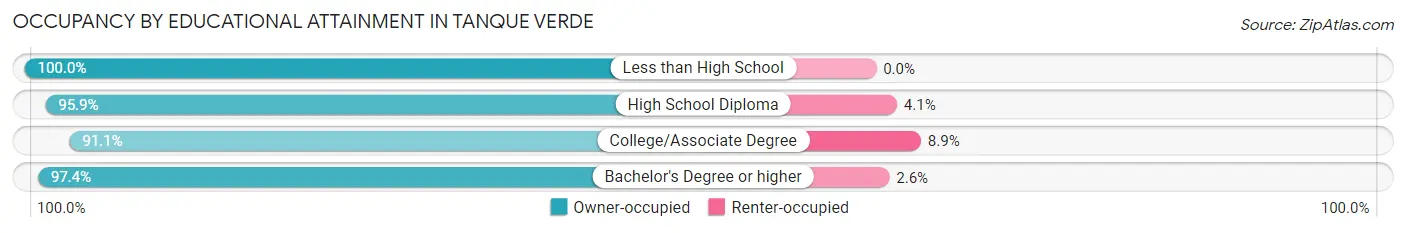
| Household Size | Owner-occupied | Renter-occupied |
| Less than High School | 64 (100.0%) | 0 (0.0%) |
| High School Diploma | 700 (95.9%) | 30 (4.1%) |
| College/Associate Degree | 1,377 (91.1%) | 134 (8.9%) |
| Bachelor's Degree or higher | 3,645 (97.4%) | 98 (2.6%) |
Occupancy by Age of Householder in Tanque Verde
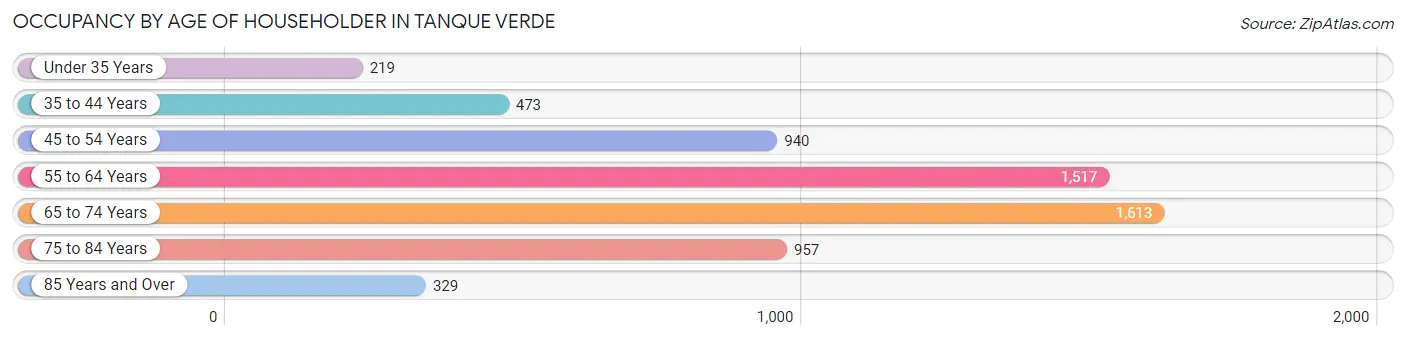
| Age Bracket | # Households | % Households |
| Under 35 Years | 219 | 3.6% |
| 35 to 44 Years | 473 | 7.8% |
| 45 to 54 Years | 940 | 15.5% |
| 55 to 64 Years | 1,517 | 25.1% |
| 65 to 74 Years | 1,613 | 26.7% |
| 75 to 84 Years | 957 | 15.8% |
| 85 Years and Over | 329 | 5.4% |
| Total | 6,048 | 100.0% |
Housing Finances in Tanque Verde
Median Income by Occupancy in Tanque Verde
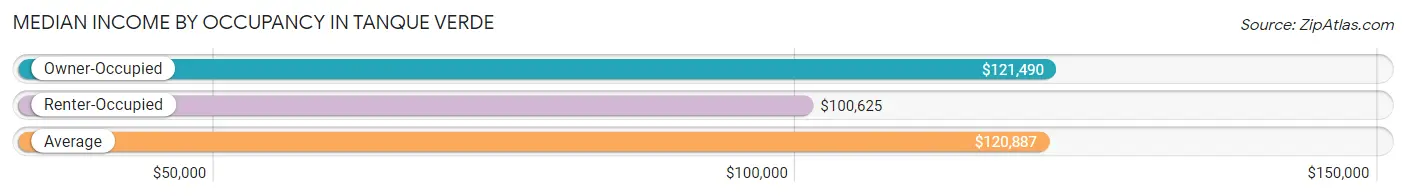
| Occupancy Type | # Households | Median Income |
| Owner-Occupied | 5,786 (95.7%) | $121,490 |
| Renter-Occupied | 262 (4.3%) | $100,625 |
| Average | 6,048 (100.0%) | $120,887 |
Occupancy by Householder Income Bracket in Tanque Verde
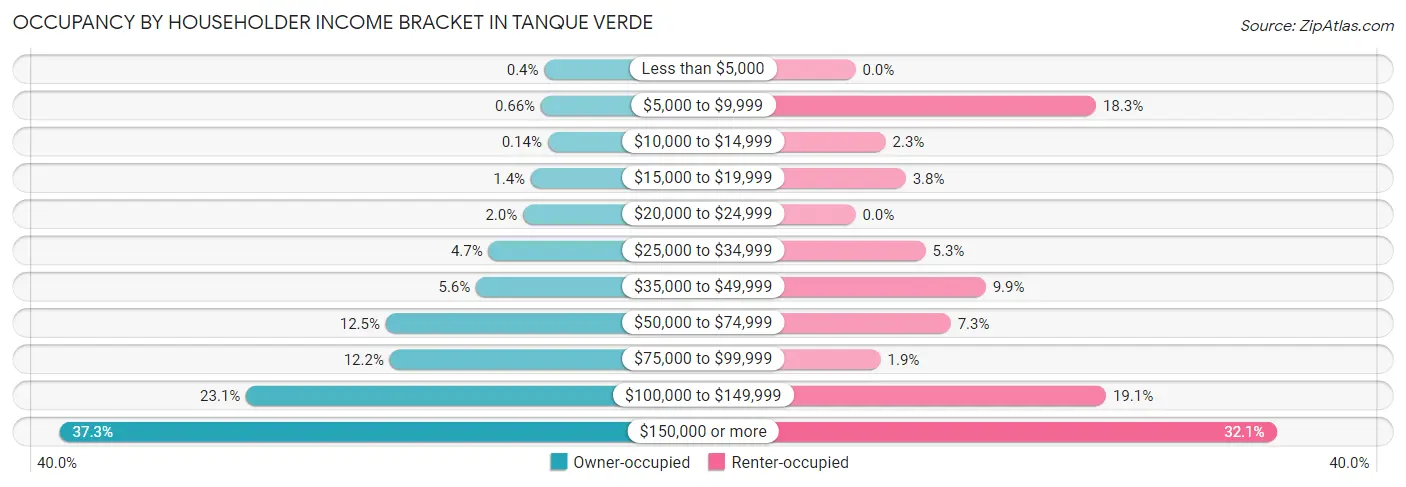
| Income Bracket | Owner-occupied | Renter-occupied |
| Less than $5,000 | 23 (0.4%) | 0 (0.0%) |
| $5,000 to $9,999 | 38 (0.7%) | 48 (18.3%) |
| $10,000 to $14,999 | 8 (0.1%) | 6 (2.3%) |
| $15,000 to $19,999 | 82 (1.4%) | 10 (3.8%) |
| $20,000 to $24,999 | 117 (2.0%) | 0 (0.0%) |
| $25,000 to $34,999 | 269 (4.6%) | 14 (5.3%) |
| $35,000 to $49,999 | 324 (5.6%) | 26 (9.9%) |
| $50,000 to $74,999 | 722 (12.5%) | 19 (7.2%) |
| $75,000 to $99,999 | 705 (12.2%) | 5 (1.9%) |
| $100,000 to $149,999 | 1,338 (23.1%) | 50 (19.1%) |
| $150,000 or more | 2,160 (37.3%) | 84 (32.1%) |
| Total | 5,786 (100.0%) | 262 (100.0%) |
Monthly Housing Cost Tiers in Tanque Verde
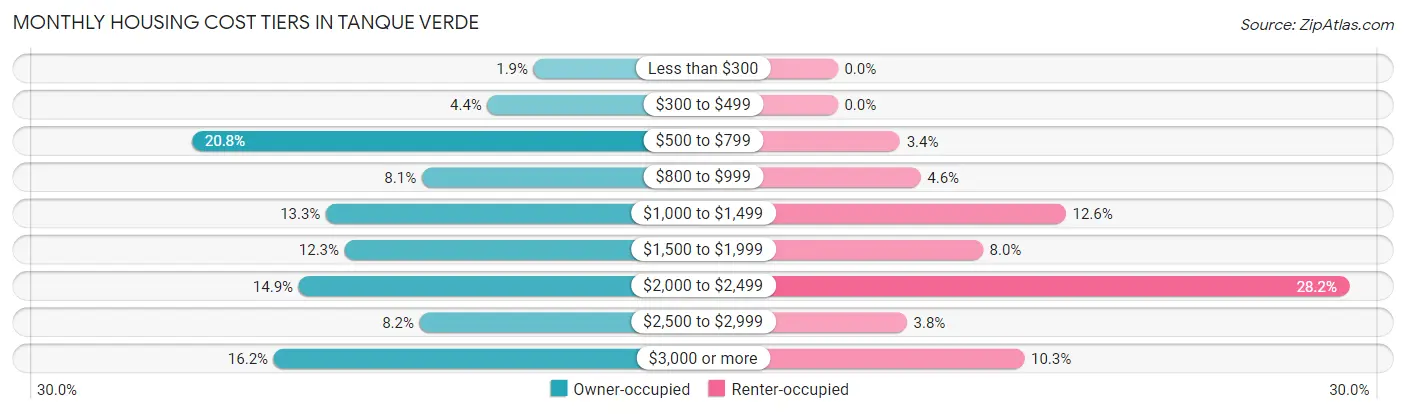
| Monthly Cost | Owner-occupied | Renter-occupied |
| Less than $300 | 108 (1.9%) | 0 (0.0%) |
| $300 to $499 | 256 (4.4%) | 0 (0.0%) |
| $500 to $799 | 1,201 (20.8%) | 9 (3.4%) |
| $800 to $999 | 466 (8.1%) | 12 (4.6%) |
| $1,000 to $1,499 | 772 (13.3%) | 33 (12.6%) |
| $1,500 to $1,999 | 712 (12.3%) | 21 (8.0%) |
| $2,000 to $2,499 | 859 (14.8%) | 74 (28.2%) |
| $2,500 to $2,999 | 473 (8.2%) | 10 (3.8%) |
| $3,000 or more | 939 (16.2%) | 27 (10.3%) |
| Total | 5,786 (100.0%) | 262 (100.0%) |
Physical Housing Characteristics in Tanque Verde
Housing Structures in Tanque Verde
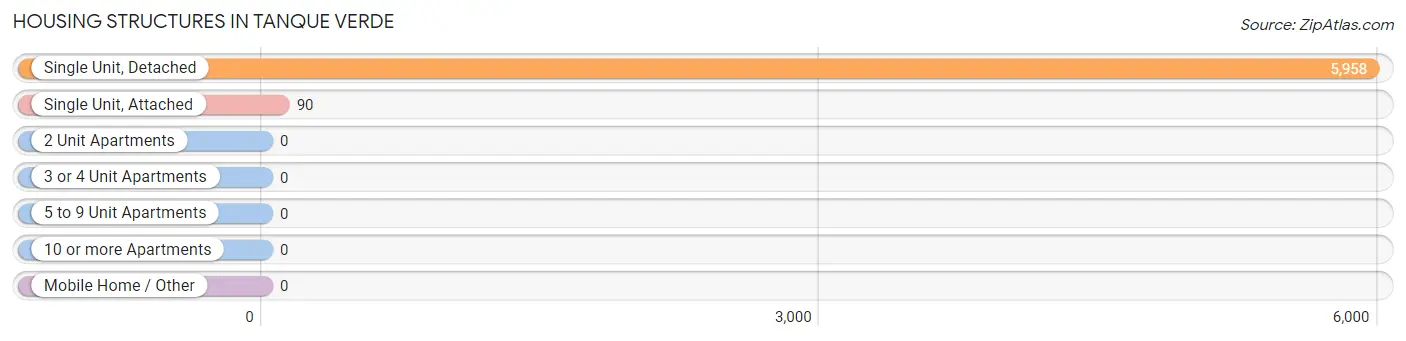
| Structure Type | # Housing Units | % Housing Units |
| Single Unit, Detached | 5,958 | 98.5% |
| Single Unit, Attached | 90 | 1.5% |
| 2 Unit Apartments | 0 | 0.0% |
| 3 or 4 Unit Apartments | 0 | 0.0% |
| 5 to 9 Unit Apartments | 0 | 0.0% |
| 10 or more Apartments | 0 | 0.0% |
| Mobile Home / Other | 0 | 0.0% |
| Total | 6,048 | 100.0% |
Housing Structures by Occupancy in Tanque Verde
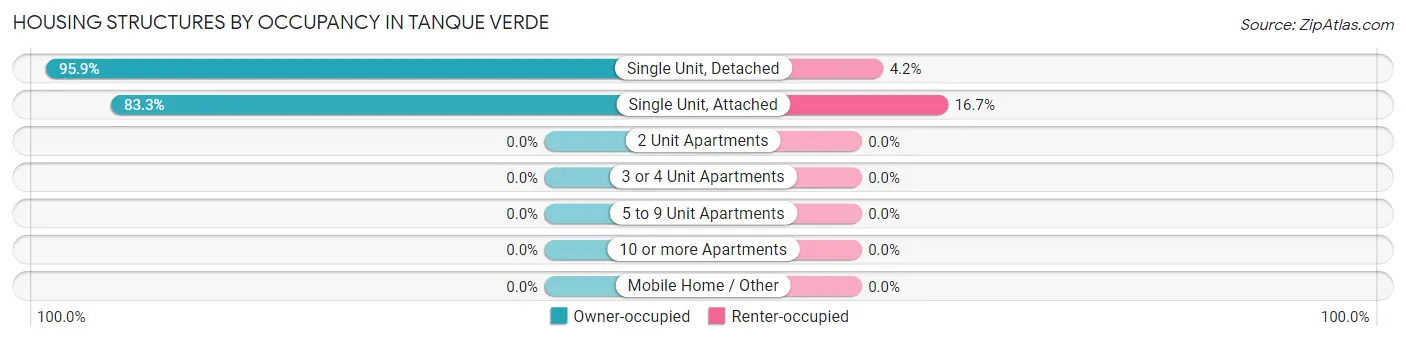
| Structure Type | Owner-occupied | Renter-occupied |
| Single Unit, Detached | 5,711 (95.9%) | 247 (4.2%) |
| Single Unit, Attached | 75 (83.3%) | 15 (16.7%) |
| 2 Unit Apartments | 0 (0.0%) | 0 (0.0%) |
| 3 or 4 Unit Apartments | 0 (0.0%) | 0 (0.0%) |
| 5 to 9 Unit Apartments | 0 (0.0%) | 0 (0.0%) |
| 10 or more Apartments | 0 (0.0%) | 0 (0.0%) |
| Mobile Home / Other | 0 (0.0%) | 0 (0.0%) |
| Total | 5,786 (95.7%) | 262 (4.3%) |
Housing Structures by Number of Rooms in Tanque Verde
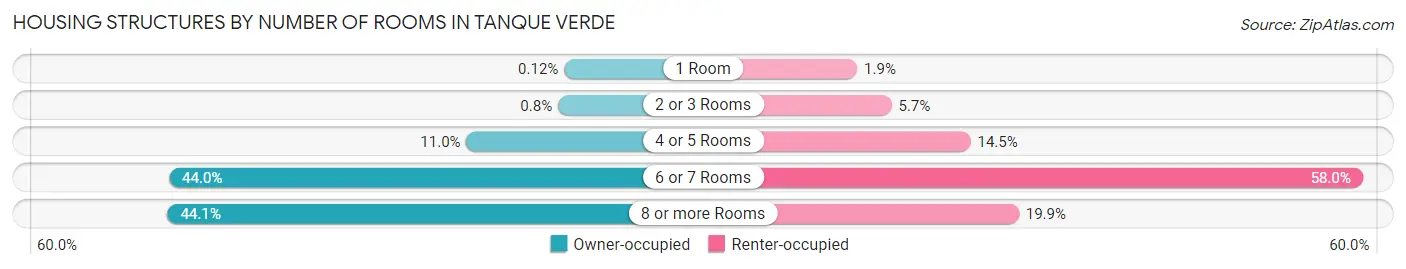
| Number of Rooms | Owner-occupied | Renter-occupied |
| 1 Room | 7 (0.1%) | 5 (1.9%) |
| 2 or 3 Rooms | 46 (0.8%) | 15 (5.7%) |
| 4 or 5 Rooms | 635 (11.0%) | 38 (14.5%) |
| 6 or 7 Rooms | 2,544 (44.0%) | 152 (58.0%) |
| 8 or more Rooms | 2,554 (44.1%) | 52 (19.9%) |
| Total | 5,786 (100.0%) | 262 (100.0%) |
Housing Structure by Heating Type in Tanque Verde
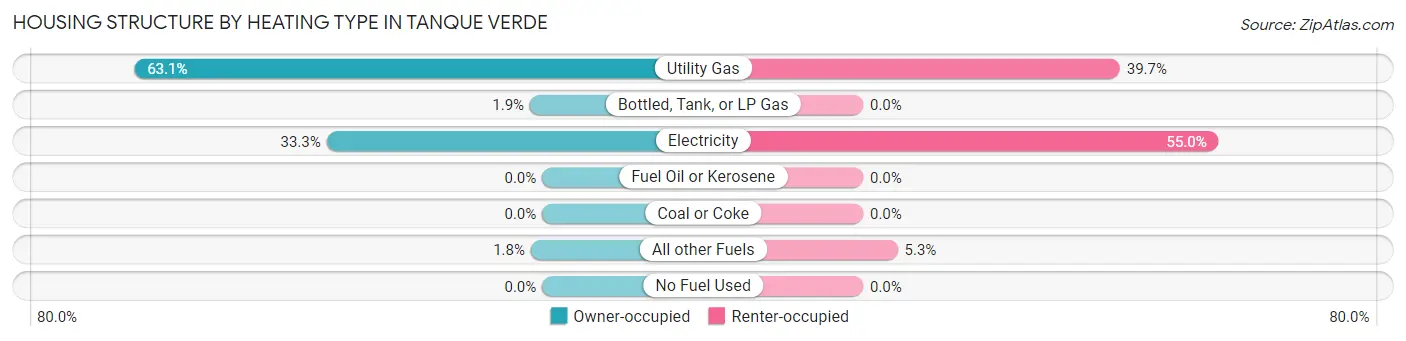
| Heating Type | Owner-occupied | Renter-occupied |
| Utility Gas | 3,648 (63.0%) | 104 (39.7%) |
| Bottled, Tank, or LP Gas | 109 (1.9%) | 0 (0.0%) |
| Electricity | 1,928 (33.3%) | 144 (55.0%) |
| Fuel Oil or Kerosene | 0 (0.0%) | 0 (0.0%) |
| Coal or Coke | 0 (0.0%) | 0 (0.0%) |
| All other Fuels | 101 (1.8%) | 14 (5.3%) |
| No Fuel Used | 0 (0.0%) | 0 (0.0%) |
| Total | 5,786 (100.0%) | 262 (100.0%) |
Household Vehicle Usage in Tanque Verde
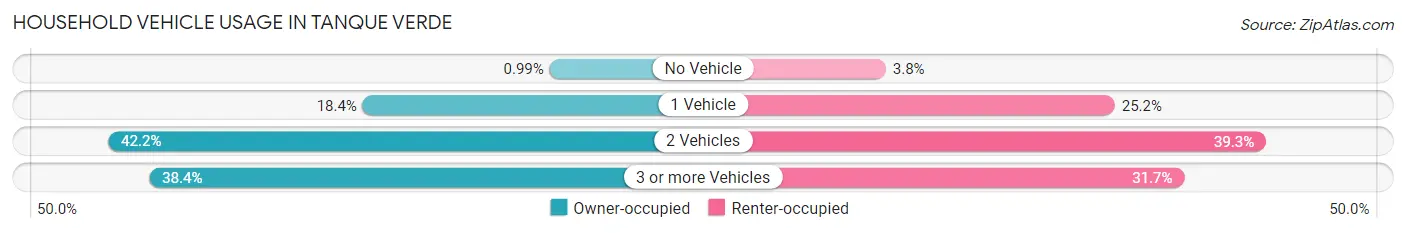
| Vehicles per Household | Owner-occupied | Renter-occupied |
| No Vehicle | 57 (1.0%) | 10 (3.8%) |
| 1 Vehicle | 1,067 (18.4%) | 66 (25.2%) |
| 2 Vehicles | 2,442 (42.2%) | 103 (39.3%) |
| 3 or more Vehicles | 2,220 (38.4%) | 83 (31.7%) |
| Total | 5,786 (100.0%) | 262 (100.0%) |
Real Estate & Mortgages in Tanque Verde
Real Estate and Mortgage Overview in Tanque Verde
| Characteristic | Without Mortgage | With Mortgage |
| Housing Units | 2,421 | 3,365 |
| Median Property Value | $498,300 | $547,200 |
| Median Household Income | $95,568 | $1,565 |
| Monthly Housing Costs | $701 | $920 |
| Real Estate Taxes | $3,984 | $56 |
Property Value by Mortgage Status in Tanque Verde
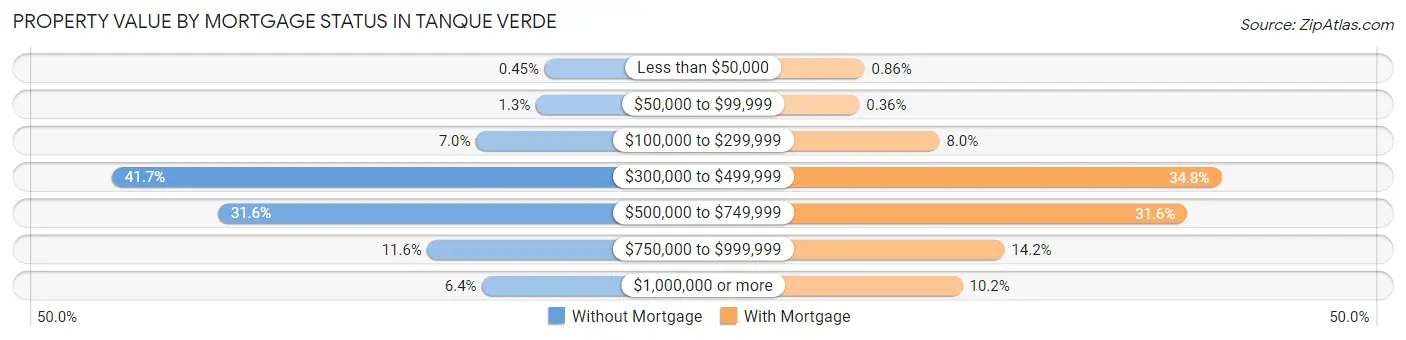
| Property Value | Without Mortgage | With Mortgage |
| Less than $50,000 | 11 (0.4%) | 29 (0.9%) |
| $50,000 to $99,999 | 31 (1.3%) | 12 (0.4%) |
| $100,000 to $299,999 | 169 (7.0%) | 269 (8.0%) |
| $300,000 to $499,999 | 1,009 (41.7%) | 1,172 (34.8%) |
| $500,000 to $749,999 | 765 (31.6%) | 1,063 (31.6%) |
| $750,000 to $999,999 | 281 (11.6%) | 477 (14.2%) |
| $1,000,000 or more | 155 (6.4%) | 343 (10.2%) |
| Total | 2,421 (100.0%) | 3,365 (100.0%) |
Household Income by Mortgage Status in Tanque Verde
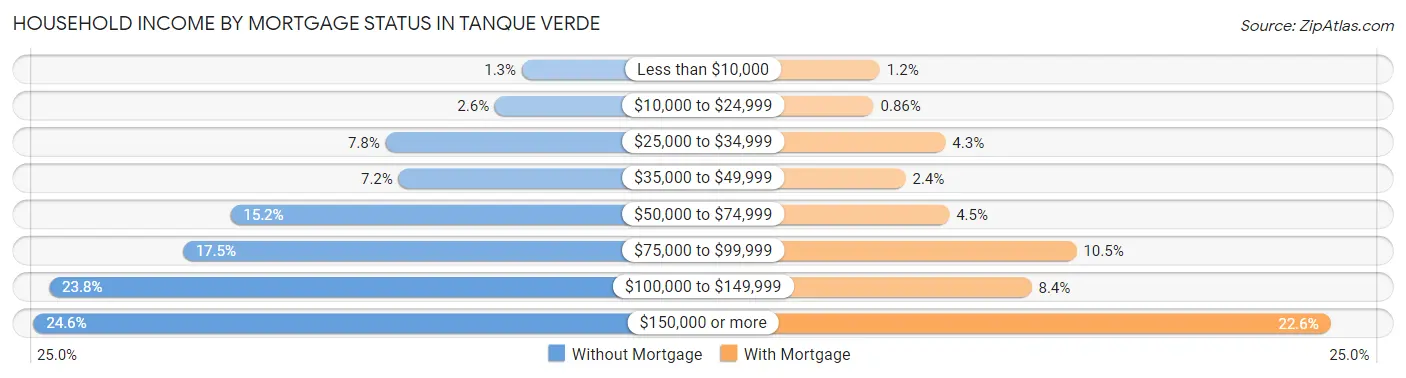
| Household Income | Without Mortgage | With Mortgage |
| Less than $10,000 | 32 (1.3%) | 39 (1.2%) |
| $10,000 to $24,999 | 63 (2.6%) | 29 (0.9%) |
| $25,000 to $34,999 | 189 (7.8%) | 144 (4.3%) |
| $35,000 to $49,999 | 174 (7.2%) | 80 (2.4%) |
| $50,000 to $74,999 | 368 (15.2%) | 150 (4.5%) |
| $75,000 to $99,999 | 423 (17.5%) | 354 (10.5%) |
| $100,000 to $149,999 | 577 (23.8%) | 282 (8.4%) |
| $150,000 or more | 595 (24.6%) | 761 (22.6%) |
| Total | 2,421 (100.0%) | 3,365 (100.0%) |
Property Value to Household Income Ratio in Tanque Verde
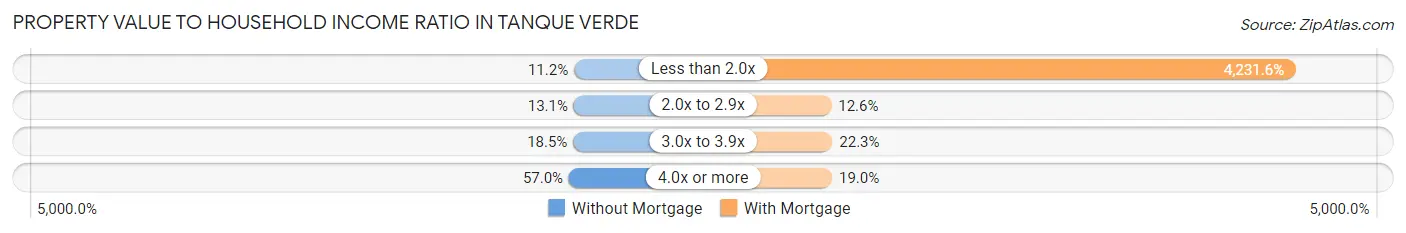
| Value-to-Income Ratio | Without Mortgage | With Mortgage |
| Less than 2.0x | 271 (11.2%) | 142,394 (4,231.6%) |
| 2.0x to 2.9x | 316 (13.1%) | 425 (12.6%) |
| 3.0x to 3.9x | 448 (18.5%) | 751 (22.3%) |
| 4.0x or more | 1,379 (57.0%) | 640 (19.0%) |
| Total | 2,421 (100.0%) | 3,365 (100.0%) |
Real Estate Taxes by Mortgage Status in Tanque Verde
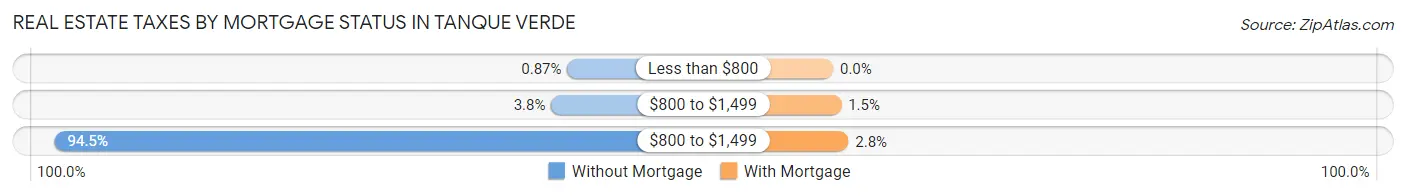
| Property Taxes | Without Mortgage | With Mortgage |
| Less than $800 | 21 (0.9%) | 0 (0.0%) |
| $800 to $1,499 | 92 (3.8%) | 50 (1.5%) |
| $800 to $1,499 | 2,288 (94.5%) | 94 (2.8%) |
| Total | 2,421 (100.0%) | 3,365 (100.0%) |
Health & Disability in Tanque Verde
Health Insurance Coverage by Age in Tanque Verde
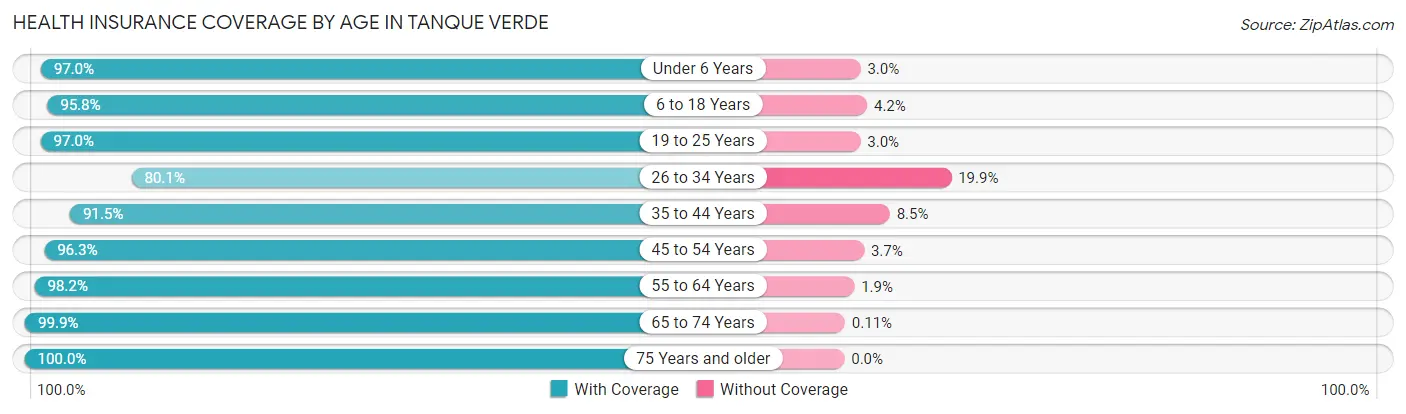
| Age Bracket | With Coverage | Without Coverage |
| Under 6 Years | 482 (97.0%) | 15 (3.0%) |
| 6 to 18 Years | 1,967 (95.8%) | 87 (4.2%) |
| 19 to 25 Years | 713 (97.0%) | 22 (3.0%) |
| 26 to 34 Years | 542 (80.1%) | 135 (19.9%) |
| 35 to 44 Years | 1,102 (91.5%) | 102 (8.5%) |
| 45 to 54 Years | 1,757 (96.3%) | 67 (3.7%) |
| 55 to 64 Years | 2,871 (98.2%) | 54 (1.8%) |
| 65 to 74 Years | 2,810 (99.9%) | 3 (0.1%) |
| 75 Years and older | 2,041 (100.0%) | 0 (0.0%) |
| Total | 14,285 (96.7%) | 485 (3.3%) |
Health Insurance Coverage by Citizenship Status in Tanque Verde
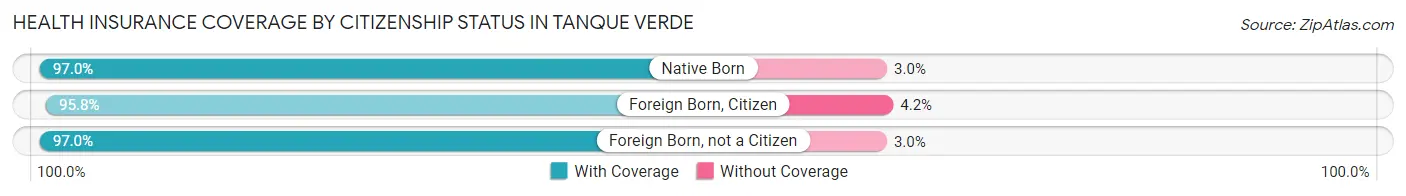
| Citizenship Status | With Coverage | Without Coverage |
| Native Born | 482 (97.0%) | 15 (3.0%) |
| Foreign Born, Citizen | 1,967 (95.8%) | 87 (4.2%) |
| Foreign Born, not a Citizen | 713 (97.0%) | 22 (3.0%) |
Health Insurance Coverage by Household Income in Tanque Verde
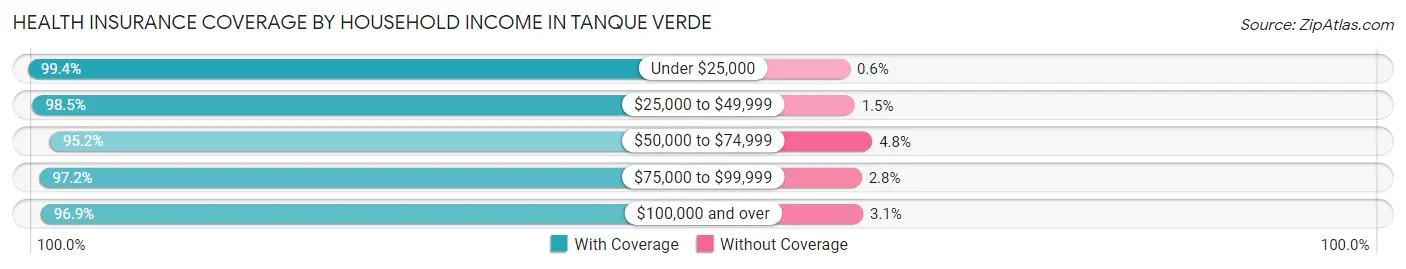
| Household Income | With Coverage | Without Coverage |
| Under $25,000 | 496 (99.4%) | 3 (0.6%) |
| $25,000 to $49,999 | 990 (98.5%) | 15 (1.5%) |
| $50,000 to $74,999 | 1,442 (95.2%) | 72 (4.8%) |
| $75,000 to $99,999 | 1,218 (97.2%) | 35 (2.8%) |
| $100,000 and over | 10,070 (96.9%) | 318 (3.1%) |
Public vs Private Health Insurance Coverage by Age in Tanque Verde
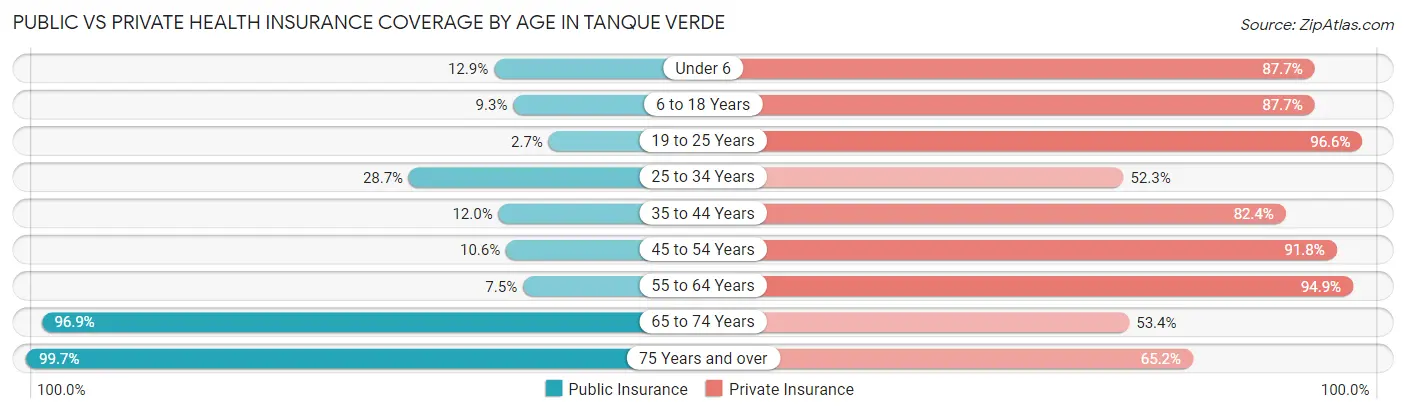
| Age Bracket | Public Insurance | Private Insurance |
| Under 6 | 64 (12.9%) | 436 (87.7%) |
| 6 to 18 Years | 191 (9.3%) | 1,802 (87.7%) |
| 19 to 25 Years | 20 (2.7%) | 710 (96.6%) |
| 25 to 34 Years | 194 (28.7%) | 354 (52.3%) |
| 35 to 44 Years | 145 (12.0%) | 992 (82.4%) |
| 45 to 54 Years | 194 (10.6%) | 1,675 (91.8%) |
| 55 to 64 Years | 219 (7.5%) | 2,775 (94.9%) |
| 65 to 74 Years | 2,725 (96.9%) | 1,501 (53.4%) |
| 75 Years and over | 2,035 (99.7%) | 1,330 (65.2%) |
| Total | 5,787 (39.2%) | 11,575 (78.4%) |
Disability Status by Sex by Age in Tanque Verde

| Age Bracket | Male | Female |
| Under 5 Years | 0 (0.0%) | 0 (0.0%) |
| 5 to 17 Years | 71 (6.0%) | 41 (4.9%) |
| 18 to 34 Years | 42 (5.0%) | 41 (6.1%) |
| 35 to 64 Years | 166 (5.7%) | 241 (7.9%) |
| 65 to 74 Years | 168 (11.8%) | 195 (14.0%) |
| 75 Years and over | 480 (43.9%) | 368 (38.9%) |
Disability Class by Sex by Age in Tanque Verde
Disability Class: Hearing Difficulty
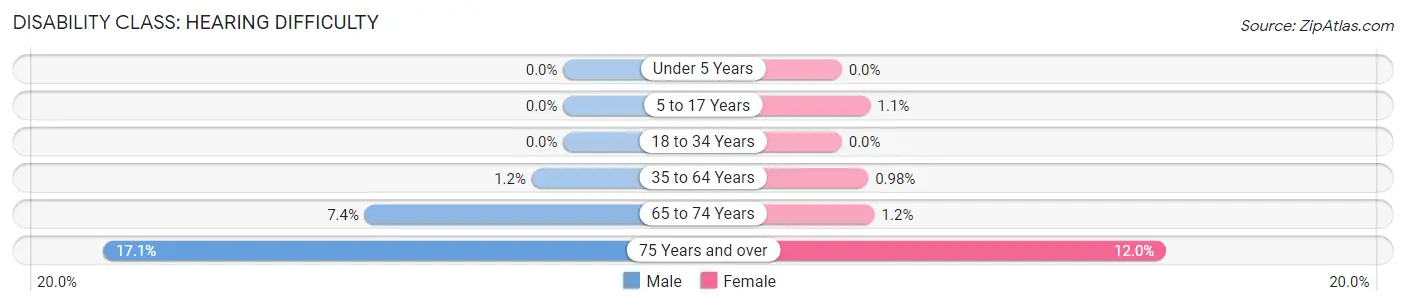
| Age Bracket | Male | Female |
| Under 5 Years | 0 (0.0%) | 0 (0.0%) |
| 5 to 17 Years | 0 (0.0%) | 9 (1.1%) |
| 18 to 34 Years | 0 (0.0%) | 0 (0.0%) |
| 35 to 64 Years | 34 (1.2%) | 30 (1.0%) |
| 65 to 74 Years | 105 (7.4%) | 17 (1.2%) |
| 75 Years and over | 187 (17.1%) | 114 (12.0%) |
Disability Class: Vision Difficulty
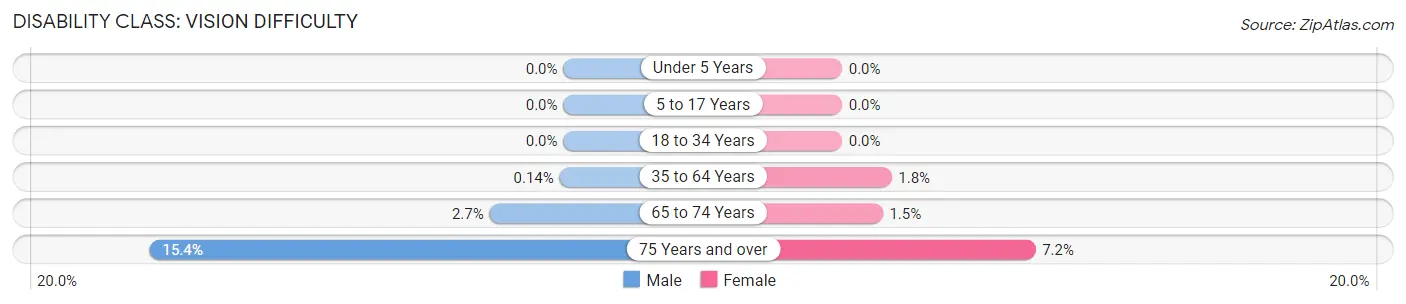
| Age Bracket | Male | Female |
| Under 5 Years | 0 (0.0%) | 0 (0.0%) |
| 5 to 17 Years | 0 (0.0%) | 0 (0.0%) |
| 18 to 34 Years | 0 (0.0%) | 0 (0.0%) |
| 35 to 64 Years | 4 (0.1%) | 56 (1.8%) |
| 65 to 74 Years | 39 (2.7%) | 21 (1.5%) |
| 75 Years and over | 168 (15.4%) | 68 (7.2%) |
Disability Class: Cognitive Difficulty
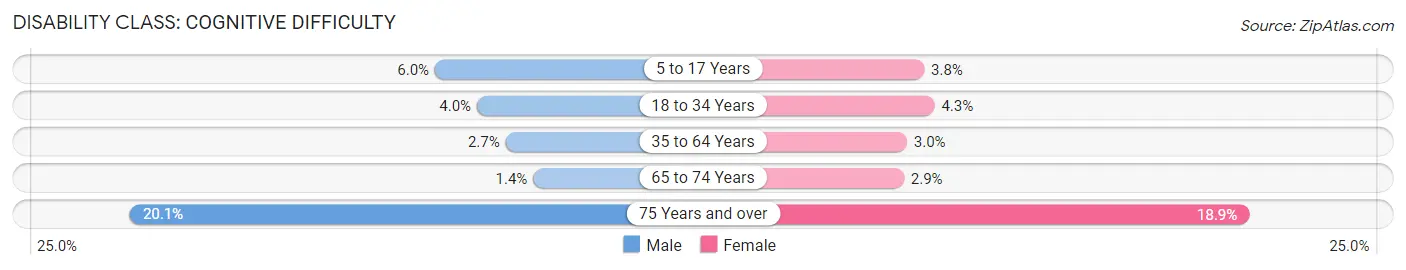
| Age Bracket | Male | Female |
| 5 to 17 Years | 71 (6.0%) | 32 (3.8%) |
| 18 to 34 Years | 34 (4.0%) | 29 (4.3%) |
| 35 to 64 Years | 78 (2.7%) | 92 (3.0%) |
| 65 to 74 Years | 20 (1.4%) | 40 (2.9%) |
| 75 Years and over | 220 (20.1%) | 179 (18.9%) |
Disability Class: Ambulatory Difficulty
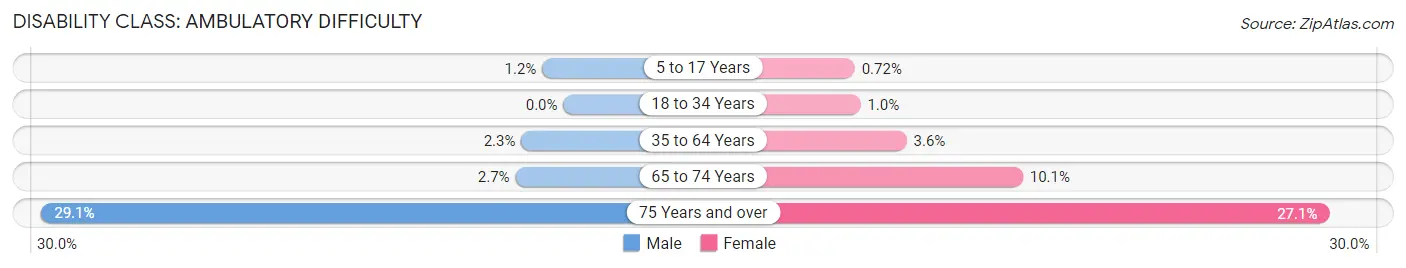
| Age Bracket | Male | Female |
| 5 to 17 Years | 14 (1.2%) | 6 (0.7%) |
| 18 to 34 Years | 0 (0.0%) | 7 (1.0%) |
| 35 to 64 Years | 68 (2.3%) | 110 (3.6%) |
| 65 to 74 Years | 38 (2.7%) | 140 (10.1%) |
| 75 Years and over | 318 (29.1%) | 257 (27.1%) |
Disability Class: Self-Care Difficulty
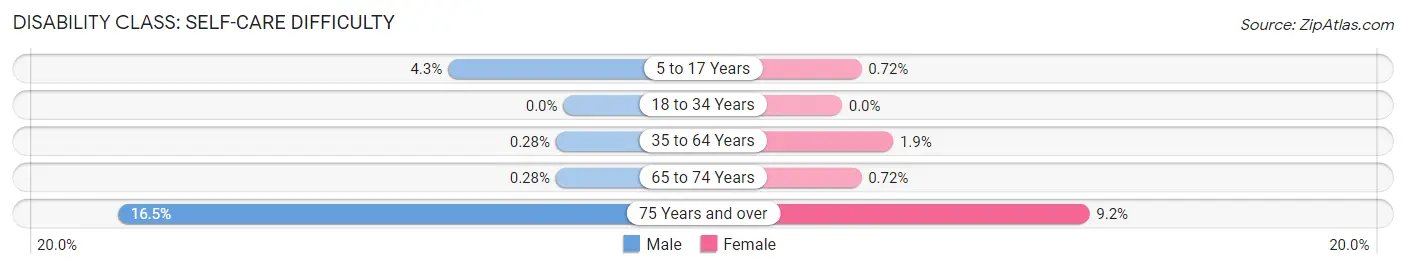
| Age Bracket | Male | Female |
| 5 to 17 Years | 51 (4.3%) | 6 (0.7%) |
| 18 to 34 Years | 0 (0.0%) | 0 (0.0%) |
| 35 to 64 Years | 8 (0.3%) | 58 (1.9%) |
| 65 to 74 Years | 4 (0.3%) | 10 (0.7%) |
| 75 Years and over | 181 (16.5%) | 87 (9.2%) |
Technology Access in Tanque Verde
Computing Device Access in Tanque Verde
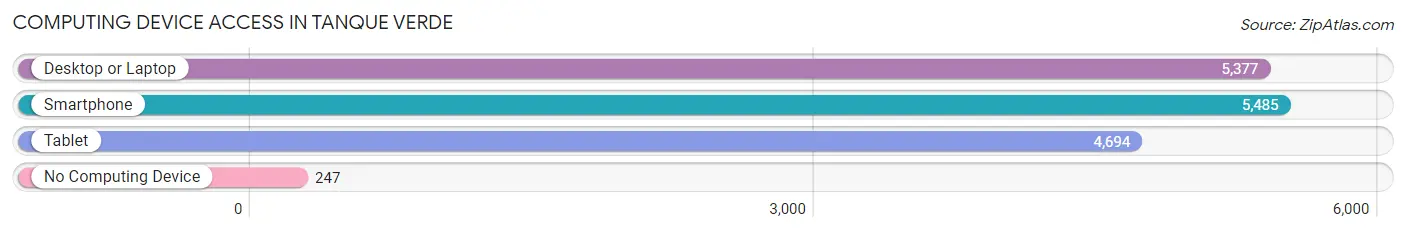
| Device Type | # Households | % Households |
| Desktop or Laptop | 5,377 | 88.9% |
| Smartphone | 5,485 | 90.7% |
| Tablet | 4,694 | 77.6% |
| No Computing Device | 247 | 4.1% |
| Total | 6,048 | 100.0% |
Internet Access in Tanque Verde
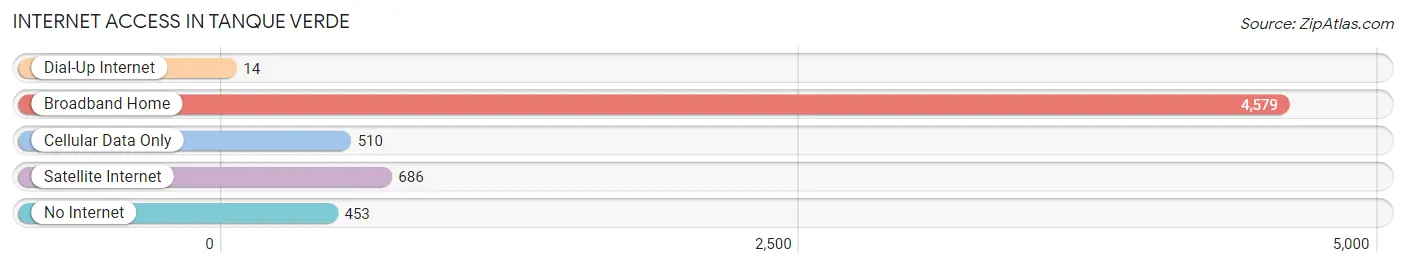
| Internet Type | # Households | % Households |
| Dial-Up Internet | 14 | 0.2% |
| Broadband Home | 4,579 | 75.7% |
| Cellular Data Only | 510 | 8.4% |
| Satellite Internet | 686 | 11.3% |
| No Internet | 453 | 7.5% |
| Total | 6,048 | 100.0% |
Tanque Verde Summary
Tank Verde, Arizona is a small unincorporated community located in Pima County, Arizona. It is situated in the foothills of the Rincon Mountains, approximately 25 miles southeast of Tucson. The population of Tank Verde was estimated to be 1,845 in 2019.
History
Tank Verde was originally inhabited by the Hohokam people, who lived in the area from around 300 BC to 1450 AD. The Hohokam were known for their irrigation systems, which were used to cultivate crops such as corn, beans, squash, and cotton.
The first European settlers arrived in the area in the late 1800s. The area was originally known as “Rincon”, and was later renamed “Tank Verde” in honor of the nearby Tanque Verde Creek. The name “Tanque Verde” is Spanish for “green tank”, and was likely given to the creek due to the presence of a large natural spring in the area.
The area was primarily used for ranching and farming until the 1950s, when the population began to grow due to the influx of people from other parts of the country. The population continued to grow throughout the 1960s and 1970s, and the area was eventually incorporated as a census-designated place in 1980.
Geography
Tank Verde is located in the foothills of the Rincon Mountains, approximately 25 miles southeast of Tucson. The area is characterized by rolling hills, desert vegetation, and a variety of wildlife. The Tanque Verde Creek runs through the area, providing a source of water for the local wildlife and vegetation.
The climate in Tank Verde is arid, with hot summers and mild winters. The average annual temperature is around 70°F, and the average annual precipitation is around 12 inches.
Economy
The economy of Tank Verde is primarily based on tourism and agriculture. The area is home to several tourist attractions, including the Tanque Verde Falls, the Tanque Verde Wildlife Refuge, and the Tanque Verde Ranch. The area is also home to several farms and ranches, which produce a variety of crops and livestock.
Demographics
As of 2019, the population of Tank Verde was estimated to be 1,845. The population is primarily composed of White (77.3%), Hispanic or Latino (17.2%), and Native American (2.2%) individuals. The median household income in Tank Verde is $50,945, and the median age is 44.7 years. The unemployment rate in Tank Verde is 4.2%, which is lower than the national average.
Common Questions
What is Per Capita Income in Tanque Verde?
Per Capita income in Tanque Verde is $63,222.
What is the Median Family Income in Tanque Verde?
Median Family Income in Tanque Verde is $143,130.
What is the Median Household income in Tanque Verde?
Median Household Income in Tanque Verde is $120,887.
What is Income or Wage Gap in Tanque Verde?
Income or Wage Gap in Tanque Verde is 40.6%.
Women in Tanque Verde earn 59.4 cents for every dollar earned by a man.
What is Inequality or Gini Index in Tanque Verde?
Inequality or Gini Index in Tanque Verde is 0.41.
What is the Total Population of Tanque Verde?
Total Population of Tanque Verde is 14,815.
What is the Total Male Population of Tanque Verde?
Total Male Population of Tanque Verde is 7,677.
What is the Total Female Population of Tanque Verde?
Total Female Population of Tanque Verde is 7,138.
What is the Ratio of Males per 100 Females in Tanque Verde?
There are 107.55 Males per 100 Females in Tanque Verde.
What is the Ratio of Females per 100 Males in Tanque Verde?
There are 92.98 Females per 100 Males in Tanque Verde.
What is the Median Population Age in Tanque Verde?
Median Population Age in Tanque Verde is 56.7 Years.
What is the Average Family Size in Tanque Verde
Average Family Size in Tanque Verde is 2.8 People.
What is the Average Household Size in Tanque Verde
Average Household Size in Tanque Verde is 2.4 People.
How Large is the Labor Force in Tanque Verde?
There are 6,419 People in the Labor Forcein in Tanque Verde.
What is the Percentage of People in the Labor Force in Tanque Verde?
50.1% of People are in the Labor Force in Tanque Verde.
What is the Unemployment Rate in Tanque Verde?
Unemployment Rate in Tanque Verde is 4.8%.