Carefree, AZ Map & Demographics
Carefree Map
Carefree Overview
$91,416
PER CAPITA INCOME
$129,551
AVG FAMILY INCOME
$122,328
AVG HOUSEHOLD INCOME
27.3%
WAGE / INCOME GAP [ % ]
72.7¢/ $1
WAGE / INCOME GAP [ $ ]
0.54
INEQUALITY / GINI INDEX
3,671
TOTAL POPULATION
1,752
MALE POPULATION
1,919
FEMALE POPULATION
91.30
MALES / 100 FEMALES
109.53
FEMALES / 100 MALES
65.3
MEDIAN AGE
2.2
AVG FAMILY SIZE
1.9
AVG HOUSEHOLD SIZE
1,535
LABOR FORCE [ PEOPLE ]
42.0%
PERCENT IN LABOR FORCE
2.0%
UNEMPLOYMENT RATE
Carefree Zip Codes
Income in Carefree
Income Overview in Carefree
Per Capita Income in Carefree is $91,416, while median incomes of families and households are $129,551 and $122,328 respectively.
| Characteristic | Number | Measure |
| Per Capita Income | 3,671 | $91,416 |
| Median Family Income | 1,156 | $129,551 |
| Mean Family Income | 1,156 | $189,878 |
| Median Household Income | 1,918 | $122,328 |
| Mean Household Income | 1,918 | $164,144 |
| Income Deficit | 1,156 | $0 |
| Wage / Income Gap (%) | 3,671 | 27.27% |
| Wage / Income Gap ($) | 3,671 | 72.73¢ per $1 |
| Gini / Inequality Index | 3,671 | 0.54 |
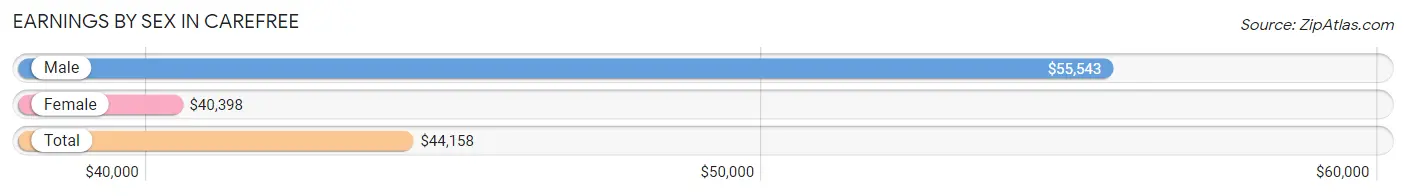
Earnings by Sex in Carefree
Average Earnings in Carefree are $44,158, $55,543 for men and $40,398 for women, a difference of 27.3%.
| Sex | Number | Average Earnings |
| Male | 969 (53.4%) | $55,543 |
| Female | 844 (46.6%) | $40,398 |
| Total | 1,813 (100.0%) | $44,158 |
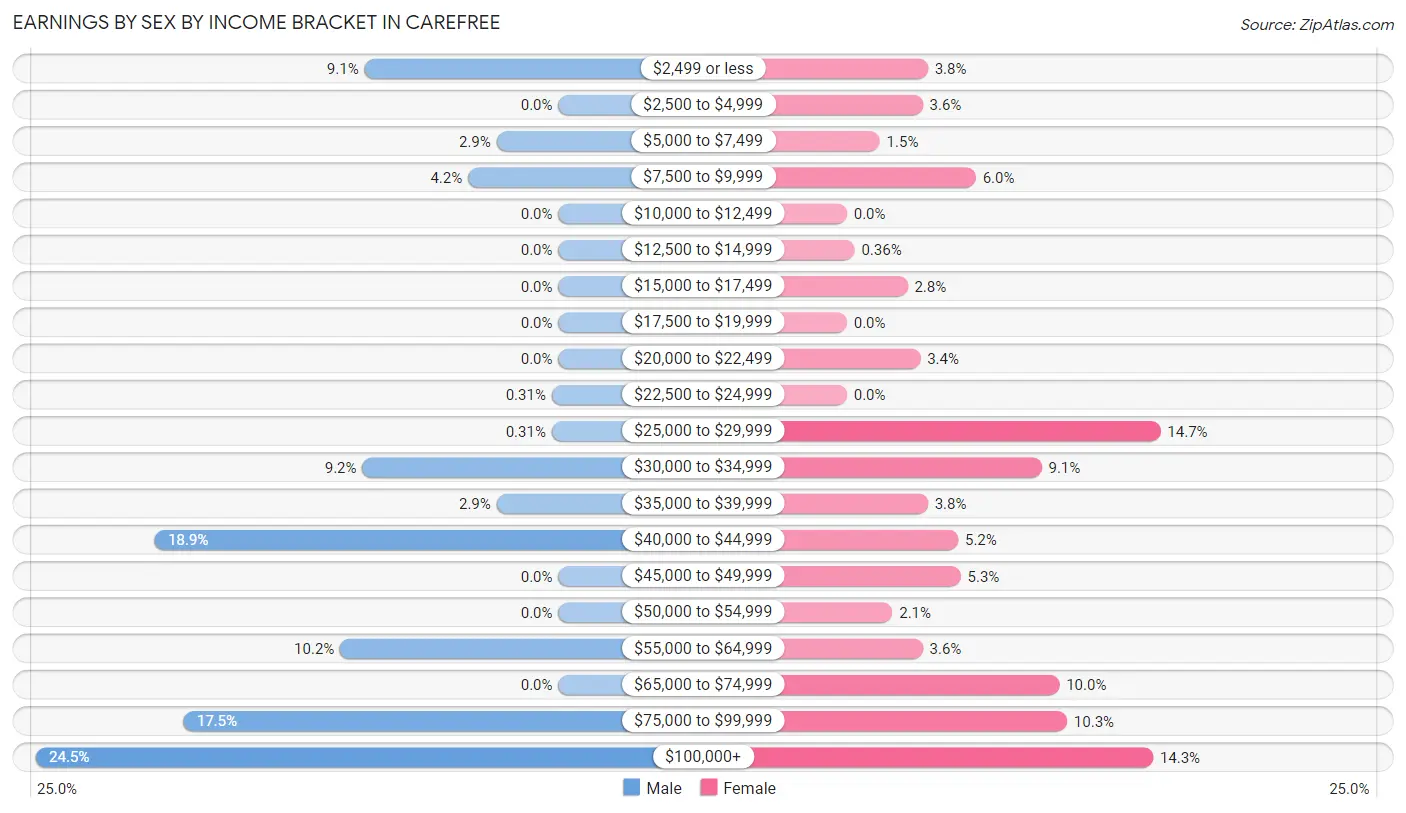
Earnings by Sex by Income Bracket in Carefree
The most common earnings brackets in Carefree are $100,000+ for men (237 | 24.5%) and $25,000 to $29,999 for women (124 | 14.7%).
| Income | Male | Female |
| $2,499 or less | 88 (9.1%) | 32 (3.8%) |
| $2,500 to $4,999 | 0 (0.0%) | 30 (3.5%) |
| $5,000 to $7,499 | 28 (2.9%) | 13 (1.5%) |
| $7,500 to $9,999 | 41 (4.2%) | 51 (6.0%) |
| $10,000 to $12,499 | 0 (0.0%) | 0 (0.0%) |
| $12,500 to $14,999 | 0 (0.0%) | 3 (0.4%) |
| $15,000 to $17,499 | 0 (0.0%) | 24 (2.8%) |
| $17,500 to $19,999 | 0 (0.0%) | 0 (0.0%) |
| $20,000 to $22,499 | 0 (0.0%) | 29 (3.4%) |
| $22,500 to $24,999 | 3 (0.3%) | 0 (0.0%) |
| $25,000 to $29,999 | 3 (0.3%) | 124 (14.7%) |
| $30,000 to $34,999 | 89 (9.2%) | 77 (9.1%) |
| $35,000 to $39,999 | 28 (2.9%) | 32 (3.8%) |
| $40,000 to $44,999 | 183 (18.9%) | 44 (5.2%) |
| $45,000 to $49,999 | 0 (0.0%) | 45 (5.3%) |
| $50,000 to $54,999 | 0 (0.0%) | 18 (2.1%) |
| $55,000 to $64,999 | 99 (10.2%) | 30 (3.5%) |
| $65,000 to $74,999 | 0 (0.0%) | 84 (10.0%) |
| $75,000 to $99,999 | 170 (17.5%) | 87 (10.3%) |
| $100,000+ | 237 (24.5%) | 121 (14.3%) |
| Total | 969 (100.0%) | 844 (100.0%) |
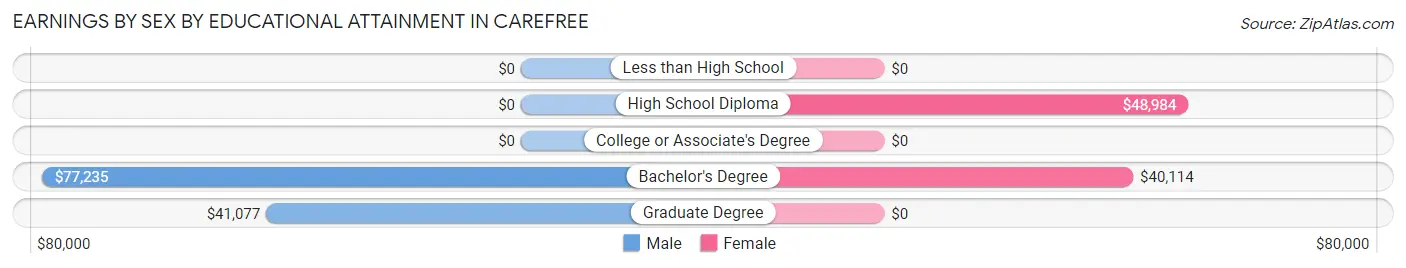
Earnings by Sex by Educational Attainment in Carefree
Average earnings in Carefree are $56,616 for men and $41,534 for women, a difference of 26.6%. Men with an educational attainment of bachelor's degree enjoy the highest average annual earnings of $77,235, while those with graduate degree education earn the least with $41,077. Women with an educational attainment of high school diploma earn the most with the average annual earnings of $48,984, while those with bachelor's degree education have the smallest earnings of $40,114.
| Educational Attainment | Male Income | Female Income |
| Less than High School | - | - |
| High School Diploma | - | - |
| College or Associate's Degree | - | - |
| Bachelor's Degree | $77,235 | $40,114 |
| Graduate Degree | $41,077 | $0 |
| Total | $56,616 | $41,534 |
Family Income in Carefree
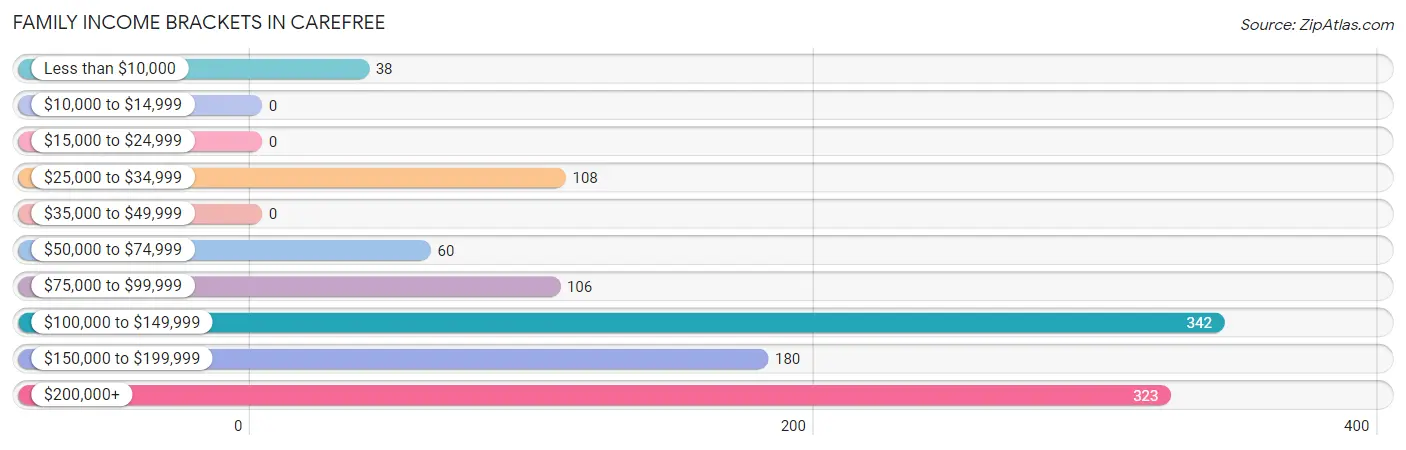
Family Income Brackets in Carefree
According to the Carefree family income data, there are 342 families falling into the $100,000 to $149,999 income range, which is the most common income bracket and makes up 29.6% of all families.
| Income Bracket | # Families | % Families |
| Less than $10,000 | 38 | 3.3% |
| $10,000 to $14,999 | 0 | 0.0% |
| $15,000 to $24,999 | 0 | 0.0% |
| $25,000 to $34,999 | 108 | 9.3% |
| $35,000 to $49,999 | 0 | 0.0% |
| $50,000 to $74,999 | 60 | 5.2% |
| $75,000 to $99,999 | 106 | 9.2% |
| $100,000 to $149,999 | 342 | 29.6% |
| $150,000 to $199,999 | 180 | 15.6% |
| $200,000+ | 323 | 27.9% |
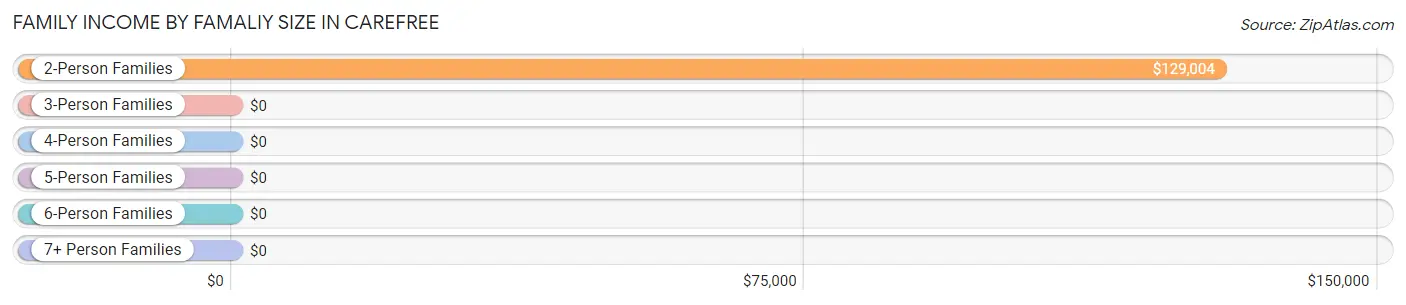
Family Income by Famaliy Size in Carefree
2-person families (996 | 86.2%) account for the highest median family income in Carefree with $129,004 per family, while 2-person families (996 | 86.2%) have the highest median income of $64,502 per family member.
| Income Bracket | # Families | Median Income |
| 2-Person Families | 996 (86.2%) | $129,004 |
| 3-Person Families | 92 (8.0%) | $0 |
| 4-Person Families | 68 (5.9%) | $0 |
| 5-Person Families | 0 (0.0%) | $0 |
| 6-Person Families | 0 (0.0%) | $0 |
| 7+ Person Families | 0 (0.0%) | $0 |
| Total | 1,156 (100.0%) | $129,551 |
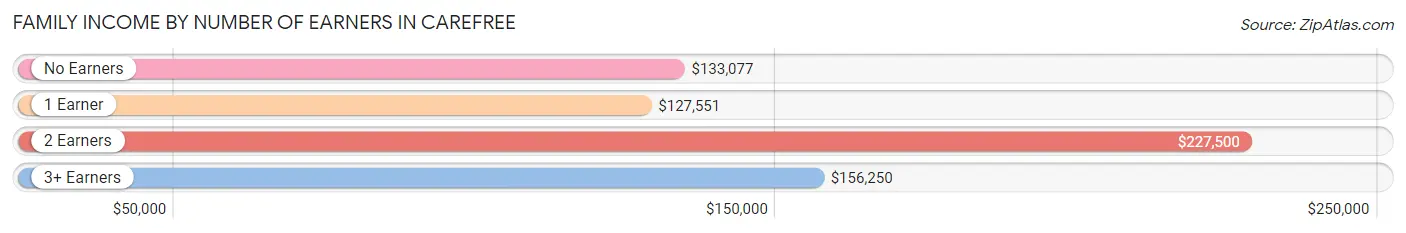
Family Income by Number of Earners in Carefree
The median family income in Carefree is $129,551, with families comprising 2 earners (216) having the highest median family income of $227,500, while families with 1 earner (390) have the lowest median family income of $127,551, accounting for 18.7% and 33.7% of families, respectively.
| Number of Earners | # Families | Median Income |
| No Earners | 462 (40.0%) | $133,077 |
| 1 Earner | 390 (33.7%) | $127,551 |
| 2 Earners | 216 (18.7%) | $227,500 |
| 3+ Earners | 88 (7.6%) | $156,250 |
| Total | 1,156 (100.0%) | $129,551 |
Household Income in Carefree
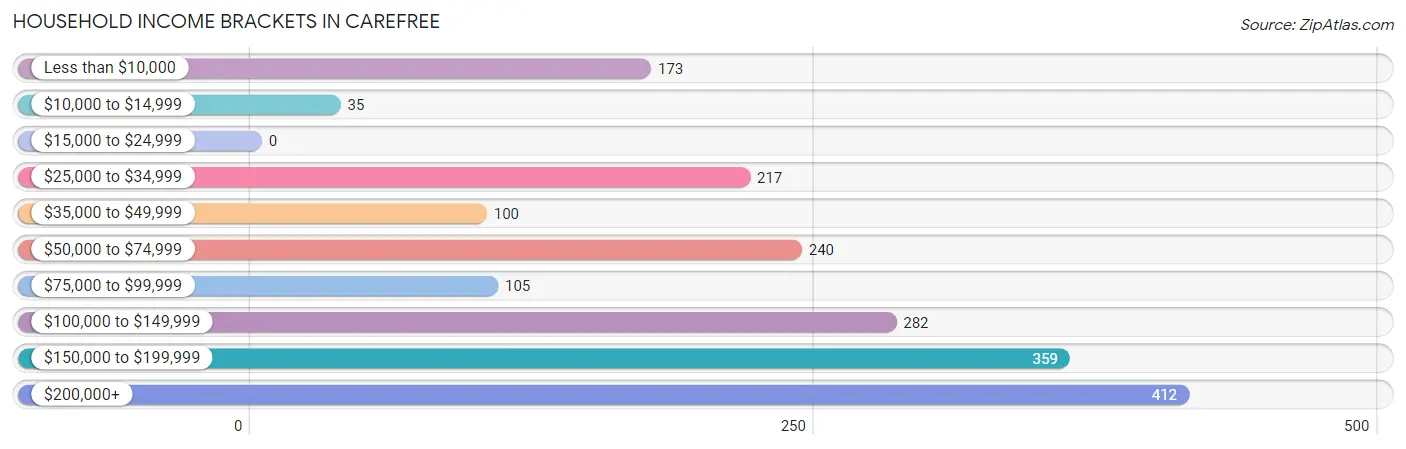
Household Income Brackets in Carefree
With 412 households falling in the category, the $200,000+ income range is the most frequent in Carefree, accounting for 21.5% of all households.
| Income Bracket | # Households | % Households |
| Less than $10,000 | 173 | 9.0% |
| $10,000 to $14,999 | 35 | 1.8% |
| $15,000 to $24,999 | 0 | 0.0% |
| $25,000 to $34,999 | 217 | 11.3% |
| $35,000 to $49,999 | 100 | 5.2% |
| $50,000 to $74,999 | 240 | 12.5% |
| $75,000 to $99,999 | 105 | 5.5% |
| $100,000 to $149,999 | 282 | 14.7% |
| $150,000 to $199,999 | 359 | 18.7% |
| $200,000+ | 412 | 21.5% |
Household Income by Householder Age in Carefree
The median household income in Carefree is $122,328, with the highest median household income of $127,629 found in the 45 to 64 years age bracket for the primary householder. A total of 681 households (35.5%) fall into this category.
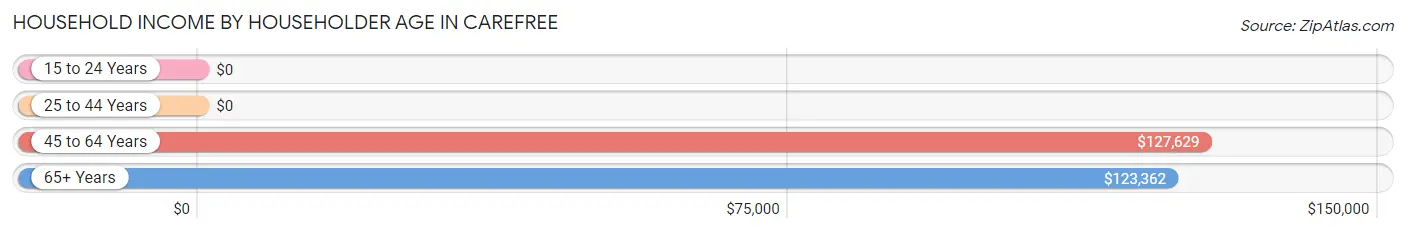
| Income Bracket | # Households | Median Income |
| 15 to 24 Years | 0 (0.0%) | $0 |
| 25 to 44 Years | 47 (2.5%) | $0 |
| 45 to 64 Years | 681 (35.5%) | $127,629 |
| 65+ Years | 1,190 (62.0%) | $123,362 |
| Total | 1,918 (100.0%) | $122,328 |
Poverty in Carefree
Income Below Poverty by Sex and Age in Carefree
With 5.4% poverty level for males and 8.5% for females among the residents of Carefree, 25 to 34 year old males and 75 year old and over females are the most vulnerable to poverty, with 26 males (41.9%) and 87 females (16.4%) in their respective age groups living below the poverty level.
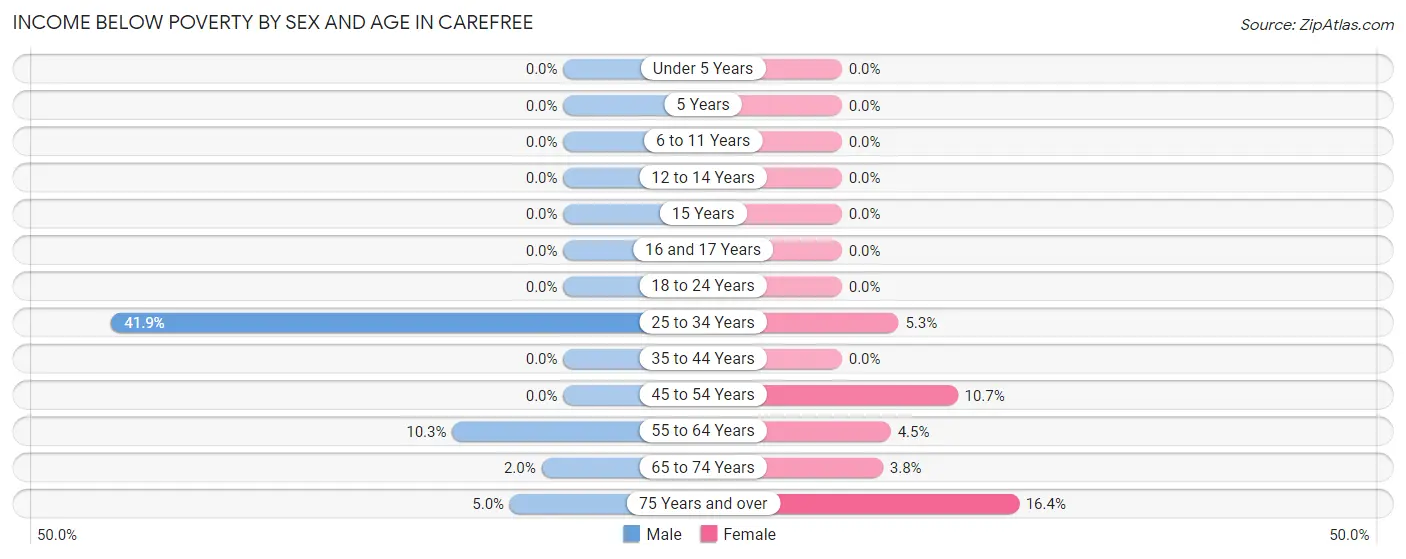
| Age Bracket | Male | Female |
| Under 5 Years | 0 (0.0%) | 0 (0.0%) |
| 5 Years | 0 (0.0%) | 0 (0.0%) |
| 6 to 11 Years | 0 (0.0%) | 0 (0.0%) |
| 12 to 14 Years | 0 (0.0%) | 0 (0.0%) |
| 15 Years | 0 (0.0%) | 0 (0.0%) |
| 16 and 17 Years | 0 (0.0%) | 0 (0.0%) |
| 18 to 24 Years | 0 (0.0%) | 0 (0.0%) |
| 25 to 34 Years | 26 (41.9%) | 3 (5.3%) |
| 35 to 44 Years | 0 (0.0%) | 0 (0.0%) |
| 45 to 54 Years | 0 (0.0%) | 35 (10.7%) |
| 55 to 64 Years | 30 (10.3%) | 23 (4.5%) |
| 65 to 74 Years | 9 (2.0%) | 9 (3.8%) |
| 75 Years and over | 29 (5.0%) | 87 (16.4%) |
| Total | 94 (5.4%) | 157 (8.5%) |
Income Above Poverty by Sex and Age in Carefree
According to the poverty statistics in Carefree, males aged 6 to 11 years and females aged 16 and 17 years are the age groups that are most secure financially, with 100.0% of males and 100.0% of females in these age groups living above the poverty line.
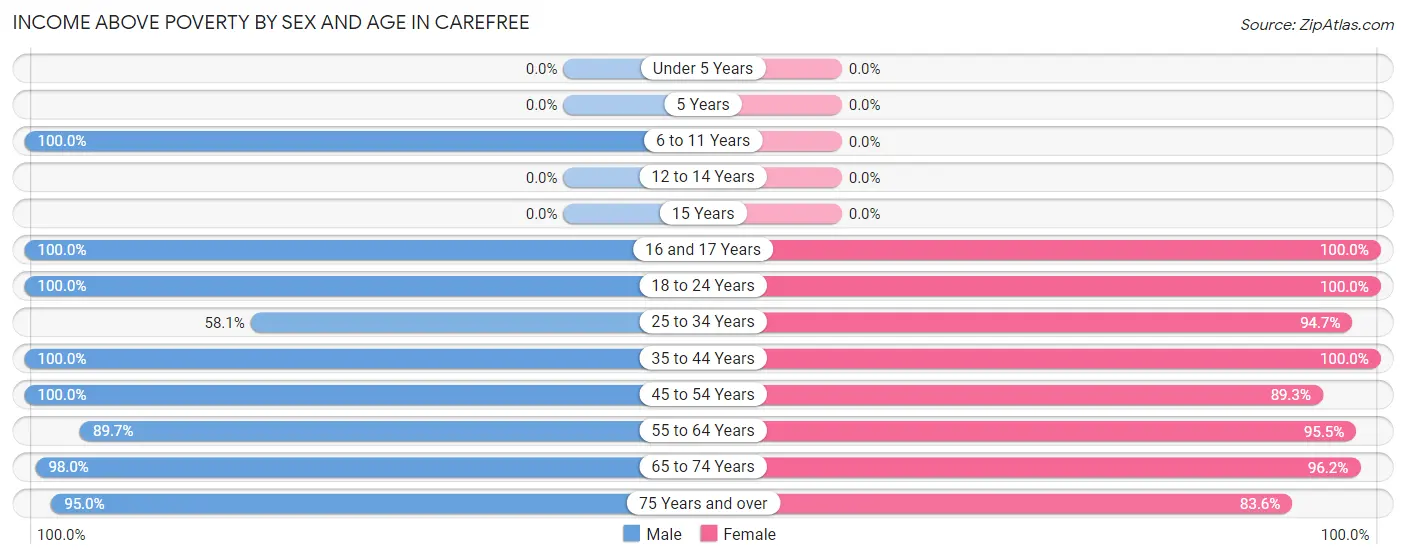
| Age Bracket | Male | Female |
| Under 5 Years | 0 (0.0%) | 0 (0.0%) |
| 5 Years | 0 (0.0%) | 0 (0.0%) |
| 6 to 11 Years | 16 (100.0%) | 0 (0.0%) |
| 12 to 14 Years | 0 (0.0%) | 0 (0.0%) |
| 15 Years | 0 (0.0%) | 0 (0.0%) |
| 16 and 17 Years | 37 (100.0%) | 22 (100.0%) |
| 18 to 24 Years | 85 (100.0%) | 89 (100.0%) |
| 25 to 34 Years | 36 (58.1%) | 54 (94.7%) |
| 35 to 44 Years | 28 (100.0%) | 91 (100.0%) |
| 45 to 54 Years | 193 (100.0%) | 291 (89.3%) |
| 55 to 64 Years | 261 (89.7%) | 484 (95.5%) |
| 65 to 74 Years | 436 (98.0%) | 227 (96.2%) |
| 75 Years and over | 556 (95.0%) | 443 (83.6%) |
| Total | 1,648 (94.6%) | 1,701 (91.5%) |
Income Below Poverty Among Married-Couple Families in Carefree
The poverty statistics for married-couple families in Carefree show that 3.6% or 38 of the total 1,058 families live below the poverty line. Families with no children have the highest poverty rate of 3.7%, comprising of 38 families. On the other hand, families with 1 or 2 children have the lowest poverty rate of 0.0%, which includes 0 families.
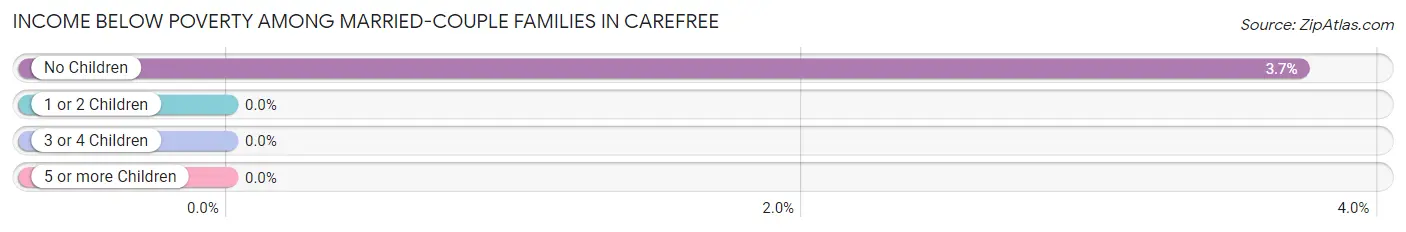
| Children | Above Poverty | Below Poverty |
| No Children | 980 (96.3%) | 38 (3.7%) |
| 1 or 2 Children | 40 (100.0%) | 0 (0.0%) |
| 3 or 4 Children | 0 (0.0%) | 0 (0.0%) |
| 5 or more Children | 0 (0.0%) | 0 (0.0%) |
| Total | 1,020 (96.4%) | 38 (3.6%) |
Income Below Poverty Among Single-Parent Households in Carefree
| Children | Single Father | Single Mother |
| No Children | 0 (0.0%) | 0 (0.0%) |
| 1 or 2 Children | 0 (0.0%) | 0 (0.0%) |
| 3 or 4 Children | 0 (0.0%) | 0 (0.0%) |
| 5 or more Children | 0 (0.0%) | 0 (0.0%) |
| Total | 0 (0.0%) | 0 (0.0%) |
Income Below Poverty Among Married-Couple vs Single-Parent Households in Carefree
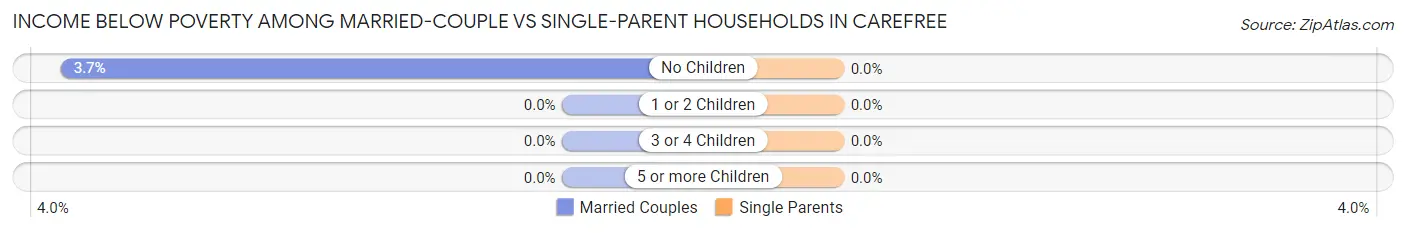
| Children | Married-Couple Families | Single-Parent Households |
| No Children | 38 (3.7%) | 0 (0.0%) |
| 1 or 2 Children | 0 (0.0%) | 0 (0.0%) |
| 3 or 4 Children | 0 (0.0%) | 0 (0.0%) |
| 5 or more Children | 0 (0.0%) | 0 (0.0%) |
| Total | 38 (3.6%) | 0 (0.0%) |
Race in Carefree
The most populous races in Carefree are White / Caucasian (3,592 | 97.9%), Hispanic or Latino (76 | 2.1%), and Two or more Races (28 | 0.8%).
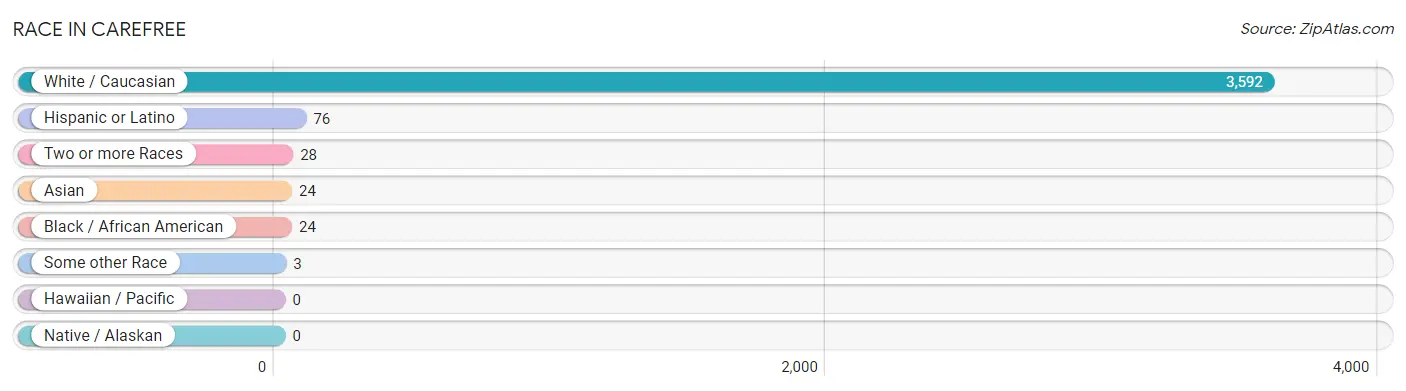
| Race | # Population | % Population |
| Asian | 24 | 0.6% |
| Black / African American | 24 | 0.6% |
| Hawaiian / Pacific | 0 | 0.0% |
| Hispanic or Latino | 76 | 2.1% |
| Native / Alaskan | 0 | 0.0% |
| White / Caucasian | 3,592 | 97.9% |
| Two or more Races | 28 | 0.8% |
| Some other Race | 3 | 0.1% |
| Total | 3,671 | 100.0% |
Ancestry in Carefree
The most populous ancestries reported in Carefree are German (828 | 22.6%), English (641 | 17.5%), Irish (233 | 6.4%), Italian (231 | 6.3%), and Lithuanian (217 | 5.9%), together accounting for 58.6% of all Carefree residents.
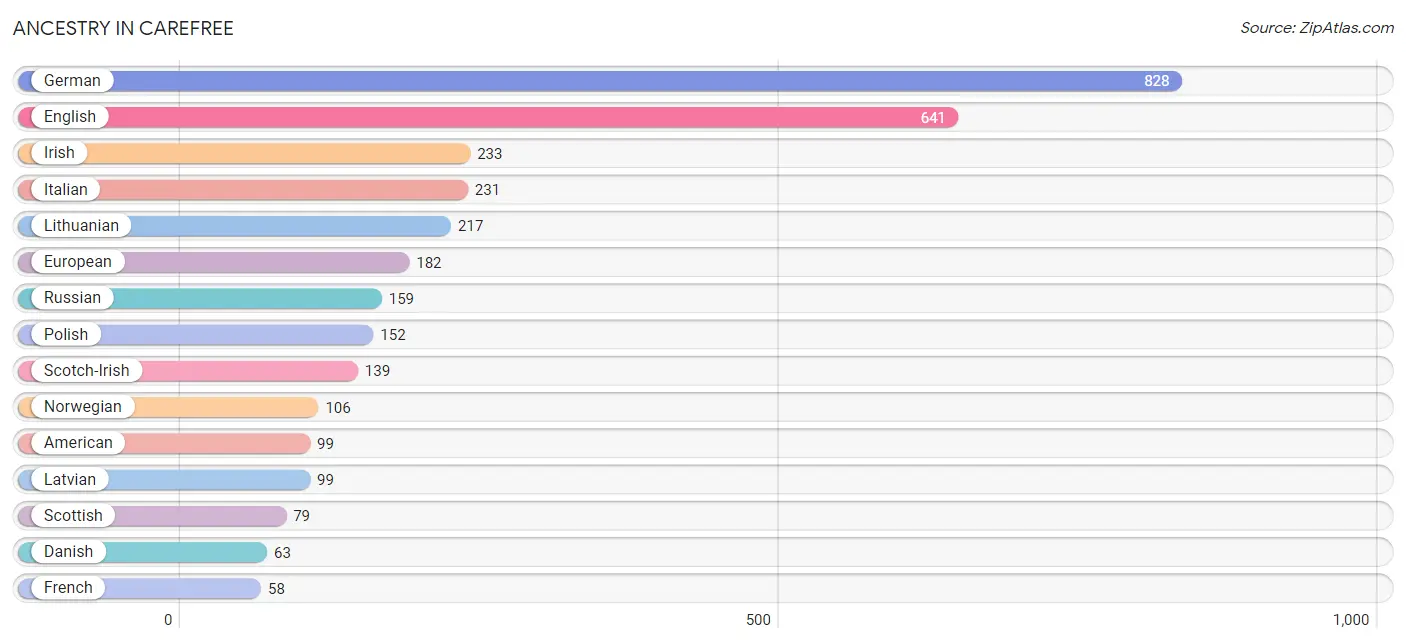
| Ancestry | # Population | % Population |
| American | 99 | 2.7% |
| Arab | 31 | 0.8% |
| Bhutanese | 24 | 0.6% |
| Czech | 32 | 0.9% |
| Danish | 63 | 1.7% |
| English | 641 | 17.5% |
| European | 182 | 5.0% |
| French | 58 | 1.6% |
| German | 828 | 22.6% |
| Hungarian | 21 | 0.6% |
| Irish | 233 | 6.4% |
| Italian | 231 | 6.3% |
| Latvian | 99 | 2.7% |
| Lebanese | 15 | 0.4% |
| Lithuanian | 217 | 5.9% |
| Mexican | 17 | 0.5% |
| Moroccan | 16 | 0.4% |
| Northern European | 25 | 0.7% |
| Norwegian | 106 | 2.9% |
| Polish | 152 | 4.1% |
| Portuguese | 3 | 0.1% |
| Romanian | 34 | 0.9% |
| Russian | 159 | 4.3% |
| Scotch-Irish | 139 | 3.8% |
| Scottish | 79 | 2.1% |
| Slovene | 30 | 0.8% |
| Spaniard | 16 | 0.4% |
| Spanish | 32 | 0.9% |
| Swedish | 3 | 0.1% |
| Swiss | 14 | 0.4% |
| Ukrainian | 31 | 0.8% | View All 31 Rows |
Immigrants in Carefree
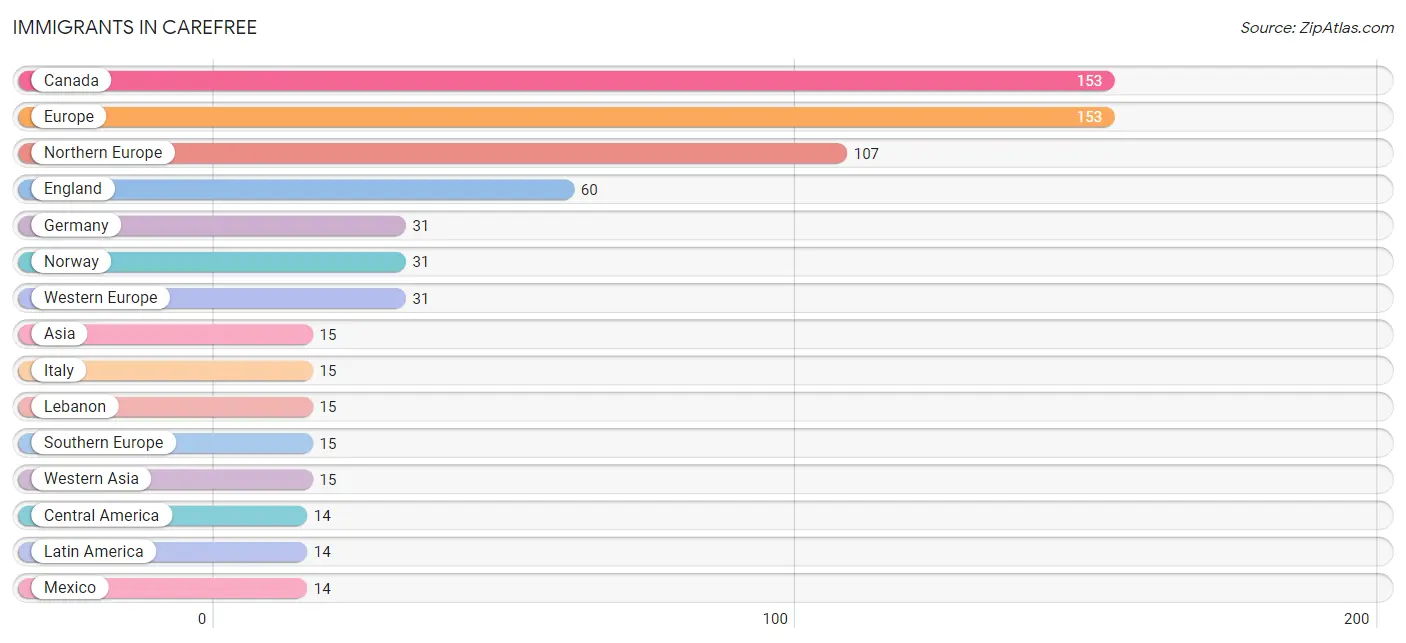
The most numerous immigrant groups reported in Carefree came from Canada (153 | 4.2%), Europe (153 | 4.2%), Northern Europe (107 | 2.9%), England (60 | 1.6%), and Germany (31 | 0.8%), together accounting for 13.7% of all Carefree residents.
| Immigration Origin | # Population | % Population |
| Africa | 13 | 0.4% |
| Asia | 15 | 0.4% |
| Canada | 153 | 4.2% |
| Central America | 14 | 0.4% |
| England | 60 | 1.6% |
| Europe | 153 | 4.2% |
| Germany | 31 | 0.8% |
| Italy | 15 | 0.4% |
| Latin America | 14 | 0.4% |
| Lebanon | 15 | 0.4% |
| Mexico | 14 | 0.4% |
| Morocco | 13 | 0.4% |
| Northern Africa | 13 | 0.4% |
| Northern Europe | 107 | 2.9% |
| Norway | 31 | 0.8% |
| Southern Europe | 15 | 0.4% |
| Western Asia | 15 | 0.4% |
| Western Europe | 31 | 0.8% | View All 18 Rows |
Sex and Age in Carefree
Sex and Age in Carefree
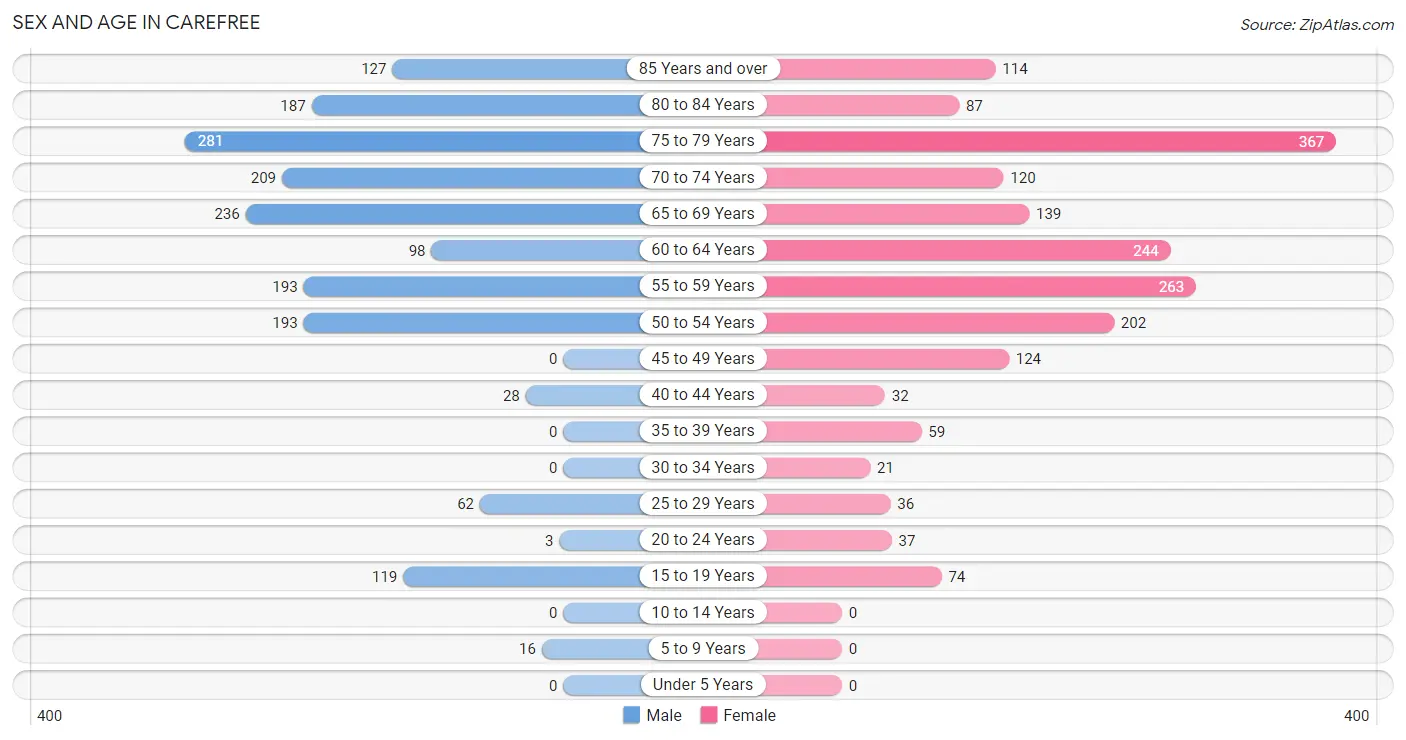
The most populous age groups in Carefree are 75 to 79 Years (281 | 16.0%) for men and 75 to 79 Years (367 | 19.1%) for women.
| Age Bracket | Male | Female |
| Under 5 Years | 0 (0.0%) | 0 (0.0%) |
| 5 to 9 Years | 16 (0.9%) | 0 (0.0%) |
| 10 to 14 Years | 0 (0.0%) | 0 (0.0%) |
| 15 to 19 Years | 119 (6.8%) | 74 (3.9%) |
| 20 to 24 Years | 3 (0.2%) | 37 (1.9%) |
| 25 to 29 Years | 62 (3.5%) | 36 (1.9%) |
| 30 to 34 Years | 0 (0.0%) | 21 (1.1%) |
| 35 to 39 Years | 0 (0.0%) | 59 (3.1%) |
| 40 to 44 Years | 28 (1.6%) | 32 (1.7%) |
| 45 to 49 Years | 0 (0.0%) | 124 (6.5%) |
| 50 to 54 Years | 193 (11.0%) | 202 (10.5%) |
| 55 to 59 Years | 193 (11.0%) | 263 (13.7%) |
| 60 to 64 Years | 98 (5.6%) | 244 (12.7%) |
| 65 to 69 Years | 236 (13.5%) | 139 (7.2%) |
| 70 to 74 Years | 209 (11.9%) | 120 (6.2%) |
| 75 to 79 Years | 281 (16.0%) | 367 (19.1%) |
| 80 to 84 Years | 187 (10.7%) | 87 (4.5%) |
| 85 Years and over | 127 (7.2%) | 114 (5.9%) |
| Total | 1,752 (100.0%) | 1,919 (100.0%) |
Families and Households in Carefree
Median Family Size in Carefree
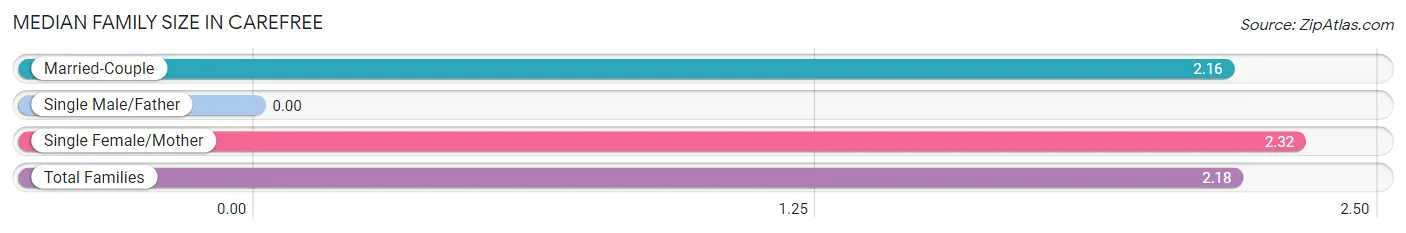
| Family Type | # Families | Family Size |
| Married-Couple | 1,058 (91.5%) | 2.16 |
| Single Male/Father | 0 (0.0%) | - |
| Single Female/Mother | 98 (8.5%) | 2.32 |
| Total Families | 1,156 (100.0%) | 2.18 |
Median Household Size in Carefree
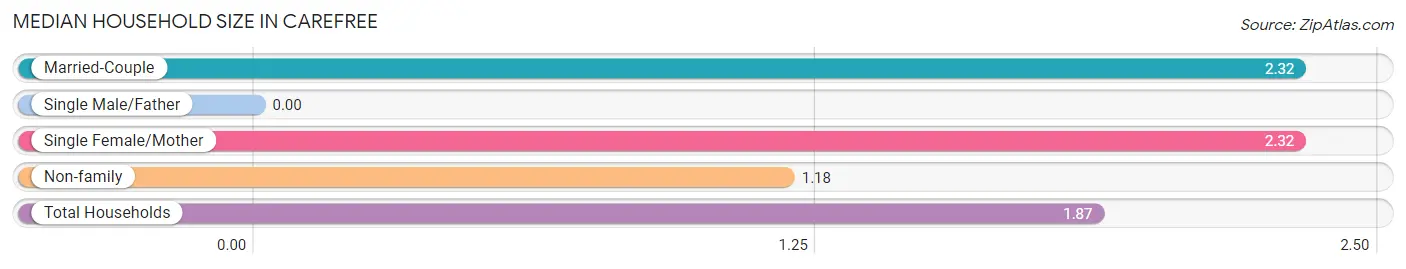
| Household Type | # Households | Household Size |
| Married-Couple | 1,058 (55.2%) | 2.32 |
| Single Male/Father | 0 (0.0%) | - |
| Single Female/Mother | 98 (5.1%) | 2.32 |
| Non-family | 762 (39.7%) | 1.18 |
| Total Households | 1,918 (100.0%) | 1.87 |
Household Size by Marriage Status in Carefree
Out of a total of 1,918 households in Carefree, 1,156 (60.3%) are family households, while 762 (39.7%) are nonfamily households. The most numerous type of family households are 2-person households, comprising 897, and the most common type of nonfamily households are 1-person households, comprising 626.
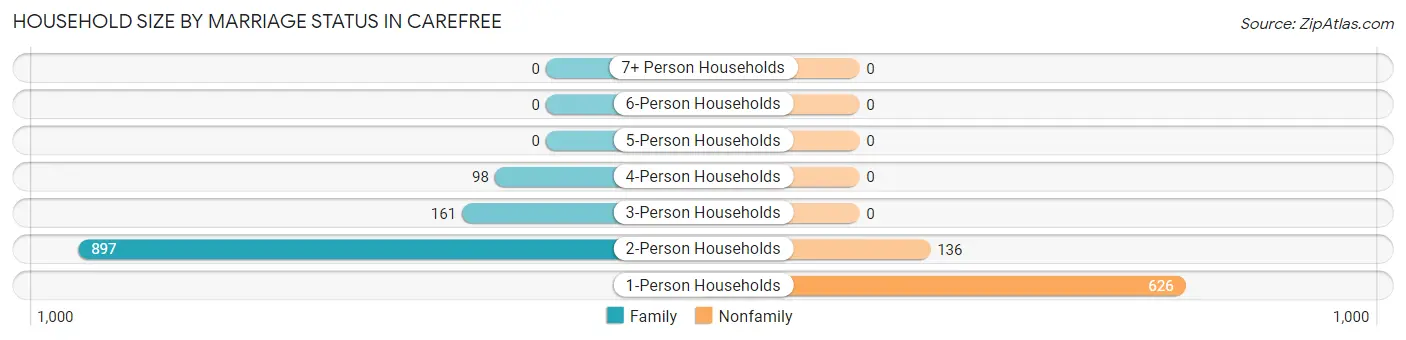
| Household Size | Family Households | Nonfamily Households |
| 1-Person Households | - | 626 (32.6%) |
| 2-Person Households | 897 (46.8%) | 136 (7.1%) |
| 3-Person Households | 161 (8.4%) | 0 (0.0%) |
| 4-Person Households | 98 (5.1%) | 0 (0.0%) |
| 5-Person Households | 0 (0.0%) | 0 (0.0%) |
| 6-Person Households | 0 (0.0%) | 0 (0.0%) |
| 7+ Person Households | 0 (0.0%) | 0 (0.0%) |
| Total | 1,156 (60.3%) | 762 (39.7%) |
Female Fertility in Carefree
Fertility by Age in Carefree
Average fertility rate in Carefree is 7.0 births per 1,000 women. Women in the age bracket of 20 to 34 years have the highest fertility rate with 32.0 births per 1,000 women. Women in the age bracket of 20 to 34 years acount for 100.0% of all women with births.
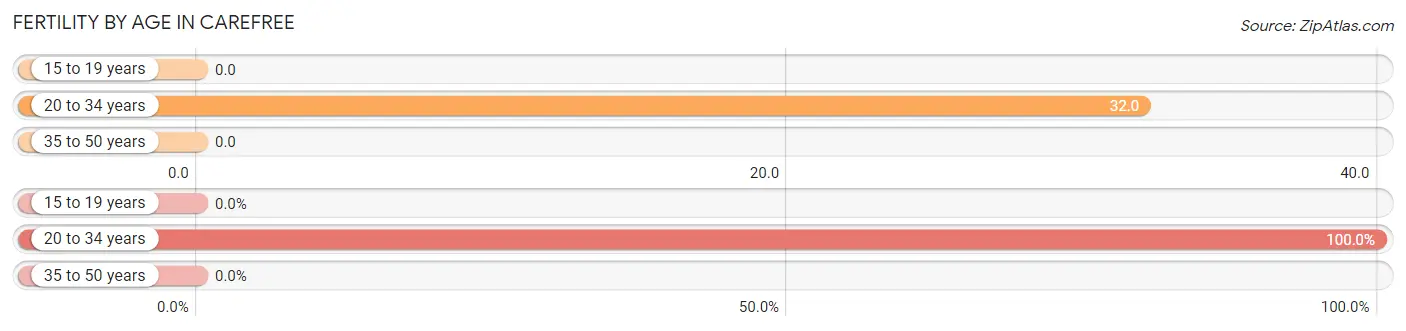
| Age Bracket | Women with Births | Births / 1,000 Women |
| 15 to 19 years | 0 (0.0%) | 0.0 |
| 20 to 34 years | 3 (100.0%) | 32.0 |
| 35 to 50 years | 0 (0.0%) | 0.0 |
| Total | 3 (100.0%) | 7.0 |
Fertility by Age by Marriage Status in Carefree
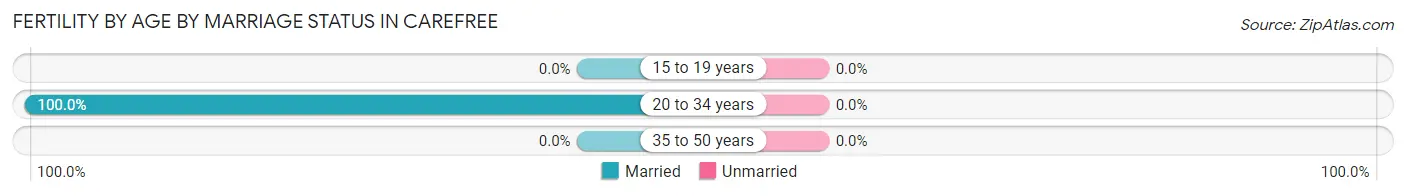
| Age Bracket | Married | Unmarried |
| 15 to 19 years | 0 (0.0%) | 0 (0.0%) |
| 20 to 34 years | 3 (100.0%) | 0 (0.0%) |
| 35 to 50 years | 0 (0.0%) | 0 (0.0%) |
| Total | 3 (100.0%) | 0 (0.0%) |
Fertility by Education in Carefree
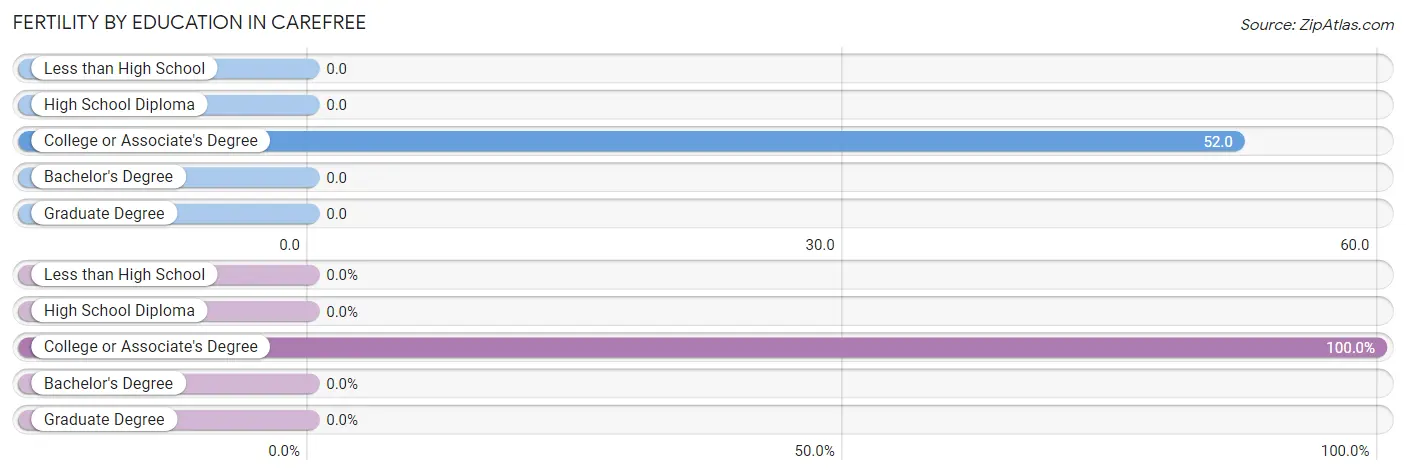
| Educational Attainment | Women with Births | Births / 1,000 Women |
| Less than High School | 0 (0.0%) | 0.0 |
| High School Diploma | 0 (0.0%) | 0.0 |
| College or Associate's Degree | 3 (100.0%) | 52.0 |
| Bachelor's Degree | 0 (0.0%) | 0.0 |
| Graduate Degree | 0 (0.0%) | 0.0 |
| Total | 3 (100.0%) | 7.0 |
Fertility by Education by Marriage Status in Carefree
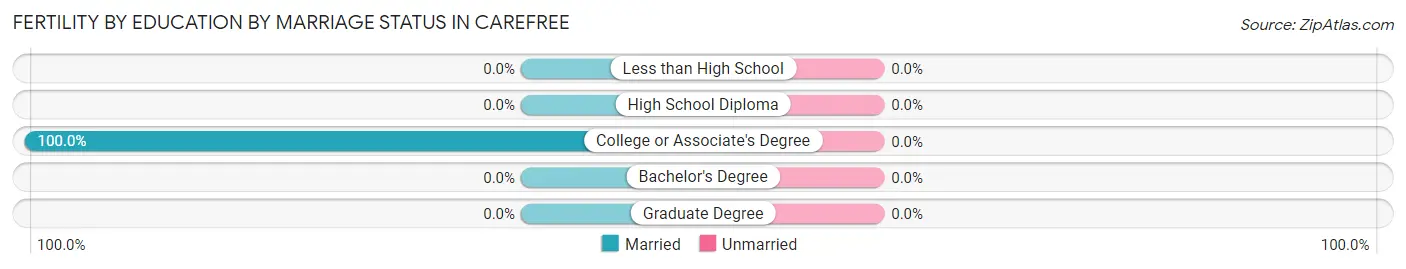
| Educational Attainment | Married | Unmarried |
| Less than High School | 0 (0.0%) | 0 (0.0%) |
| High School Diploma | 0 (0.0%) | 0 (0.0%) |
| College or Associate's Degree | 3 (100.0%) | 0 (0.0%) |
| Bachelor's Degree | 0 (0.0%) | 0 (0.0%) |
| Graduate Degree | 0 (0.0%) | 0 (0.0%) |
| Total | 3 (100.0%) | 0 (0.0%) |
Employment Characteristics in Carefree
Employment by Class of Employer in Carefree
Among the 1,368 employed individuals in Carefree, private company employees (900 | 65.8%), self-employed (not incorporated) (199 | 14.5%), and self-employed (incorporated) (86 | 6.3%) make up the most common classes of employment.
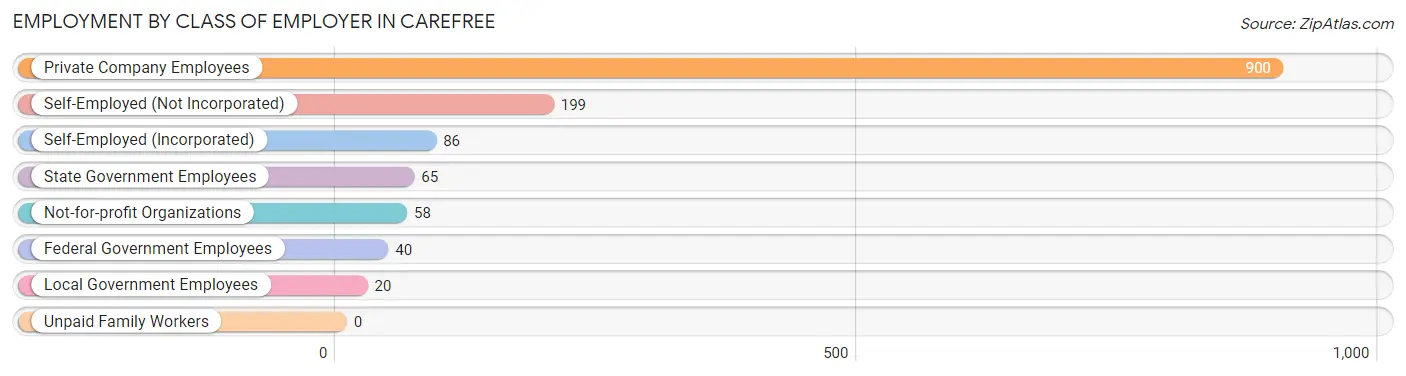
| Employer Class | # Employees | % Employees |
| Private Company Employees | 900 | 65.8% |
| Self-Employed (Incorporated) | 86 | 6.3% |
| Self-Employed (Not Incorporated) | 199 | 14.5% |
| Not-for-profit Organizations | 58 | 4.2% |
| Local Government Employees | 20 | 1.5% |
| State Government Employees | 65 | 4.8% |
| Federal Government Employees | 40 | 2.9% |
| Unpaid Family Workers | 0 | 0.0% |
| Total | 1,368 | 100.0% |
Employment Status by Age in Carefree
According to the labor force statistics for Carefree, out of the total population over 16 years of age (3,655), 42.0% or 1,535 individuals are in the labor force, with 2.0% or 31 of them unemployed. The age group with the highest labor force participation rate is 20 to 24 years, with 100.0% or 40 individuals in the labor force. Within the labor force, the 45 to 54 years age range has the highest percentage of unemployed individuals, with 5.8% or 28 of them being unemployed.
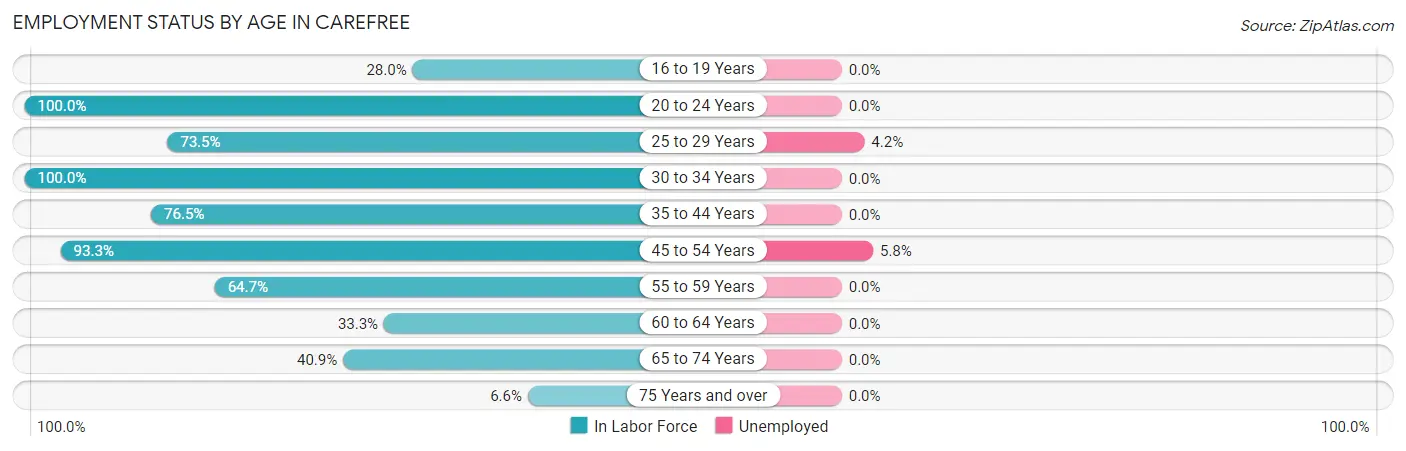
| Age Bracket | In Labor Force | Unemployed |
| 16 to 19 Years | 54 (28.0%) | 0 (0.0%) |
| 20 to 24 Years | 40 (100.0%) | 0 (0.0%) |
| 25 to 29 Years | 72 (73.5%) | 3 (4.2%) |
| 30 to 34 Years | 21 (100.0%) | 0 (0.0%) |
| 35 to 44 Years | 91 (76.5%) | 0 (0.0%) |
| 45 to 54 Years | 484 (93.3%) | 28 (5.8%) |
| 55 to 59 Years | 295 (64.7%) | 0 (0.0%) |
| 60 to 64 Years | 114 (33.3%) | 0 (0.0%) |
| 65 to 74 Years | 288 (40.9%) | 0 (0.0%) |
| 75 Years and over | 77 (6.6%) | 0 (0.0%) |
| Total | 1,535 (42.0%) | 31 (2.0%) |
Employment Status by Educational Attainment in Carefree
According to labor force statistics for Carefree, 69.3% of individuals (1,078) out of the total population between 25 and 64 years of age (1,555) are in the labor force, with 2.9% or 31 of them being unemployed. The group with the highest labor force participation rate are those with the educational attainment of less than high school, with 100.0% or 3 individuals in the labor force. Within the labor force, individuals with less than high school education have the highest percentage of unemployment, with 100.0% or 3 of them being unemployed.
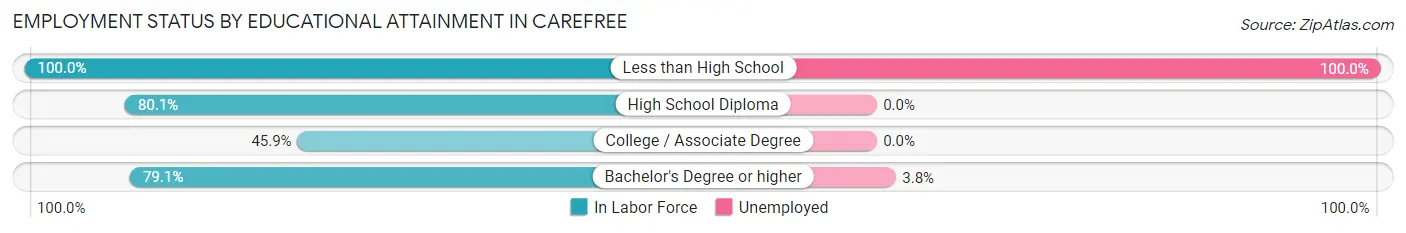
| Educational Attainment | In Labor Force | Unemployed |
| Less than High School | 3 (100.0%) | 3 (100.0%) |
| High School Diploma | 121 (80.1%) | 0 (0.0%) |
| College / Associate Degree | 215 (45.9%) | 0 (0.0%) |
| Bachelor's Degree or higher | 738 (79.1%) | 35 (3.8%) |
| Total | 1,078 (69.3%) | 45 (2.9%) |
Employment Occupations by Sex in Carefree
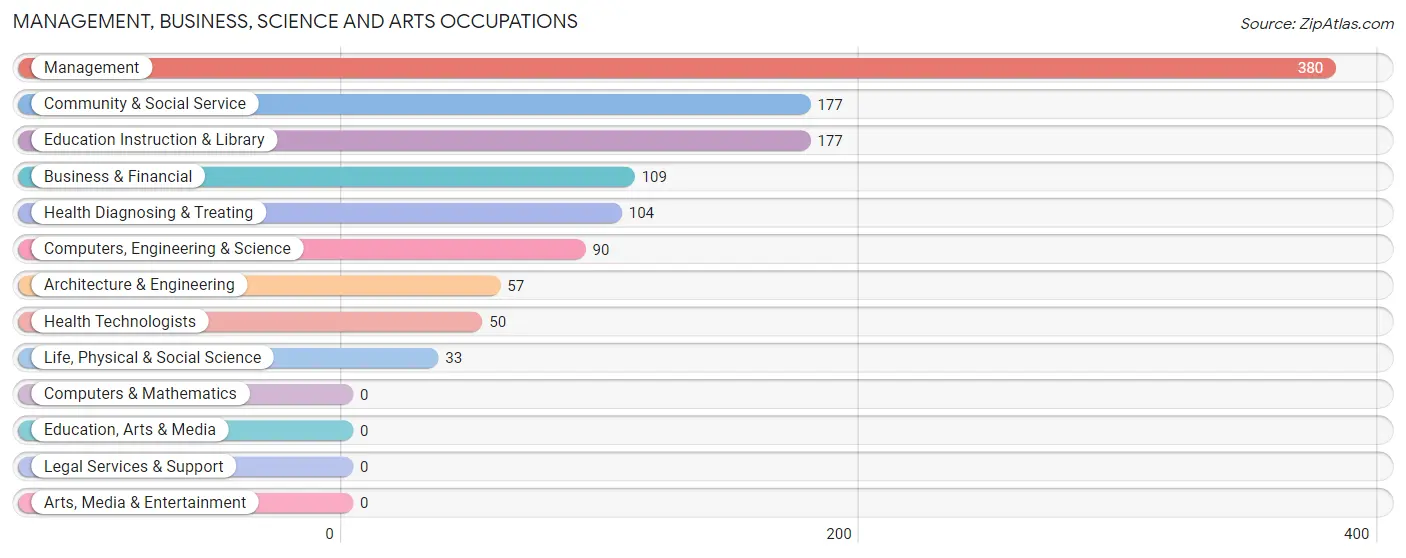
Management, Business, Science and Arts Occupations
The most common Management, Business, Science and Arts occupations in Carefree are Management (380 | 25.3%), Community & Social Service (177 | 11.8%), Education Instruction & Library (177 | 11.8%), Business & Financial (109 | 7.2%), and Health Diagnosing & Treating (104 | 6.9%).
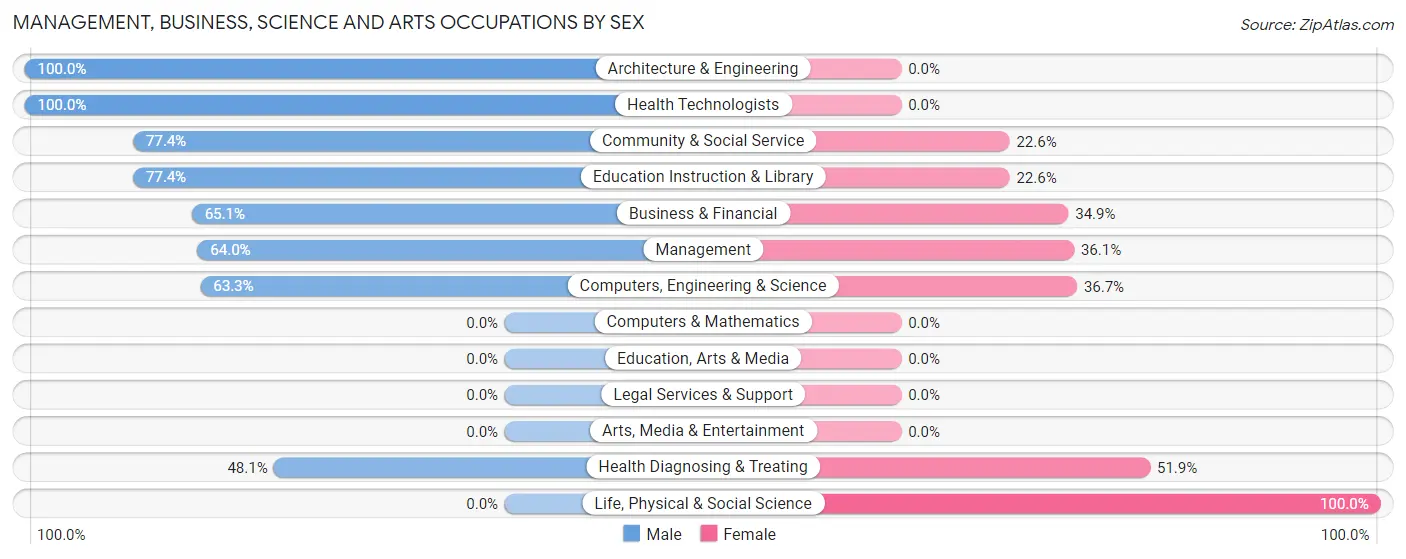
Management, Business, Science and Arts Occupations by Sex
Within the Management, Business, Science and Arts occupations in Carefree, the most male-oriented occupations are Architecture & Engineering (100.0%), Health Technologists (100.0%), and Community & Social Service (77.4%), while the most female-oriented occupations are Life, Physical & Social Science (100.0%), Health Diagnosing & Treating (51.9%), and Computers, Engineering & Science (36.7%).
| Occupation | Male | Female |
| Management | 243 (63.9%) | 137 (36.0%) |
| Business & Financial | 71 (65.1%) | 38 (34.9%) |
| Computers, Engineering & Science | 57 (63.3%) | 33 (36.7%) |
| Computers & Mathematics | 0 (0.0%) | 0 (0.0%) |
| Architecture & Engineering | 57 (100.0%) | 0 (0.0%) |
| Life, Physical & Social Science | 0 (0.0%) | 33 (100.0%) |
| Community & Social Service | 137 (77.4%) | 40 (22.6%) |
| Education, Arts & Media | 0 (0.0%) | 0 (0.0%) |
| Legal Services & Support | 0 (0.0%) | 0 (0.0%) |
| Education Instruction & Library | 137 (77.4%) | 40 (22.6%) |
| Arts, Media & Entertainment | 0 (0.0%) | 0 (0.0%) |
| Health Diagnosing & Treating | 50 (48.1%) | 54 (51.9%) |
| Health Technologists | 50 (100.0%) | 0 (0.0%) |
| Total (Category) | 558 (64.9%) | 302 (35.1%) |
| Total (Overall) | 778 (51.7%) | 727 (48.3%) |
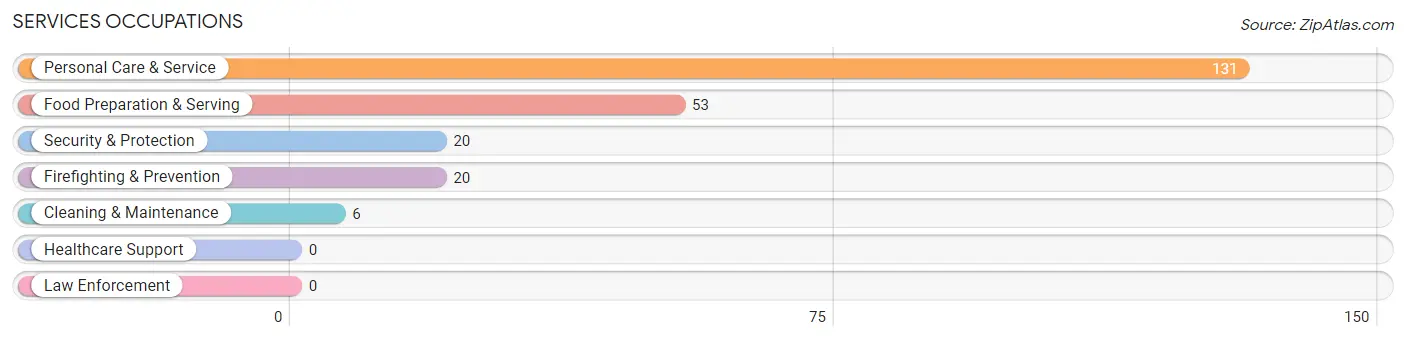
Services Occupations
The most common Services occupations in Carefree are Personal Care & Service (131 | 8.7%), Food Preparation & Serving (53 | 3.5%), Security & Protection (20 | 1.3%), Firefighting & Prevention (20 | 1.3%), and Cleaning & Maintenance (6 | 0.4%).
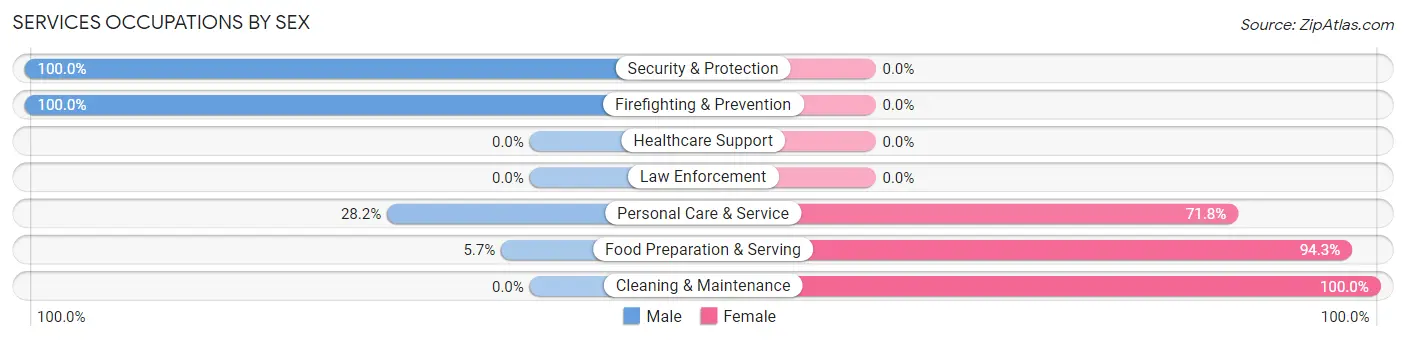
Services Occupations by Sex
Within the Services occupations in Carefree, the most male-oriented occupations are Security & Protection (100.0%), Firefighting & Prevention (100.0%), and Personal Care & Service (28.2%), while the most female-oriented occupations are Cleaning & Maintenance (100.0%), Food Preparation & Serving (94.3%), and Personal Care & Service (71.8%).
| Occupation | Male | Female |
| Healthcare Support | 0 (0.0%) | 0 (0.0%) |
| Security & Protection | 20 (100.0%) | 0 (0.0%) |
| Firefighting & Prevention | 20 (100.0%) | 0 (0.0%) |
| Law Enforcement | 0 (0.0%) | 0 (0.0%) |
| Food Preparation & Serving | 3 (5.7%) | 50 (94.3%) |
| Cleaning & Maintenance | 0 (0.0%) | 6 (100.0%) |
| Personal Care & Service | 37 (28.2%) | 94 (71.8%) |
| Total (Category) | 60 (28.6%) | 150 (71.4%) |
| Total (Overall) | 778 (51.7%) | 727 (48.3%) |
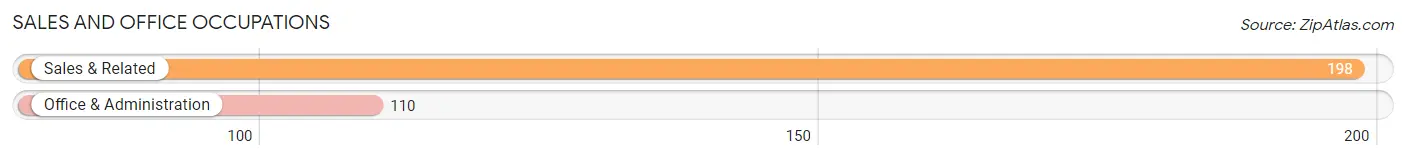
Sales and Office Occupations
The most common Sales and Office occupations in Carefree are Sales & Related (198 | 13.2%), and Office & Administration (110 | 7.3%).
Sales and Office Occupations by Sex
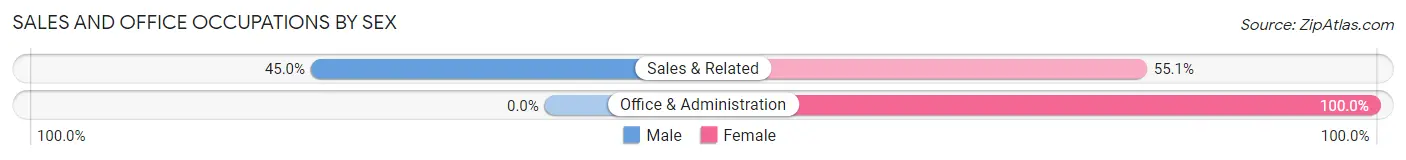
| Occupation | Male | Female |
| Sales & Related | 89 (45.0%) | 109 (55.0%) |
| Office & Administration | 0 (0.0%) | 110 (100.0%) |
| Total (Category) | 89 (28.9%) | 219 (71.1%) |
| Total (Overall) | 778 (51.7%) | 727 (48.3%) |
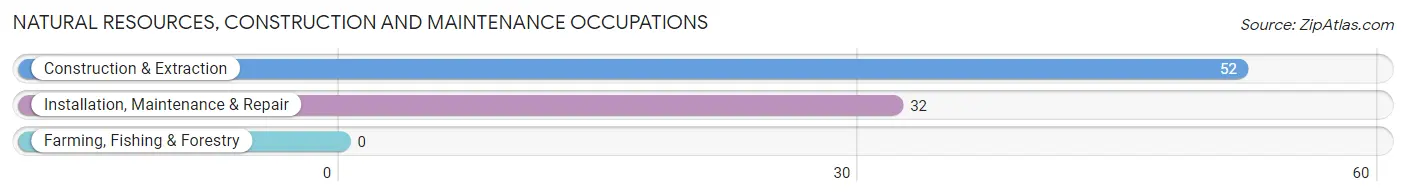
Natural Resources, Construction and Maintenance Occupations
The most common Natural Resources, Construction and Maintenance occupations in Carefree are Construction & Extraction (52 | 3.5%), and Installation, Maintenance & Repair (32 | 2.1%).
Natural Resources, Construction and Maintenance Occupations by Sex
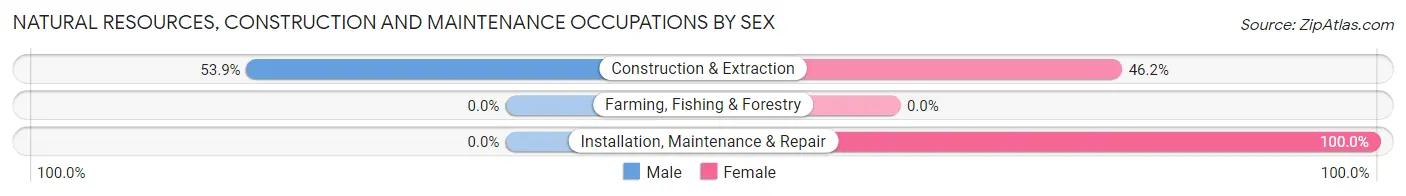
| Occupation | Male | Female |
| Farming, Fishing & Forestry | 0 (0.0%) | 0 (0.0%) |
| Construction & Extraction | 28 (53.8%) | 24 (46.2%) |
| Installation, Maintenance & Repair | 0 (0.0%) | 32 (100.0%) |
| Total (Category) | 28 (33.3%) | 56 (66.7%) |
| Total (Overall) | 778 (51.7%) | 727 (48.3%) |
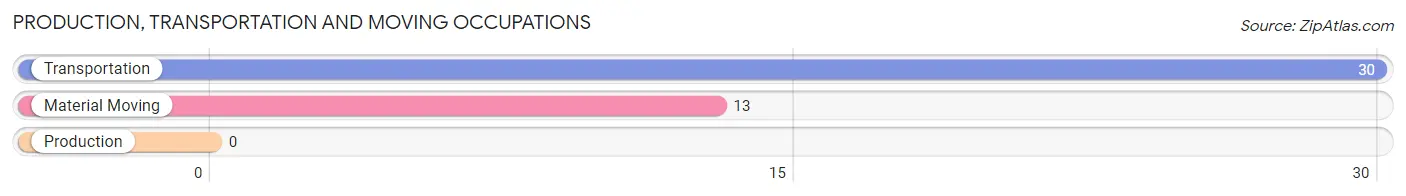
Production, Transportation and Moving Occupations
The most common Production, Transportation and Moving occupations in Carefree are Transportation (30 | 2.0%), and Material Moving (13 | 0.9%).
Production, Transportation and Moving Occupations by Sex
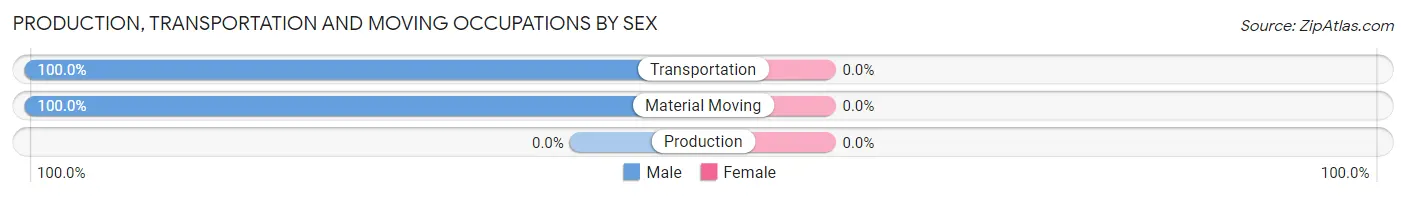
| Occupation | Male | Female |
| Production | 0 (0.0%) | 0 (0.0%) |
| Transportation | 30 (100.0%) | 0 (0.0%) |
| Material Moving | 13 (100.0%) | 0 (0.0%) |
| Total (Category) | 43 (100.0%) | 0 (0.0%) |
| Total (Overall) | 778 (51.7%) | 727 (48.3%) |
Employment Industries by Sex in Carefree
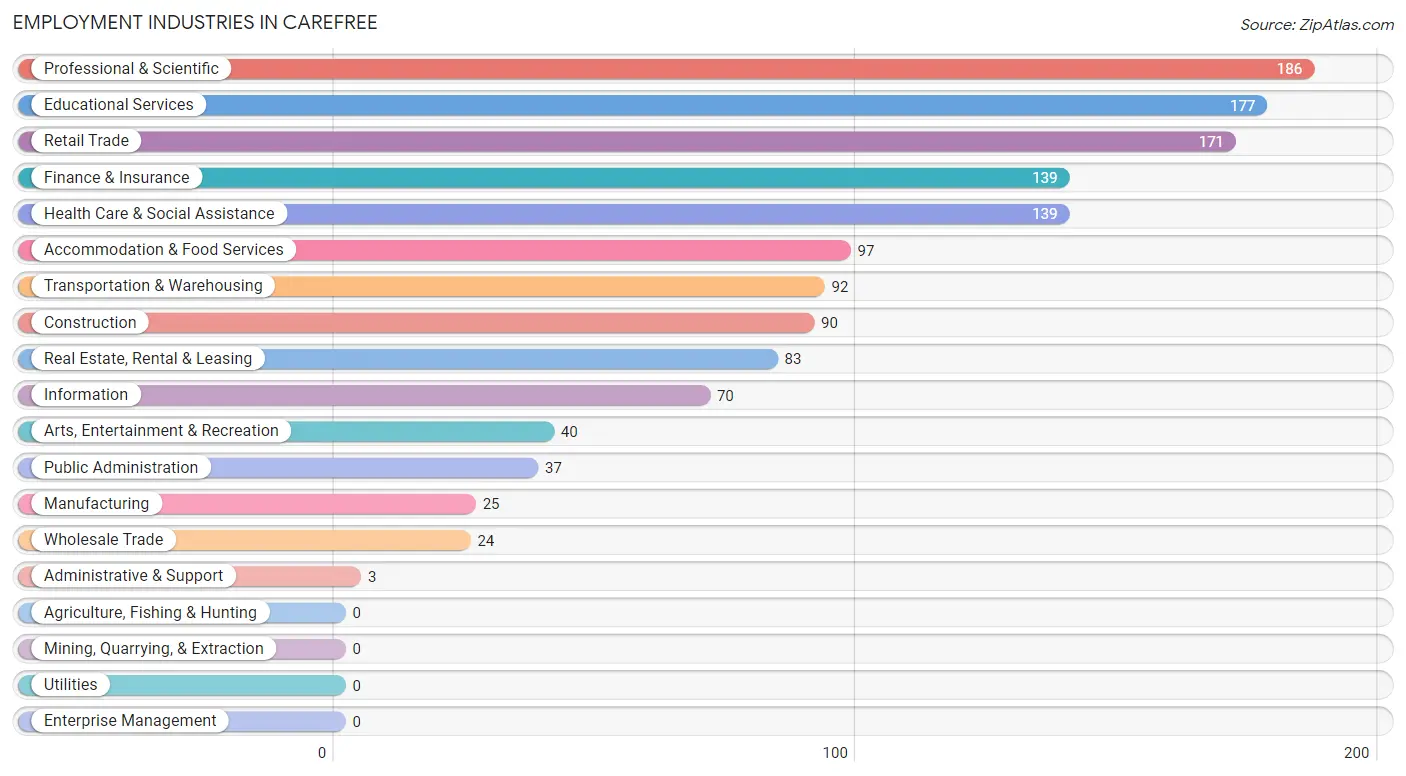
Employment Industries in Carefree
The major employment industries in Carefree include Professional & Scientific (186 | 12.4%), Educational Services (177 | 11.8%), Retail Trade (171 | 11.4%), Finance & Insurance (139 | 9.2%), and Health Care & Social Assistance (139 | 9.2%).
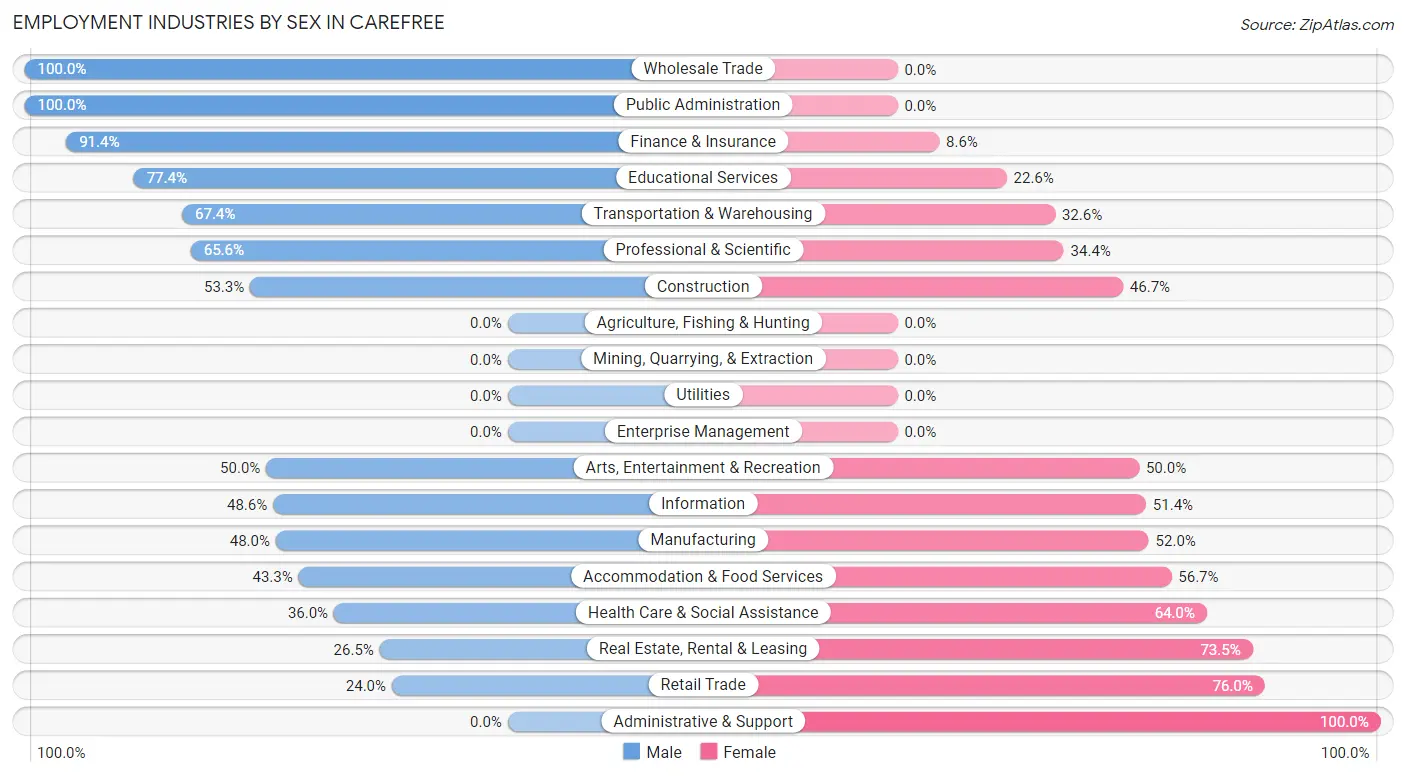
Employment Industries by Sex in Carefree
The Carefree industries that see more men than women are Wholesale Trade (100.0%), Public Administration (100.0%), and Finance & Insurance (91.4%), whereas the industries that tend to have a higher number of women are Administrative & Support (100.0%), Retail Trade (76.0%), and Real Estate, Rental & Leasing (73.5%).
| Industry | Male | Female |
| Agriculture, Fishing & Hunting | 0 (0.0%) | 0 (0.0%) |
| Mining, Quarrying, & Extraction | 0 (0.0%) | 0 (0.0%) |
| Construction | 48 (53.3%) | 42 (46.7%) |
| Manufacturing | 12 (48.0%) | 13 (52.0%) |
| Wholesale Trade | 24 (100.0%) | 0 (0.0%) |
| Retail Trade | 41 (24.0%) | 130 (76.0%) |
| Transportation & Warehousing | 62 (67.4%) | 30 (32.6%) |
| Utilities | 0 (0.0%) | 0 (0.0%) |
| Information | 34 (48.6%) | 36 (51.4%) |
| Finance & Insurance | 127 (91.4%) | 12 (8.6%) |
| Real Estate, Rental & Leasing | 22 (26.5%) | 61 (73.5%) |
| Professional & Scientific | 122 (65.6%) | 64 (34.4%) |
| Enterprise Management | 0 (0.0%) | 0 (0.0%) |
| Administrative & Support | 0 (0.0%) | 3 (100.0%) |
| Educational Services | 137 (77.4%) | 40 (22.6%) |
| Health Care & Social Assistance | 50 (36.0%) | 89 (64.0%) |
| Arts, Entertainment & Recreation | 20 (50.0%) | 20 (50.0%) |
| Accommodation & Food Services | 42 (43.3%) | 55 (56.7%) |
| Public Administration | 37 (100.0%) | 0 (0.0%) |
| Total | 778 (51.7%) | 727 (48.3%) |
Education in Carefree
School Enrollment in Carefree
The most common levels of schooling among the 270 students in Carefree are college / undergraduate (135 | 50.0%), high school (101 | 37.4%), and graduate / professional (18 | 6.7%).
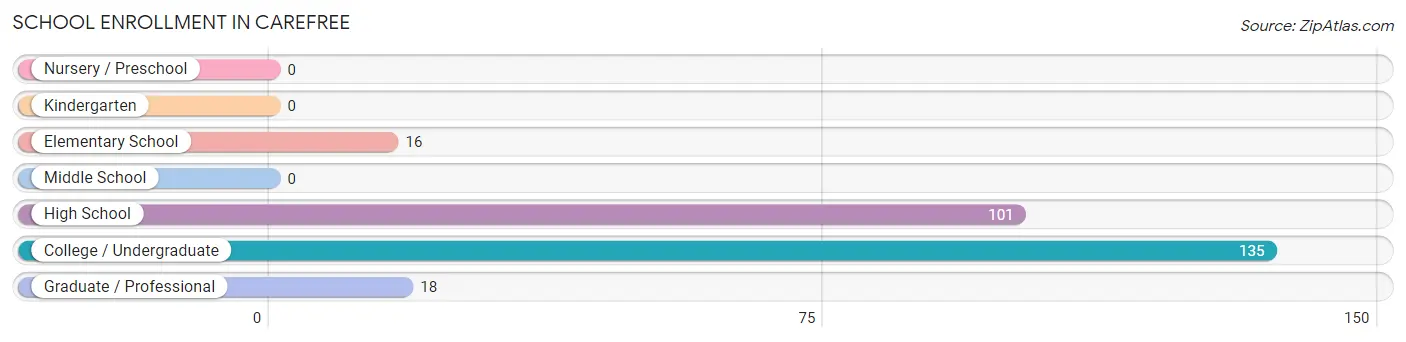
| School Level | # Students | % Students |
| Nursery / Preschool | 0 | 0.0% |
| Kindergarten | 0 | 0.0% |
| Elementary School | 16 | 5.9% |
| Middle School | 0 | 0.0% |
| High School | 101 | 37.4% |
| College / Undergraduate | 135 | 50.0% |
| Graduate / Professional | 18 | 6.7% |
| Total | 270 | 100.0% |
School Enrollment by Age by Funding Source in Carefree
Out of a total of 270 students who are enrolled in schools in Carefree, 18 (6.7%) attend a private institution, while the remaining 252 (93.3%) are enrolled in public schools. The age group of 35 years and over has the highest likelihood of being enrolled in private schools, with 18 (32.7% in the age bracket) enrolled. Conversely, the age group of 5 to 9 year old has the lowest likelihood of being enrolled in a private school, with 16 (100.0% in the age bracket) attending a public institution.
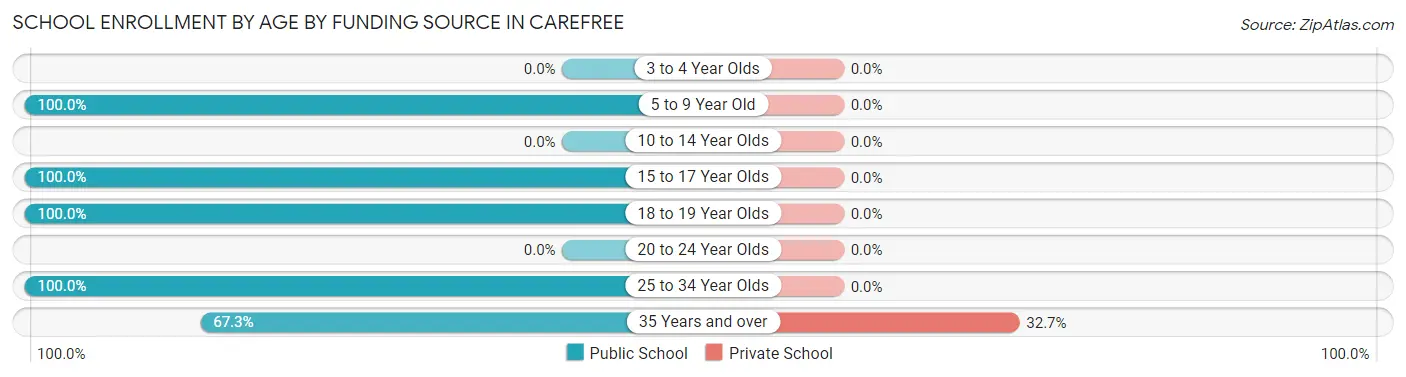
| Age Bracket | Public School | Private School |
| 3 to 4 Year Olds | 0 (0.0%) | 0 (0.0%) |
| 5 to 9 Year Old | 16 (100.0%) | 0 (0.0%) |
| 10 to 14 Year Olds | 0 (0.0%) | 0 (0.0%) |
| 15 to 17 Year Olds | 59 (100.0%) | 0 (0.0%) |
| 18 to 19 Year Olds | 134 (100.0%) | 0 (0.0%) |
| 20 to 24 Year Olds | 0 (0.0%) | 0 (0.0%) |
| 25 to 34 Year Olds | 6 (100.0%) | 0 (0.0%) |
| 35 Years and over | 37 (67.3%) | 18 (32.7%) |
| Total | 252 (93.3%) | 18 (6.7%) |
Educational Attainment by Field of Study in Carefree
Business (679 | 30.5%), science & technology (320 | 14.4%), education (228 | 10.2%), psychology (189 | 8.5%), and engineering (186 | 8.4%) are the most common fields of study among 2,224 individuals in Carefree who have obtained a bachelor's degree or higher.
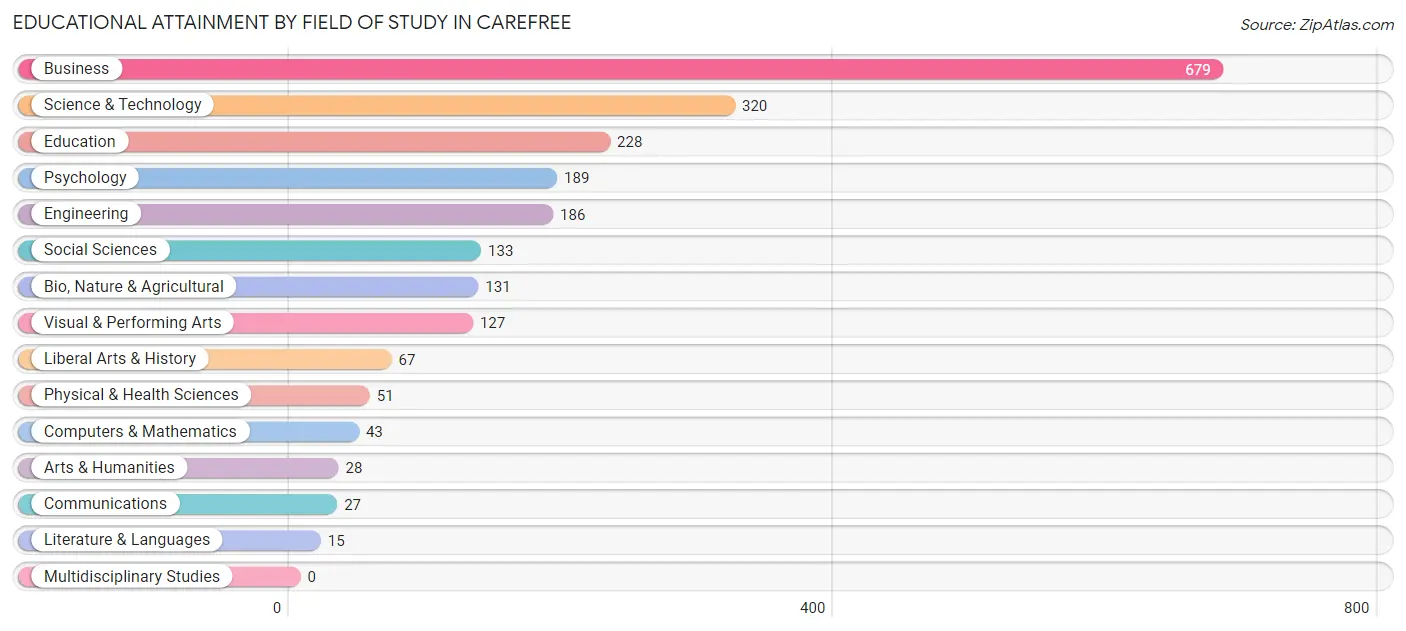
| Field of Study | # Graduates | % Graduates |
| Computers & Mathematics | 43 | 1.9% |
| Bio, Nature & Agricultural | 131 | 5.9% |
| Physical & Health Sciences | 51 | 2.3% |
| Psychology | 189 | 8.5% |
| Social Sciences | 133 | 6.0% |
| Engineering | 186 | 8.4% |
| Multidisciplinary Studies | 0 | 0.0% |
| Science & Technology | 320 | 14.4% |
| Business | 679 | 30.5% |
| Education | 228 | 10.2% |
| Literature & Languages | 15 | 0.7% |
| Liberal Arts & History | 67 | 3.0% |
| Visual & Performing Arts | 127 | 5.7% |
| Communications | 27 | 1.2% |
| Arts & Humanities | 28 | 1.3% |
| Total | 2,224 | 100.0% |
Transportation & Commute in Carefree
Vehicle Availability by Sex in Carefree
The most prevalent vehicle ownership categories in Carefree are males with 2 vehicles (216, accounting for 33.9%) and females with 2 vehicles (162, making up 30.0%).
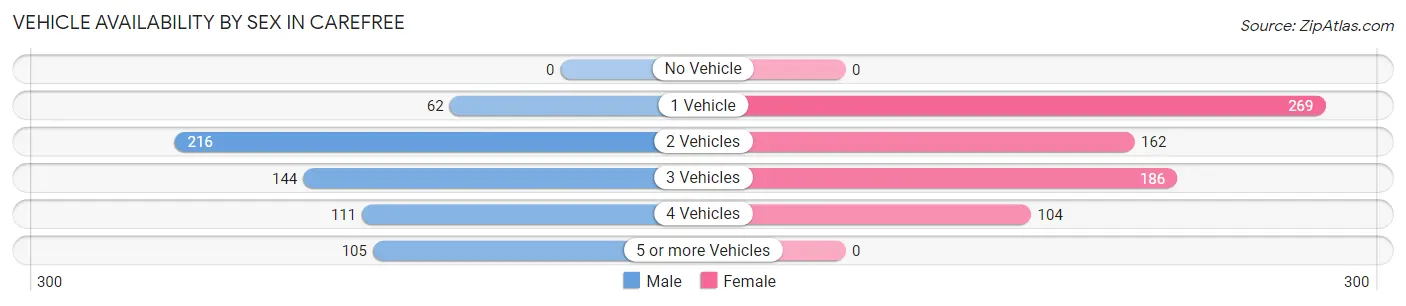
| Vehicles Available | Male | Female |
| No Vehicle | 0 (0.0%) | 0 (0.0%) |
| 1 Vehicle | 62 (9.7%) | 269 (37.3%) |
| 2 Vehicles | 216 (33.9%) | 162 (22.5%) |
| 3 Vehicles | 144 (22.6%) | 186 (25.8%) |
| 4 Vehicles | 111 (17.4%) | 104 (14.4%) |
| 5 or more Vehicles | 105 (16.5%) | 0 (0.0%) |
| Total | 638 (100.0%) | 721 (100.0%) |
Commute Time in Carefree
The most frequently occuring commute durations in Carefree are 30 to 34 minutes (165 commuters, 21.8%), 10 to 14 minutes (117 commuters, 15.5%), and 20 to 24 minutes (110 commuters, 14.5%).
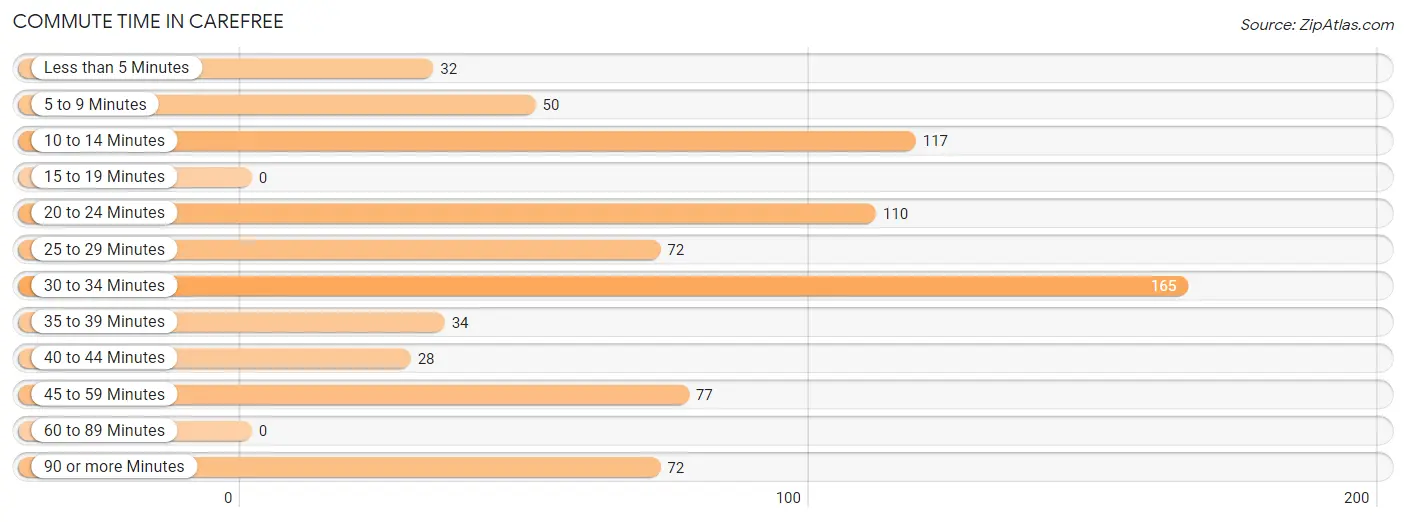
| Commute Time | # Commuters | % Commuters |
| Less than 5 Minutes | 32 | 4.2% |
| 5 to 9 Minutes | 50 | 6.6% |
| 10 to 14 Minutes | 117 | 15.5% |
| 15 to 19 Minutes | 0 | 0.0% |
| 20 to 24 Minutes | 110 | 14.5% |
| 25 to 29 Minutes | 72 | 9.5% |
| 30 to 34 Minutes | 165 | 21.8% |
| 35 to 39 Minutes | 34 | 4.5% |
| 40 to 44 Minutes | 28 | 3.7% |
| 45 to 59 Minutes | 77 | 10.2% |
| 60 to 89 Minutes | 0 | 0.0% |
| 90 or more Minutes | 72 | 9.5% |
Commute Time by Sex in Carefree
The most common commute times in Carefree are 30 to 34 minutes (104 commuters, 33.7%) for males and 10 to 14 minutes (97 commuters, 21.6%) for females.
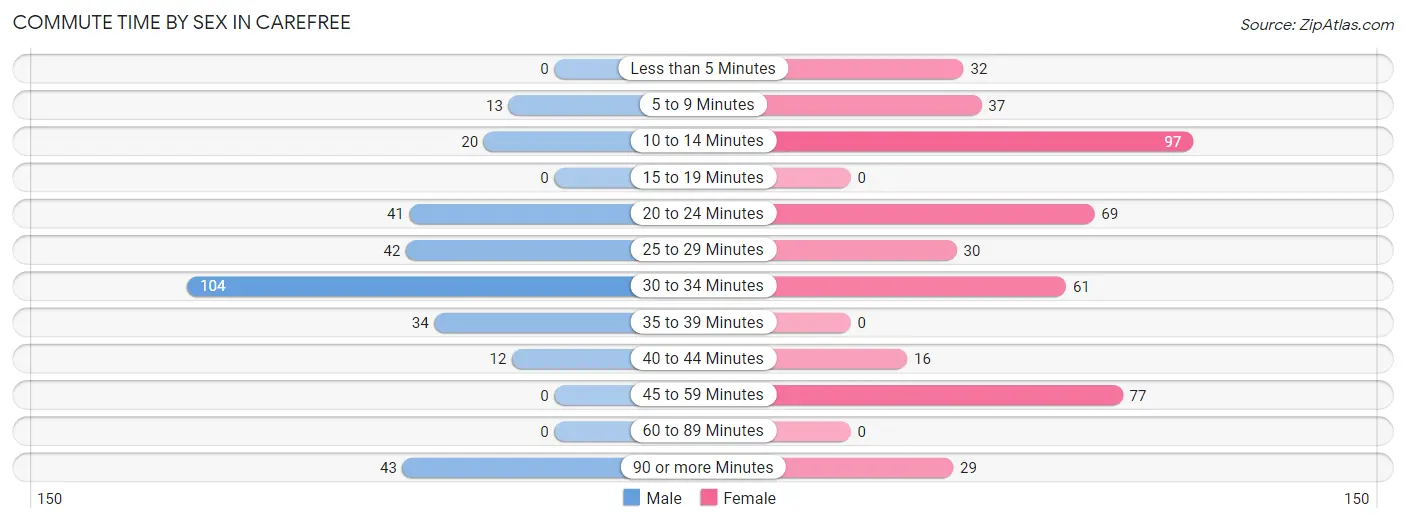
| Commute Time | Male | Female |
| Less than 5 Minutes | 0 (0.0%) | 32 (7.1%) |
| 5 to 9 Minutes | 13 (4.2%) | 37 (8.3%) |
| 10 to 14 Minutes | 20 (6.5%) | 97 (21.6%) |
| 15 to 19 Minutes | 0 (0.0%) | 0 (0.0%) |
| 20 to 24 Minutes | 41 (13.3%) | 69 (15.4%) |
| 25 to 29 Minutes | 42 (13.6%) | 30 (6.7%) |
| 30 to 34 Minutes | 104 (33.7%) | 61 (13.6%) |
| 35 to 39 Minutes | 34 (11.0%) | 0 (0.0%) |
| 40 to 44 Minutes | 12 (3.9%) | 16 (3.6%) |
| 45 to 59 Minutes | 0 (0.0%) | 77 (17.2%) |
| 60 to 89 Minutes | 0 (0.0%) | 0 (0.0%) |
| 90 or more Minutes | 43 (13.9%) | 29 (6.5%) |
Time of Departure to Work by Sex in Carefree
The most frequent times of departure to work in Carefree are 7:00 AM to 7:29 AM (74, 23.9%) for males and 7:00 AM to 7:29 AM (126, 28.1%) for females.
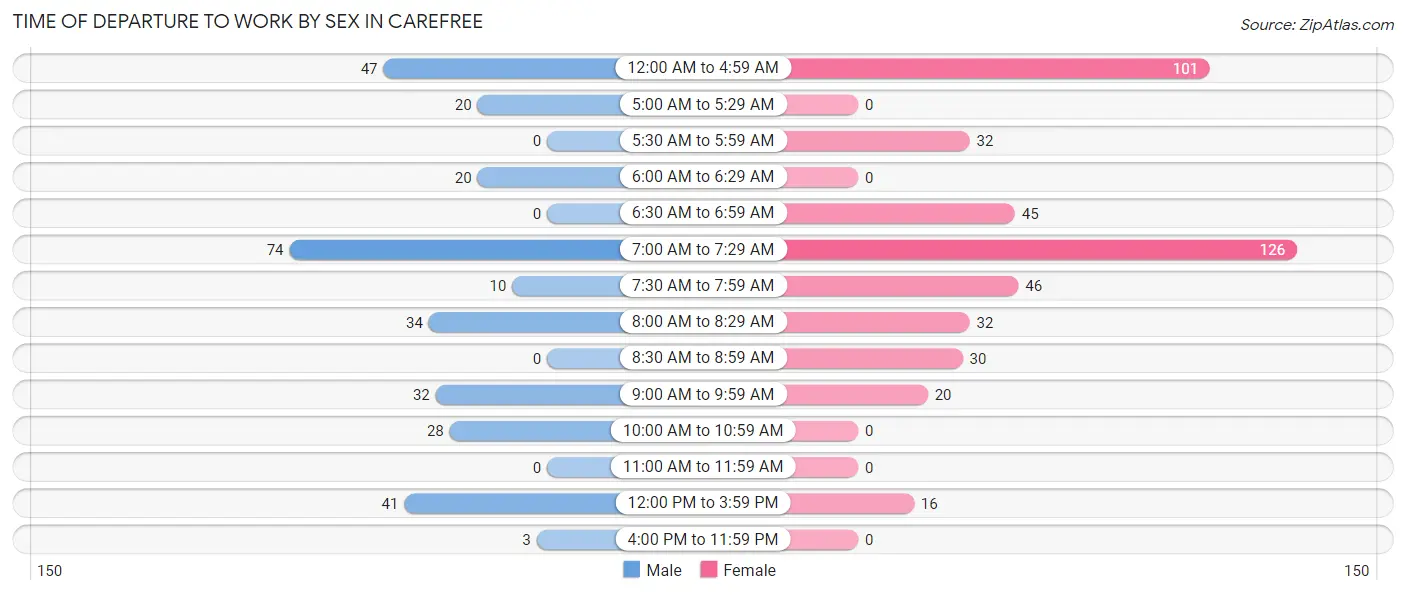
| Time of Departure | Male | Female |
| 12:00 AM to 4:59 AM | 47 (15.2%) | 101 (22.5%) |
| 5:00 AM to 5:29 AM | 20 (6.5%) | 0 (0.0%) |
| 5:30 AM to 5:59 AM | 0 (0.0%) | 32 (7.1%) |
| 6:00 AM to 6:29 AM | 20 (6.5%) | 0 (0.0%) |
| 6:30 AM to 6:59 AM | 0 (0.0%) | 45 (10.0%) |
| 7:00 AM to 7:29 AM | 74 (23.9%) | 126 (28.1%) |
| 7:30 AM to 7:59 AM | 10 (3.2%) | 46 (10.3%) |
| 8:00 AM to 8:29 AM | 34 (11.0%) | 32 (7.1%) |
| 8:30 AM to 8:59 AM | 0 (0.0%) | 30 (6.7%) |
| 9:00 AM to 9:59 AM | 32 (10.4%) | 20 (4.5%) |
| 10:00 AM to 10:59 AM | 28 (9.1%) | 0 (0.0%) |
| 11:00 AM to 11:59 AM | 0 (0.0%) | 0 (0.0%) |
| 12:00 PM to 3:59 PM | 41 (13.3%) | 16 (3.6%) |
| 4:00 PM to 11:59 PM | 3 (1.0%) | 0 (0.0%) |
| Total | 309 (100.0%) | 448 (100.0%) |
Housing Occupancy in Carefree
Occupancy by Ownership in Carefree
Of the total 1,918 dwellings in Carefree, owner-occupied units account for 1,692 (88.2%), while renter-occupied units make up 226 (11.8%).
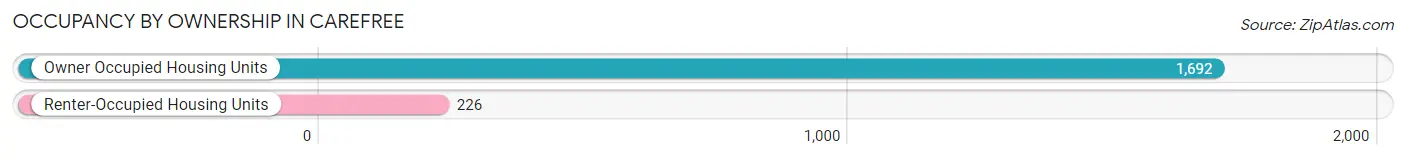
| Occupancy | # Housing Units | % Housing Units |
| Owner Occupied Housing Units | 1,692 | 88.2% |
| Renter-Occupied Housing Units | 226 | 11.8% |
| Total Occupied Housing Units | 1,918 | 100.0% |
Occupancy by Household Size in Carefree
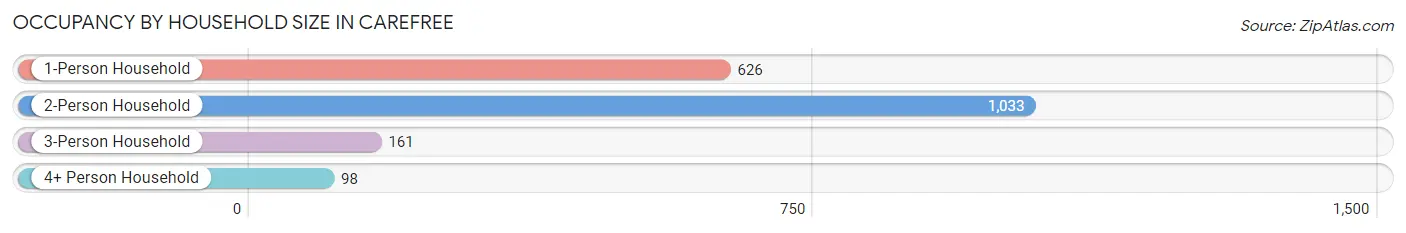
| Household Size | # Housing Units | % Housing Units |
| 1-Person Household | 626 | 32.6% |
| 2-Person Household | 1,033 | 53.9% |
| 3-Person Household | 161 | 8.4% |
| 4+ Person Household | 98 | 5.1% |
| Total Housing Units | 1,918 | 100.0% |
Occupancy by Ownership by Household Size in Carefree
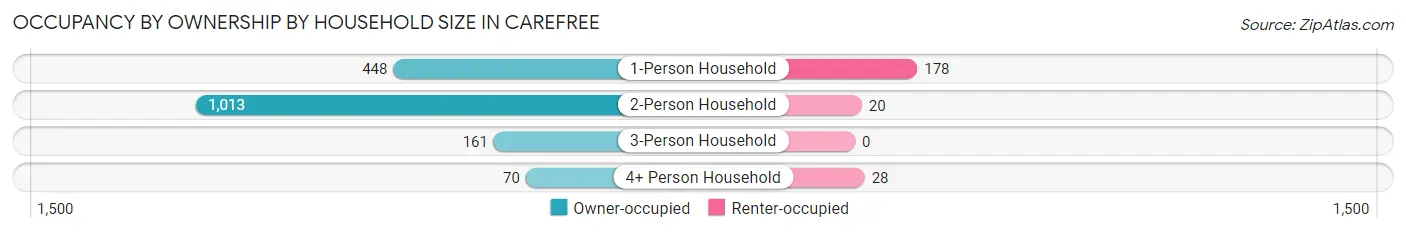
| Household Size | Owner-occupied | Renter-occupied |
| 1-Person Household | 448 (71.6%) | 178 (28.4%) |
| 2-Person Household | 1,013 (98.1%) | 20 (1.9%) |
| 3-Person Household | 161 (100.0%) | 0 (0.0%) |
| 4+ Person Household | 70 (71.4%) | 28 (28.6%) |
| Total Housing Units | 1,692 (88.2%) | 226 (11.8%) |
Occupancy by Educational Attainment in Carefree
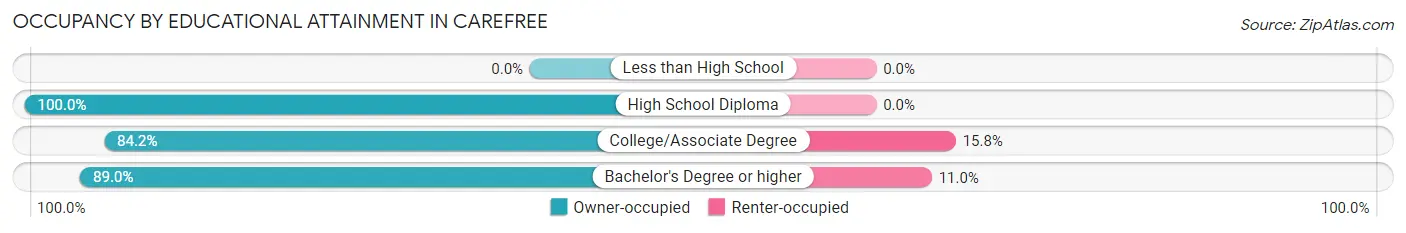
| Household Size | Owner-occupied | Renter-occupied |
| Less than High School | 0 (0.0%) | 0 (0.0%) |
| High School Diploma | 156 (100.0%) | 0 (0.0%) |
| College/Associate Degree | 566 (84.2%) | 106 (15.8%) |
| Bachelor's Degree or higher | 970 (89.0%) | 120 (11.0%) |
Occupancy by Age of Householder in Carefree
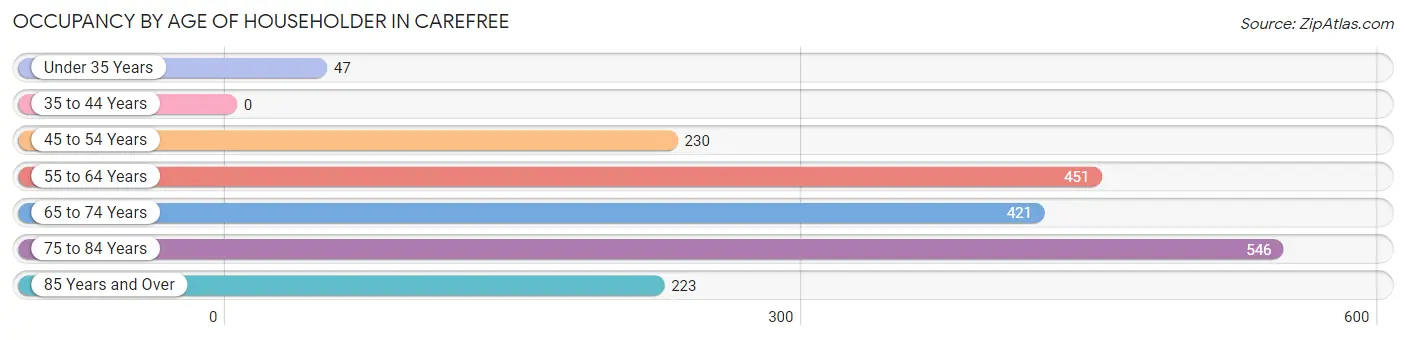
| Age Bracket | # Households | % Households |
| Under 35 Years | 47 | 2.5% |
| 35 to 44 Years | 0 | 0.0% |
| 45 to 54 Years | 230 | 12.0% |
| 55 to 64 Years | 451 | 23.5% |
| 65 to 74 Years | 421 | 22.0% |
| 75 to 84 Years | 546 | 28.5% |
| 85 Years and Over | 223 | 11.6% |
| Total | 1,918 | 100.0% |
Housing Finances in Carefree
Median Income by Occupancy in Carefree
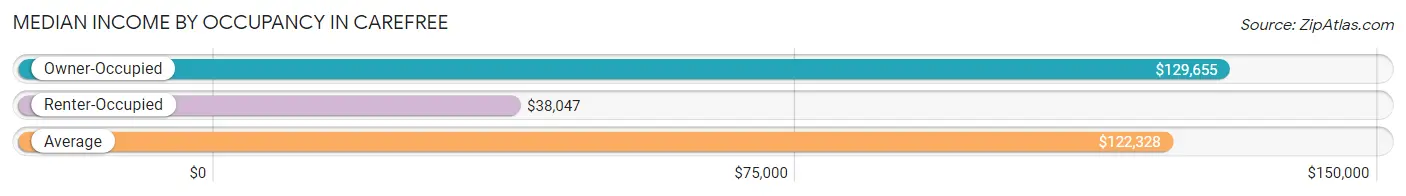
| Occupancy Type | # Households | Median Income |
| Owner-Occupied | 1,692 (88.2%) | $129,655 |
| Renter-Occupied | 226 (11.8%) | $38,047 |
| Average | 1,918 (100.0%) | $122,328 |
Occupancy by Householder Income Bracket in Carefree
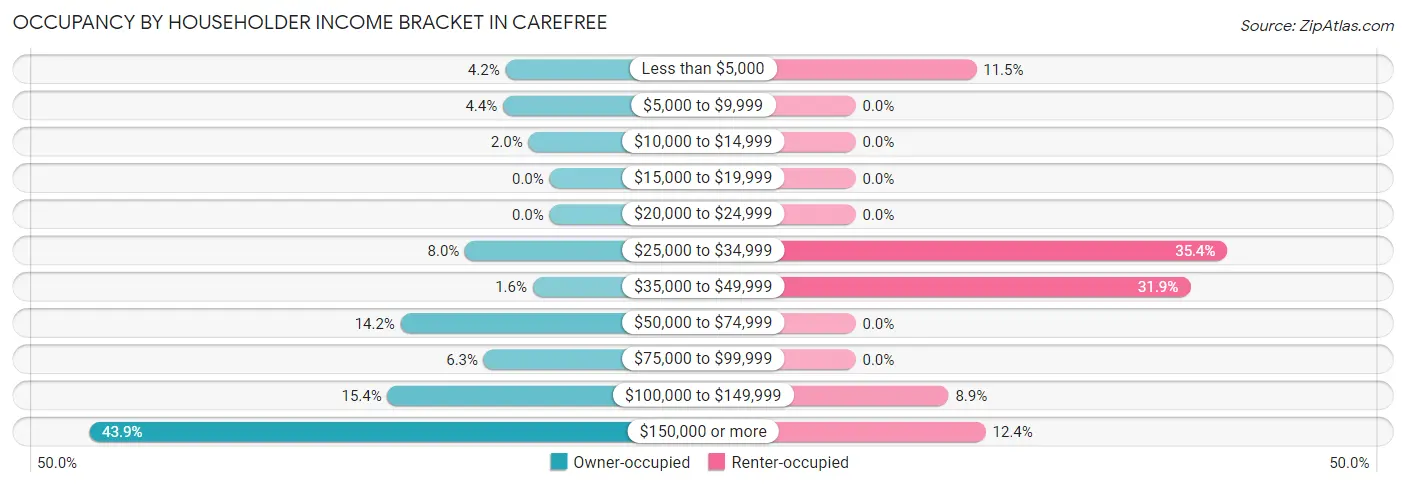
| Income Bracket | Owner-occupied | Renter-occupied |
| Less than $5,000 | 71 (4.2%) | 26 (11.5%) |
| $5,000 to $9,999 | 75 (4.4%) | 0 (0.0%) |
| $10,000 to $14,999 | 34 (2.0%) | 0 (0.0%) |
| $15,000 to $19,999 | 0 (0.0%) | 0 (0.0%) |
| $20,000 to $24,999 | 0 (0.0%) | 0 (0.0%) |
| $25,000 to $34,999 | 136 (8.0%) | 80 (35.4%) |
| $35,000 to $49,999 | 27 (1.6%) | 72 (31.9%) |
| $50,000 to $74,999 | 240 (14.2%) | 0 (0.0%) |
| $75,000 to $99,999 | 106 (6.3%) | 0 (0.0%) |
| $100,000 to $149,999 | 261 (15.4%) | 20 (8.8%) |
| $150,000 or more | 742 (43.9%) | 28 (12.4%) |
| Total | 1,692 (100.0%) | 226 (100.0%) |
Monthly Housing Cost Tiers in Carefree
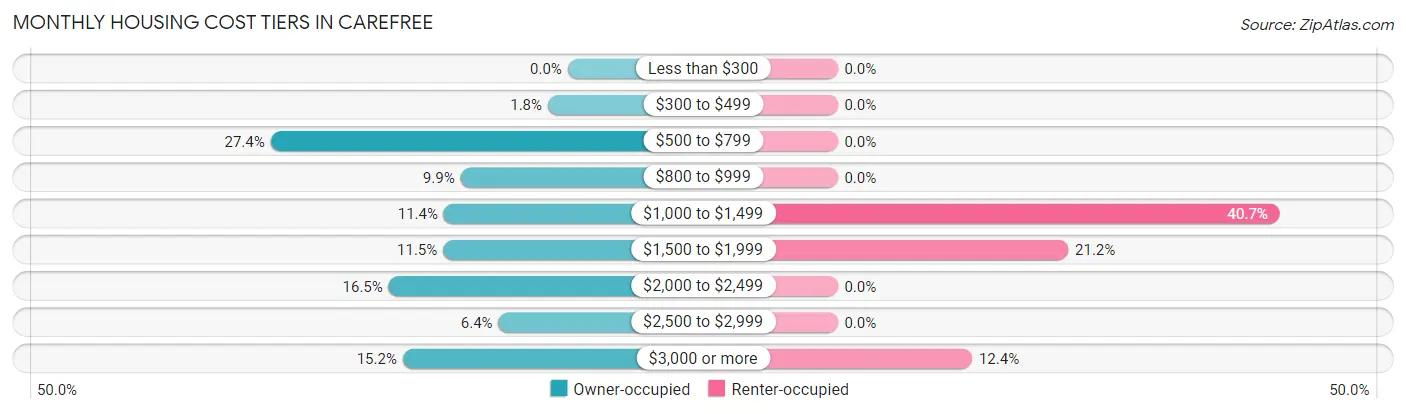
| Monthly Cost | Owner-occupied | Renter-occupied |
| Less than $300 | 0 (0.0%) | 0 (0.0%) |
| $300 to $499 | 31 (1.8%) | 0 (0.0%) |
| $500 to $799 | 463 (27.4%) | 0 (0.0%) |
| $800 to $999 | 167 (9.9%) | 0 (0.0%) |
| $1,000 to $1,499 | 193 (11.4%) | 92 (40.7%) |
| $1,500 to $1,999 | 194 (11.5%) | 48 (21.2%) |
| $2,000 to $2,499 | 279 (16.5%) | 0 (0.0%) |
| $2,500 to $2,999 | 108 (6.4%) | 0 (0.0%) |
| $3,000 or more | 257 (15.2%) | 28 (12.4%) |
| Total | 1,692 (100.0%) | 226 (100.0%) |
Physical Housing Characteristics in Carefree
Housing Structures in Carefree
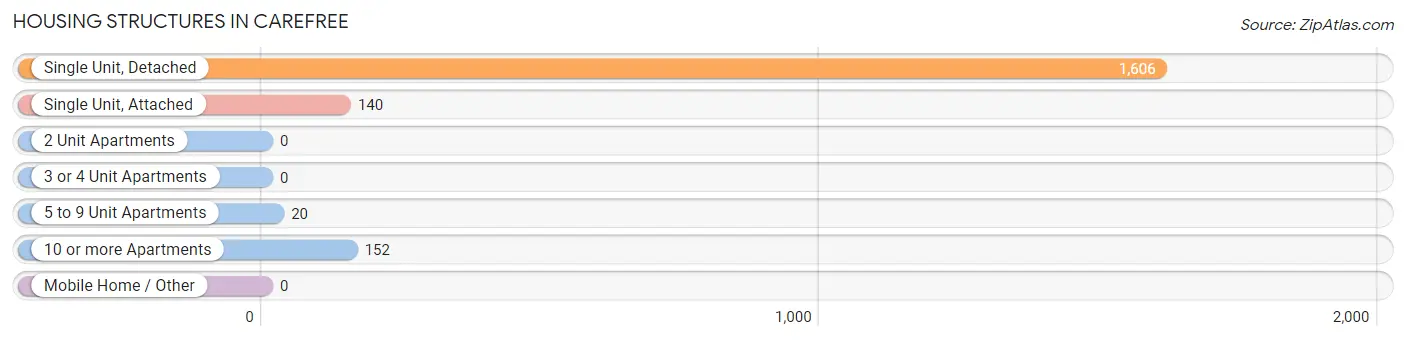
| Structure Type | # Housing Units | % Housing Units |
| Single Unit, Detached | 1,606 | 83.7% |
| Single Unit, Attached | 140 | 7.3% |
| 2 Unit Apartments | 0 | 0.0% |
| 3 or 4 Unit Apartments | 0 | 0.0% |
| 5 to 9 Unit Apartments | 20 | 1.0% |
| 10 or more Apartments | 152 | 7.9% |
| Mobile Home / Other | 0 | 0.0% |
| Total | 1,918 | 100.0% |
Housing Structures by Occupancy in Carefree
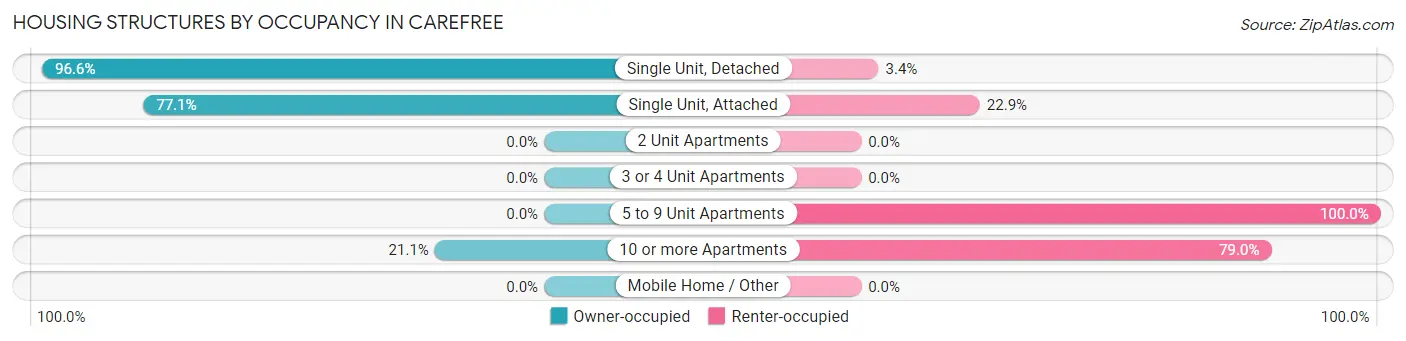
| Structure Type | Owner-occupied | Renter-occupied |
| Single Unit, Detached | 1,552 (96.6%) | 54 (3.4%) |
| Single Unit, Attached | 108 (77.1%) | 32 (22.9%) |
| 2 Unit Apartments | 0 (0.0%) | 0 (0.0%) |
| 3 or 4 Unit Apartments | 0 (0.0%) | 0 (0.0%) |
| 5 to 9 Unit Apartments | 0 (0.0%) | 20 (100.0%) |
| 10 or more Apartments | 32 (21.0%) | 120 (78.9%) |
| Mobile Home / Other | 0 (0.0%) | 0 (0.0%) |
| Total | 1,692 (88.2%) | 226 (11.8%) |
Housing Structures by Number of Rooms in Carefree
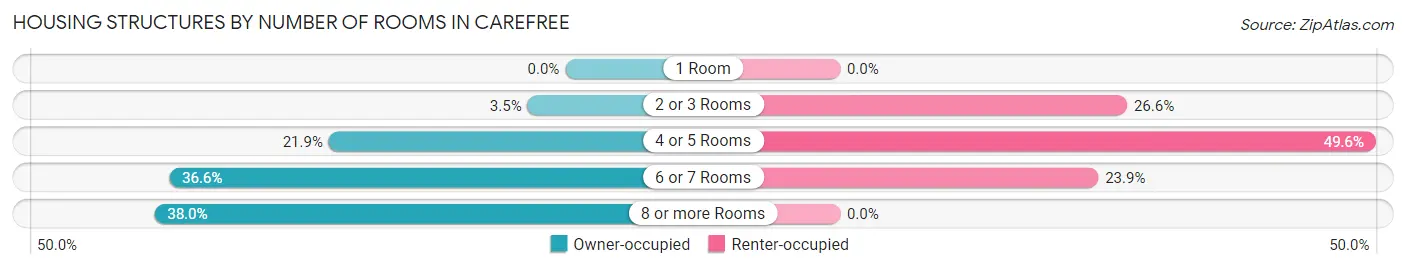
| Number of Rooms | Owner-occupied | Renter-occupied |
| 1 Room | 0 (0.0%) | 0 (0.0%) |
| 2 or 3 Rooms | 59 (3.5%) | 60 (26.6%) |
| 4 or 5 Rooms | 370 (21.9%) | 112 (49.6%) |
| 6 or 7 Rooms | 620 (36.6%) | 54 (23.9%) |
| 8 or more Rooms | 643 (38.0%) | 0 (0.0%) |
| Total | 1,692 (100.0%) | 226 (100.0%) |
Housing Structure by Heating Type in Carefree
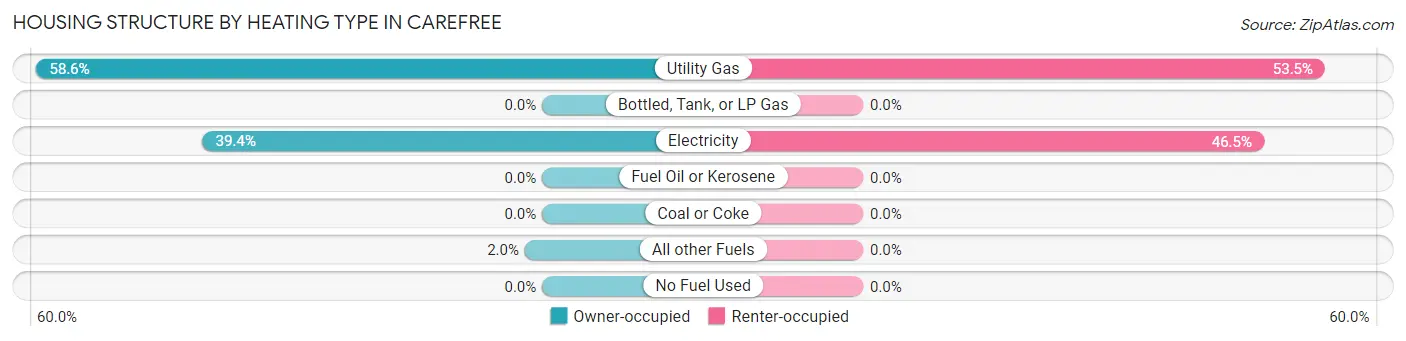
| Heating Type | Owner-occupied | Renter-occupied |
| Utility Gas | 992 (58.6%) | 121 (53.5%) |
| Bottled, Tank, or LP Gas | 0 (0.0%) | 0 (0.0%) |
| Electricity | 666 (39.4%) | 105 (46.5%) |
| Fuel Oil or Kerosene | 0 (0.0%) | 0 (0.0%) |
| Coal or Coke | 0 (0.0%) | 0 (0.0%) |
| All other Fuels | 34 (2.0%) | 0 (0.0%) |
| No Fuel Used | 0 (0.0%) | 0 (0.0%) |
| Total | 1,692 (100.0%) | 226 (100.0%) |
Household Vehicle Usage in Carefree
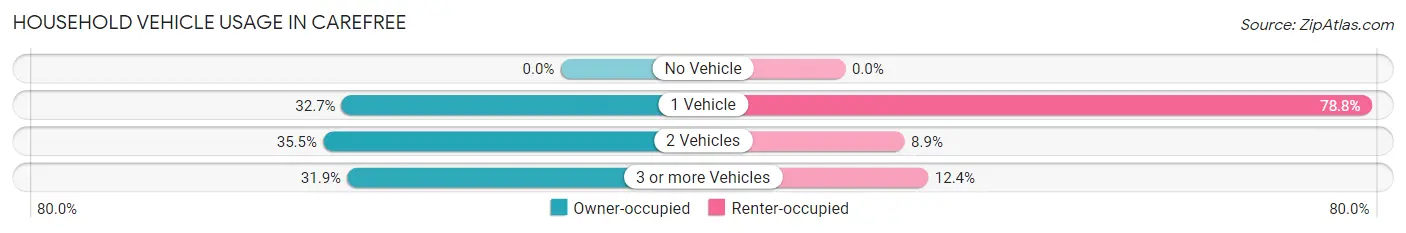
| Vehicles per Household | Owner-occupied | Renter-occupied |
| No Vehicle | 0 (0.0%) | 0 (0.0%) |
| 1 Vehicle | 553 (32.7%) | 178 (78.8%) |
| 2 Vehicles | 600 (35.5%) | 20 (8.8%) |
| 3 or more Vehicles | 539 (31.9%) | 28 (12.4%) |
| Total | 1,692 (100.0%) | 226 (100.0%) |
Real Estate & Mortgages in Carefree
Real Estate and Mortgage Overview in Carefree
| Characteristic | Without Mortgage | With Mortgage |
| Housing Units | 868 | 824 |
| Median Property Value | $1,009,200 | $1,009,000 |
| Median Household Income | $76,932 | $452 |
| Monthly Housing Costs | $768 | $257 |
| Real Estate Taxes | $2,807 | $0 |
Property Value by Mortgage Status in Carefree
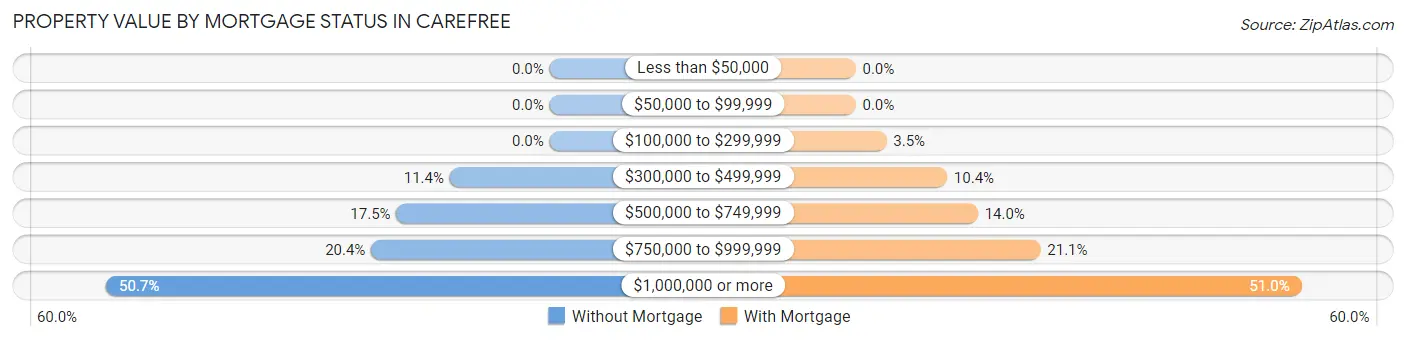
| Property Value | Without Mortgage | With Mortgage |
| Less than $50,000 | 0 (0.0%) | 0 (0.0%) |
| $50,000 to $99,999 | 0 (0.0%) | 0 (0.0%) |
| $100,000 to $299,999 | 0 (0.0%) | 29 (3.5%) |
| $300,000 to $499,999 | 99 (11.4%) | 86 (10.4%) |
| $500,000 to $749,999 | 152 (17.5%) | 115 (14.0%) |
| $750,000 to $999,999 | 177 (20.4%) | 174 (21.1%) |
| $1,000,000 or more | 440 (50.7%) | 420 (51.0%) |
| Total | 868 (100.0%) | 824 (100.0%) |
Household Income by Mortgage Status in Carefree
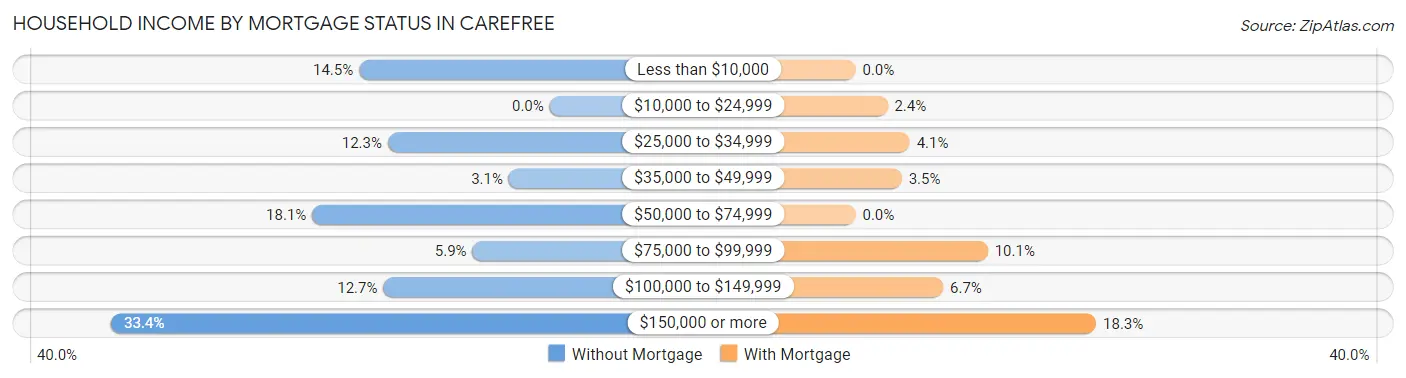
| Household Income | Without Mortgage | With Mortgage |
| Less than $10,000 | 126 (14.5%) | 0 (0.0%) |
| $10,000 to $24,999 | 0 (0.0%) | 20 (2.4%) |
| $25,000 to $34,999 | 107 (12.3%) | 34 (4.1%) |
| $35,000 to $49,999 | 27 (3.1%) | 29 (3.5%) |
| $50,000 to $74,999 | 157 (18.1%) | 0 (0.0%) |
| $75,000 to $99,999 | 51 (5.9%) | 83 (10.1%) |
| $100,000 to $149,999 | 110 (12.7%) | 55 (6.7%) |
| $150,000 or more | 290 (33.4%) | 151 (18.3%) |
| Total | 868 (100.0%) | 824 (100.0%) |
Property Value to Household Income Ratio in Carefree
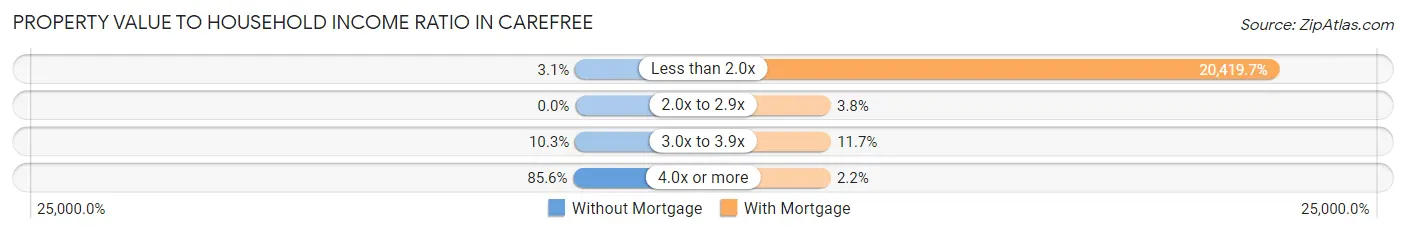
| Value-to-Income Ratio | Without Mortgage | With Mortgage |
| Less than 2.0x | 27 (3.1%) | 168,258 (20,419.7%) |
| 2.0x to 2.9x | 0 (0.0%) | 31 (3.8%) |
| 3.0x to 3.9x | 89 (10.2%) | 96 (11.7%) |
| 4.0x or more | 743 (85.6%) | 18 (2.2%) |
| Total | 868 (100.0%) | 824 (100.0%) |
Real Estate Taxes by Mortgage Status in Carefree
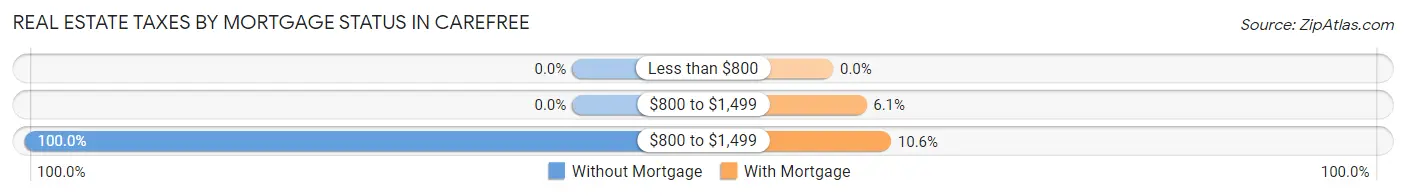
| Property Taxes | Without Mortgage | With Mortgage |
| Less than $800 | 0 (0.0%) | 0 (0.0%) |
| $800 to $1,499 | 0 (0.0%) | 50 (6.1%) |
| $800 to $1,499 | 868 (100.0%) | 87 (10.6%) |
| Total | 868 (100.0%) | 824 (100.0%) |
Health & Disability in Carefree
Health Insurance Coverage by Age in Carefree
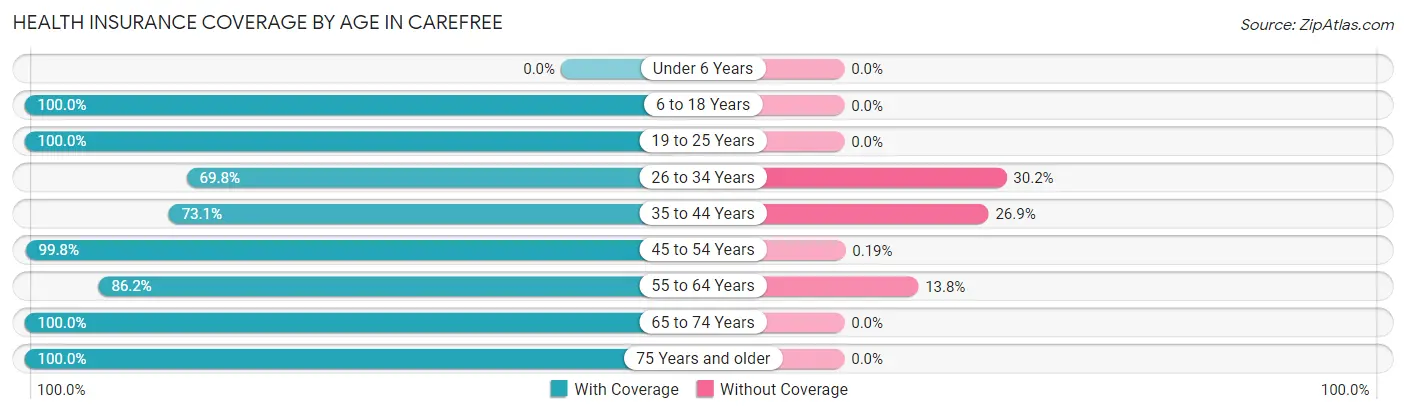
| Age Bracket | With Coverage | Without Coverage |
| Under 6 Years | 0 (0.0%) | 0 (0.0%) |
| 6 to 18 Years | 186 (100.0%) | 0 (0.0%) |
| 19 to 25 Years | 96 (100.0%) | 0 (0.0%) |
| 26 to 34 Years | 60 (69.8%) | 26 (30.2%) |
| 35 to 44 Years | 87 (73.1%) | 32 (26.9%) |
| 45 to 54 Years | 518 (99.8%) | 1 (0.2%) |
| 55 to 64 Years | 688 (86.2%) | 110 (13.8%) |
| 65 to 74 Years | 681 (100.0%) | 0 (0.0%) |
| 75 Years and older | 1,115 (100.0%) | 0 (0.0%) |
| Total | 3,431 (95.3%) | 169 (4.7%) |
Health Insurance Coverage by Citizenship Status in Carefree
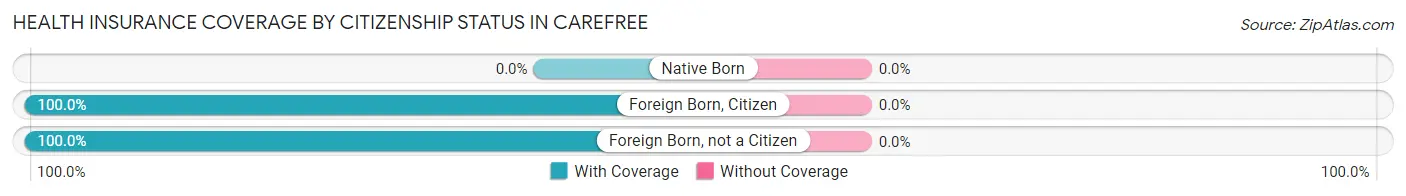
| Citizenship Status | With Coverage | Without Coverage |
| Native Born | 0 (0.0%) | 0 (0.0%) |
| Foreign Born, Citizen | 186 (100.0%) | 0 (0.0%) |
| Foreign Born, not a Citizen | 96 (100.0%) | 0 (0.0%) |
Health Insurance Coverage by Household Income in Carefree
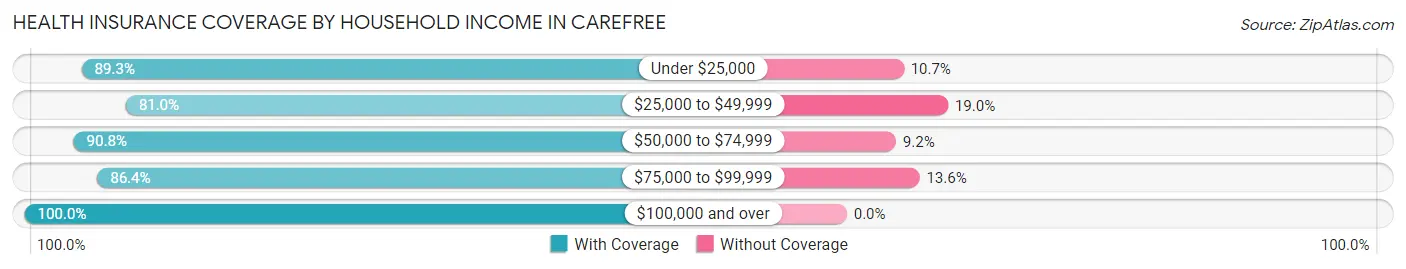
| Household Income | With Coverage | Without Coverage |
| Under $25,000 | 218 (89.3%) | 26 (10.7%) |
| $25,000 to $49,999 | 342 (81.0%) | 80 (19.0%) |
| $50,000 to $74,999 | 296 (90.8%) | 30 (9.2%) |
| $75,000 to $99,999 | 203 (86.4%) | 32 (13.6%) |
| $100,000 and over | 2,360 (100.0%) | 0 (0.0%) |
Public vs Private Health Insurance Coverage by Age in Carefree
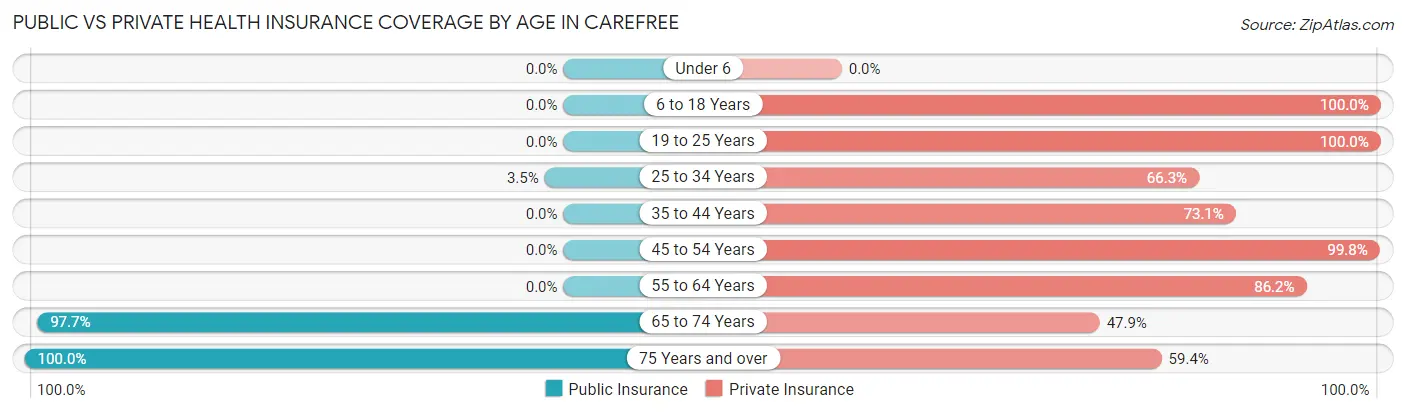
| Age Bracket | Public Insurance | Private Insurance |
| Under 6 | 0 (0.0%) | 0 (0.0%) |
| 6 to 18 Years | 0 (0.0%) | 186 (100.0%) |
| 19 to 25 Years | 0 (0.0%) | 96 (100.0%) |
| 25 to 34 Years | 3 (3.5%) | 57 (66.3%) |
| 35 to 44 Years | 0 (0.0%) | 87 (73.1%) |
| 45 to 54 Years | 0 (0.0%) | 518 (99.8%) |
| 55 to 64 Years | 0 (0.0%) | 688 (86.2%) |
| 65 to 74 Years | 665 (97.7%) | 326 (47.9%) |
| 75 Years and over | 1,115 (100.0%) | 662 (59.4%) |
| Total | 1,783 (49.5%) | 2,620 (72.8%) |
Disability Status by Sex by Age in Carefree
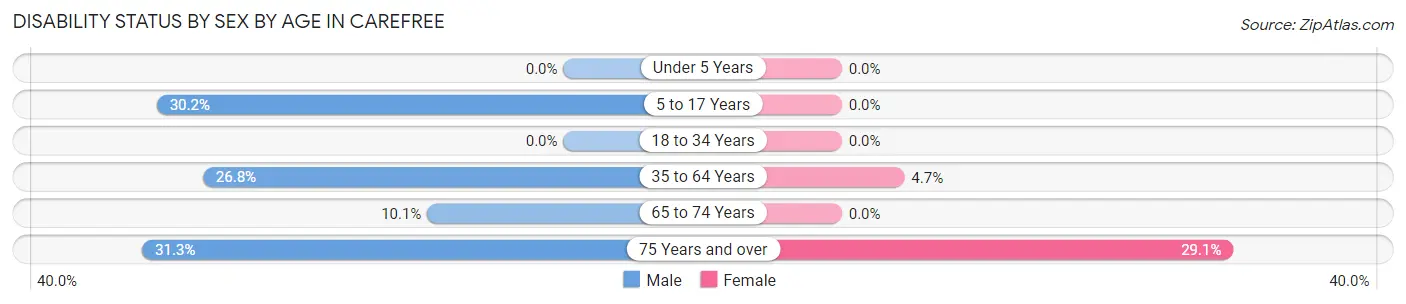
| Age Bracket | Male | Female |
| Under 5 Years | 0 (0.0%) | 0 (0.0%) |
| 5 to 17 Years | 16 (30.2%) | 0 (0.0%) |
| 18 to 34 Years | 0 (0.0%) | 0 (0.0%) |
| 35 to 64 Years | 137 (26.8%) | 43 (4.6%) |
| 65 to 74 Years | 45 (10.1%) | 0 (0.0%) |
| 75 Years and over | 183 (31.3%) | 154 (29.1%) |
Disability Class by Sex by Age in Carefree
Disability Class: Hearing Difficulty
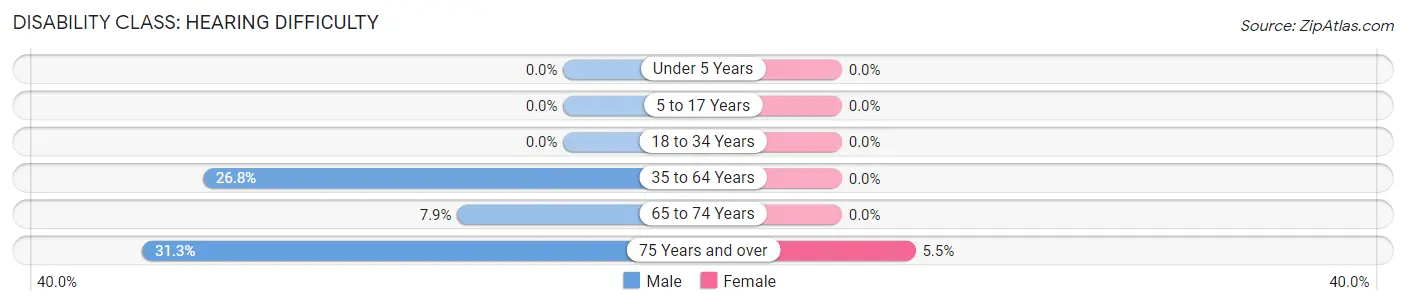
| Age Bracket | Male | Female |
| Under 5 Years | 0 (0.0%) | 0 (0.0%) |
| 5 to 17 Years | 0 (0.0%) | 0 (0.0%) |
| 18 to 34 Years | 0 (0.0%) | 0 (0.0%) |
| 35 to 64 Years | 137 (26.8%) | 0 (0.0%) |
| 65 to 74 Years | 35 (7.9%) | 0 (0.0%) |
| 75 Years and over | 183 (31.3%) | 29 (5.5%) |
Disability Class: Vision Difficulty
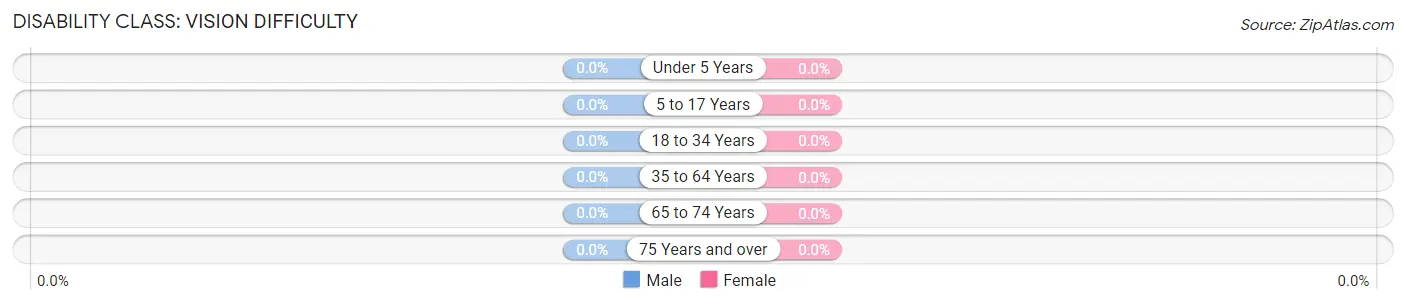
| Age Bracket | Male | Female |
| Under 5 Years | 0 (0.0%) | 0 (0.0%) |
| 5 to 17 Years | 0 (0.0%) | 0 (0.0%) |
| 18 to 34 Years | 0 (0.0%) | 0 (0.0%) |
| 35 to 64 Years | 0 (0.0%) | 0 (0.0%) |
| 65 to 74 Years | 0 (0.0%) | 0 (0.0%) |
| 75 Years and over | 0 (0.0%) | 0 (0.0%) |
Disability Class: Cognitive Difficulty
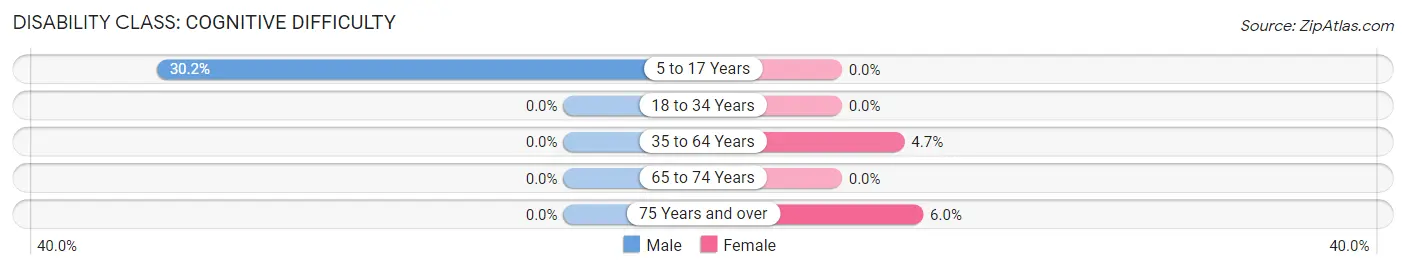
| Age Bracket | Male | Female |
| 5 to 17 Years | 16 (30.2%) | 0 (0.0%) |
| 18 to 34 Years | 0 (0.0%) | 0 (0.0%) |
| 35 to 64 Years | 0 (0.0%) | 43 (4.6%) |
| 65 to 74 Years | 0 (0.0%) | 0 (0.0%) |
| 75 Years and over | 0 (0.0%) | 32 (6.0%) |
Disability Class: Ambulatory Difficulty
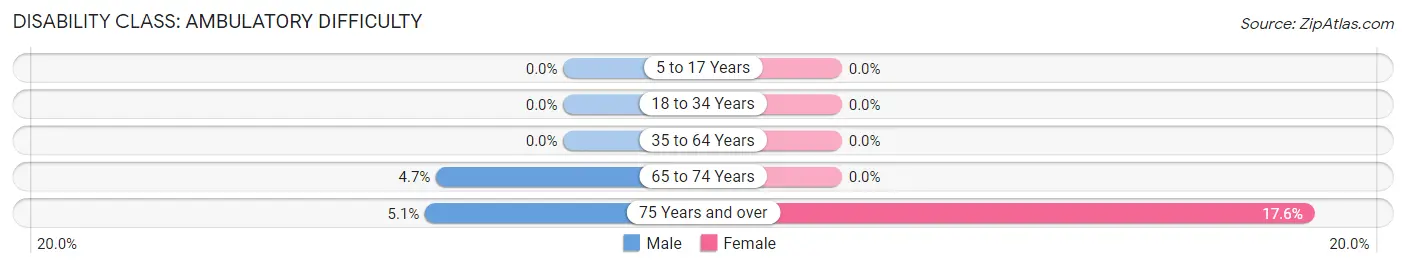
| Age Bracket | Male | Female |
| 5 to 17 Years | 0 (0.0%) | 0 (0.0%) |
| 18 to 34 Years | 0 (0.0%) | 0 (0.0%) |
| 35 to 64 Years | 0 (0.0%) | 0 (0.0%) |
| 65 to 74 Years | 21 (4.7%) | 0 (0.0%) |
| 75 Years and over | 30 (5.1%) | 93 (17.5%) |
Disability Class: Self-Care Difficulty
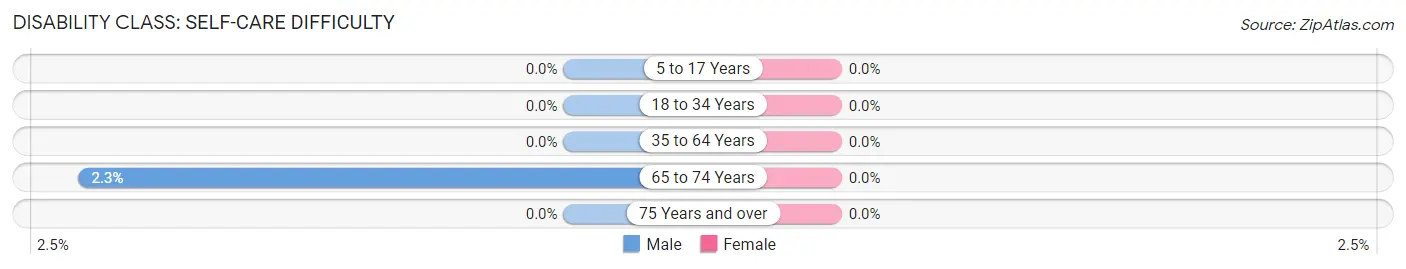
| Age Bracket | Male | Female |
| 5 to 17 Years | 0 (0.0%) | 0 (0.0%) |
| 18 to 34 Years | 0 (0.0%) | 0 (0.0%) |
| 35 to 64 Years | 0 (0.0%) | 0 (0.0%) |
| 65 to 74 Years | 10 (2.2%) | 0 (0.0%) |
| 75 Years and over | 0 (0.0%) | 0 (0.0%) |
Technology Access in Carefree
Computing Device Access in Carefree
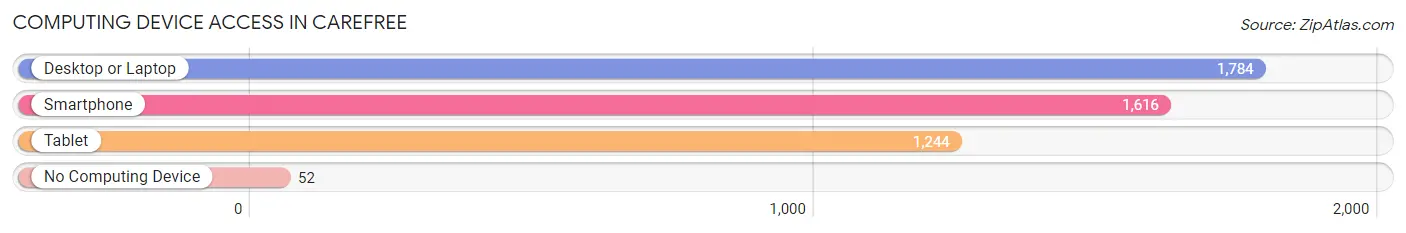
| Device Type | # Households | % Households |
| Desktop or Laptop | 1,784 | 93.0% |
| Smartphone | 1,616 | 84.3% |
| Tablet | 1,244 | 64.9% |
| No Computing Device | 52 | 2.7% |
| Total | 1,918 | 100.0% |
Internet Access in Carefree
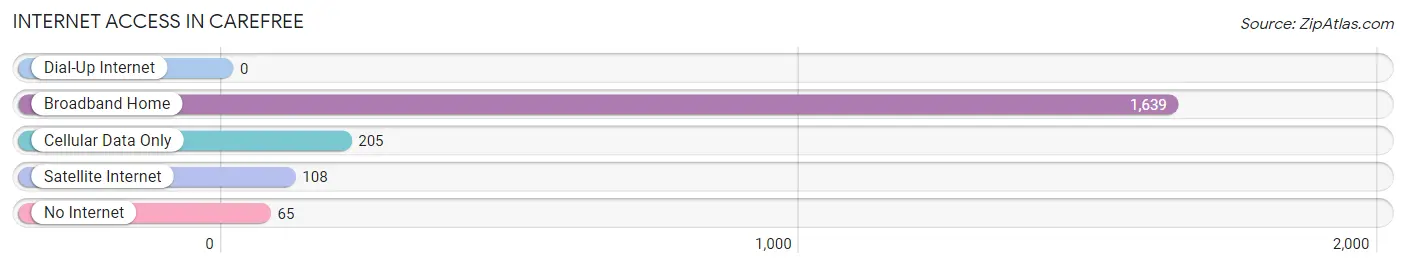
| Internet Type | # Households | % Households |
| Dial-Up Internet | 0 | 0.0% |
| Broadband Home | 1,639 | 85.5% |
| Cellular Data Only | 205 | 10.7% |
| Satellite Internet | 108 | 5.6% |
| No Internet | 65 | 3.4% |
| Total | 1,918 | 100.0% |
Carefree Summary
History
The area now known as Carefree, Arizona was first inhabited by the Hohokam people, who lived in the area from 300 BC to 1450 AD. The Hohokam were a semi-nomadic people who lived in small villages and farmed the land. They were known for their irrigation systems, which were used to water their crops.
In the late 1800s, the area was settled by ranchers and farmers, who built small ranches and farms. The area was known as “Rancho Carefree”, and the name stuck.
In the 1950s, the area was developed by a group of investors led by Tom Darlington. The group purchased the land and began to develop it into a residential community. The town was officially incorporated in 1984, and the name was changed to Carefree.
Geography
Carefree is located in the Sonoran Desert of central Arizona, about 30 miles north of Phoenix. The town is situated at an elevation of 2,400 feet, and is surrounded by the Tonto National Forest. The town is located in Maricopa County, and is bordered by Cave Creek to the east, and the town of Scottsdale to the south.
The town has a total area of 8.2 square miles, and is home to a variety of wildlife, including coyotes, bobcats, javelinas, and rattlesnakes. The town is also home to a variety of plants, including cacti, mesquite trees, and palo verde trees.
Economy
Carefree’s economy is largely based on tourism. The town is home to a variety of resorts, restaurants, and shops, which attract visitors from all over the world. The town is also home to a variety of art galleries, which showcase the work of local artists.
The town is also home to a variety of businesses, including a number of technology companies. The town is home to a number of software development companies, as well as a number of medical device companies.
Demographics
As of the 2010 census, the population of Carefree was 3,363. The town has a median age of 57.7 years, and a median household income of $77,917. The town is predominantly white (90.2%), with a small Hispanic population (4.2%).
Conclusion
Carefree, Arizona is a small town located in the Sonoran Desert of central Arizona. The town was first settled by ranchers and farmers in the late 1800s, and was officially incorporated in 1984. The town is largely based on tourism, and is home to a variety of resorts, restaurants, and shops. The town has a population of 3,363, and a median household income of $77,917. Carefree is a unique and vibrant community, and is a great place to live and visit.
Common Questions
What is Per Capita Income in Carefree?
Per Capita income in Carefree is $91,416.
What is the Median Family Income in Carefree?
Median Family Income in Carefree is $129,551.
What is the Median Household income in Carefree?
Median Household Income in Carefree is $122,328.
What is Income or Wage Gap in Carefree?
Income or Wage Gap in Carefree is 27.3%.
Women in Carefree earn 72.7 cents for every dollar earned by a man.
What is Inequality or Gini Index in Carefree?
Inequality or Gini Index in Carefree is 0.54.
What is the Total Population of Carefree?
Total Population of Carefree is 3,671.
What is the Total Male Population of Carefree?
Total Male Population of Carefree is 1,752.
What is the Total Female Population of Carefree?
Total Female Population of Carefree is 1,919.
What is the Ratio of Males per 100 Females in Carefree?
There are 91.30 Males per 100 Females in Carefree.
What is the Ratio of Females per 100 Males in Carefree?
There are 109.53 Females per 100 Males in Carefree.
What is the Median Population Age in Carefree?
Median Population Age in Carefree is 65.3 Years.
What is the Average Family Size in Carefree
Average Family Size in Carefree is 2.2 People.
What is the Average Household Size in Carefree
Average Household Size in Carefree is 1.9 People.
How Large is the Labor Force in Carefree?
There are 1,535 People in the Labor Forcein in Carefree.
What is the Percentage of People in the Labor Force in Carefree?
42.0% of People are in the Labor Force in Carefree.
What is the Unemployment Rate in Carefree?
Unemployment Rate in Carefree is 2.0%.