Central Heights Midland City, AZ Map & Demographics
Central Heights Midland City Map
Central Heights Midland City Overview
$25,821
PER CAPITA INCOME
$89,507
AVG FAMILY INCOME
$68,250
AVG HOUSEHOLD INCOME
58.7%
WAGE / INCOME GAP [ % ]
41.3¢/ $1
WAGE / INCOME GAP [ $ ]
$5,869
FAMILY INCOME DEFICIT
0.39
INEQUALITY / GINI INDEX
2,380
TOTAL POPULATION
1,183
MALE POPULATION
1,197
FEMALE POPULATION
98.83
MALES / 100 FEMALES
101.18
FEMALES / 100 MALES
41.3
MEDIAN AGE
3.1
AVG FAMILY SIZE
2.5
AVG HOUSEHOLD SIZE
947
LABOR FORCE [ PEOPLE ]
50.2%
PERCENT IN LABOR FORCE
10.6%
UNEMPLOYMENT RATE
Income in Central Heights Midland City
Income Overview in Central Heights Midland City
Per Capita Income in Central Heights Midland City is $25,821, while median incomes of families and households are $89,507 and $68,250 respectively.
| Characteristic | Number | Measure |
| Per Capita Income | 2,380 | $25,821 |
| Median Family Income | 588 | $89,507 |
| Mean Family Income | 588 | $82,174 |
| Median Household Income | 939 | $68,250 |
| Mean Household Income | 939 | $69,825 |
| Income Deficit | 588 | $5,869 |
| Wage / Income Gap (%) | 2,380 | 58.69% |
| Wage / Income Gap ($) | 2,380 | 41.31¢ per $1 |
| Gini / Inequality Index | 2,380 | 0.39 |
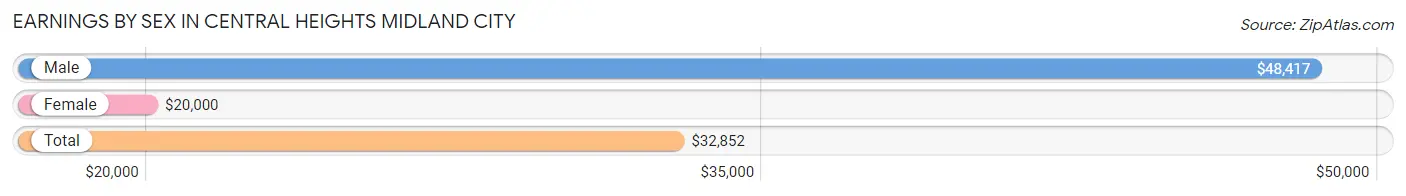
Earnings by Sex in Central Heights Midland City
Average Earnings in Central Heights Midland City are $32,852, $48,417 for men and $20,000 for women, a difference of 58.7%.
| Sex | Number | Average Earnings |
| Male | 575 (57.1%) | $48,417 |
| Female | 432 (42.9%) | $20,000 |
| Total | 1,007 (100.0%) | $32,852 |
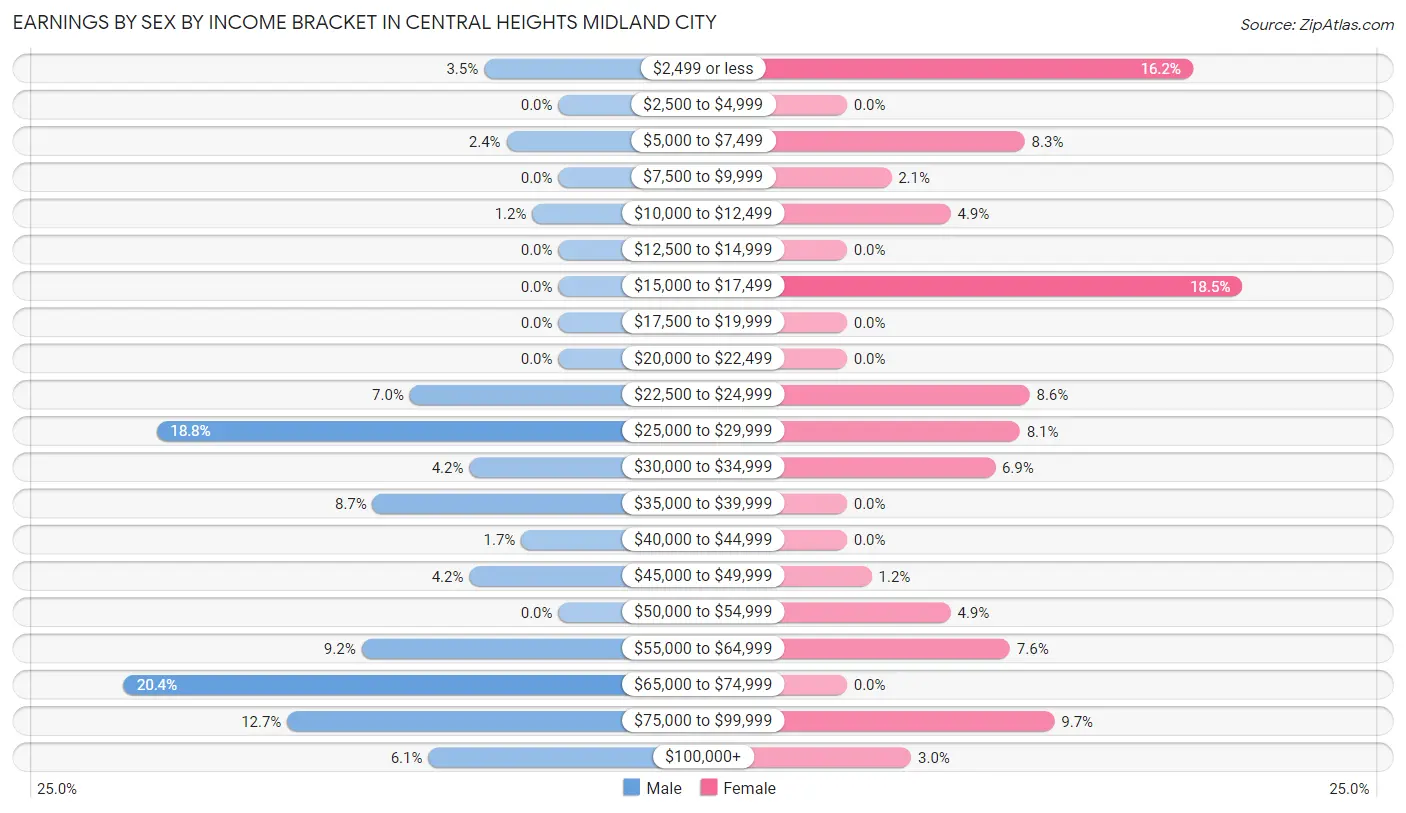
Earnings by Sex by Income Bracket in Central Heights Midland City
The most common earnings brackets in Central Heights Midland City are $65,000 to $74,999 for men (117 | 20.3%) and $15,000 to $17,499 for women (80 | 18.5%).
| Income | Male | Female |
| $2,499 or less | 20 (3.5%) | 70 (16.2%) |
| $2,500 to $4,999 | 0 (0.0%) | 0 (0.0%) |
| $5,000 to $7,499 | 14 (2.4%) | 36 (8.3%) |
| $7,500 to $9,999 | 0 (0.0%) | 9 (2.1%) |
| $10,000 to $12,499 | 7 (1.2%) | 21 (4.9%) |
| $12,500 to $14,999 | 0 (0.0%) | 0 (0.0%) |
| $15,000 to $17,499 | 0 (0.0%) | 80 (18.5%) |
| $17,500 to $19,999 | 0 (0.0%) | 0 (0.0%) |
| $20,000 to $22,499 | 0 (0.0%) | 0 (0.0%) |
| $22,500 to $24,999 | 40 (7.0%) | 37 (8.6%) |
| $25,000 to $29,999 | 108 (18.8%) | 35 (8.1%) |
| $30,000 to $34,999 | 24 (4.2%) | 30 (6.9%) |
| $35,000 to $39,999 | 50 (8.7%) | 0 (0.0%) |
| $40,000 to $44,999 | 10 (1.7%) | 0 (0.0%) |
| $45,000 to $49,999 | 24 (4.2%) | 5 (1.2%) |
| $50,000 to $54,999 | 0 (0.0%) | 21 (4.9%) |
| $55,000 to $64,999 | 53 (9.2%) | 33 (7.6%) |
| $65,000 to $74,999 | 117 (20.3%) | 0 (0.0%) |
| $75,000 to $99,999 | 73 (12.7%) | 42 (9.7%) |
| $100,000+ | 35 (6.1%) | 13 (3.0%) |
| Total | 575 (100.0%) | 432 (100.0%) |
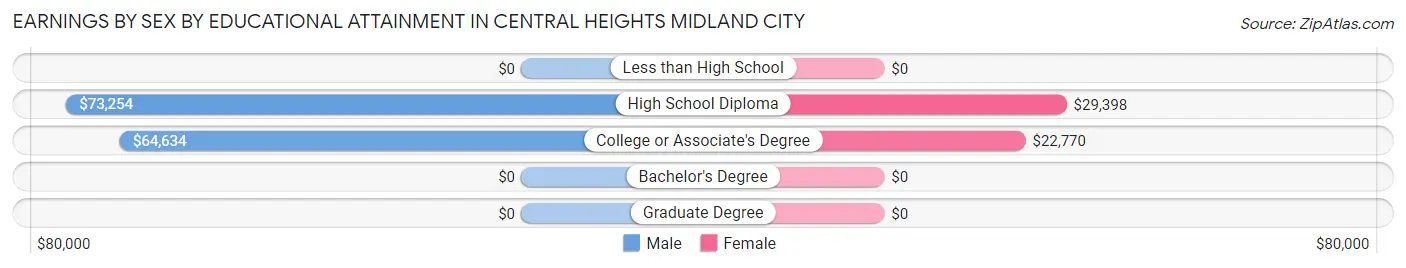
Earnings by Sex by Educational Attainment in Central Heights Midland City
Average earnings in Central Heights Midland City are $64,543 for men and $23,716 for women, a difference of 63.3%. Men with an educational attainment of high school diploma enjoy the highest average annual earnings of $73,254, while those with college or associate's degree education earn the least with $64,634. Women with an educational attainment of high school diploma earn the most with the average annual earnings of $29,398, while those with college or associate's degree education have the smallest earnings of $22,770.
| Educational Attainment | Male Income | Female Income |
| Less than High School | - | - |
| High School Diploma | $73,254 | $29,398 |
| College or Associate's Degree | $64,634 | $22,770 |
| Bachelor's Degree | - | - |
| Graduate Degree | - | - |
| Total | $64,543 | $23,716 |
Family Income in Central Heights Midland City
Family Income Brackets in Central Heights Midland City
According to the Central Heights Midland City family income data, there are 183 families falling into the $75,000 to $99,999 income range, which is the most common income bracket and makes up 31.1% of all families.
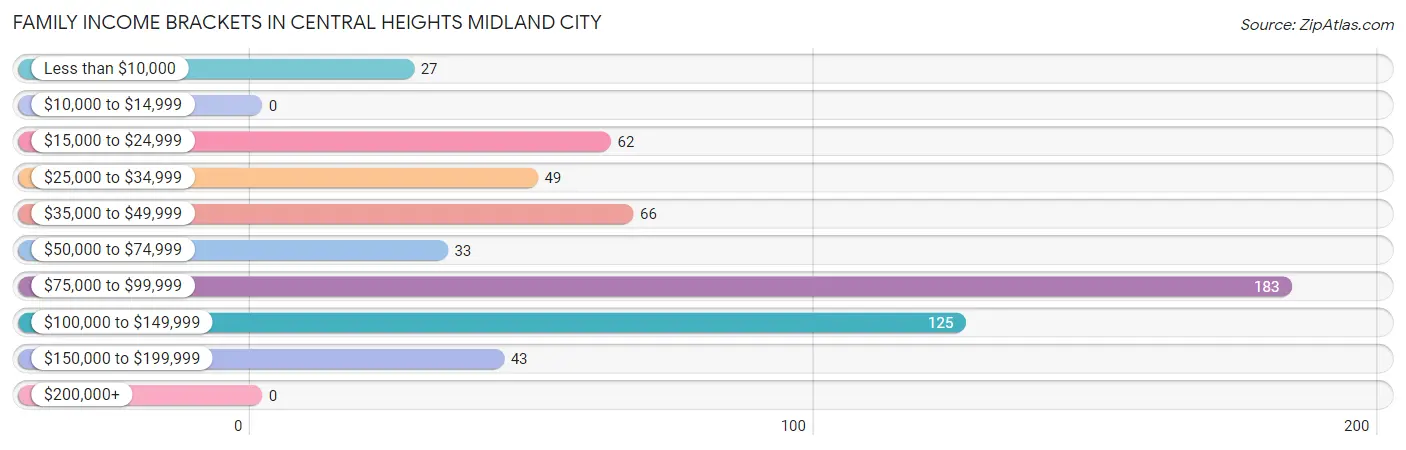
| Income Bracket | # Families | % Families |
| Less than $10,000 | 27 | 4.6% |
| $10,000 to $14,999 | 0 | 0.0% |
| $15,000 to $24,999 | 62 | 10.5% |
| $25,000 to $34,999 | 49 | 8.3% |
| $35,000 to $49,999 | 66 | 11.2% |
| $50,000 to $74,999 | 33 | 5.6% |
| $75,000 to $99,999 | 183 | 31.1% |
| $100,000 to $149,999 | 125 | 21.3% |
| $150,000 to $199,999 | 43 | 7.3% |
| $200,000+ | 0 | 0.0% |
Family Income by Famaliy Size in Central Heights Midland City
4-person families (40 | 6.8%) account for the highest median family income in Central Heights Midland City with $95,893 per family, while 4-person families (40 | 6.8%) have the highest median income of $23,973 per family member.
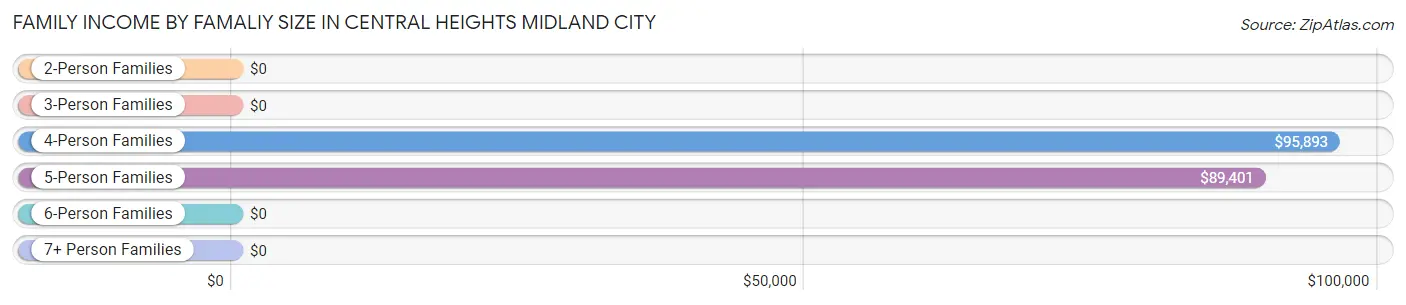
| Income Bracket | # Families | Median Income |
| 2-Person Families | 244 (41.5%) | $0 |
| 3-Person Families | 110 (18.7%) | $0 |
| 4-Person Families | 40 (6.8%) | $95,893 |
| 5-Person Families | 108 (18.4%) | $89,401 |
| 6-Person Families | 80 (13.6%) | $0 |
| 7+ Person Families | 6 (1.0%) | $0 |
| Total | 588 (100.0%) | $89,507 |
Family Income by Number of Earners in Central Heights Midland City
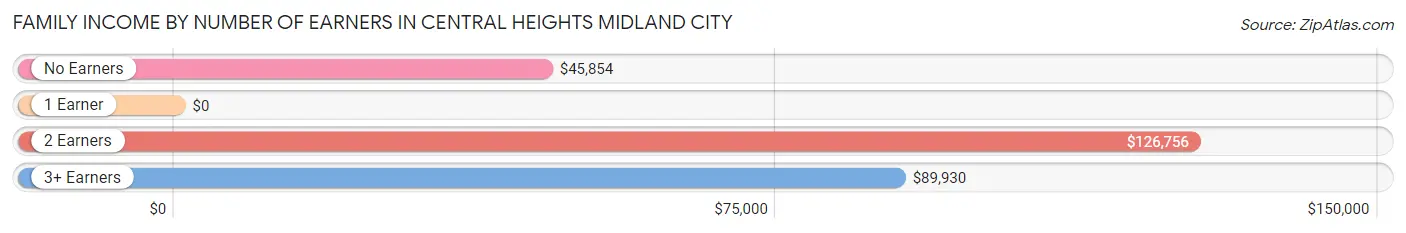
| Number of Earners | # Families | Median Income |
| No Earners | 159 (27.0%) | $45,854 |
| 1 Earner | 112 (19.1%) | $0 |
| 2 Earners | 179 (30.4%) | $126,756 |
| 3+ Earners | 138 (23.5%) | $89,930 |
| Total | 588 (100.0%) | $89,507 |
Household Income in Central Heights Midland City
Household Income Brackets in Central Heights Midland City
With 237 households falling in the category, the $75,000 to $99,999 income range is the most frequent in Central Heights Midland City, accounting for 25.2% of all households.
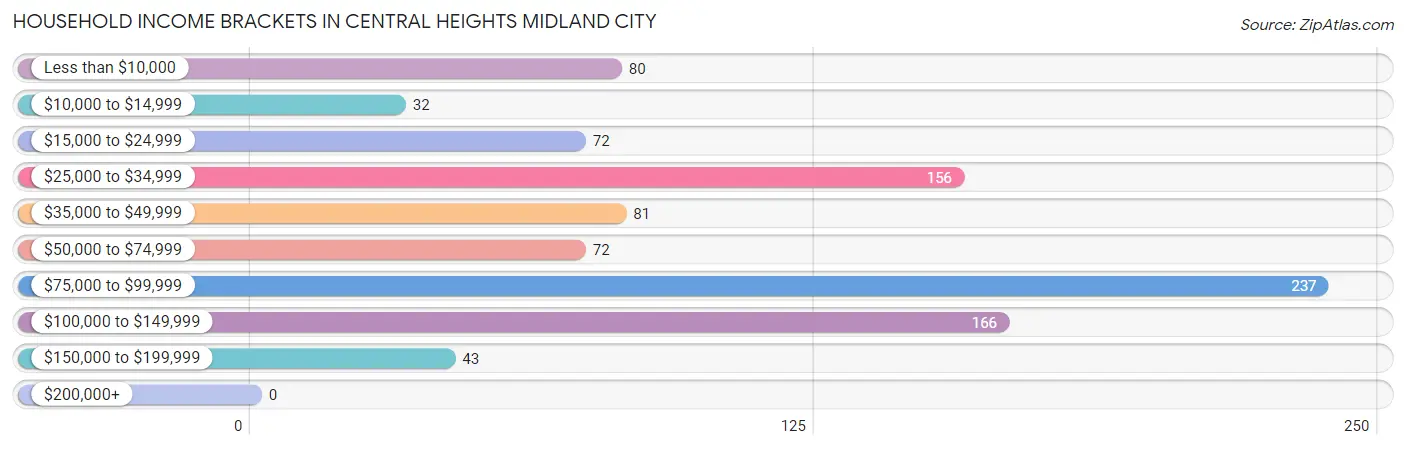
| Income Bracket | # Households | % Households |
| Less than $10,000 | 80 | 8.5% |
| $10,000 to $14,999 | 32 | 3.4% |
| $15,000 to $24,999 | 72 | 7.7% |
| $25,000 to $34,999 | 156 | 16.6% |
| $35,000 to $49,999 | 81 | 8.6% |
| $50,000 to $74,999 | 72 | 7.7% |
| $75,000 to $99,999 | 237 | 25.2% |
| $100,000 to $149,999 | 166 | 17.7% |
| $150,000 to $199,999 | 43 | 4.6% |
| $200,000+ | 0 | 0.0% |
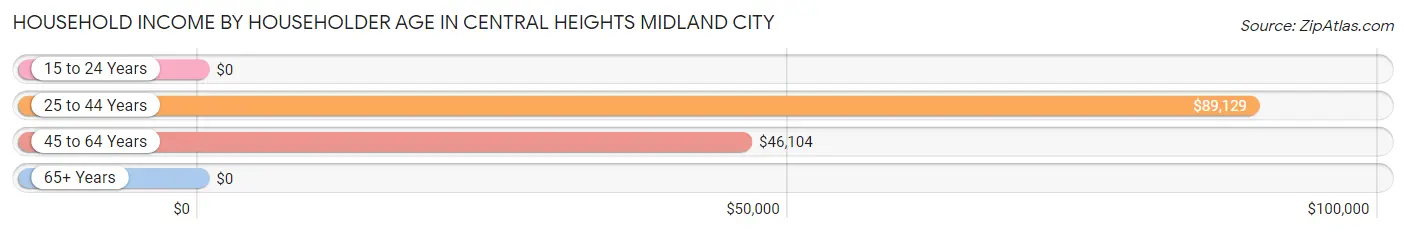
Household Income by Householder Age in Central Heights Midland City
The median household income in Central Heights Midland City is $68,250, with the highest median household income of $89,129 found in the 25 to 44 years age bracket for the primary householder. A total of 262 households (27.9%) fall into this category. Meanwhile, the 15 to 24 years age bracket for the primary householder has the lowest median household income of $0, with 71 households (7.6%) in this group.
| Income Bracket | # Households | Median Income |
| 15 to 24 Years | 71 (7.6%) | $0 |
| 25 to 44 Years | 262 (27.9%) | $89,129 |
| 45 to 64 Years | 353 (37.6%) | $46,104 |
| 65+ Years | 253 (26.9%) | $0 |
| Total | 939 (100.0%) | $68,250 |
Poverty in Central Heights Midland City
Income Below Poverty by Sex and Age in Central Heights Midland City
With 22.6% poverty level for males and 24.1% for females among the residents of Central Heights Midland City, 16 and 17 year old males and 45 to 54 year old females are the most vulnerable to poverty, with 106 males (82.2%) and 81 females (72.3%) in their respective age groups living below the poverty level.
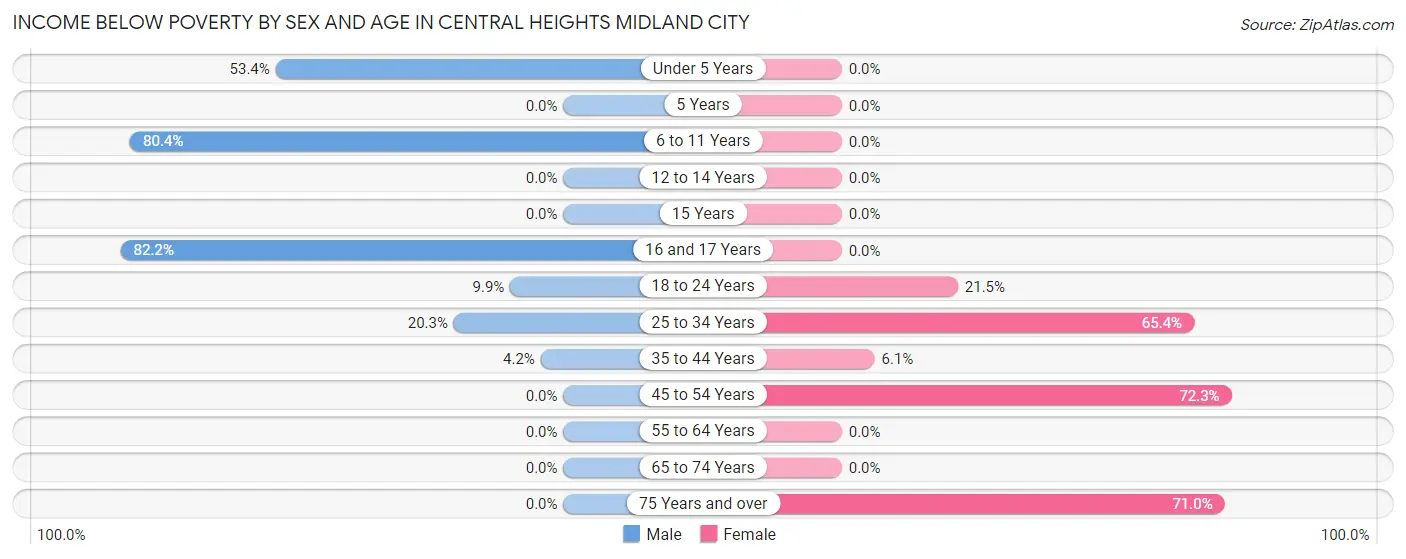
| Age Bracket | Male | Female |
| Under 5 Years | 47 (53.4%) | 0 (0.0%) |
| 5 Years | 0 (0.0%) | 0 (0.0%) |
| 6 to 11 Years | 78 (80.4%) | 0 (0.0%) |
| 12 to 14 Years | 0 (0.0%) | 0 (0.0%) |
| 15 Years | 0 (0.0%) | 0 (0.0%) |
| 16 and 17 Years | 106 (82.2%) | 0 (0.0%) |
| 18 to 24 Years | 15 (9.9%) | 14 (21.5%) |
| 25 to 34 Years | 12 (20.3%) | 66 (65.3%) |
| 35 to 44 Years | 9 (4.2%) | 12 (6.1%) |
| 45 to 54 Years | 0 (0.0%) | 81 (72.3%) |
| 55 to 64 Years | 0 (0.0%) | 0 (0.0%) |
| 65 to 74 Years | 0 (0.0%) | 0 (0.0%) |
| 75 Years and over | 0 (0.0%) | 103 (71.0%) |
| Total | 267 (22.6%) | 276 (24.1%) |
Income Above Poverty by Sex and Age in Central Heights Midland City
According to the poverty statistics in Central Heights Midland City, males aged 12 to 14 years and females aged under 5 years are the age groups that are most secure financially, with 100.0% of males and 100.0% of females in these age groups living above the poverty line.
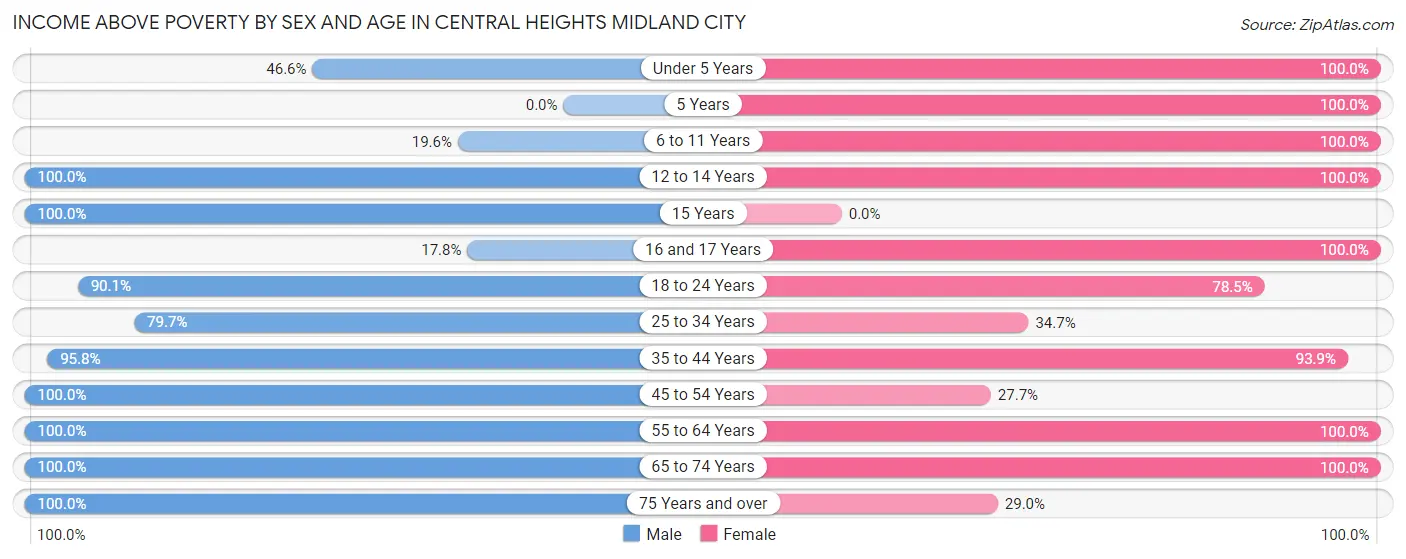
| Age Bracket | Male | Female |
| Under 5 Years | 41 (46.6%) | 90 (100.0%) |
| 5 Years | 0 (0.0%) | 37 (100.0%) |
| 6 to 11 Years | 19 (19.6%) | 50 (100.0%) |
| 12 to 14 Years | 15 (100.0%) | 57 (100.0%) |
| 15 Years | 6 (100.0%) | 0 (0.0%) |
| 16 and 17 Years | 23 (17.8%) | 55 (100.0%) |
| 18 to 24 Years | 137 (90.1%) | 51 (78.5%) |
| 25 to 34 Years | 47 (79.7%) | 35 (34.6%) |
| 35 to 44 Years | 205 (95.8%) | 185 (93.9%) |
| 45 to 54 Years | 203 (100.0%) | 31 (27.7%) |
| 55 to 64 Years | 98 (100.0%) | 178 (100.0%) |
| 65 to 74 Years | 94 (100.0%) | 56 (100.0%) |
| 75 Years and over | 28 (100.0%) | 42 (29.0%) |
| Total | 916 (77.4%) | 867 (75.8%) |
Income Below Poverty Among Married-Couple Families in Central Heights Midland City
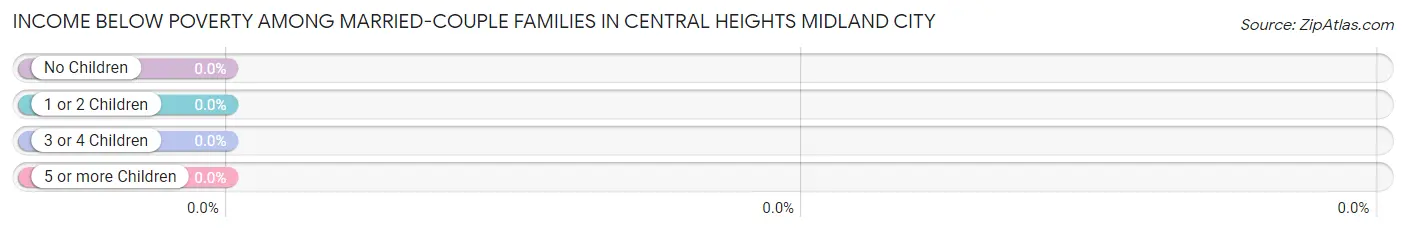
| Children | Above Poverty | Below Poverty |
| No Children | 143 (100.0%) | 0 (0.0%) |
| 1 or 2 Children | 157 (100.0%) | 0 (0.0%) |
| 3 or 4 Children | 77 (100.0%) | 0 (0.0%) |
| 5 or more Children | 0 (0.0%) | 0 (0.0%) |
| Total | 377 (100.0%) | 0 (0.0%) |
Income Below Poverty Among Single-Parent Households in Central Heights Midland City
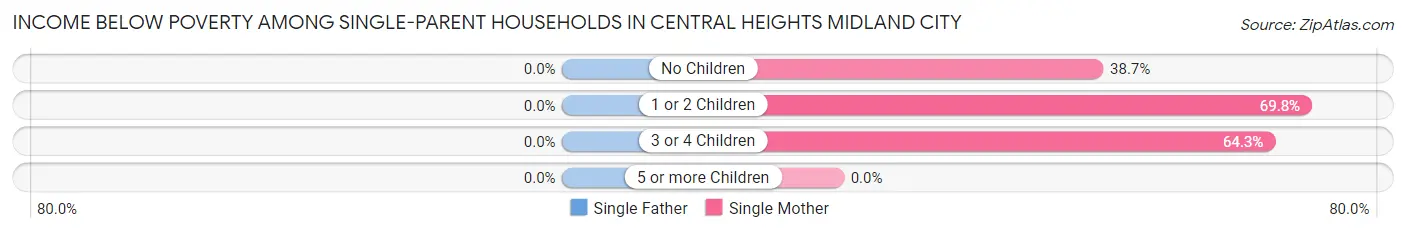
| Children | Single Father | Single Mother |
| No Children | 0 (0.0%) | 46 (38.7%) |
| 1 or 2 Children | 0 (0.0%) | 30 (69.8%) |
| 3 or 4 Children | 0 (0.0%) | 27 (64.3%) |
| 5 or more Children | 0 (0.0%) | 0 (0.0%) |
| Total | 0 (0.0%) | 103 (50.5%) |
Income Below Poverty Among Married-Couple vs Single-Parent Households in Central Heights Midland City
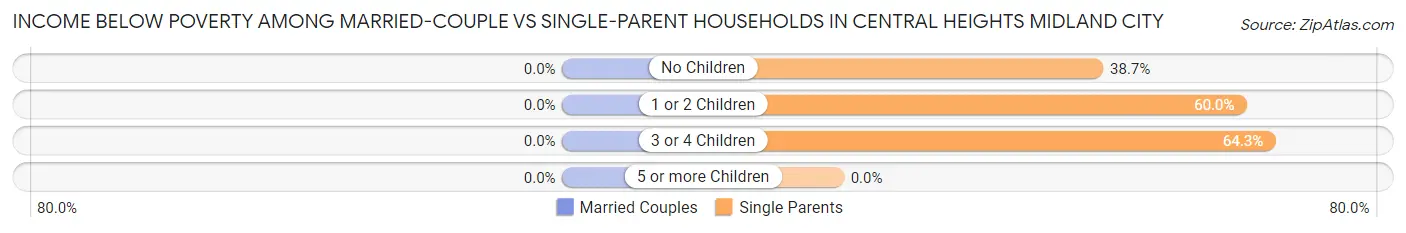
| Children | Married-Couple Families | Single-Parent Households |
| No Children | 0 (0.0%) | 46 (38.7%) |
| 1 or 2 Children | 0 (0.0%) | 30 (60.0%) |
| 3 or 4 Children | 0 (0.0%) | 27 (64.3%) |
| 5 or more Children | 0 (0.0%) | 0 (0.0%) |
| Total | 0 (0.0%) | 103 (48.8%) |
Race in Central Heights Midland City
The most populous races in Central Heights Midland City are White / Caucasian (2,030 | 85.3%), Hispanic or Latino (672 | 28.2%), and Two or more Races (149 | 6.3%).
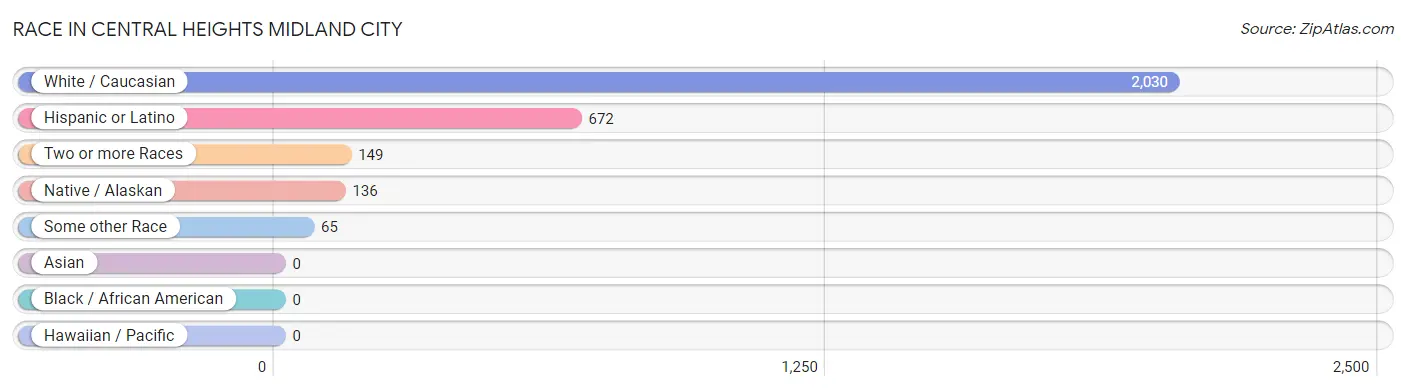
| Race | # Population | % Population |
| Asian | 0 | 0.0% |
| Black / African American | 0 | 0.0% |
| Hawaiian / Pacific | 0 | 0.0% |
| Hispanic or Latino | 672 | 28.2% |
| Native / Alaskan | 136 | 5.7% |
| White / Caucasian | 2,030 | 85.3% |
| Two or more Races | 149 | 6.3% |
| Some other Race | 65 | 2.7% |
| Total | 2,380 | 100.0% |
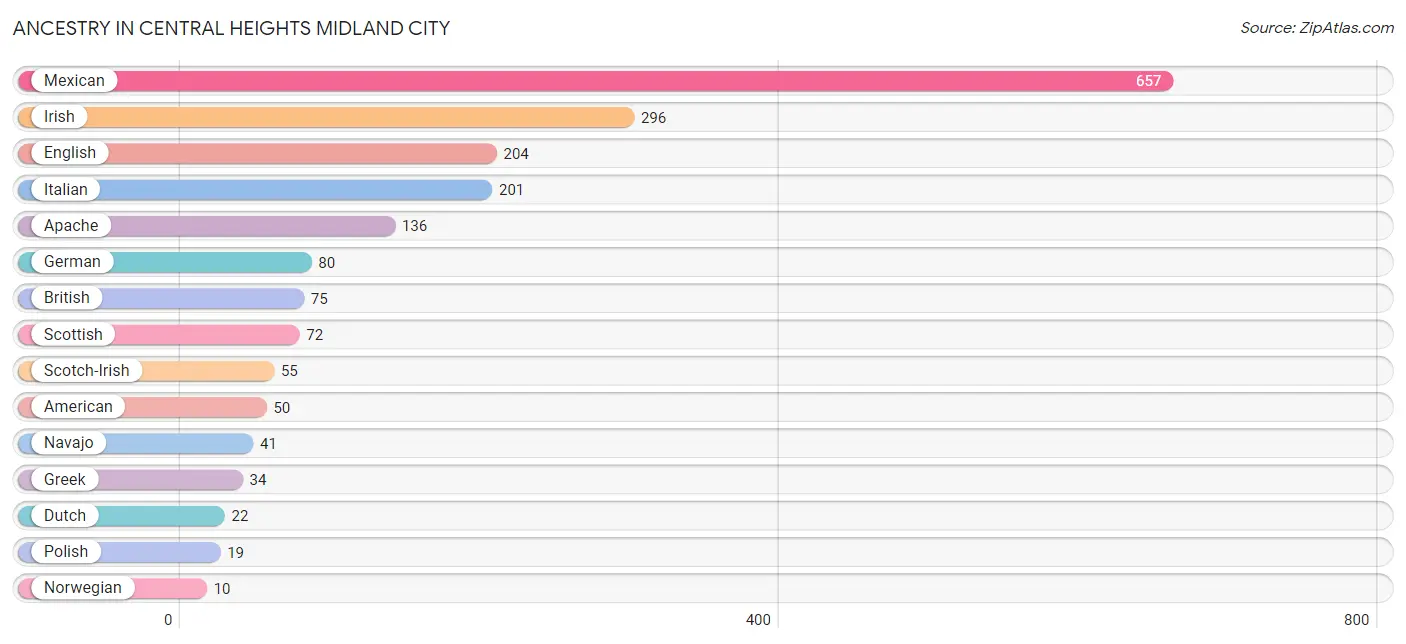
Ancestry in Central Heights Midland City
The most populous ancestries reported in Central Heights Midland City are Mexican (657 | 27.6%), Irish (296 | 12.4%), English (204 | 8.6%), Italian (201 | 8.5%), and Apache (136 | 5.7%), together accounting for 62.8% of all Central Heights Midland City residents.
| Ancestry | # Population | % Population |
| American | 50 | 2.1% |
| Apache | 136 | 5.7% |
| British | 75 | 3.2% |
| Canadian | 9 | 0.4% |
| Dutch | 22 | 0.9% |
| English | 204 | 8.6% |
| European | 7 | 0.3% |
| French | 4 | 0.2% |
| German | 80 | 3.4% |
| Greek | 34 | 1.4% |
| Irish | 296 | 12.4% |
| Italian | 201 | 8.5% |
| Mexican | 657 | 27.6% |
| Navajo | 41 | 1.7% |
| Norwegian | 10 | 0.4% |
| Polish | 19 | 0.8% |
| Scotch-Irish | 55 | 2.3% |
| Scottish | 72 | 3.0% |
| Sioux | 6 | 0.3% |
| Swedish | 10 | 0.4% | View All 20 Rows |
Immigrants in Central Heights Midland City
The most numerous immigrant groups reported in Central Heights Midland City came from Central America (60 | 2.5%), Latin America (60 | 2.5%), Mexico (60 | 2.5%), England (9 | 0.4%), and Europe (9 | 0.4%), together accounting for 8.3% of all Central Heights Midland City residents.
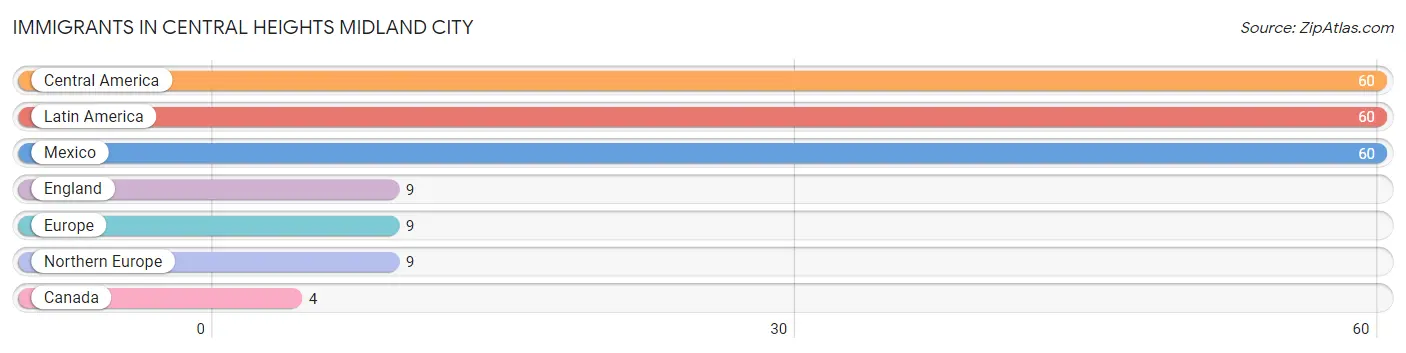
| Immigration Origin | # Population | % Population |
| Canada | 4 | 0.2% |
| Central America | 60 | 2.5% |
| England | 9 | 0.4% |
| Europe | 9 | 0.4% |
| Latin America | 60 | 2.5% |
| Mexico | 60 | 2.5% |
| Northern Europe | 9 | 0.4% | View All 7 Rows |
Sex and Age in Central Heights Midland City
Sex and Age in Central Heights Midland City
The most populous age groups in Central Heights Midland City are 15 to 19 Years (230 | 19.4%) for men and 40 to 44 Years (174 | 14.5%) for women.
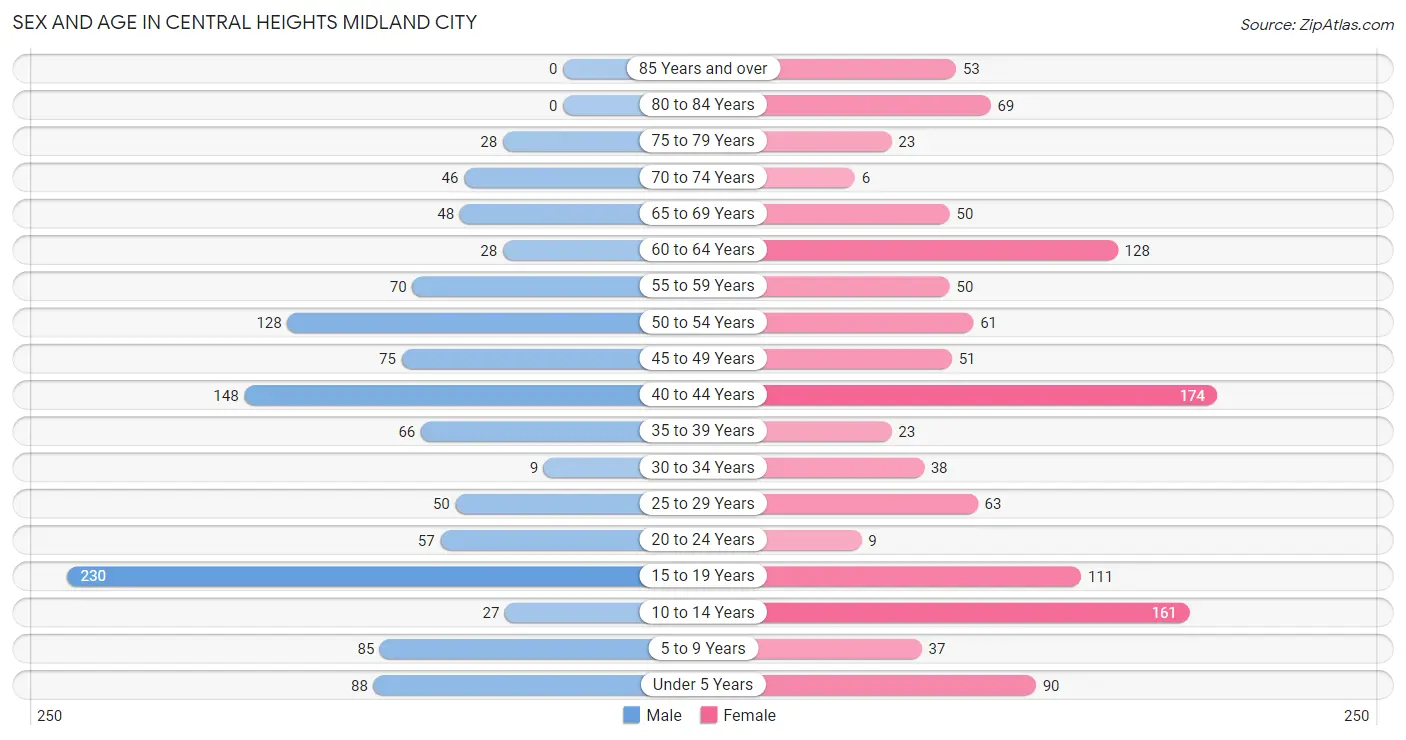
| Age Bracket | Male | Female |
| Under 5 Years | 88 (7.4%) | 90 (7.5%) |
| 5 to 9 Years | 85 (7.2%) | 37 (3.1%) |
| 10 to 14 Years | 27 (2.3%) | 161 (13.5%) |
| 15 to 19 Years | 230 (19.4%) | 111 (9.3%) |
| 20 to 24 Years | 57 (4.8%) | 9 (0.7%) |
| 25 to 29 Years | 50 (4.2%) | 63 (5.3%) |
| 30 to 34 Years | 9 (0.8%) | 38 (3.2%) |
| 35 to 39 Years | 66 (5.6%) | 23 (1.9%) |
| 40 to 44 Years | 148 (12.5%) | 174 (14.5%) |
| 45 to 49 Years | 75 (6.3%) | 51 (4.3%) |
| 50 to 54 Years | 128 (10.8%) | 61 (5.1%) |
| 55 to 59 Years | 70 (5.9%) | 50 (4.2%) |
| 60 to 64 Years | 28 (2.4%) | 128 (10.7%) |
| 65 to 69 Years | 48 (4.1%) | 50 (4.2%) |
| 70 to 74 Years | 46 (3.9%) | 6 (0.5%) |
| 75 to 79 Years | 28 (2.4%) | 23 (1.9%) |
| 80 to 84 Years | 0 (0.0%) | 69 (5.8%) |
| 85 Years and over | 0 (0.0%) | 53 (4.4%) |
| Total | 1,183 (100.0%) | 1,197 (100.0%) |
Families and Households in Central Heights Midland City
Median Family Size in Central Heights Midland City
The median family size in Central Heights Midland City is 3.09 persons per family, with married-couple families (377 | 64.1%) accounting for the largest median family size of 3.12 persons per family. On the other hand, single male/father families (7 | 1.2%) represent the smallest median family size with 2.43 persons per family.
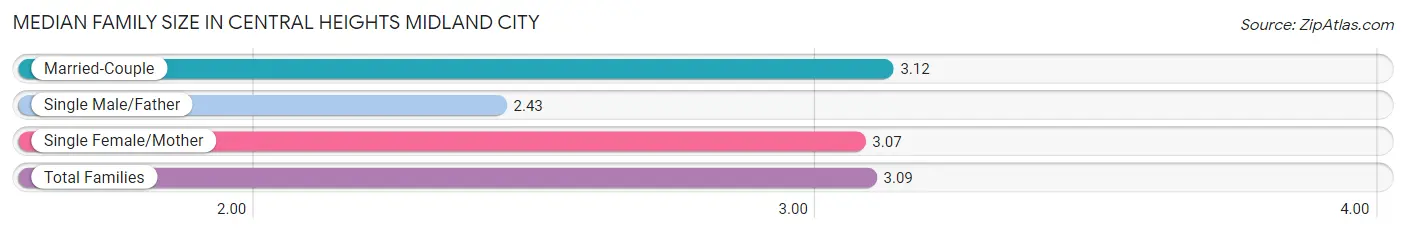
| Family Type | # Families | Family Size |
| Married-Couple | 377 (64.1%) | 3.12 |
| Single Male/Father | 7 (1.2%) | 2.43 |
| Single Female/Mother | 204 (34.7%) | 3.07 |
| Total Families | 588 (100.0%) | 3.09 |
Median Household Size in Central Heights Midland City
The median household size in Central Heights Midland City is 2.53 persons per household, with single male/father households (7 | 0.7%) accounting for the largest median household size of 3.57 persons per household. non-family households (351 | 37.4%) represent the smallest median household size with 1.35 persons per household.
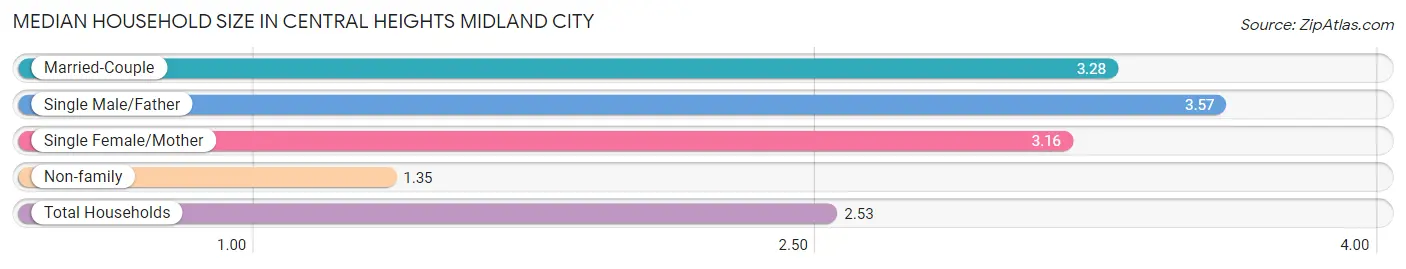
| Household Type | # Households | Household Size |
| Married-Couple | 377 (40.2%) | 3.28 |
| Single Male/Father | 7 (0.7%) | 3.57 |
| Single Female/Mother | 204 (21.7%) | 3.16 |
| Non-family | 351 (37.4%) | 1.35 |
| Total Households | 939 (100.0%) | 2.53 |
Household Size by Marriage Status in Central Heights Midland City
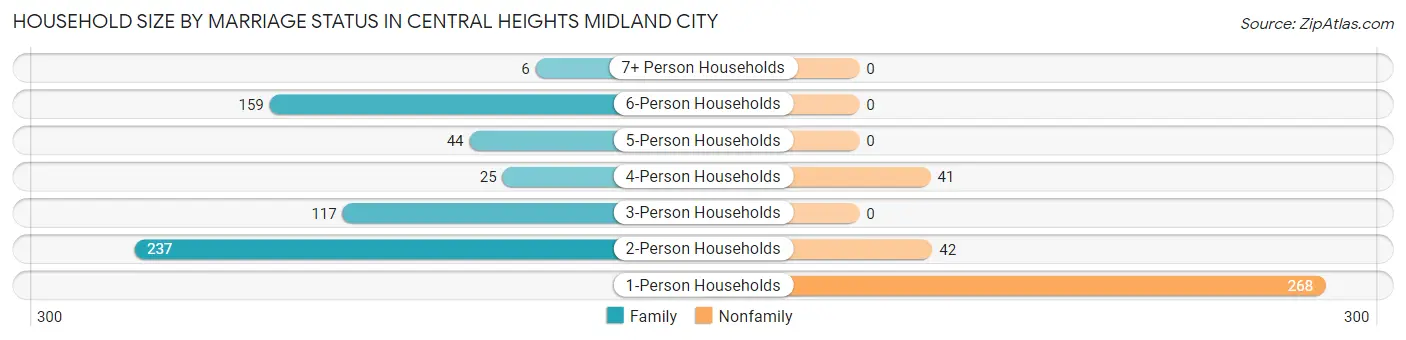
Out of a total of 939 households in Central Heights Midland City, 588 (62.6%) are family households, while 351 (37.4%) are nonfamily households. The most numerous type of family households are 2-person households, comprising 237, and the most common type of nonfamily households are 1-person households, comprising 268.
| Household Size | Family Households | Nonfamily Households |
| 1-Person Households | - | 268 (28.5%) |
| 2-Person Households | 237 (25.2%) | 42 (4.5%) |
| 3-Person Households | 117 (12.5%) | 0 (0.0%) |
| 4-Person Households | 25 (2.7%) | 41 (4.4%) |
| 5-Person Households | 44 (4.7%) | 0 (0.0%) |
| 6-Person Households | 159 (16.9%) | 0 (0.0%) |
| 7+ Person Households | 6 (0.6%) | 0 (0.0%) |
| Total | 588 (62.6%) | 351 (37.4%) |
Female Fertility in Central Heights Midland City
Fertility by Age in Central Heights Midland City
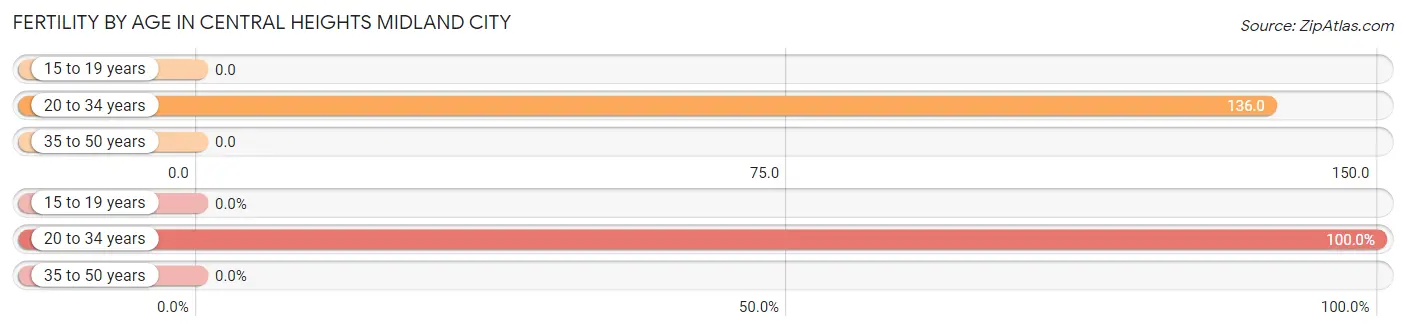
Average fertility rate in Central Heights Midland City is 32.0 births per 1,000 women. Women in the age bracket of 20 to 34 years have the highest fertility rate with 136.0 births per 1,000 women. Women in the age bracket of 20 to 34 years acount for 100.0% of all women with births.
| Age Bracket | Women with Births | Births / 1,000 Women |
| 15 to 19 years | 0 (0.0%) | 0.0 |
| 20 to 34 years | 15 (100.0%) | 136.0 |
| 35 to 50 years | 0 (0.0%) | 0.0 |
| Total | 15 (100.0%) | 32.0 |
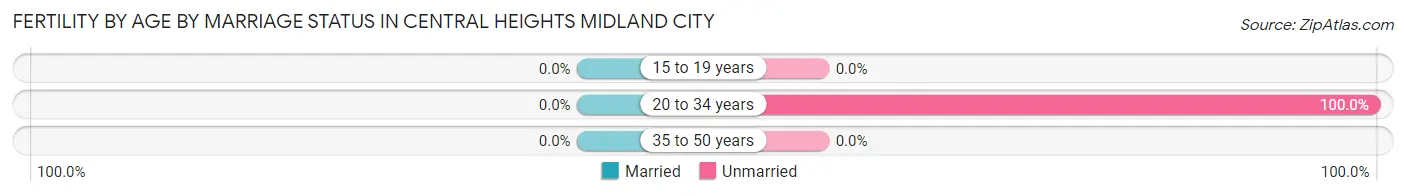
Fertility by Age by Marriage Status in Central Heights Midland City
| Age Bracket | Married | Unmarried |
| 15 to 19 years | 0 (0.0%) | 0 (0.0%) |
| 20 to 34 years | 0 (0.0%) | 15 (100.0%) |
| 35 to 50 years | 0 (0.0%) | 0 (0.0%) |
| Total | 0 (0.0%) | 15 (100.0%) |
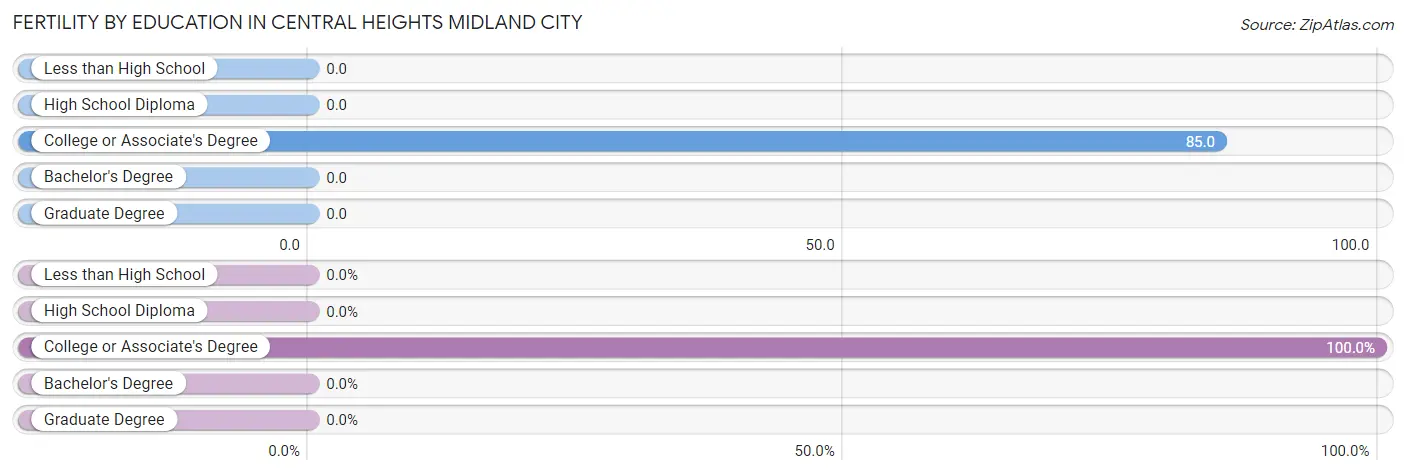
Fertility by Education in Central Heights Midland City
| Educational Attainment | Women with Births | Births / 1,000 Women |
| Less than High School | 0 (0.0%) | 0.0 |
| High School Diploma | 0 (0.0%) | 0.0 |
| College or Associate's Degree | 15 (100.0%) | 85.0 |
| Bachelor's Degree | 0 (0.0%) | 0.0 |
| Graduate Degree | 0 (0.0%) | 0.0 |
| Total | 15 (100.0%) | 32.0 |
Fertility by Education by Marriage Status in Central Heights Midland City
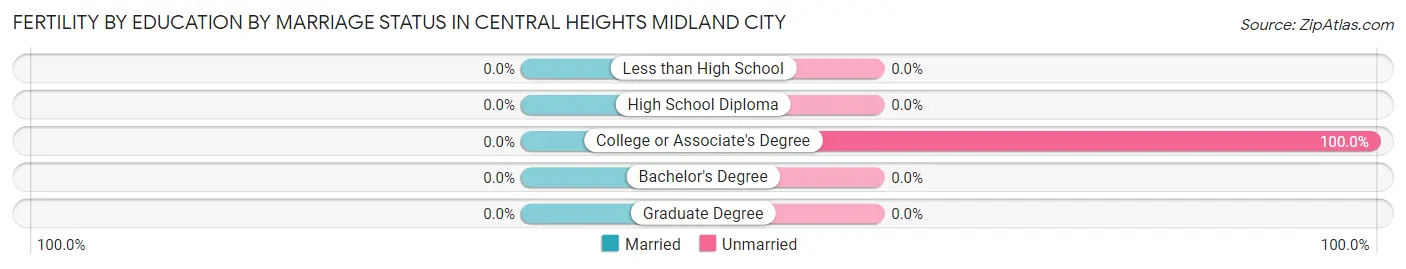
| Educational Attainment | Married | Unmarried |
| Less than High School | 0 (0.0%) | 0 (0.0%) |
| High School Diploma | 0 (0.0%) | 0 (0.0%) |
| College or Associate's Degree | 0 (0.0%) | 15 (100.0%) |
| Bachelor's Degree | 0 (0.0%) | 0 (0.0%) |
| Graduate Degree | 0 (0.0%) | 0 (0.0%) |
| Total | 0 (0.0%) | 15 (100.0%) |
Employment Characteristics in Central Heights Midland City
Employment by Class of Employer in Central Heights Midland City
Among the 847 employed individuals in Central Heights Midland City, private company employees (484 | 57.1%), local government employees (160 | 18.9%), and federal government employees (76 | 9.0%) make up the most common classes of employment.
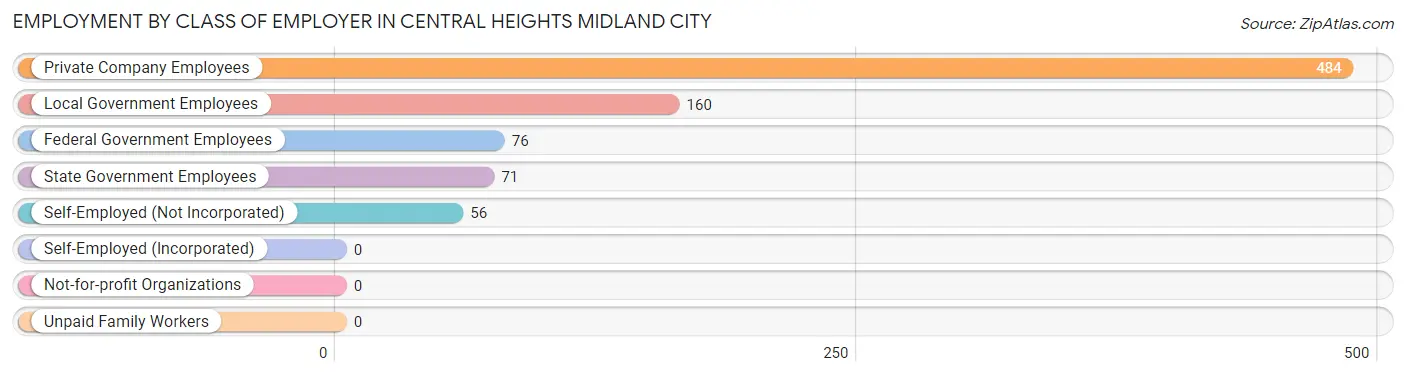
| Employer Class | # Employees | % Employees |
| Private Company Employees | 484 | 57.1% |
| Self-Employed (Incorporated) | 0 | 0.0% |
| Self-Employed (Not Incorporated) | 56 | 6.6% |
| Not-for-profit Organizations | 0 | 0.0% |
| Local Government Employees | 160 | 18.9% |
| State Government Employees | 71 | 8.4% |
| Federal Government Employees | 76 | 9.0% |
| Unpaid Family Workers | 0 | 0.0% |
| Total | 847 | 100.0% |
Employment Status by Age in Central Heights Midland City
According to the labor force statistics for Central Heights Midland City, out of the total population over 16 years of age (1,886), 50.2% or 947 individuals are in the labor force, with 10.6% or 100 of them unemployed. The age group with the highest labor force participation rate is 20 to 24 years, with 89.4% or 59 individuals in the labor force. Within the labor force, the 20 to 24 years age range has the highest percentage of unemployed individuals, with 55.9% or 33 of them being unemployed.
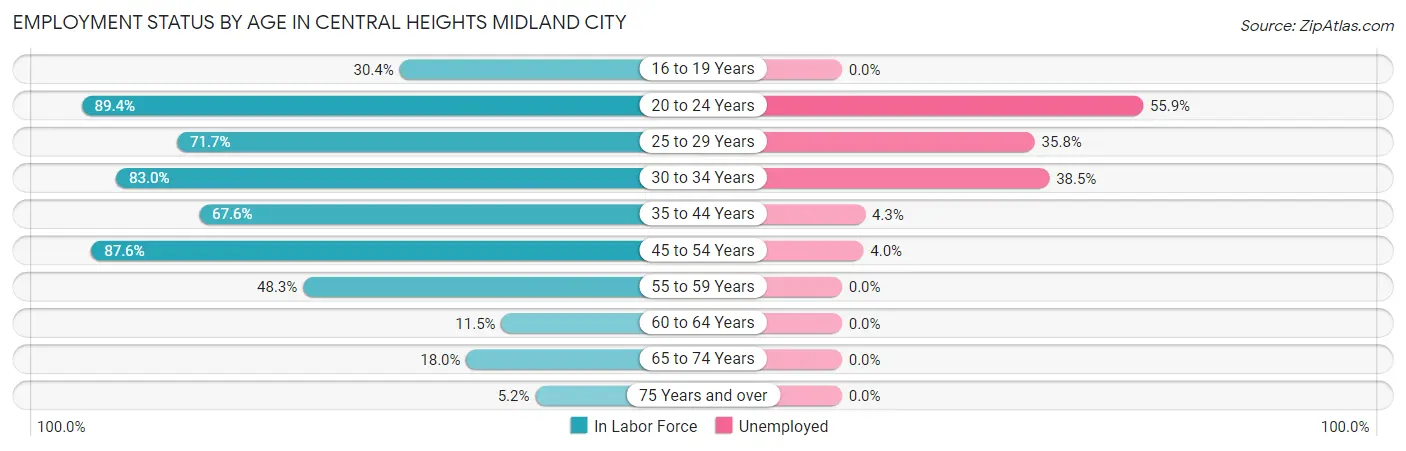
| Age Bracket | In Labor Force | Unemployed |
| 16 to 19 Years | 102 (30.4%) | 0 (0.0%) |
| 20 to 24 Years | 59 (89.4%) | 33 (55.9%) |
| 25 to 29 Years | 81 (71.7%) | 29 (35.8%) |
| 30 to 34 Years | 39 (83.0%) | 15 (38.5%) |
| 35 to 44 Years | 278 (67.6%) | 12 (4.3%) |
| 45 to 54 Years | 276 (87.6%) | 11 (4.0%) |
| 55 to 59 Years | 58 (48.3%) | 0 (0.0%) |
| 60 to 64 Years | 18 (11.5%) | 0 (0.0%) |
| 65 to 74 Years | 27 (18.0%) | 0 (0.0%) |
| 75 Years and over | 9 (5.2%) | 0 (0.0%) |
| Total | 947 (50.2%) | 100 (10.6%) |
Employment Status by Educational Attainment in Central Heights Midland City
According to labor force statistics for Central Heights Midland City, 64.5% of individuals (749) out of the total population between 25 and 64 years of age (1,162) are in the labor force, with 8.9% or 67 of them being unemployed. The group with the highest labor force participation rate are those with the educational attainment of bachelor's degree or higher, with 95.1% or 116 individuals in the labor force. Within the labor force, individuals with high school diploma education have the highest percentage of unemployment, with 15.5% or 44 of them being unemployed.
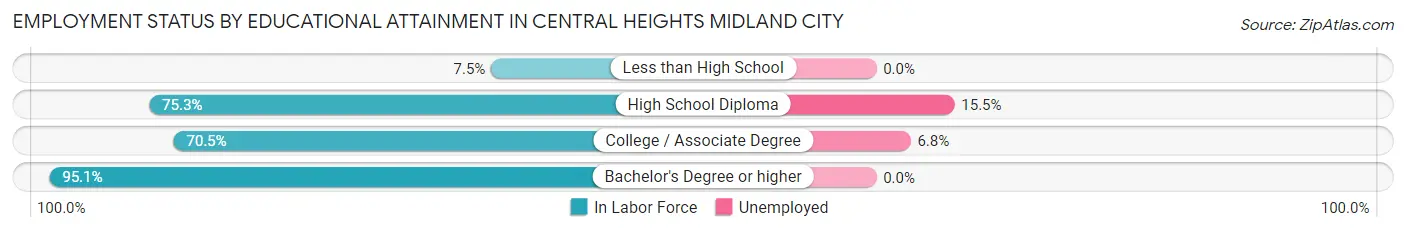
| Educational Attainment | In Labor Force | Unemployed |
| Less than High School | 14 (7.5%) | 0 (0.0%) |
| High School Diploma | 283 (75.3%) | 58 (15.5%) |
| College / Associate Degree | 337 (70.5%) | 33 (6.8%) |
| Bachelor's Degree or higher | 116 (95.1%) | 0 (0.0%) |
| Total | 749 (64.5%) | 103 (8.9%) |
Employment Occupations by Sex in Central Heights Midland City
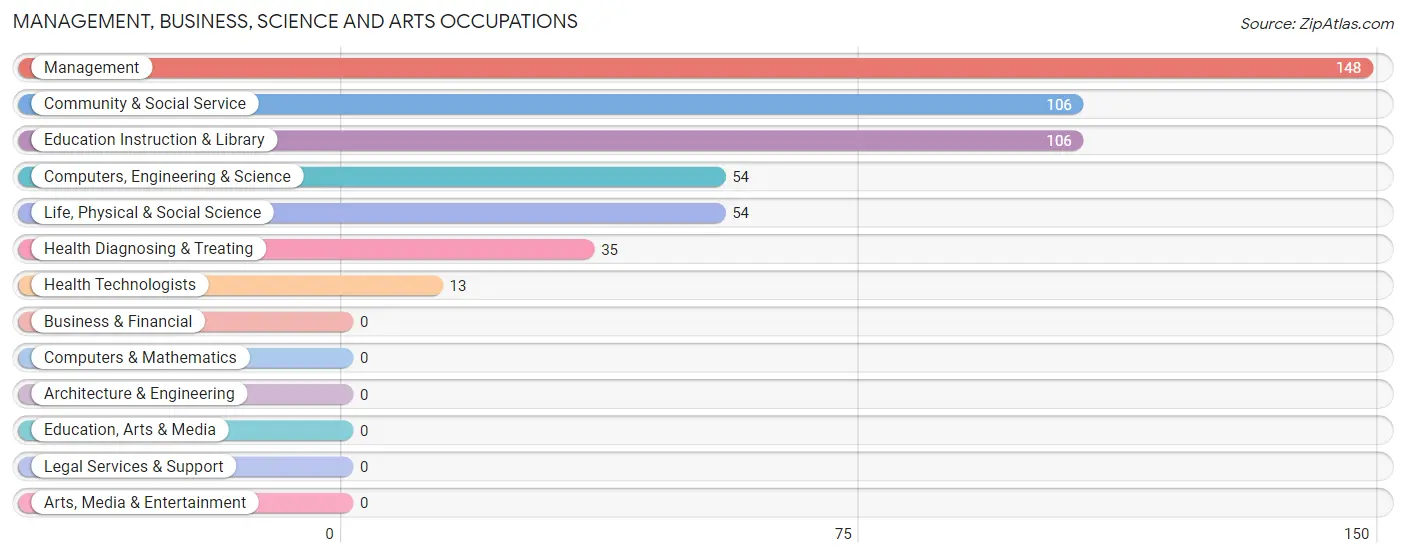
Management, Business, Science and Arts Occupations
The most common Management, Business, Science and Arts occupations in Central Heights Midland City are Management (148 | 17.5%), Community & Social Service (106 | 12.5%), Education Instruction & Library (106 | 12.5%), Computers, Engineering & Science (54 | 6.4%), and Life, Physical & Social Science (54 | 6.4%).
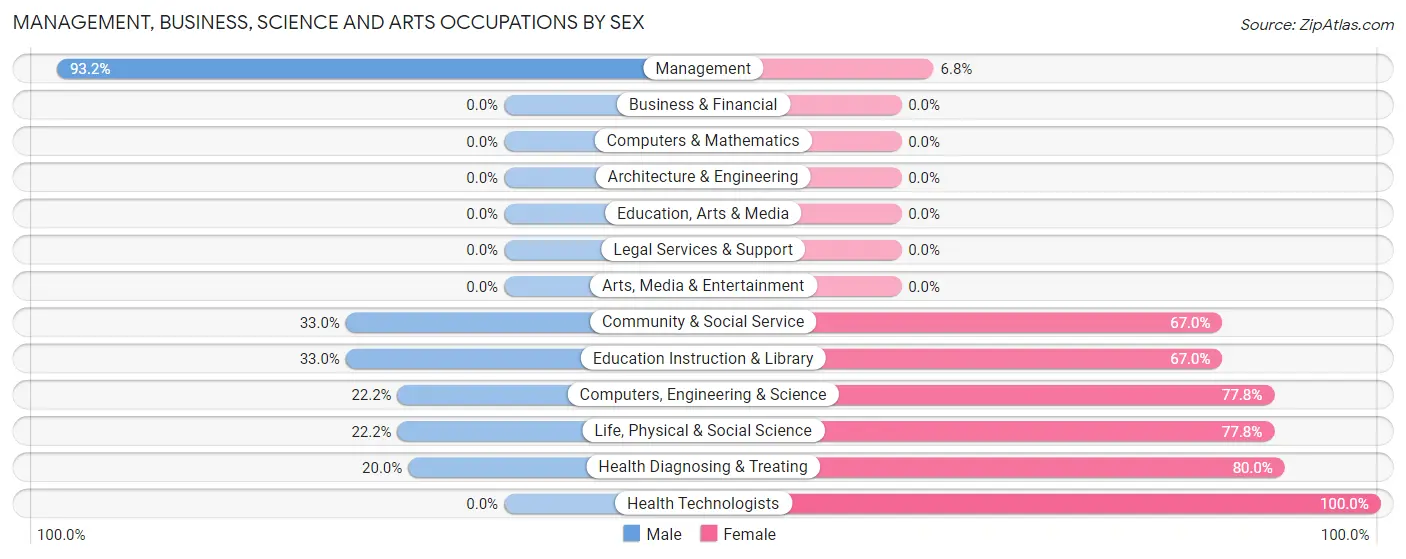
Management, Business, Science and Arts Occupations by Sex
Within the Management, Business, Science and Arts occupations in Central Heights Midland City, the most male-oriented occupations are Management (93.2%), Community & Social Service (33.0%), and Education Instruction & Library (33.0%), while the most female-oriented occupations are Health Technologists (100.0%), Health Diagnosing & Treating (80.0%), and Computers, Engineering & Science (77.8%).
| Occupation | Male | Female |
| Management | 138 (93.2%) | 10 (6.8%) |
| Business & Financial | 0 (0.0%) | 0 (0.0%) |
| Computers, Engineering & Science | 12 (22.2%) | 42 (77.8%) |
| Computers & Mathematics | 0 (0.0%) | 0 (0.0%) |
| Architecture & Engineering | 0 (0.0%) | 0 (0.0%) |
| Life, Physical & Social Science | 12 (22.2%) | 42 (77.8%) |
| Community & Social Service | 35 (33.0%) | 71 (67.0%) |
| Education, Arts & Media | 0 (0.0%) | 0 (0.0%) |
| Legal Services & Support | 0 (0.0%) | 0 (0.0%) |
| Education Instruction & Library | 35 (33.0%) | 71 (67.0%) |
| Arts, Media & Entertainment | 0 (0.0%) | 0 (0.0%) |
| Health Diagnosing & Treating | 7 (20.0%) | 28 (80.0%) |
| Health Technologists | 0 (0.0%) | 13 (100.0%) |
| Total (Category) | 192 (56.0%) | 151 (44.0%) |
| Total (Overall) | 542 (64.0%) | 305 (36.0%) |
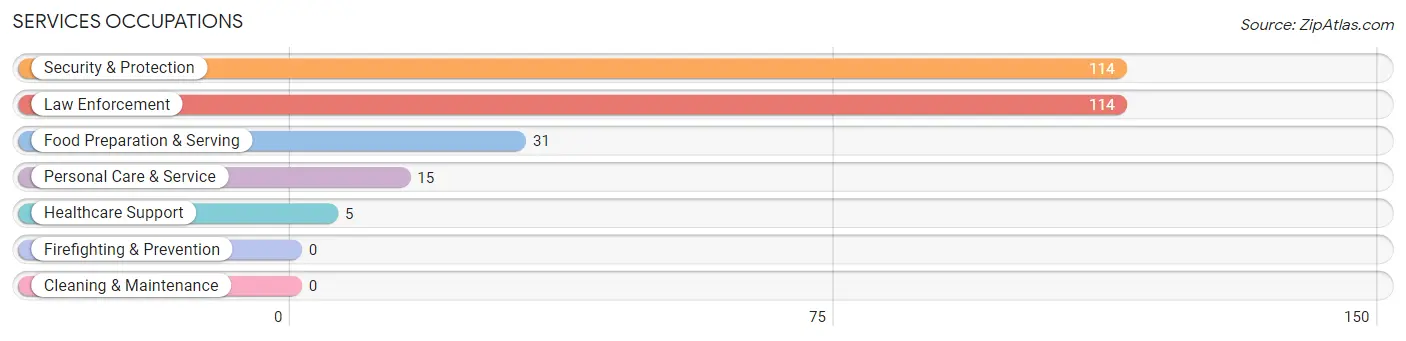
Services Occupations
The most common Services occupations in Central Heights Midland City are Security & Protection (114 | 13.5%), Law Enforcement (114 | 13.5%), Food Preparation & Serving (31 | 3.7%), Personal Care & Service (15 | 1.8%), and Healthcare Support (5 | 0.6%).
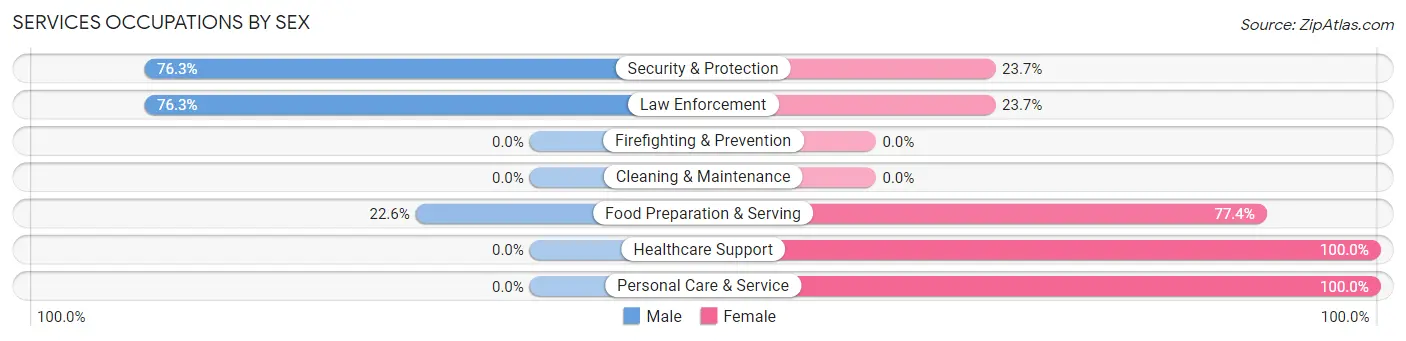
Services Occupations by Sex
Within the Services occupations in Central Heights Midland City, the most male-oriented occupations are Security & Protection (76.3%), Law Enforcement (76.3%), and Food Preparation & Serving (22.6%), while the most female-oriented occupations are Healthcare Support (100.0%), Personal Care & Service (100.0%), and Food Preparation & Serving (77.4%).
| Occupation | Male | Female |
| Healthcare Support | 0 (0.0%) | 5 (100.0%) |
| Security & Protection | 87 (76.3%) | 27 (23.7%) |
| Firefighting & Prevention | 0 (0.0%) | 0 (0.0%) |
| Law Enforcement | 87 (76.3%) | 27 (23.7%) |
| Food Preparation & Serving | 7 (22.6%) | 24 (77.4%) |
| Cleaning & Maintenance | 0 (0.0%) | 0 (0.0%) |
| Personal Care & Service | 0 (0.0%) | 15 (100.0%) |
| Total (Category) | 94 (57.0%) | 71 (43.0%) |
| Total (Overall) | 542 (64.0%) | 305 (36.0%) |
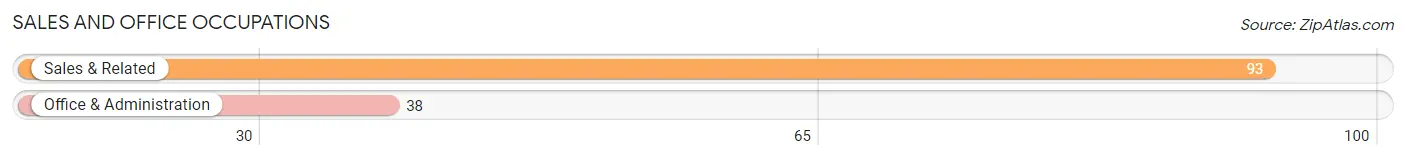
Sales and Office Occupations
The most common Sales and Office occupations in Central Heights Midland City are Sales & Related (93 | 11.0%), and Office & Administration (38 | 4.5%).
Sales and Office Occupations by Sex
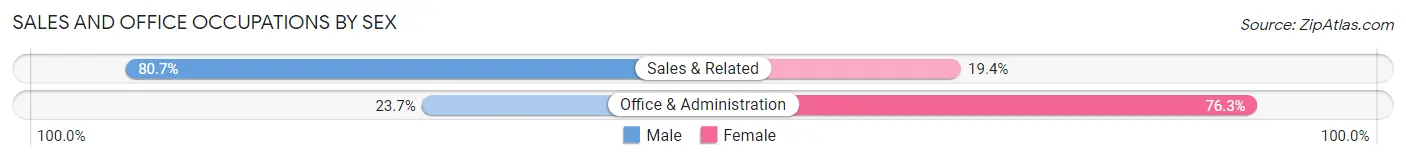
| Occupation | Male | Female |
| Sales & Related | 75 (80.6%) | 18 (19.4%) |
| Office & Administration | 9 (23.7%) | 29 (76.3%) |
| Total (Category) | 84 (64.1%) | 47 (35.9%) |
| Total (Overall) | 542 (64.0%) | 305 (36.0%) |
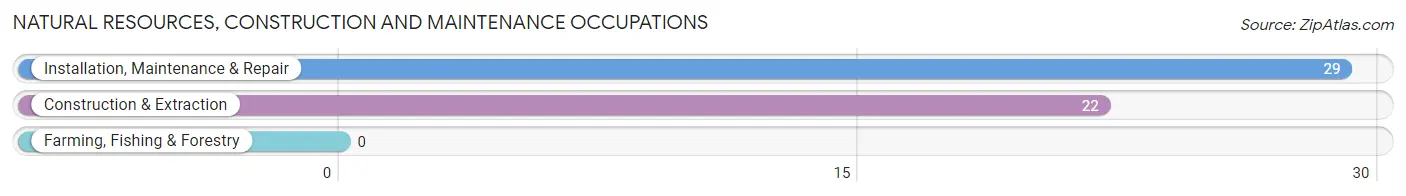
Natural Resources, Construction and Maintenance Occupations
The most common Natural Resources, Construction and Maintenance occupations in Central Heights Midland City are Installation, Maintenance & Repair (29 | 3.4%), and Construction & Extraction (22 | 2.6%).
Natural Resources, Construction and Maintenance Occupations by Sex
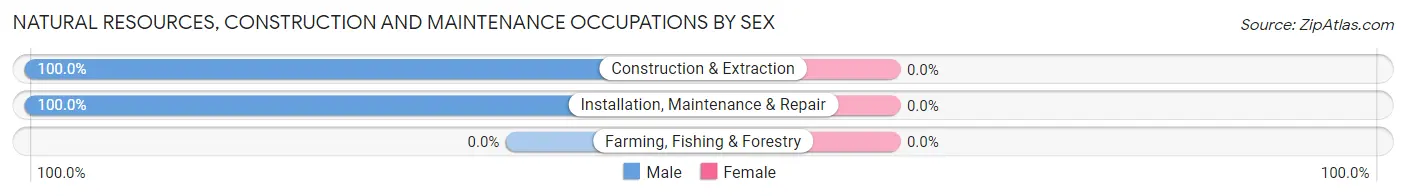
| Occupation | Male | Female |
| Farming, Fishing & Forestry | 0 (0.0%) | 0 (0.0%) |
| Construction & Extraction | 22 (100.0%) | 0 (0.0%) |
| Installation, Maintenance & Repair | 29 (100.0%) | 0 (0.0%) |
| Total (Category) | 51 (100.0%) | 0 (0.0%) |
| Total (Overall) | 542 (64.0%) | 305 (36.0%) |
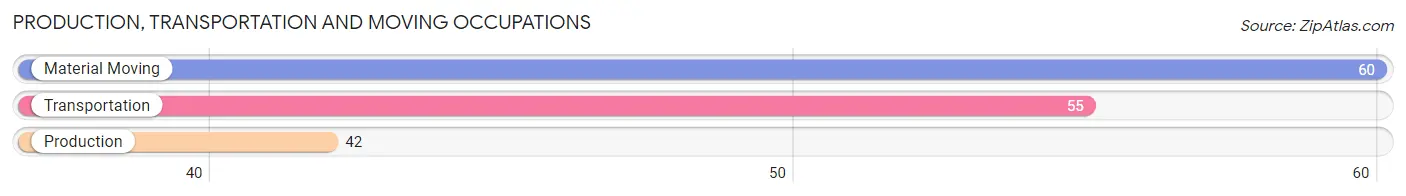
Production, Transportation and Moving Occupations
The most common Production, Transportation and Moving occupations in Central Heights Midland City are Material Moving (60 | 7.1%), Transportation (55 | 6.5%), and Production (42 | 5.0%).
Production, Transportation and Moving Occupations by Sex
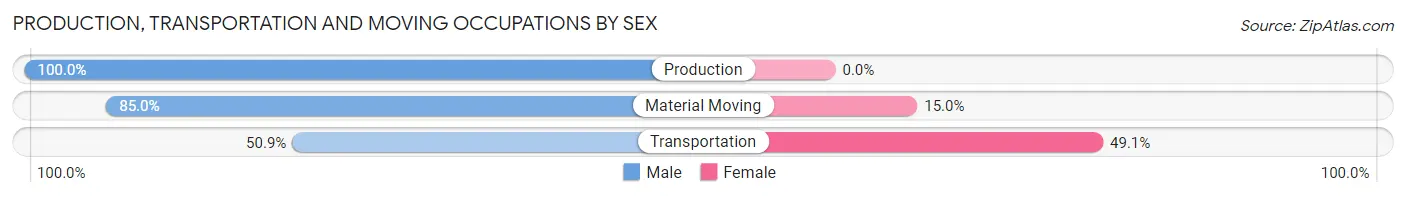
| Occupation | Male | Female |
| Production | 42 (100.0%) | 0 (0.0%) |
| Transportation | 28 (50.9%) | 27 (49.1%) |
| Material Moving | 51 (85.0%) | 9 (15.0%) |
| Total (Category) | 121 (77.1%) | 36 (22.9%) |
| Total (Overall) | 542 (64.0%) | 305 (36.0%) |
Employment Industries by Sex in Central Heights Midland City
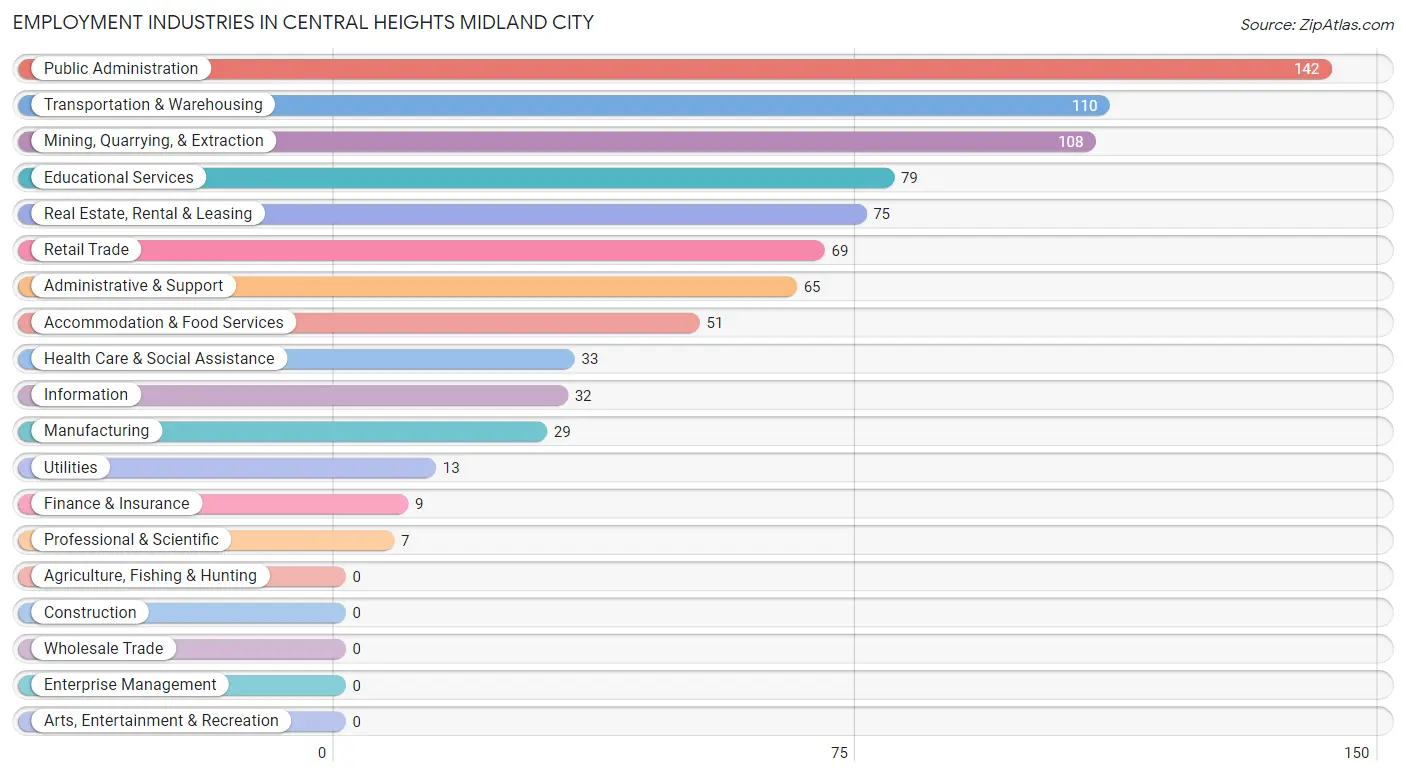
Employment Industries in Central Heights Midland City
The major employment industries in Central Heights Midland City include Public Administration (142 | 16.8%), Transportation & Warehousing (110 | 13.0%), Mining, Quarrying, & Extraction (108 | 12.8%), Educational Services (79 | 9.3%), and Real Estate, Rental & Leasing (75 | 8.8%).
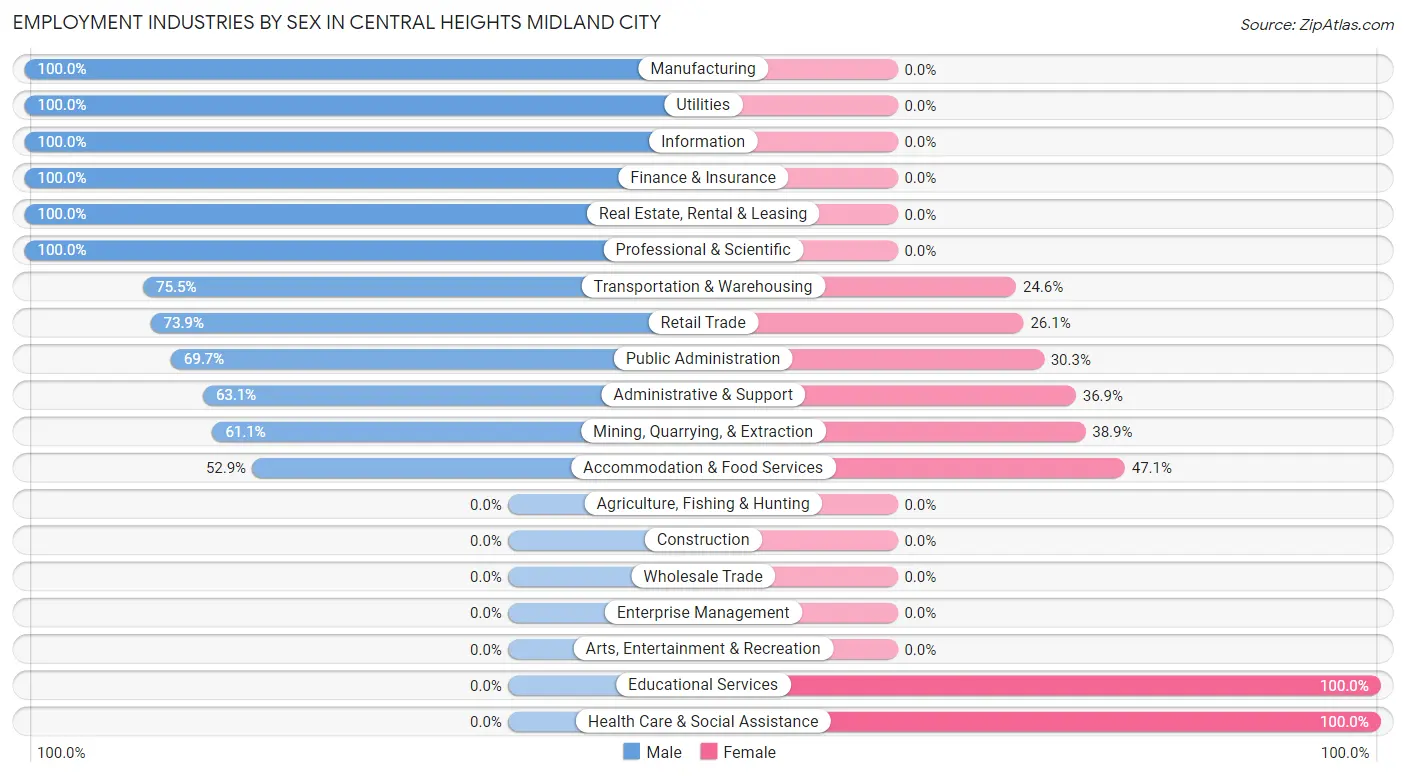
Employment Industries by Sex in Central Heights Midland City
The Central Heights Midland City industries that see more men than women are Manufacturing (100.0%), Utilities (100.0%), and Information (100.0%), whereas the industries that tend to have a higher number of women are Educational Services (100.0%), Health Care & Social Assistance (100.0%), and Accommodation & Food Services (47.1%).
| Industry | Male | Female |
| Agriculture, Fishing & Hunting | 0 (0.0%) | 0 (0.0%) |
| Mining, Quarrying, & Extraction | 66 (61.1%) | 42 (38.9%) |
| Construction | 0 (0.0%) | 0 (0.0%) |
| Manufacturing | 29 (100.0%) | 0 (0.0%) |
| Wholesale Trade | 0 (0.0%) | 0 (0.0%) |
| Retail Trade | 51 (73.9%) | 18 (26.1%) |
| Transportation & Warehousing | 83 (75.4%) | 27 (24.5%) |
| Utilities | 13 (100.0%) | 0 (0.0%) |
| Information | 32 (100.0%) | 0 (0.0%) |
| Finance & Insurance | 9 (100.0%) | 0 (0.0%) |
| Real Estate, Rental & Leasing | 75 (100.0%) | 0 (0.0%) |
| Professional & Scientific | 7 (100.0%) | 0 (0.0%) |
| Enterprise Management | 0 (0.0%) | 0 (0.0%) |
| Administrative & Support | 41 (63.1%) | 24 (36.9%) |
| Educational Services | 0 (0.0%) | 79 (100.0%) |
| Health Care & Social Assistance | 0 (0.0%) | 33 (100.0%) |
| Arts, Entertainment & Recreation | 0 (0.0%) | 0 (0.0%) |
| Accommodation & Food Services | 27 (52.9%) | 24 (47.1%) |
| Public Administration | 99 (69.7%) | 43 (30.3%) |
| Total | 542 (64.0%) | 305 (36.0%) |
Education in Central Heights Midland City
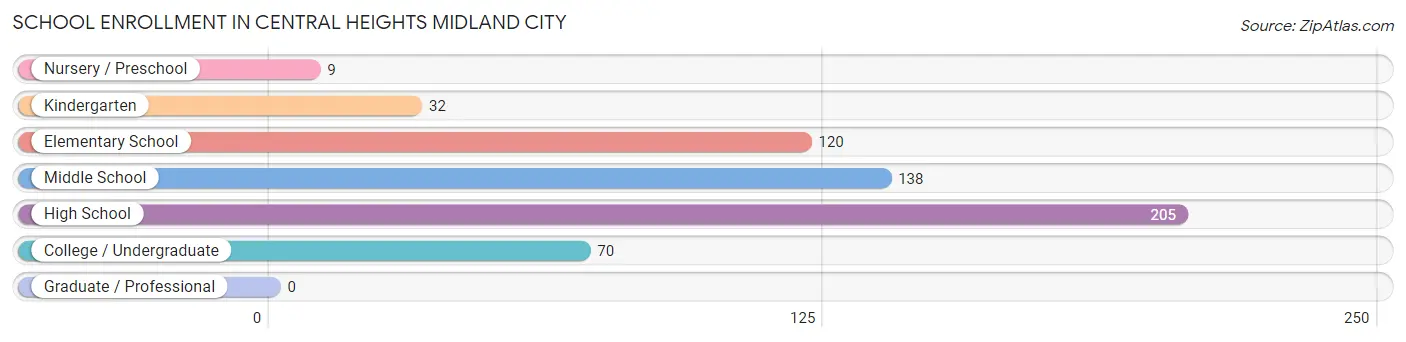
School Enrollment in Central Heights Midland City
The most common levels of schooling among the 574 students in Central Heights Midland City are high school (205 | 35.7%), middle school (138 | 24.0%), and elementary school (120 | 20.9%).
| School Level | # Students | % Students |
| Nursery / Preschool | 9 | 1.6% |
| Kindergarten | 32 | 5.6% |
| Elementary School | 120 | 20.9% |
| Middle School | 138 | 24.0% |
| High School | 205 | 35.7% |
| College / Undergraduate | 70 | 12.2% |
| Graduate / Professional | 0 | 0.0% |
| Total | 574 | 100.0% |
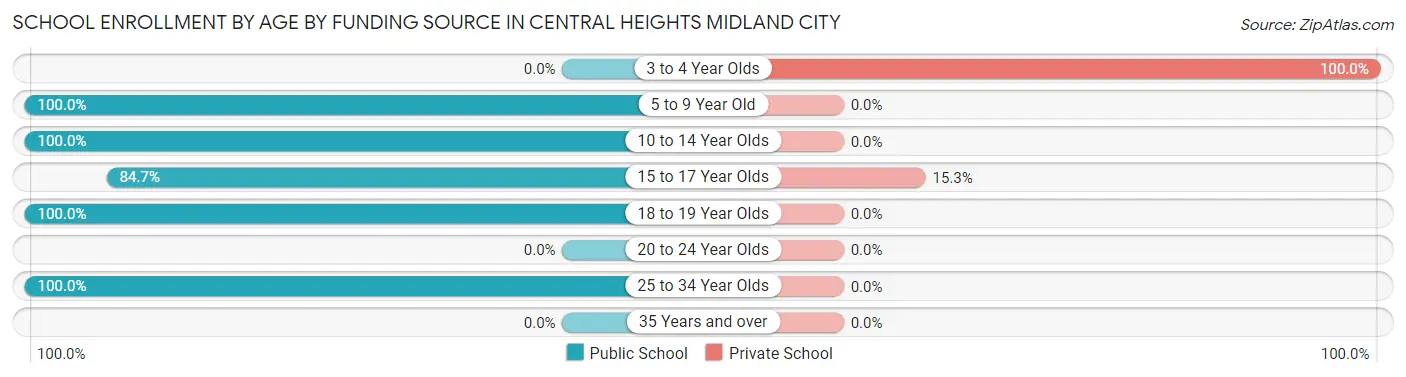
School Enrollment by Age by Funding Source in Central Heights Midland City
Out of a total of 574 students who are enrolled in schools in Central Heights Midland City, 38 (6.6%) attend a private institution, while the remaining 536 (93.4%) are enrolled in public schools. The age group of 3 to 4 year olds has the highest likelihood of being enrolled in private schools, with 9 (100.0% in the age bracket) enrolled. Conversely, the age group of 5 to 9 year old has the lowest likelihood of being enrolled in a private school, with 117 (100.0% in the age bracket) attending a public institution.
| Age Bracket | Public School | Private School |
| 3 to 4 Year Olds | 0 (0.0%) | 9 (100.0%) |
| 5 to 9 Year Old | 117 (100.0%) | 0 (0.0%) |
| 10 to 14 Year Olds | 188 (100.0%) | 0 (0.0%) |
| 15 to 17 Year Olds | 161 (84.7%) | 29 (15.3%) |
| 18 to 19 Year Olds | 55 (100.0%) | 0 (0.0%) |
| 20 to 24 Year Olds | 0 (0.0%) | 0 (0.0%) |
| 25 to 34 Year Olds | 15 (100.0%) | 0 (0.0%) |
| 35 Years and over | 0 (0.0%) | 0 (0.0%) |
| Total | 536 (93.4%) | 38 (6.6%) |
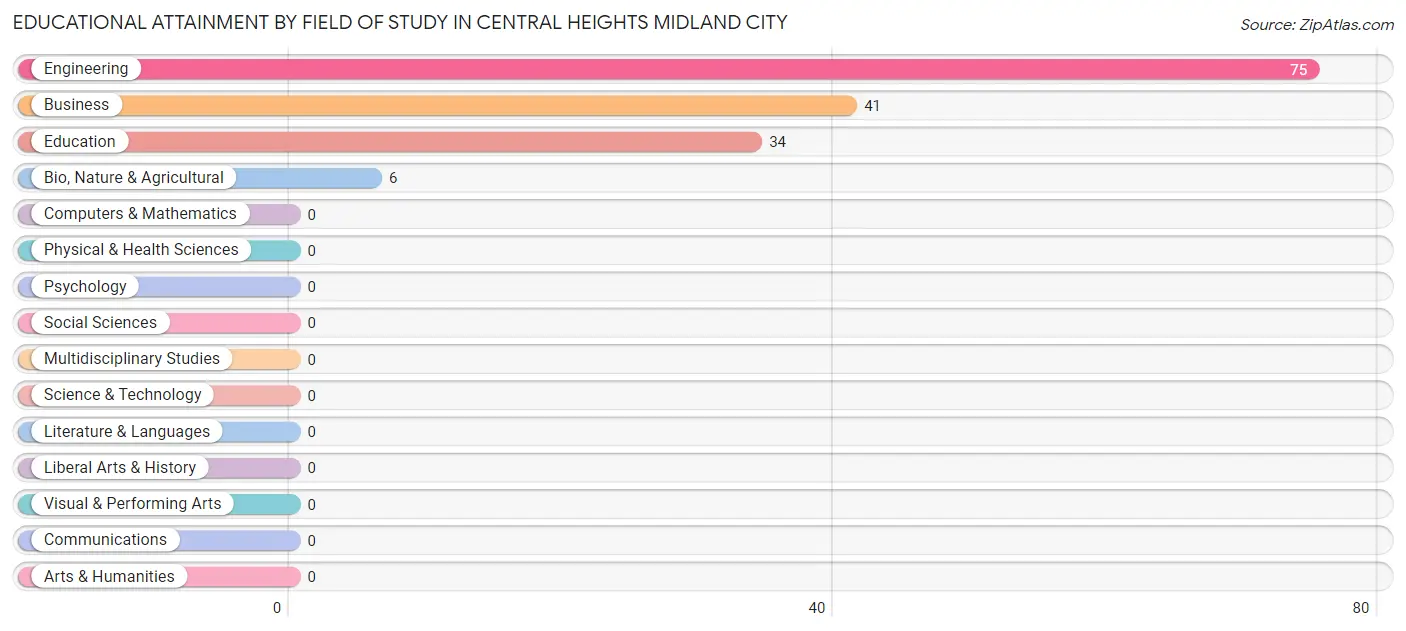
Educational Attainment by Field of Study in Central Heights Midland City
Engineering (75 | 48.1%), business (41 | 26.3%), education (34 | 21.8%), and bio, nature & agricultural (6 | 3.8%) are the most common fields of study among 156 individuals in Central Heights Midland City who have obtained a bachelor's degree or higher.
| Field of Study | # Graduates | % Graduates |
| Computers & Mathematics | 0 | 0.0% |
| Bio, Nature & Agricultural | 6 | 3.8% |
| Physical & Health Sciences | 0 | 0.0% |
| Psychology | 0 | 0.0% |
| Social Sciences | 0 | 0.0% |
| Engineering | 75 | 48.1% |
| Multidisciplinary Studies | 0 | 0.0% |
| Science & Technology | 0 | 0.0% |
| Business | 41 | 26.3% |
| Education | 34 | 21.8% |
| Literature & Languages | 0 | 0.0% |
| Liberal Arts & History | 0 | 0.0% |
| Visual & Performing Arts | 0 | 0.0% |
| Communications | 0 | 0.0% |
| Arts & Humanities | 0 | 0.0% |
| Total | 156 | 100.0% |
Transportation & Commute in Central Heights Midland City
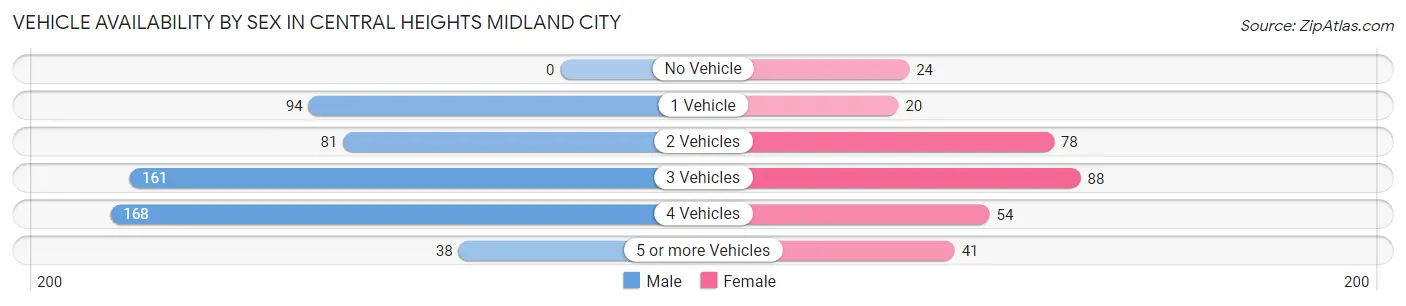
Vehicle Availability by Sex in Central Heights Midland City
The most prevalent vehicle ownership categories in Central Heights Midland City are males with 4 vehicles (168, accounting for 31.0%) and females with 4 vehicles (54, making up 55.1%).
| Vehicles Available | Male | Female |
| No Vehicle | 0 (0.0%) | 24 (7.9%) |
| 1 Vehicle | 94 (17.3%) | 20 (6.6%) |
| 2 Vehicles | 81 (14.9%) | 78 (25.6%) |
| 3 Vehicles | 161 (29.7%) | 88 (28.8%) |
| 4 Vehicles | 168 (31.0%) | 54 (17.7%) |
| 5 or more Vehicles | 38 (7.0%) | 41 (13.4%) |
| Total | 542 (100.0%) | 305 (100.0%) |
Commute Time in Central Heights Midland City
The most frequently occuring commute durations in Central Heights Midland City are 10 to 14 minutes (266 commuters, 34.2%), 30 to 34 minutes (167 commuters, 21.5%), and 5 to 9 minutes (157 commuters, 20.2%).
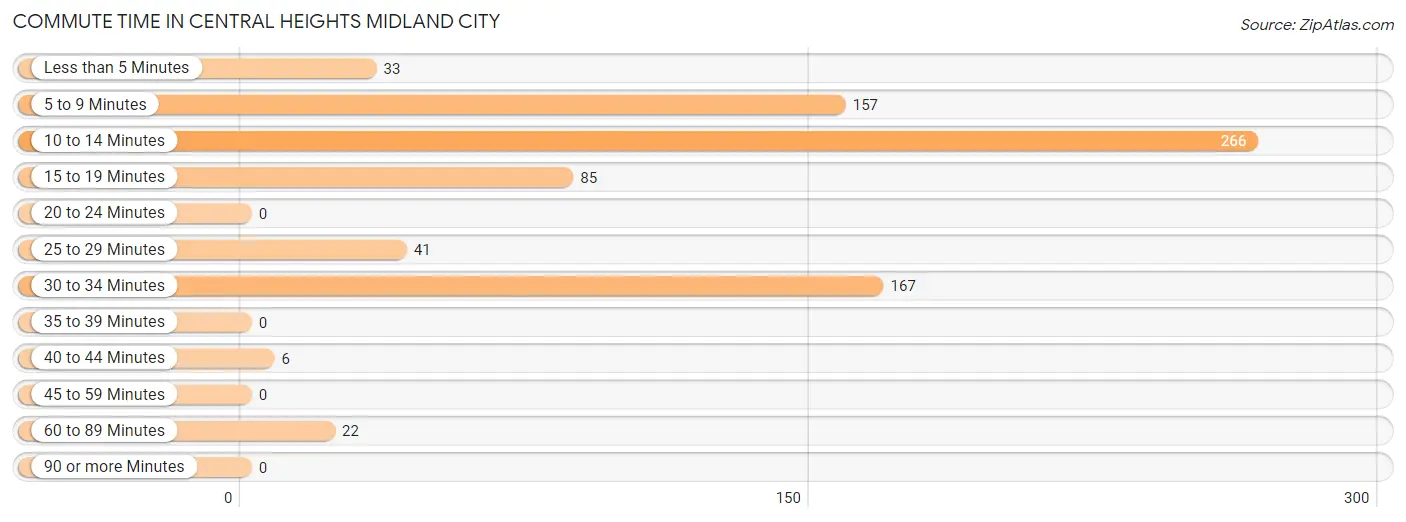
| Commute Time | # Commuters | % Commuters |
| Less than 5 Minutes | 33 | 4.3% |
| 5 to 9 Minutes | 157 | 20.2% |
| 10 to 14 Minutes | 266 | 34.2% |
| 15 to 19 Minutes | 85 | 10.9% |
| 20 to 24 Minutes | 0 | 0.0% |
| 25 to 29 Minutes | 41 | 5.3% |
| 30 to 34 Minutes | 167 | 21.5% |
| 35 to 39 Minutes | 0 | 0.0% |
| 40 to 44 Minutes | 6 | 0.8% |
| 45 to 59 Minutes | 0 | 0.0% |
| 60 to 89 Minutes | 22 | 2.8% |
| 90 or more Minutes | 0 | 0.0% |
Commute Time by Sex in Central Heights Midland City
The most common commute times in Central Heights Midland City are 5 to 9 minutes (157 commuters, 31.7%) for males and 10 to 14 minutes (192 commuters, 68.3%) for females.
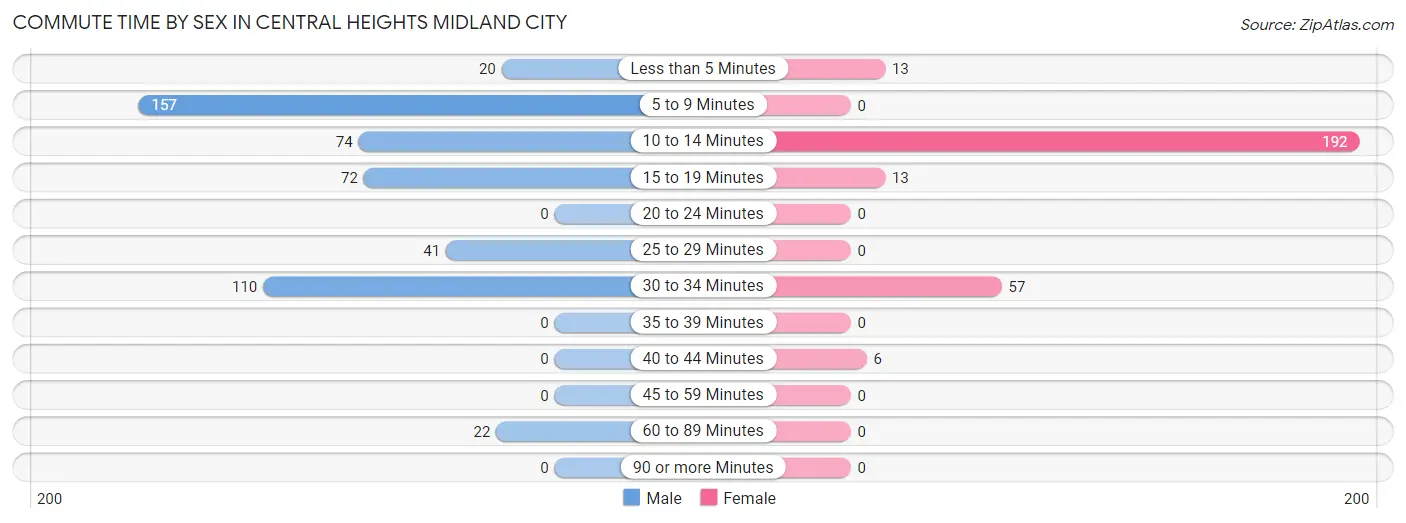
| Commute Time | Male | Female |
| Less than 5 Minutes | 20 (4.0%) | 13 (4.6%) |
| 5 to 9 Minutes | 157 (31.7%) | 0 (0.0%) |
| 10 to 14 Minutes | 74 (14.9%) | 192 (68.3%) |
| 15 to 19 Minutes | 72 (14.5%) | 13 (4.6%) |
| 20 to 24 Minutes | 0 (0.0%) | 0 (0.0%) |
| 25 to 29 Minutes | 41 (8.3%) | 0 (0.0%) |
| 30 to 34 Minutes | 110 (22.2%) | 57 (20.3%) |
| 35 to 39 Minutes | 0 (0.0%) | 0 (0.0%) |
| 40 to 44 Minutes | 0 (0.0%) | 6 (2.1%) |
| 45 to 59 Minutes | 0 (0.0%) | 0 (0.0%) |
| 60 to 89 Minutes | 22 (4.4%) | 0 (0.0%) |
| 90 or more Minutes | 0 (0.0%) | 0 (0.0%) |
Time of Departure to Work by Sex in Central Heights Midland City
The most frequent times of departure to work in Central Heights Midland City are 8:30 AM to 8:59 AM (92, 18.5%) for males and 5:00 AM to 5:29 AM (113, 40.2%) for females.
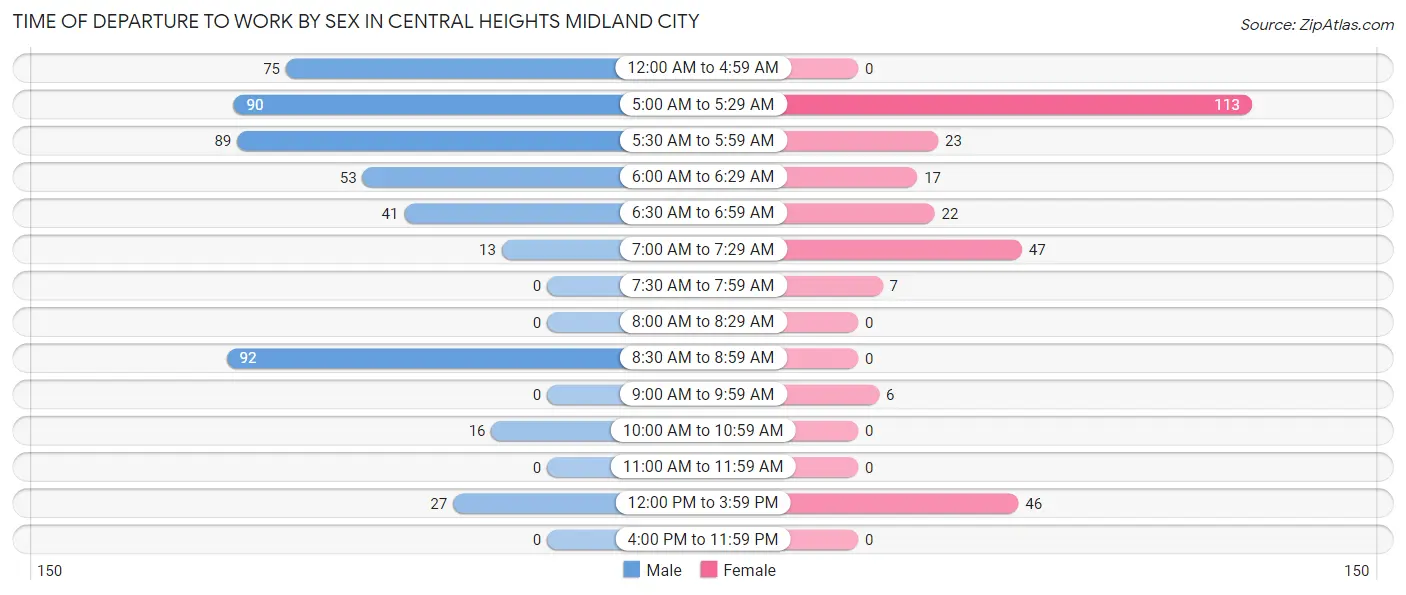
| Time of Departure | Male | Female |
| 12:00 AM to 4:59 AM | 75 (15.1%) | 0 (0.0%) |
| 5:00 AM to 5:29 AM | 90 (18.1%) | 113 (40.2%) |
| 5:30 AM to 5:59 AM | 89 (17.9%) | 23 (8.2%) |
| 6:00 AM to 6:29 AM | 53 (10.7%) | 17 (6.0%) |
| 6:30 AM to 6:59 AM | 41 (8.3%) | 22 (7.8%) |
| 7:00 AM to 7:29 AM | 13 (2.6%) | 47 (16.7%) |
| 7:30 AM to 7:59 AM | 0 (0.0%) | 7 (2.5%) |
| 8:00 AM to 8:29 AM | 0 (0.0%) | 0 (0.0%) |
| 8:30 AM to 8:59 AM | 92 (18.5%) | 0 (0.0%) |
| 9:00 AM to 9:59 AM | 0 (0.0%) | 6 (2.1%) |
| 10:00 AM to 10:59 AM | 16 (3.2%) | 0 (0.0%) |
| 11:00 AM to 11:59 AM | 0 (0.0%) | 0 (0.0%) |
| 12:00 PM to 3:59 PM | 27 (5.4%) | 46 (16.4%) |
| 4:00 PM to 11:59 PM | 0 (0.0%) | 0 (0.0%) |
| Total | 496 (100.0%) | 281 (100.0%) |
Housing Occupancy in Central Heights Midland City
Occupancy by Ownership in Central Heights Midland City
Of the total 939 dwellings in Central Heights Midland City, owner-occupied units account for 708 (75.4%), while renter-occupied units make up 231 (24.6%).
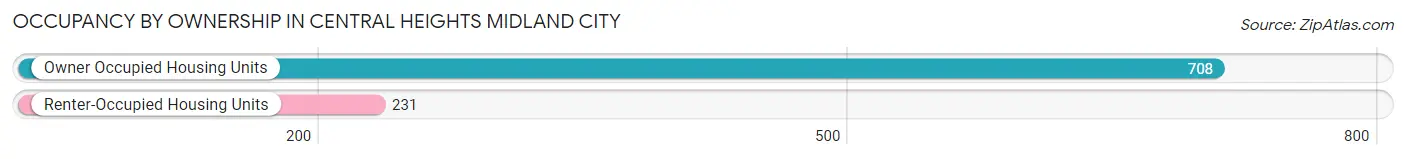
| Occupancy | # Housing Units | % Housing Units |
| Owner Occupied Housing Units | 708 | 75.4% |
| Renter-Occupied Housing Units | 231 | 24.6% |
| Total Occupied Housing Units | 939 | 100.0% |
Occupancy by Household Size in Central Heights Midland City
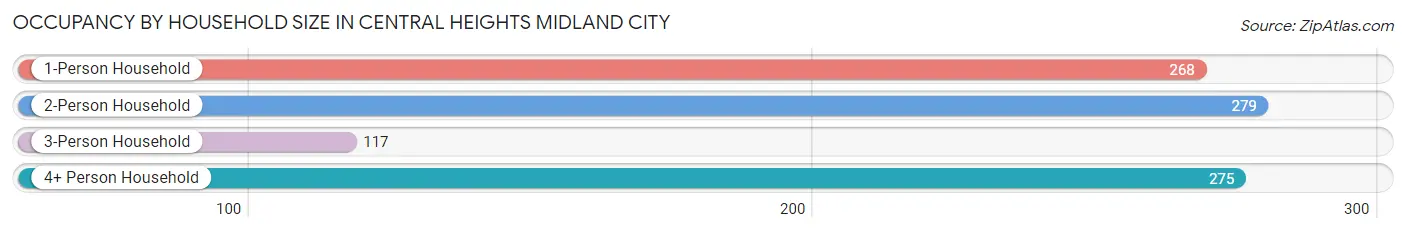
| Household Size | # Housing Units | % Housing Units |
| 1-Person Household | 268 | 28.5% |
| 2-Person Household | 279 | 29.7% |
| 3-Person Household | 117 | 12.5% |
| 4+ Person Household | 275 | 29.3% |
| Total Housing Units | 939 | 100.0% |
Occupancy by Ownership by Household Size in Central Heights Midland City
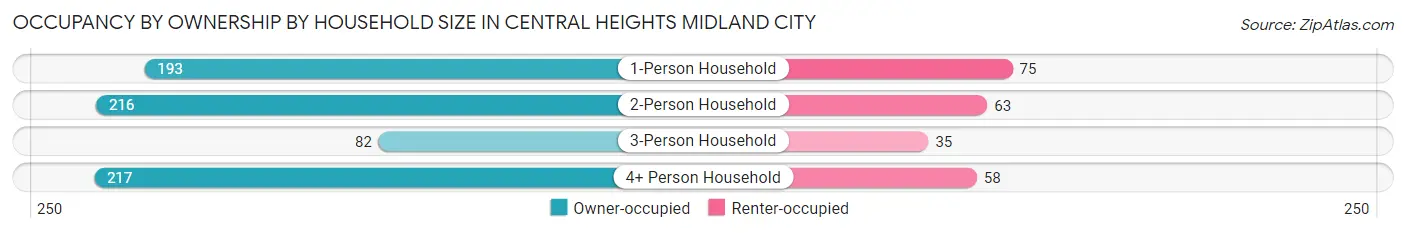
| Household Size | Owner-occupied | Renter-occupied |
| 1-Person Household | 193 (72.0%) | 75 (28.0%) |
| 2-Person Household | 216 (77.4%) | 63 (22.6%) |
| 3-Person Household | 82 (70.1%) | 35 (29.9%) |
| 4+ Person Household | 217 (78.9%) | 58 (21.1%) |
| Total Housing Units | 708 (75.4%) | 231 (24.6%) |
Occupancy by Educational Attainment in Central Heights Midland City
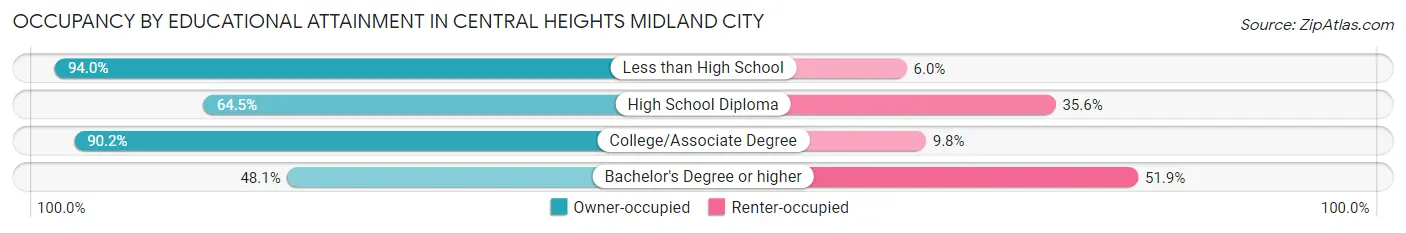
| Household Size | Owner-occupied | Renter-occupied |
| Less than High School | 109 (94.0%) | 7 (6.0%) |
| High School Diploma | 194 (64.4%) | 107 (35.5%) |
| College/Associate Degree | 330 (90.2%) | 36 (9.8%) |
| Bachelor's Degree or higher | 75 (48.1%) | 81 (51.9%) |
Occupancy by Age of Householder in Central Heights Midland City
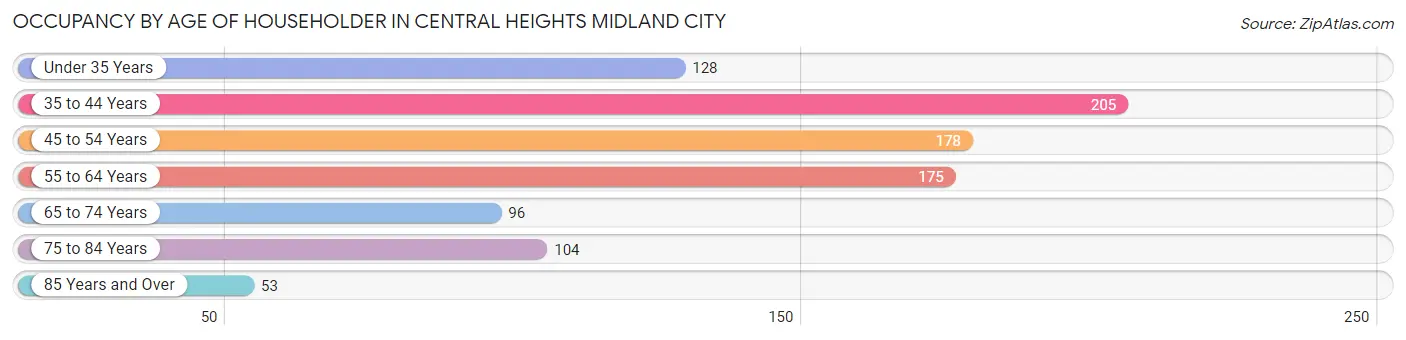
| Age Bracket | # Households | % Households |
| Under 35 Years | 128 | 13.6% |
| 35 to 44 Years | 205 | 21.8% |
| 45 to 54 Years | 178 | 19.0% |
| 55 to 64 Years | 175 | 18.6% |
| 65 to 74 Years | 96 | 10.2% |
| 75 to 84 Years | 104 | 11.1% |
| 85 Years and Over | 53 | 5.6% |
| Total | 939 | 100.0% |
Housing Finances in Central Heights Midland City
Median Income by Occupancy in Central Heights Midland City
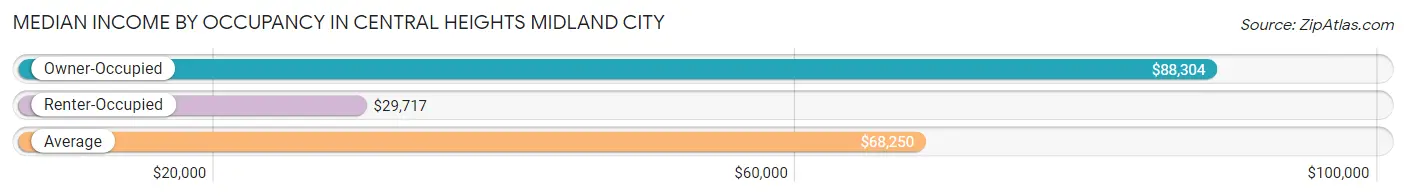
| Occupancy Type | # Households | Median Income |
| Owner-Occupied | 708 (75.4%) | $88,304 |
| Renter-Occupied | 231 (24.6%) | $29,717 |
| Average | 939 (100.0%) | $68,250 |
Occupancy by Householder Income Bracket in Central Heights Midland City
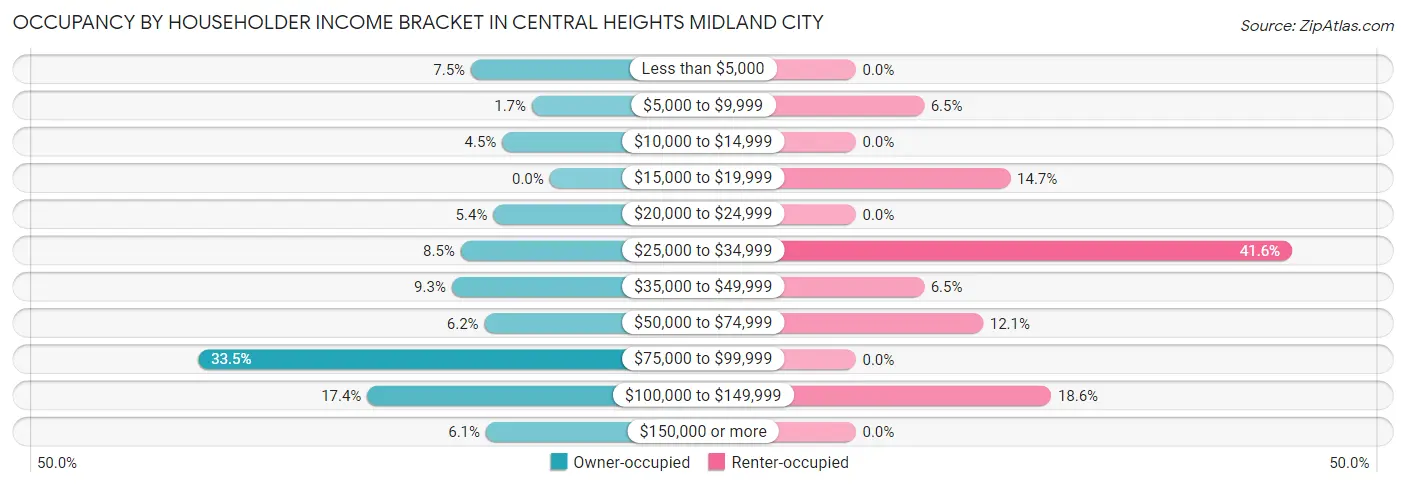
| Income Bracket | Owner-occupied | Renter-occupied |
| Less than $5,000 | 53 (7.5%) | 0 (0.0%) |
| $5,000 to $9,999 | 12 (1.7%) | 15 (6.5%) |
| $10,000 to $14,999 | 32 (4.5%) | 0 (0.0%) |
| $15,000 to $19,999 | 0 (0.0%) | 34 (14.7%) |
| $20,000 to $24,999 | 38 (5.4%) | 0 (0.0%) |
| $25,000 to $34,999 | 60 (8.5%) | 96 (41.6%) |
| $35,000 to $49,999 | 66 (9.3%) | 15 (6.5%) |
| $50,000 to $74,999 | 44 (6.2%) | 28 (12.1%) |
| $75,000 to $99,999 | 237 (33.5%) | 0 (0.0%) |
| $100,000 to $149,999 | 123 (17.4%) | 43 (18.6%) |
| $150,000 or more | 43 (6.1%) | 0 (0.0%) |
| Total | 708 (100.0%) | 231 (100.0%) |
Monthly Housing Cost Tiers in Central Heights Midland City
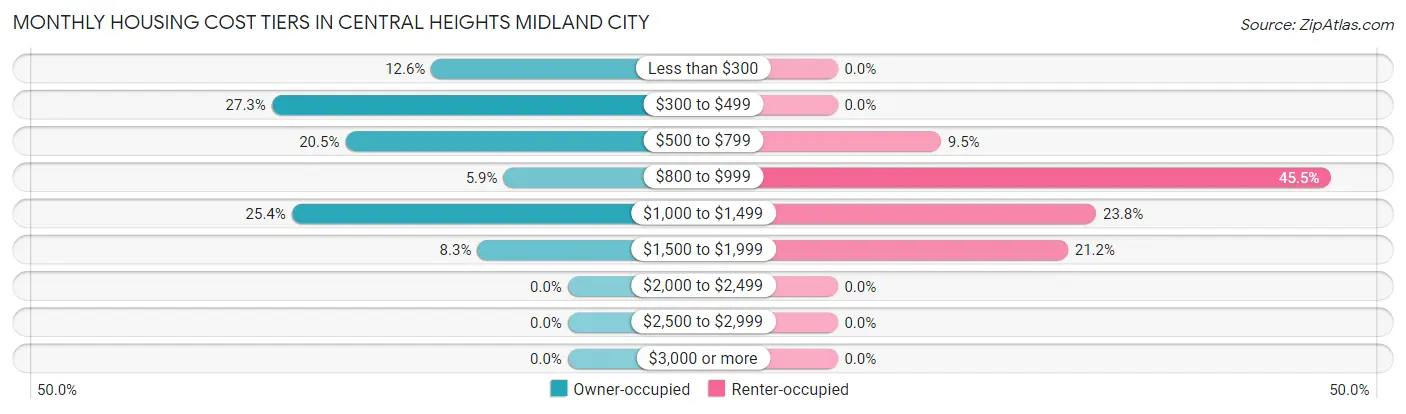
| Monthly Cost | Owner-occupied | Renter-occupied |
| Less than $300 | 89 (12.6%) | 0 (0.0%) |
| $300 to $499 | 193 (27.3%) | 0 (0.0%) |
| $500 to $799 | 145 (20.5%) | 22 (9.5%) |
| $800 to $999 | 42 (5.9%) | 105 (45.5%) |
| $1,000 to $1,499 | 180 (25.4%) | 55 (23.8%) |
| $1,500 to $1,999 | 59 (8.3%) | 49 (21.2%) |
| $2,000 to $2,499 | 0 (0.0%) | 0 (0.0%) |
| $2,500 to $2,999 | 0 (0.0%) | 0 (0.0%) |
| $3,000 or more | 0 (0.0%) | 0 (0.0%) |
| Total | 708 (100.0%) | 231 (100.0%) |
Physical Housing Characteristics in Central Heights Midland City
Housing Structures in Central Heights Midland City
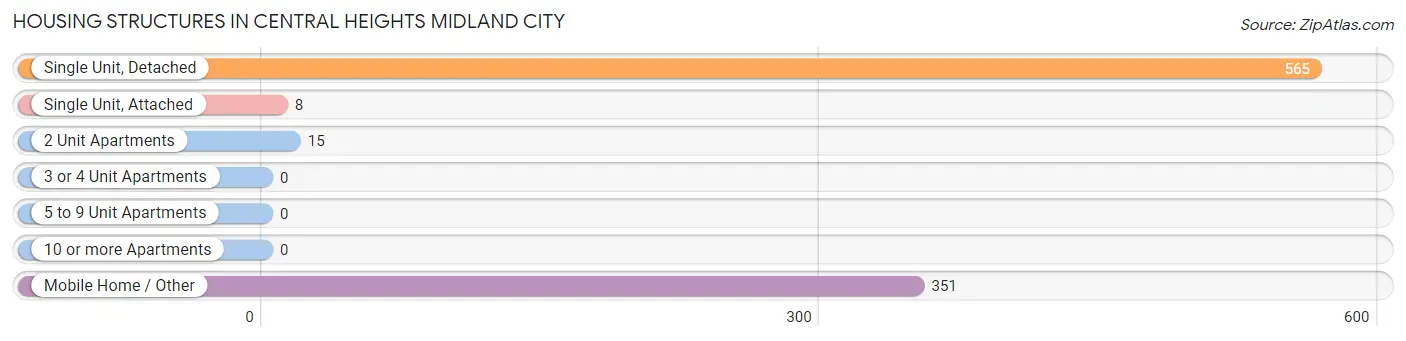
| Structure Type | # Housing Units | % Housing Units |
| Single Unit, Detached | 565 | 60.2% |
| Single Unit, Attached | 8 | 0.9% |
| 2 Unit Apartments | 15 | 1.6% |
| 3 or 4 Unit Apartments | 0 | 0.0% |
| 5 to 9 Unit Apartments | 0 | 0.0% |
| 10 or more Apartments | 0 | 0.0% |
| Mobile Home / Other | 351 | 37.4% |
| Total | 939 | 100.0% |
Housing Structures by Occupancy in Central Heights Midland City
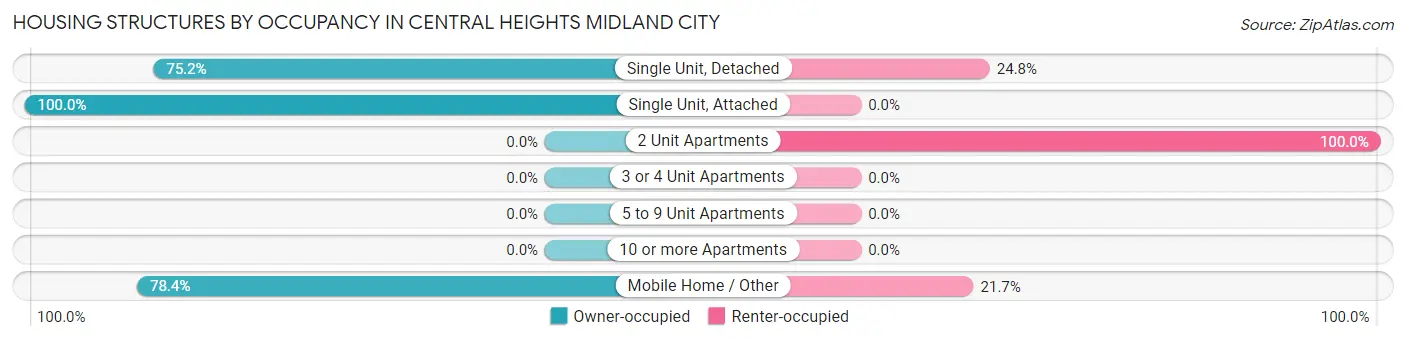
| Structure Type | Owner-occupied | Renter-occupied |
| Single Unit, Detached | 425 (75.2%) | 140 (24.8%) |
| Single Unit, Attached | 8 (100.0%) | 0 (0.0%) |
| 2 Unit Apartments | 0 (0.0%) | 15 (100.0%) |
| 3 or 4 Unit Apartments | 0 (0.0%) | 0 (0.0%) |
| 5 to 9 Unit Apartments | 0 (0.0%) | 0 (0.0%) |
| 10 or more Apartments | 0 (0.0%) | 0 (0.0%) |
| Mobile Home / Other | 275 (78.3%) | 76 (21.6%) |
| Total | 708 (75.4%) | 231 (24.6%) |
Housing Structures by Number of Rooms in Central Heights Midland City
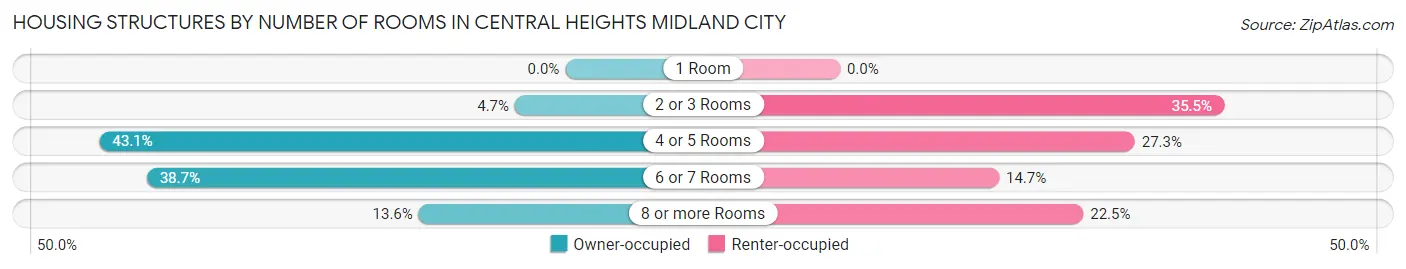
| Number of Rooms | Owner-occupied | Renter-occupied |
| 1 Room | 0 (0.0%) | 0 (0.0%) |
| 2 or 3 Rooms | 33 (4.7%) | 82 (35.5%) |
| 4 or 5 Rooms | 305 (43.1%) | 63 (27.3%) |
| 6 or 7 Rooms | 274 (38.7%) | 34 (14.7%) |
| 8 or more Rooms | 96 (13.6%) | 52 (22.5%) |
| Total | 708 (100.0%) | 231 (100.0%) |
Housing Structure by Heating Type in Central Heights Midland City
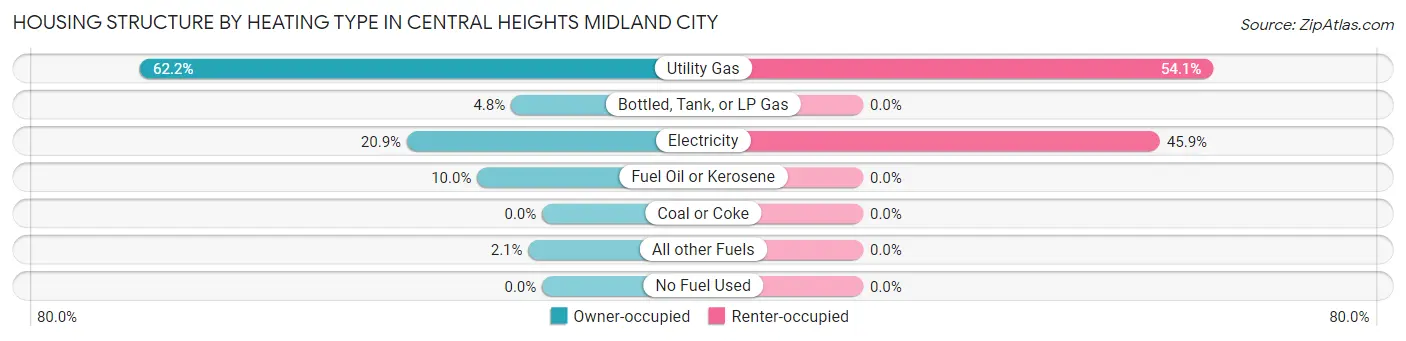
| Heating Type | Owner-occupied | Renter-occupied |
| Utility Gas | 440 (62.2%) | 125 (54.1%) |
| Bottled, Tank, or LP Gas | 34 (4.8%) | 0 (0.0%) |
| Electricity | 148 (20.9%) | 106 (45.9%) |
| Fuel Oil or Kerosene | 71 (10.0%) | 0 (0.0%) |
| Coal or Coke | 0 (0.0%) | 0 (0.0%) |
| All other Fuels | 15 (2.1%) | 0 (0.0%) |
| No Fuel Used | 0 (0.0%) | 0 (0.0%) |
| Total | 708 (100.0%) | 231 (100.0%) |
Household Vehicle Usage in Central Heights Midland City
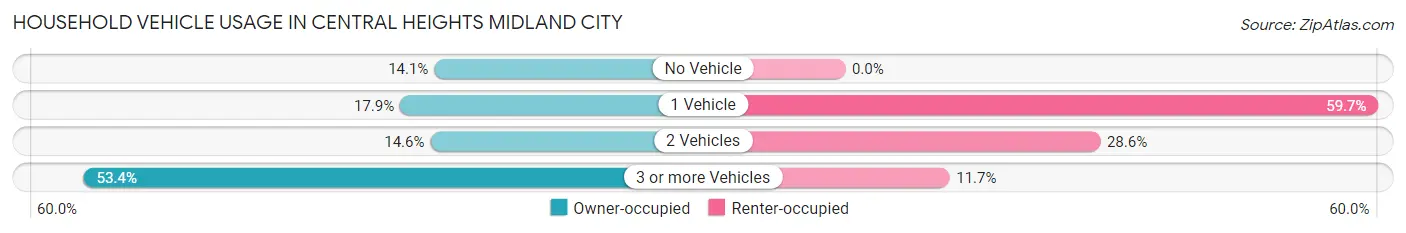
| Vehicles per Household | Owner-occupied | Renter-occupied |
| No Vehicle | 100 (14.1%) | 0 (0.0%) |
| 1 Vehicle | 127 (17.9%) | 138 (59.7%) |
| 2 Vehicles | 103 (14.5%) | 66 (28.6%) |
| 3 or more Vehicles | 378 (53.4%) | 27 (11.7%) |
| Total | 708 (100.0%) | 231 (100.0%) |
Real Estate & Mortgages in Central Heights Midland City
Real Estate and Mortgage Overview in Central Heights Midland City
| Characteristic | Without Mortgage | With Mortgage |
| Housing Units | 421 | 287 |
| Median Property Value | $87,500 | $115,100 |
| Median Household Income | $46,521 | $0 |
| Monthly Housing Costs | $438 | $0 |
| Real Estate Taxes | $1,153 | $0 |
Property Value by Mortgage Status in Central Heights Midland City
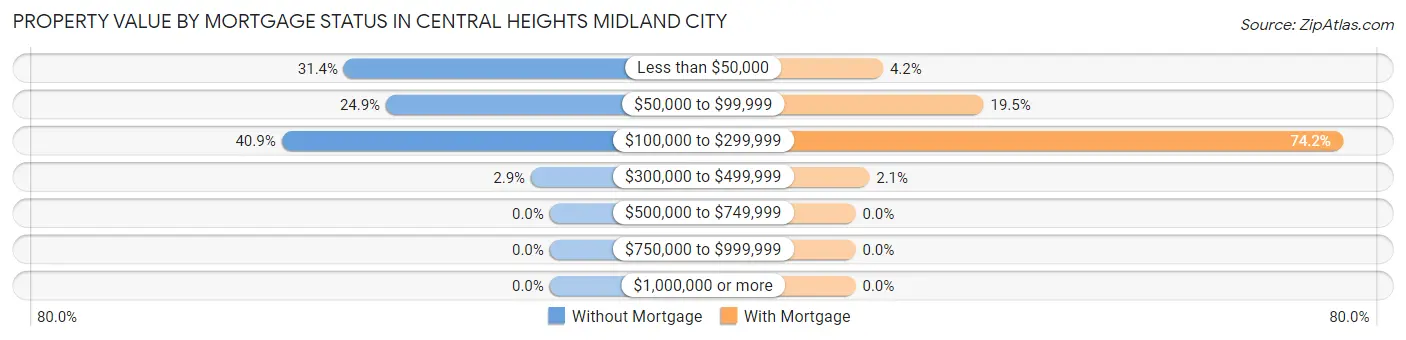
| Property Value | Without Mortgage | With Mortgage |
| Less than $50,000 | 132 (31.4%) | 12 (4.2%) |
| $50,000 to $99,999 | 105 (24.9%) | 56 (19.5%) |
| $100,000 to $299,999 | 172 (40.9%) | 213 (74.2%) |
| $300,000 to $499,999 | 12 (2.9%) | 6 (2.1%) |
| $500,000 to $749,999 | 0 (0.0%) | 0 (0.0%) |
| $750,000 to $999,999 | 0 (0.0%) | 0 (0.0%) |
| $1,000,000 or more | 0 (0.0%) | 0 (0.0%) |
| Total | 421 (100.0%) | 287 (100.0%) |
Household Income by Mortgage Status in Central Heights Midland City
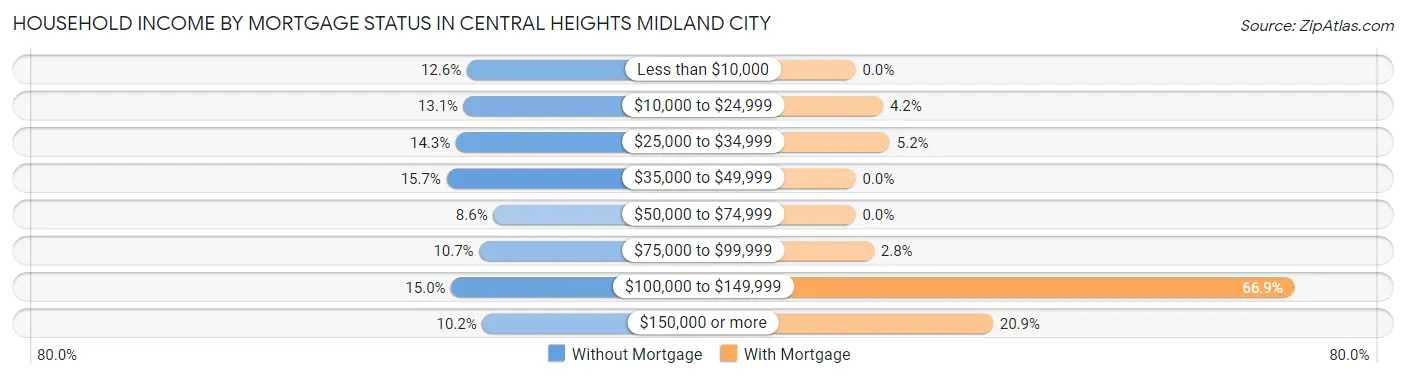
| Household Income | Without Mortgage | With Mortgage |
| Less than $10,000 | 53 (12.6%) | 0 (0.0%) |
| $10,000 to $24,999 | 55 (13.1%) | 12 (4.2%) |
| $25,000 to $34,999 | 60 (14.2%) | 15 (5.2%) |
| $35,000 to $49,999 | 66 (15.7%) | 0 (0.0%) |
| $50,000 to $74,999 | 36 (8.6%) | 0 (0.0%) |
| $75,000 to $99,999 | 45 (10.7%) | 8 (2.8%) |
| $100,000 to $149,999 | 63 (15.0%) | 192 (66.9%) |
| $150,000 or more | 43 (10.2%) | 60 (20.9%) |
| Total | 421 (100.0%) | 287 (100.0%) |
Property Value to Household Income Ratio in Central Heights Midland City
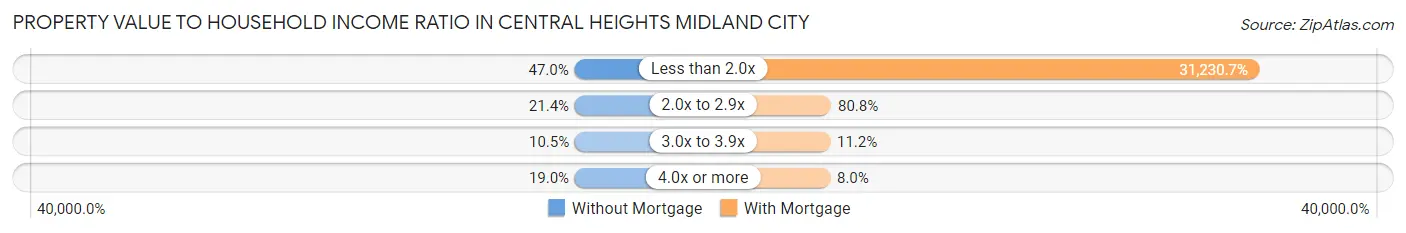
| Value-to-Income Ratio | Without Mortgage | With Mortgage |
| Less than 2.0x | 198 (47.0%) | 89,632 (31,230.7%) |
| 2.0x to 2.9x | 90 (21.4%) | 232 (80.8%) |
| 3.0x to 3.9x | 44 (10.4%) | 32 (11.2%) |
| 4.0x or more | 80 (19.0%) | 23 (8.0%) |
| Total | 421 (100.0%) | 287 (100.0%) |
Real Estate Taxes by Mortgage Status in Central Heights Midland City
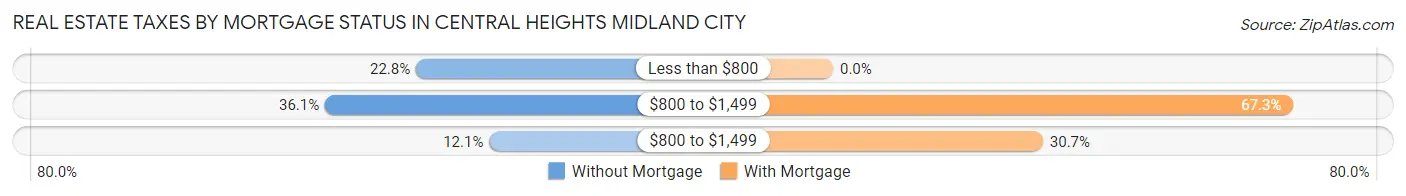
| Property Taxes | Without Mortgage | With Mortgage |
| Less than $800 | 96 (22.8%) | 0 (0.0%) |
| $800 to $1,499 | 152 (36.1%) | 193 (67.2%) |
| $800 to $1,499 | 51 (12.1%) | 88 (30.7%) |
| Total | 421 (100.0%) | 287 (100.0%) |
Health & Disability in Central Heights Midland City
Health Insurance Coverage by Age in Central Heights Midland City
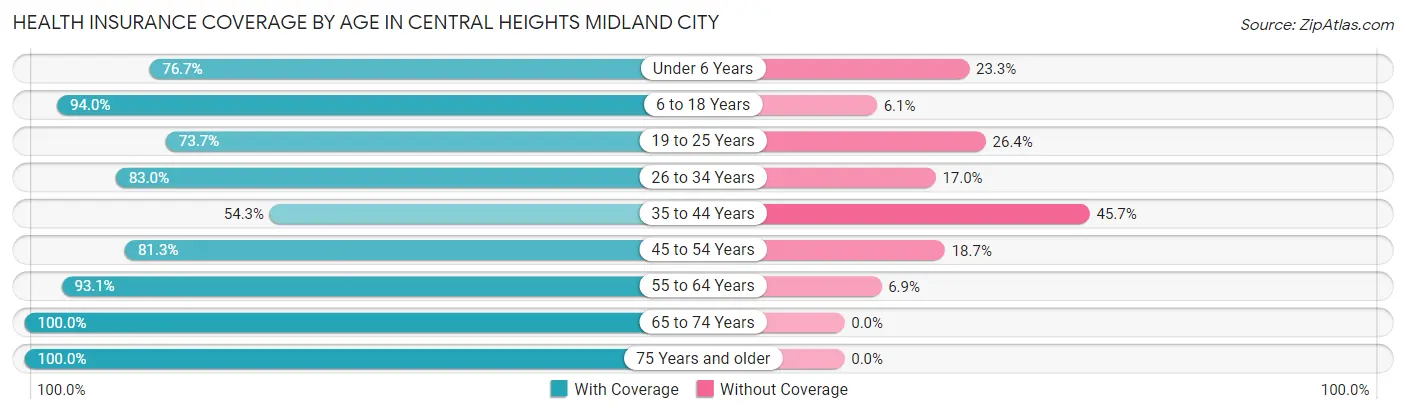
| Age Bracket | With Coverage | Without Coverage |
| Under 6 Years | 165 (76.7%) | 50 (23.3%) |
| 6 to 18 Years | 435 (94.0%) | 28 (6.0%) |
| 19 to 25 Years | 204 (73.7%) | 73 (26.4%) |
| 26 to 34 Years | 83 (83.0%) | 17 (17.0%) |
| 35 to 44 Years | 223 (54.3%) | 188 (45.7%) |
| 45 to 54 Years | 256 (81.3%) | 59 (18.7%) |
| 55 to 64 Years | 257 (93.1%) | 19 (6.9%) |
| 65 to 74 Years | 150 (100.0%) | 0 (0.0%) |
| 75 Years and older | 173 (100.0%) | 0 (0.0%) |
| Total | 1,946 (81.8%) | 434 (18.2%) |
Health Insurance Coverage by Citizenship Status in Central Heights Midland City
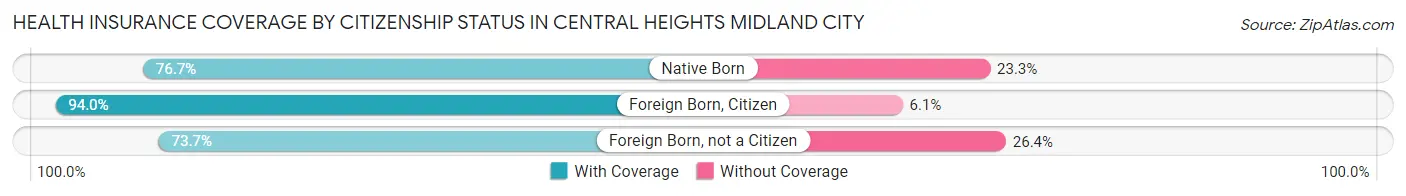
| Citizenship Status | With Coverage | Without Coverage |
| Native Born | 165 (76.7%) | 50 (23.3%) |
| Foreign Born, Citizen | 435 (94.0%) | 28 (6.0%) |
| Foreign Born, not a Citizen | 204 (73.7%) | 73 (26.4%) |
Health Insurance Coverage by Household Income in Central Heights Midland City
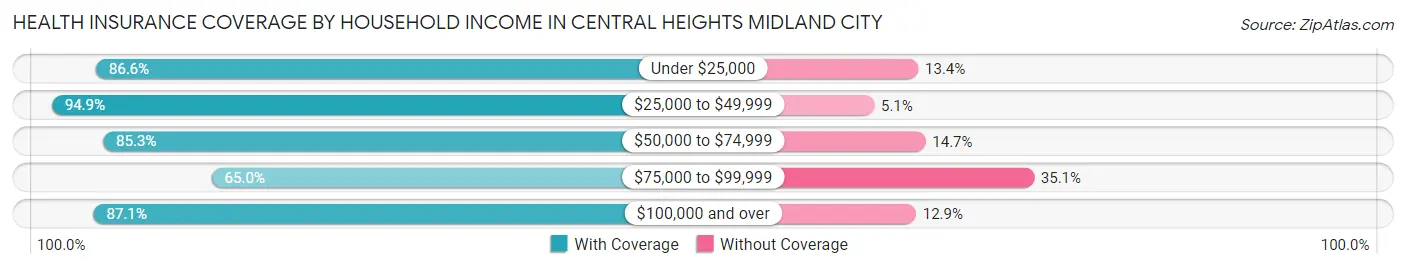
| Household Income | With Coverage | Without Coverage |
| Under $25,000 | 266 (86.6%) | 41 (13.4%) |
| $25,000 to $49,999 | 502 (94.9%) | 27 (5.1%) |
| $50,000 to $74,999 | 168 (85.3%) | 29 (14.7%) |
| $75,000 to $99,999 | 478 (64.9%) | 258 (35.0%) |
| $100,000 and over | 532 (87.1%) | 79 (12.9%) |
Public vs Private Health Insurance Coverage by Age in Central Heights Midland City
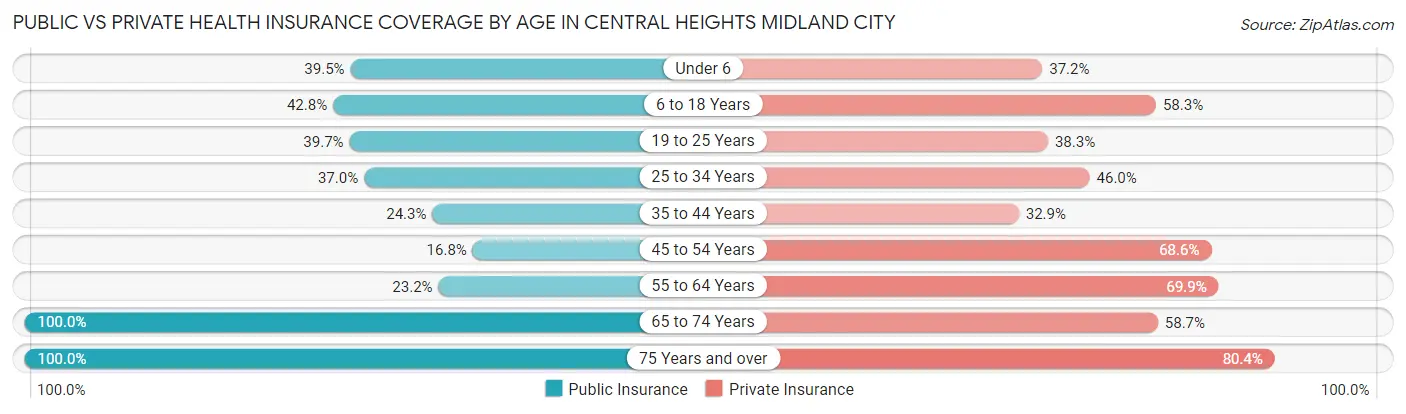
| Age Bracket | Public Insurance | Private Insurance |
| Under 6 | 85 (39.5%) | 80 (37.2%) |
| 6 to 18 Years | 198 (42.8%) | 270 (58.3%) |
| 19 to 25 Years | 110 (39.7%) | 106 (38.3%) |
| 25 to 34 Years | 37 (37.0%) | 46 (46.0%) |
| 35 to 44 Years | 100 (24.3%) | 135 (32.9%) |
| 45 to 54 Years | 53 (16.8%) | 216 (68.6%) |
| 55 to 64 Years | 64 (23.2%) | 193 (69.9%) |
| 65 to 74 Years | 150 (100.0%) | 88 (58.7%) |
| 75 Years and over | 173 (100.0%) | 139 (80.3%) |
| Total | 970 (40.8%) | 1,273 (53.5%) |
Disability Status by Sex by Age in Central Heights Midland City
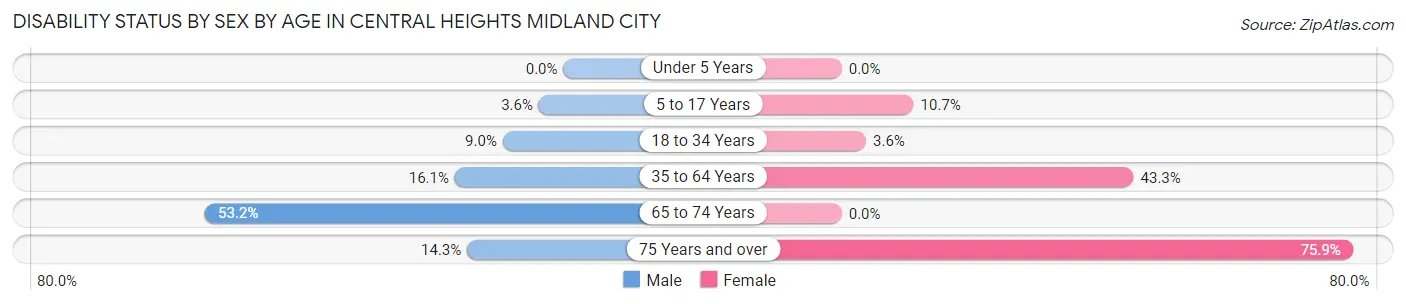
| Age Bracket | Male | Female |
| Under 5 Years | 0 (0.0%) | 0 (0.0%) |
| 5 to 17 Years | 9 (3.6%) | 27 (10.7%) |
| 18 to 34 Years | 19 (9.0%) | 6 (3.6%) |
| 35 to 64 Years | 83 (16.1%) | 211 (43.3%) |
| 65 to 74 Years | 50 (53.2%) | 0 (0.0%) |
| 75 Years and over | 4 (14.3%) | 110 (75.9%) |
Disability Class by Sex by Age in Central Heights Midland City
Disability Class: Hearing Difficulty
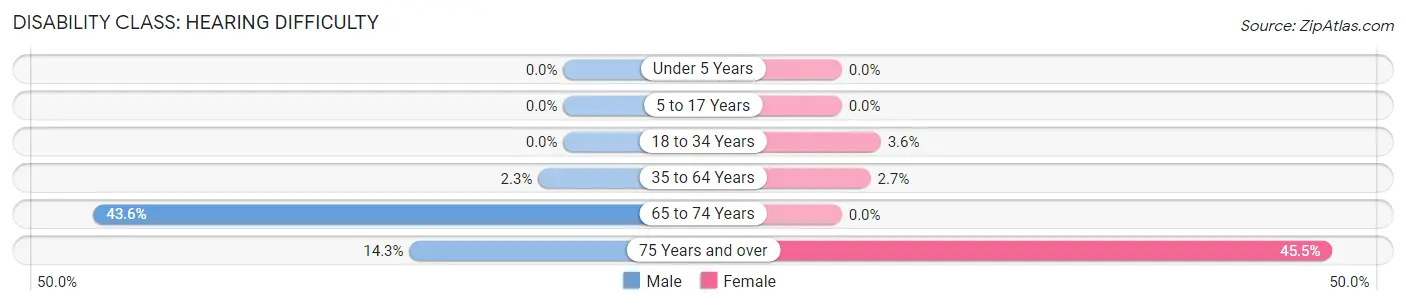
| Age Bracket | Male | Female |
| Under 5 Years | 0 (0.0%) | 0 (0.0%) |
| 5 to 17 Years | 0 (0.0%) | 0 (0.0%) |
| 18 to 34 Years | 0 (0.0%) | 6 (3.6%) |
| 35 to 64 Years | 12 (2.3%) | 13 (2.7%) |
| 65 to 74 Years | 41 (43.6%) | 0 (0.0%) |
| 75 Years and over | 4 (14.3%) | 66 (45.5%) |
Disability Class: Vision Difficulty
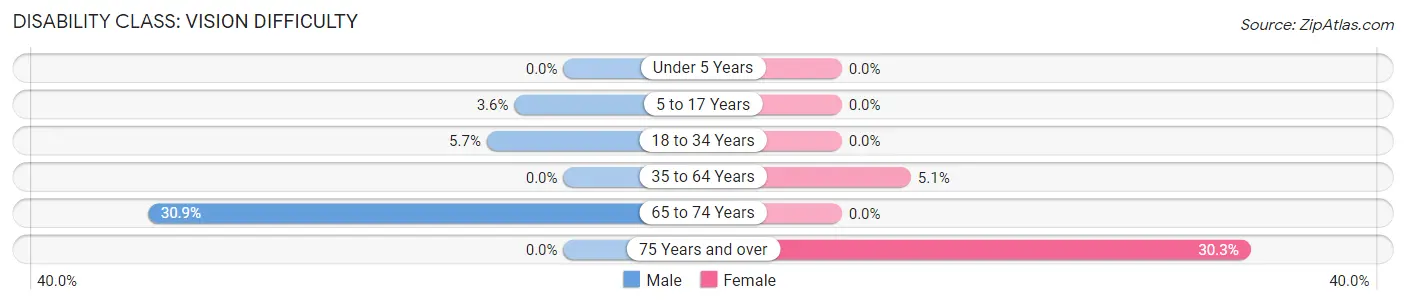
| Age Bracket | Male | Female |
| Under 5 Years | 0 (0.0%) | 0 (0.0%) |
| 5 to 17 Years | 9 (3.6%) | 0 (0.0%) |
| 18 to 34 Years | 12 (5.7%) | 0 (0.0%) |
| 35 to 64 Years | 0 (0.0%) | 25 (5.1%) |
| 65 to 74 Years | 29 (30.8%) | 0 (0.0%) |
| 75 Years and over | 0 (0.0%) | 44 (30.3%) |
Disability Class: Cognitive Difficulty
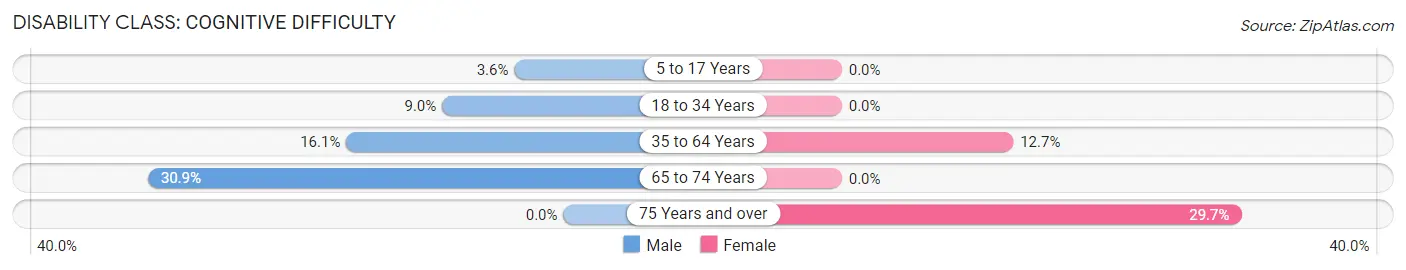
| Age Bracket | Male | Female |
| 5 to 17 Years | 9 (3.6%) | 0 (0.0%) |
| 18 to 34 Years | 19 (9.0%) | 0 (0.0%) |
| 35 to 64 Years | 83 (16.1%) | 62 (12.7%) |
| 65 to 74 Years | 29 (30.8%) | 0 (0.0%) |
| 75 Years and over | 0 (0.0%) | 43 (29.7%) |
Disability Class: Ambulatory Difficulty
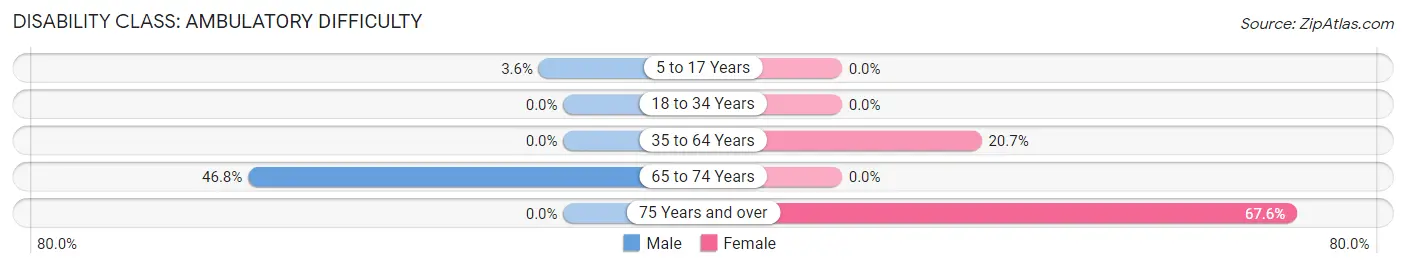
| Age Bracket | Male | Female |
| 5 to 17 Years | 9 (3.6%) | 0 (0.0%) |
| 18 to 34 Years | 0 (0.0%) | 0 (0.0%) |
| 35 to 64 Years | 0 (0.0%) | 101 (20.7%) |
| 65 to 74 Years | 44 (46.8%) | 0 (0.0%) |
| 75 Years and over | 0 (0.0%) | 98 (67.6%) |
Disability Class: Self-Care Difficulty
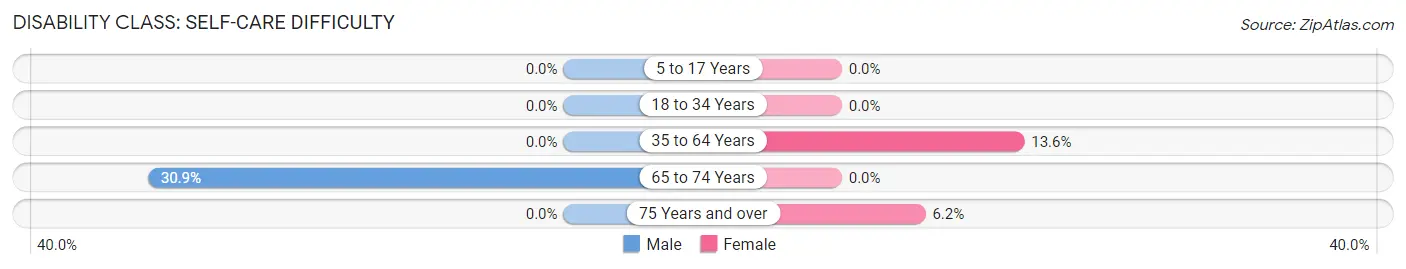
| Age Bracket | Male | Female |
| 5 to 17 Years | 0 (0.0%) | 0 (0.0%) |
| 18 to 34 Years | 0 (0.0%) | 0 (0.0%) |
| 35 to 64 Years | 0 (0.0%) | 66 (13.6%) |
| 65 to 74 Years | 29 (30.8%) | 0 (0.0%) |
| 75 Years and over | 0 (0.0%) | 9 (6.2%) |
Technology Access in Central Heights Midland City
Computing Device Access in Central Heights Midland City
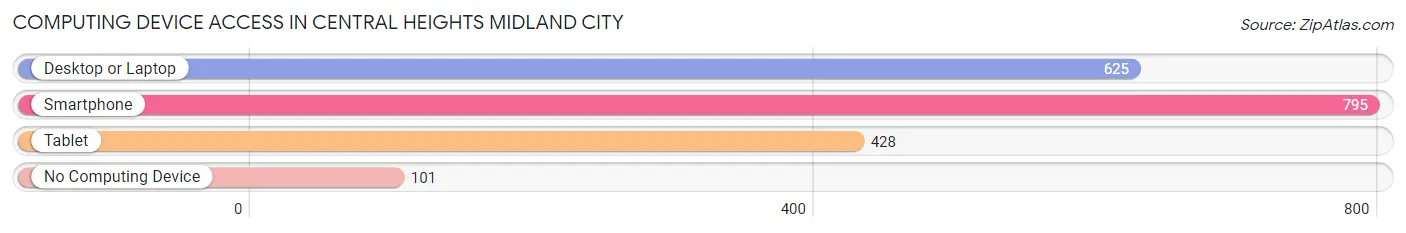
| Device Type | # Households | % Households |
| Desktop or Laptop | 625 | 66.6% |
| Smartphone | 795 | 84.7% |
| Tablet | 428 | 45.6% |
| No Computing Device | 101 | 10.8% |
| Total | 939 | 100.0% |
Internet Access in Central Heights Midland City
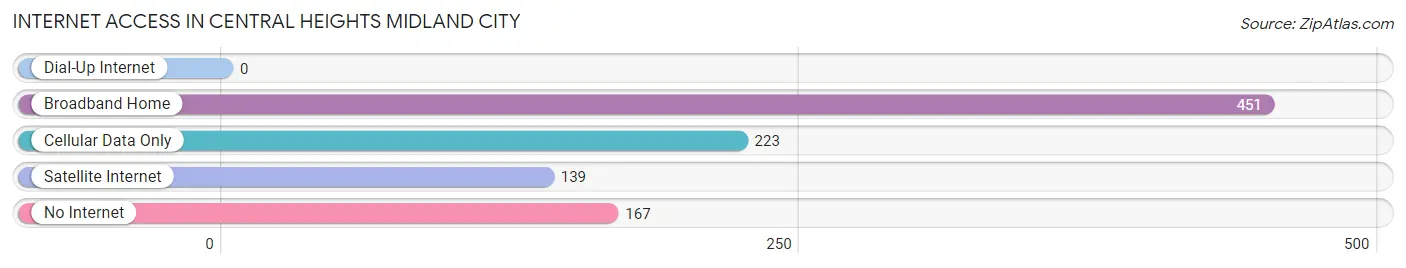
| Internet Type | # Households | % Households |
| Dial-Up Internet | 0 | 0.0% |
| Broadband Home | 451 | 48.0% |
| Cellular Data Only | 223 | 23.7% |
| Satellite Internet | 139 | 14.8% |
| No Internet | 167 | 17.8% |
| Total | 939 | 100.0% |
Central Heights Midland City Summary
History
Central Heights Midland City, Arizona is a small town located in the northern part of the state. It is situated in the White Mountains, and is surrounded by the Apache-Sitgreaves National Forest. The town was founded in the late 1800s by settlers who were looking for a place to settle and raise their families. The town was originally called Central Heights, but was later changed to Midland City in the early 1900s.
The town was originally a farming community, with many of the settlers growing crops such as corn, wheat, and hay. The town also had a few small businesses, such as a general store, a blacksmith, and a post office. As the town grew, more businesses opened, including a bank, a hotel, and a movie theater.
In the early 1900s, the town was also home to a large copper mine. The mine was owned by the Phelps Dodge Corporation, and it provided jobs for many of the town’s residents. The mine closed in the 1950s, but the town still has a few remnants of its mining past, including a few old buildings and a few abandoned mine shafts.
Geography
Central Heights Midland City is located in the northern part of Arizona, in the White Mountains. The town is situated at an elevation of 6,000 feet, and is surrounded by the Apache-Sitgreaves National Forest. The town is located about 30 miles from the city of Show Low, and about 60 miles from the city of Flagstaff.
The town is located in a valley, and is surrounded by mountains on all sides. The town is also located near several lakes, including the Black River Lake, the White River Lake, and the San Carlos Lake. The town is also located near several rivers, including the San Francisco River, the Gila River, and the Salt River.
Economy
The economy of Central Heights Midland City is largely based on tourism. The town is a popular destination for hikers, campers, and other outdoor enthusiasts. The town also has several restaurants, hotels, and other businesses that cater to tourists.
The town also has a few small businesses, such as a general store, a hardware store, and a few other small businesses. The town also has a few small manufacturing businesses, such as a furniture factory and a woodworking shop.
Demographics
As of the 2010 census, the population of Central Heights Midland City was 1,845. The town has a population that is mostly white (94.3%), with a small percentage of Native Americans (2.2%), Hispanics (1.7%), and African Americans (1.2%). The median household income in the town is $37,000, and the median home value is $125,000.
Conclusion
Central Heights Midland City, Arizona is a small town located in the northern part of the state. It is situated in the White Mountains, and is surrounded by the Apache-Sitgreaves National Forest. The town was founded in the late 1800s by settlers who were looking for a place to settle and raise their families. The town’s economy is largely based on tourism, and it is a popular destination for hikers, campers, and other outdoor enthusiasts. The town has a population that is mostly white, with a small percentage of Native Americans, Hispanics, and African Americans. The median household income in the town is $37,000, and the median home value is $125,000.
Common Questions
What is Per Capita Income in Central Heights Midland City?
Per Capita income in Central Heights Midland City is $25,821.
What is the Median Family Income in Central Heights Midland City?
Median Family Income in Central Heights Midland City is $89,507.
What is the Median Household income in Central Heights Midland City?
Median Household Income in Central Heights Midland City is $68,250.
What is Income or Wage Gap in Central Heights Midland City?
Income or Wage Gap in Central Heights Midland City is 58.7%.
Women in Central Heights Midland City earn 41.3 cents for every dollar earned by a man.
What is Family Income Deficit in Central Heights Midland City?
Family Income Deficit in Central Heights Midland City is $5,869.
Families that are below poverty line in Central Heights Midland City earn $5,869 less on average than the poverty threshold level.
What is Inequality or Gini Index in Central Heights Midland City?
Inequality or Gini Index in Central Heights Midland City is 0.39.
What is the Total Population of Central Heights Midland City?
Total Population of Central Heights Midland City is 2,380.
What is the Total Male Population of Central Heights Midland City?
Total Male Population of Central Heights Midland City is 1,183.
What is the Total Female Population of Central Heights Midland City?
Total Female Population of Central Heights Midland City is 1,197.
What is the Ratio of Males per 100 Females in Central Heights Midland City?
There are 98.83 Males per 100 Females in Central Heights Midland City.
What is the Ratio of Females per 100 Males in Central Heights Midland City?
There are 101.18 Females per 100 Males in Central Heights Midland City.
What is the Median Population Age in Central Heights Midland City?
Median Population Age in Central Heights Midland City is 41.3 Years.
What is the Average Family Size in Central Heights Midland City
Average Family Size in Central Heights Midland City is 3.1 People.
What is the Average Household Size in Central Heights Midland City
Average Household Size in Central Heights Midland City is 2.5 People.
How Large is the Labor Force in Central Heights Midland City?
There are 947 People in the Labor Forcein in Central Heights Midland City.
What is the Percentage of People in the Labor Force in Central Heights Midland City?
50.2% of People are in the Labor Force in Central Heights Midland City.
What is the Unemployment Rate in Central Heights Midland City?
Unemployment Rate in Central Heights Midland City is 10.6%.